Introduction
In recent years, the incidence and mortality rate of
melanoma have considerably increased (1), whereby the need to discover new
therapeutic strategies has become increasingly urgent (2–6).
E-cadherin has been shown to play a key role in cell adhesion,
growth and differentiation (7),
frequently overexpressed in melanoma. Several studies have revealed
that E-cadherin is expressed in the normal epidermis and lost in
invasive and metastatic melanoma cells (8). Depletion of functional E-cadherin
induces the escape of melanocytes from keratinocyte-mediated growth
and phenotypic control, thus allowing invasion and migration
(9).
Although reduced expression of E-cadherin is known
to be caused by promoter hypermethylation in several types of
tumors (10), such an epigenetic
event has been only partially investigated in melanoma. Moreover,
the existence of a relationship between epigenetic changes,
E-cadherin expression and clinicopathological features has not yet
been evaluated in melanoma.
In the present study, we aimed to investigate
whether E-cadherin expression is epigenetically regulated in a
cohort of patients affected by cutaneous, mucosal and uveal
melanoma and is associated with specific clinicopathological
parameters. Findings from the present study revealed a strong
association between E-cadherin promoter methylation and
several significant pathological characteristics, whereby they may
provide insights into the biology of this cancer.
Materials and methods
Cell cultures
Normal human epidermal melanocyte (NHEM) cells were
grown in Melanocyte Medium plus Bullet kit (both from Lonza,
Walkersville, MD, USA). Cutaneous (G361, WM-115 and WM-266-4),
mucosal (MMel-1 and MMel-2) and uveal (OCM-1, OCM-3 and 92.1)
melanoma cells were grown as previously described (11,12).
Treatment with the DNA demethylating
agent 5-aza-dC
Cells were treated with 5-aza-2′-deoxycytidine
(5-aza-dC) (Sigma Chemical Co.) by addition of fresh medium
containing 5-aza-dC (10 µmol/l) every day for three
consecutive days.
Tissue specimens
Formalin-fixed paraffin-embedded (FFPE) tissue
sections of 130 cutaneous, 82 mucosal and 64 uveal melanomas, and
65 normal skin specimens were collected from the Department of
Human Pathology, University of Messina, Messina, Italy. The data
regarding patients are shown in Table
I. The investigation adhered to the Declaration of Helsinki and
was approved by the Ethics Committee of the University Hospital of
Messina. Informed consent was provided by the patients.
 | Table IPatient characteristics. |
Table I
Patient characteristics.
|
Characteristics | Cutaneous melanoma
(n=130)n (%) | Mucosal melanoma
(n=82) n (%) | Uveal melanoma
(n=64) n (%) |
|---|
| Males | 78 (60) | 40 (48.8) | 31 (48.4) |
| Females | 52 (40) | 42 (51.2) | 33 (51.6) |
| AJCC stage |
| I | 34 (26.2) | 23 (28.0) | 14 (21.9) |
| II | 38 (29.2) | 19 (23.2) | 14 (21.9) |
| III | 30 (23.1) | 24 (29.3) | 18 (28.1) |
| IV | 28 (21.5) | 16 (19.5) | 18 (28.1) |
| Site |
| Extremities | 39 (30) | | |
| Trunk | 26 (20) | | |
| Head/neck | 65 (50) | | |
| Vulvovaginal | | 28 (34.1) | |
| Anorectal | | 22 (26.9) | |
| Head/neck | | 32 (39.0) | |
| Choroid | | | 34 (53.1) |
| Ciliary body | | | 17 (26.6) |
| Iris | | | 13 (20.3) |
| Ulceration |
| Absent | 83 (63.8) | 34 (41.5) | 64 (100) |
| Present | 47 (36.2) | 48 (58.5) | 0 (0) |
| Breslow thickness
(mm) |
| ≤1.00 | 41 (31.5) | 23 (28.0) | 24 (37.5) |
| 1.01–4.00 | 42 (32.4) | 25 (30.5) | 19 (29.7) |
| >4.01 | 47 (36.1) | 34 (41.5) | 21 (32.8) |
| Mitotic index (per
10 HPFs) |
| 1–5 mitoses | 29 (22.3) | 19 (23.2) | 12 (18.8) |
| 6–10 mitoses | 43 (33.1) | 15 (18.3) | 18 (28.1) |
| 11–15 mitoses | 19 (14.6) | 18 (21.9) | 15 (23.4) |
| 16–20 mitoses | 39 (30.0) | 30 (36.6) | 19 (29.7) |
| Metastatic
lesions |
| Present | 64 (49.2) | 47 (57.3) | 37 (57.8) |
| Absent | 66 (50.8) | 35 (42.7) | 27 (42.2) |
Determination of mitotic index
Mitotic index was determined by counting the number
of mitoses in 10 consecutive non-overlapping high power fields
(HPFs) with commencement in an area of high mitotic activity using
a magnification of ×400.
DNA and RNA extraction
Total RNA and DNA extraction from cells was
performed using TRIzol reagent (Invitrogen), and Recover All Total
Nucleic Acid Isolation kit (Ambion Inc., Austin, TX, USA) was used
for extractin from FFPE samples.
Reverse transcription and qPCR
Total RNA was reverse-transcribed with IMProm-II™
Reverse Transcriptase kit (Promega, Milan, Italy). qPCR was
performed using the ABI Prism 7500 Real-Time PCR system (Applied
Biosystems, Milan, Italy). Primers and probes were previously
described (11). The mRNA levels of
E-cadherin were normalized to endogenous β-actin (Applied
Biosystems). The control was represented by NHEM cells (described
in the paragraph 'Cell culture'). Their expression was considered
as00201.
Bisulfite modification and MSP
Bisulfite-modified DNA obtained using the EpiTect
Bisulfite kit (Qiagen, Milan, Italy) was amplified using the
following primers as previously reported (13): methylated DNA-specific primers:
forward primer, 5′-TTAGGTTAGAGGGTTATCGCGT-3′ and reverse primer,
5′-TAACTAAAAATTCACCTACCGAC-3′ (115 bp; genomic position relative to
TSS, -176/-61); unmethylated DNA-specific primers: forward primer,
5′-TAATTTTAGGTT AGAGGGTTATTGT-3′ and reverse primer, 5′-CACAACCAA
TCAACAACACA-3′ (97 bp; genomic position relative to TSS, -181/-84).
PCR products were separated by 2% agarose gel containing ethidium
bromide.
Bisulfite genomic sequencing
Bisulfite-treated DNA was amplified by PCR with
primers that were specific for modified DNA but did not contain any
CpG sites in their sequence. The primers were: S1 (TTT AGT AAT TTT
AGG TTA GAG GGT T, upstream, nt 836–861; GeneBank accession no.
L34545) and S2 (CTA ATT AAC TAA AAA TTC ACC TAC C, downstream,
sequence position nt 965–940) (14). The PCR conditions were 94°C for 2
min; 35 cycles of 94°C for 20 sec, 48°C for 20 sec and 72°C for 30
sec; and a final extension at 72°C for 5 min. The PCR product was
extracted from the gel with the QIAquick Gel Extraction kit
(Qiagen). The purified DNA samples were sequenced with the CEQ DTCS
Quick Start kit, and with an automated DNA sequencer (Beckman
Coulter CEQ 2000 analysis system) (both from Beckman Coulter,
S.p.A.).
Quantification of methylation levels
A single cytosine signal at the corresponding CpG
site was considered 100% methylation, a single thymine signal was
considered no methylation, and overlapping cytosine plus thymine
signals were considered partial methylation. In the latter
condition, the percentage of methylation was expressed as the ratio
of the peak values of the cytosine to cytosine plus thymine
signals.
Transient transfections
For transient knockdown of DNMT1,
DNMT3a and DNMT3b, cells were transfected with
specific targeting small interfering RNA (siRNA) or non-targeting
control siRNA (Invitrogen, Milan, Italy) at a final concentration
of 100 nM 24 h after plating using siPORT Lipid Transfection
Agent (Ambion, Milan, Italy).
Invasion assay
The anti-invasive activity of 5-aza-dC was assessed
using the Cultrex® BME Cell Invasion assay (Trevigen,
Gaithersburg, MD, USA).
Statistical analysis
The Pearson's correlation test was used to assess
the association of E-cadherin expression with promoter methylation.
Differences in E-cadherin expression levels and clinical
characteristics were evaluated by χ2 test between
patient subgroups. Kaplan-Meier method was used in the evaluation
of the overall and disease-free survival time. The log-rank test
was used in comparing the differences between the periods of
survival among the examined patients. A p-value of <0.05 was
considered to indicate a statistically significant result.
Results
E-cadherin expression correlates with
promoter methylation in cutaneous, uveal and mucosal melanoma
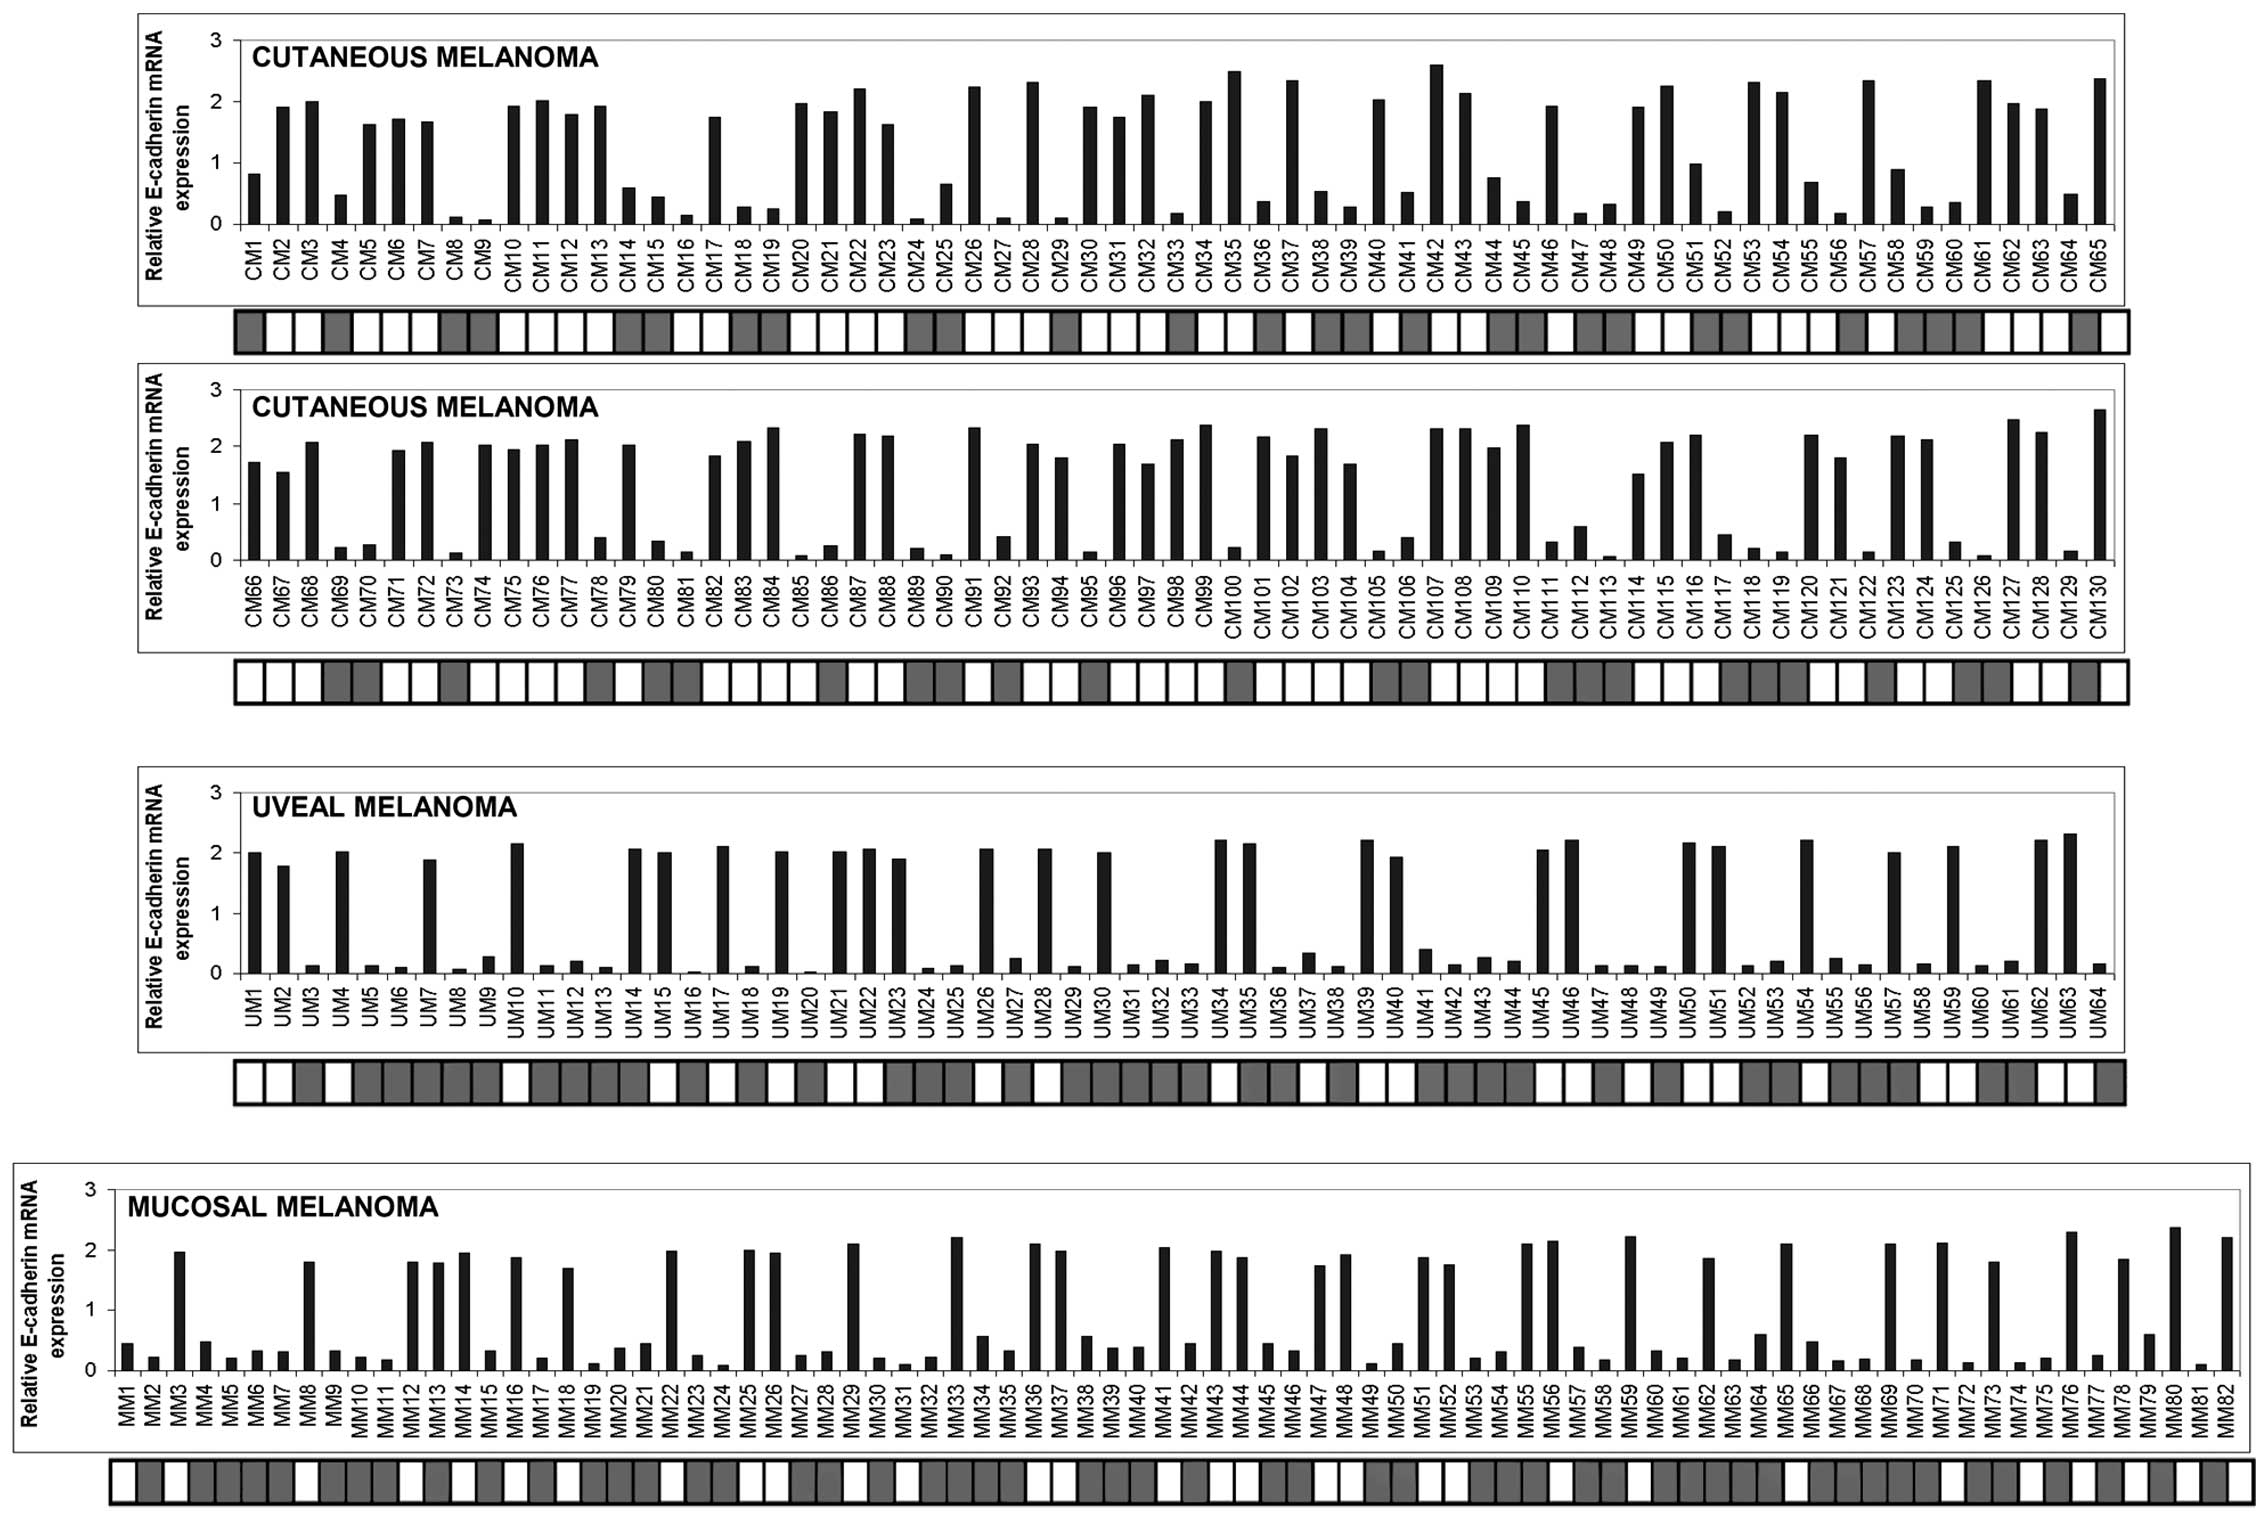
E-cadherin mRNA values were firstly measured in 65
normal skin samples from healthy donors and in NHEM cells in order
to determine the cut-off point for abnormal E-cadherin expression.
E-cadherin levels (as defined by the ratio between the values
measured in skin samples over those of NHEM cells) ranged between
1.52 and 2.1 (mean, 1.84±0.133). Values equal or below 1.44
(determined as the mean minus 3 SD) were considered to represent
under-expression of E-cadherin. As shown in Fig. 1, a strong reduction or loss of
expression of E-cadherin was detected in 55/130 cutaneous (42.3%),
36/64 uveal (56.2%) and 49/82 mucosal (59.7%) melanoma samples. In
order to investigate whether promoter hypermethylation correlated
with E-cadherin expression, we performed MSP analysis in the
series of melanoma specimens examined. Of the 55 cutaneous
melanomas down-expressing E-cadherin, 51 samples were
hypermethylated (92.7%) and 4 samples were unmethylated (7.3%). All
of the 75 cutaneous melanoma sections which expressed amounts of
E-cadherin mRNA above the cut-off point were unmethylated. Of the
36 uveal melanoma samples exhibiting levels of mRNA under the
cut-off point, 33 (91.7%) were methylated and 3 (8.3%) were
unmethylated, whereas only 6 out of 28 (21.4%) specimens exhibiting
consistent amounts of E-cadherin expression were methylated. Among
the 49 mucosal melanomas that expressed lower mRNA levels of
E-cadherin, 46 specimens (93.9%) exhibited promoter methylation and
3 specimens (6.1%) were unmethylated. Six out of 33 (18.2%) mucosal
melanoma samples with high levels of E-cadherin were found to be
methylated while the rest were unmethylated. Pearson correlation
analysis revealed that E-cadherin mRNA levels were inversely
correlated with promoter methylation (for cutaneous melanoma,
correlation coefficient, −0.899, p<0.001; for uveal melanoma,
correlation coefficient, −0.729, p<0.001; for mucosal melanoma,
correlation coefficient, −0.754, p<0.001).
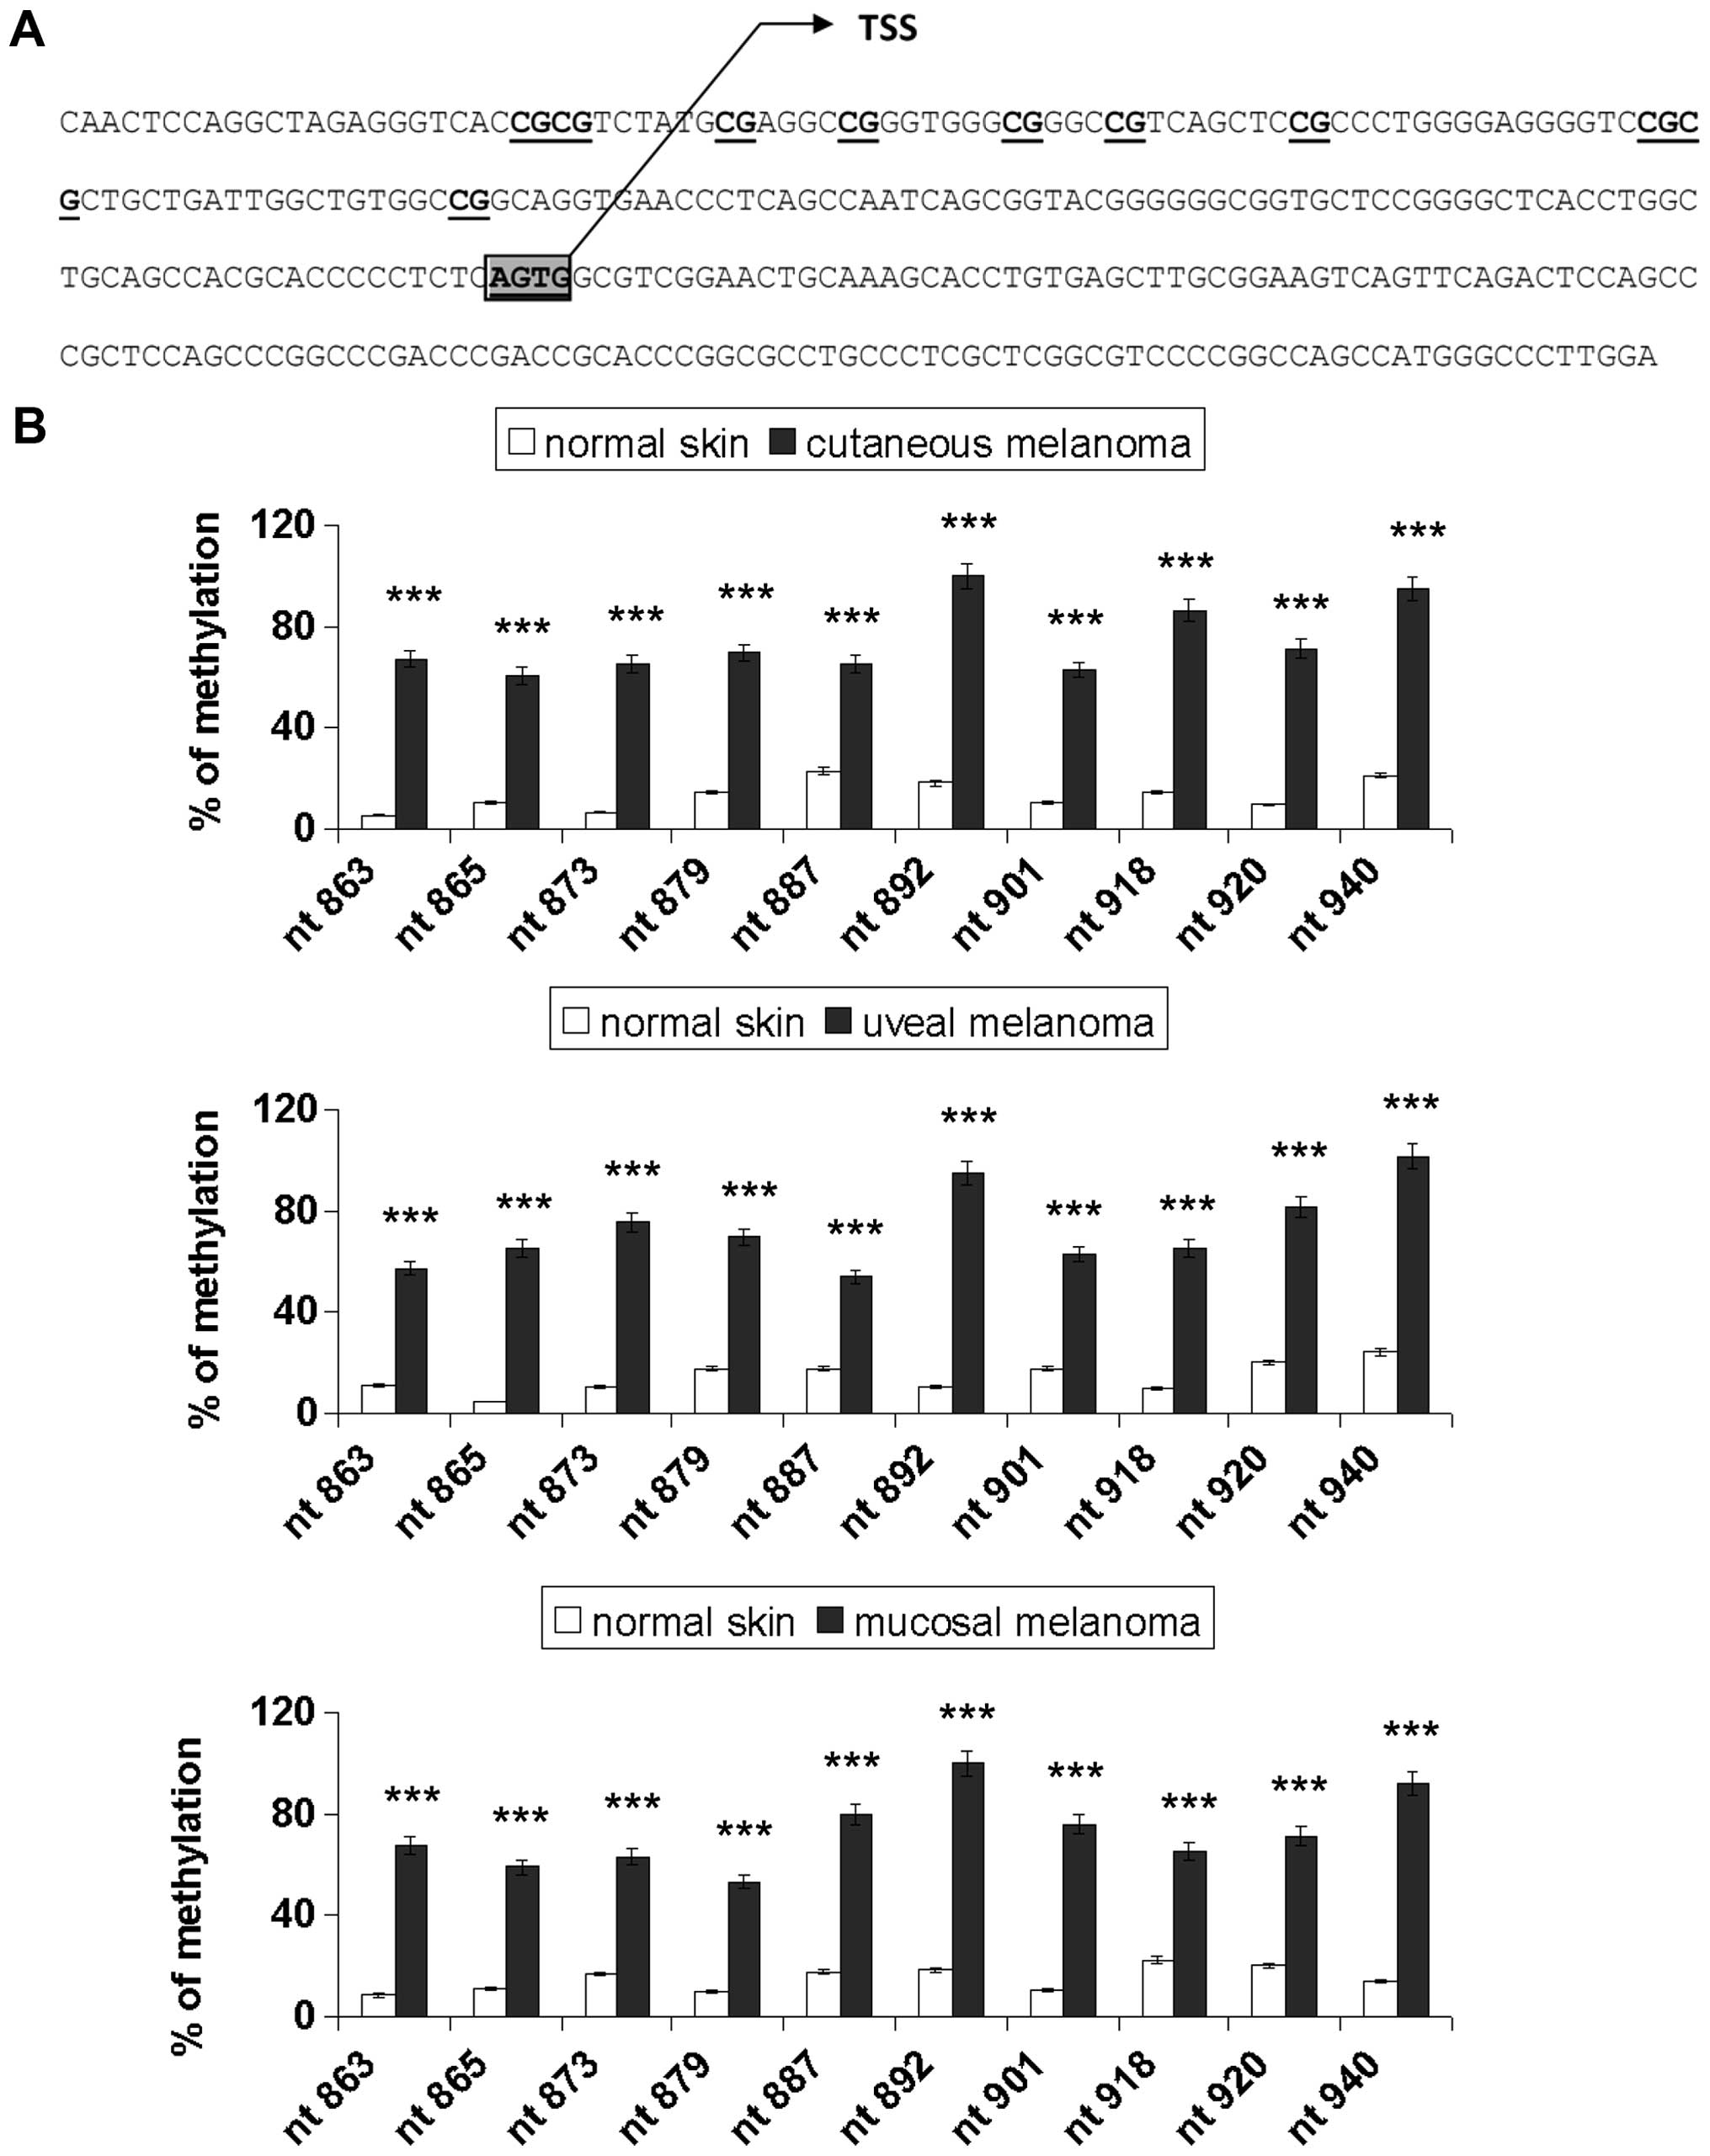
Sodium bisulfite DNA sequencing was carried out to
assess the promoter methylation pattern for 10 specific CpG sites
(genomic positions nt 863, 865, 873, 879, 887, 892, 901, 918, 920
and 940; GeneBank accession no. L34545), as represented in Fig. 2A. Fig.
2B shows the percentage of methylation of E-cadherin in the
normal skin and melanoma samples. Cancer samples showed
significantly higher methylation levels compared with the normal
tissues (p<0.001). Notably, the CpG sites nt 892 and 940 were
90–100% methylated in all the melanoma types examined and the
others were partially methylated (range, 53–86%). The methylation
rate of the E-cadherin gene was low in the normal tissues (range,
5–24%).
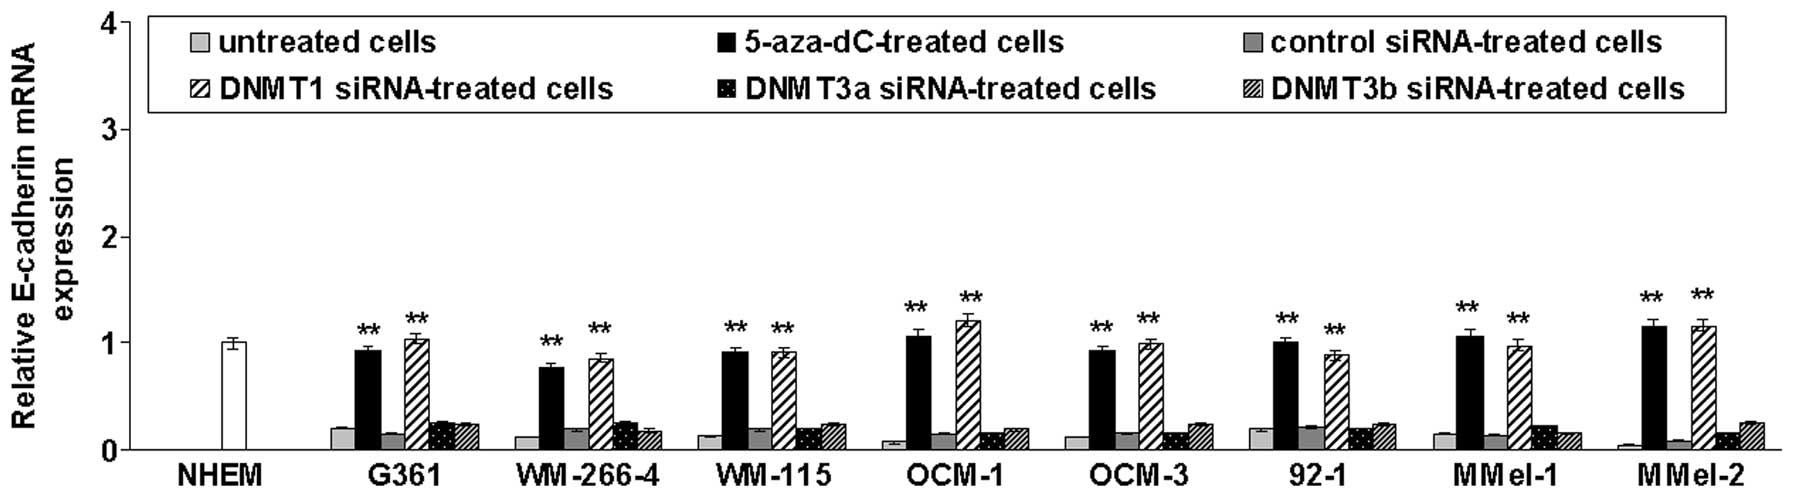
To test whether promoter methylation was responsible
for repression of E-cadherin transcription, cutaneous (G361,
WM-266-4 and WM-155) and uveal (OCM-1, OCM-3 and 92.1) melanoma
cell lines previously found to be E-cadherin-methylated (11) as well as primary mucosal melanoma
cells (M-Mel-1 and M-Mel-2) that are methylated for this gene (data
not shown), were treated with the demethylating drug 5-aza-dC or
transfected with siRNAs targeting DNMT1, DNMT3a or
DNMT3b. As shown in Fig. 3,
E-cadherin mRNA levels were significantly increased following
5-aza-dC treatment or DNMT1 silencing. In contrast,
DNMT3a or DNMT3b knockdown did not restore E-cadherin
expression.
Correlation between E-cadherin expression
and clinical parameters in cutaneous, mucosal and uveal
melanoma
We next examined the correlation between E-cadherin
expression and different clinicopathological features. Low
E-cadherin expression was observed in 78.5% of the head and neck
cutaneous melanomas as compared to 12.8% of melanomas occurring in
other regions (p<0.0001; χ2 test). Ulcerated lesions
exhibited reduced levels of E-cadherin in 95.7% of the cases
relative to 12.1% observed in the non-ulcerated tumors
(p<0.0001; χ2 test). A high percentage of melanomas
with elevated mitotic index (84.2% for 11–15 mitoses/10 HPFs; 92.3%
for 15–20 mitoses/10 HPFs) or with metastasis (68.75%) showed
decreased amounts of E-cadherin as compared with melanomas with a
low number of mitoses (3.5% for 1–5 mitoses/10 HPFs; 4.7% for 6–10
mitoses/10 HPFs) (p<0.0001; χ2 test), or no
metastatic melanomas (12.1%; p<0.0001; χ2 test),
respectively. No statistical differences were found between
E-cadherin expression and clinical stage or Breslow thickness
(Fig. 4A). Mucosal melanoma
presented a similar pattern, since a very significant correlation
was found between decreased E-cadherin expression and head/neck
localization (p<0.0001; χ2 test), ulceration
(p<0.0001; χ2 test), mitotic index (p<0.0001;
χ2 test) and metastasis (p<0.0001; χ2
test) (Fig. 4B). Data relative to
uveal melanoma showed that a high frequency of reduced E-cadherin
levels occurred in melanomas of the choroid (p<0.0001;
χ2 test) as well as in those with elevated mitotic index
(p=0.002; χ2 test) or metastasis (p<0.0001;
χ2 test) (Fig. 4C).
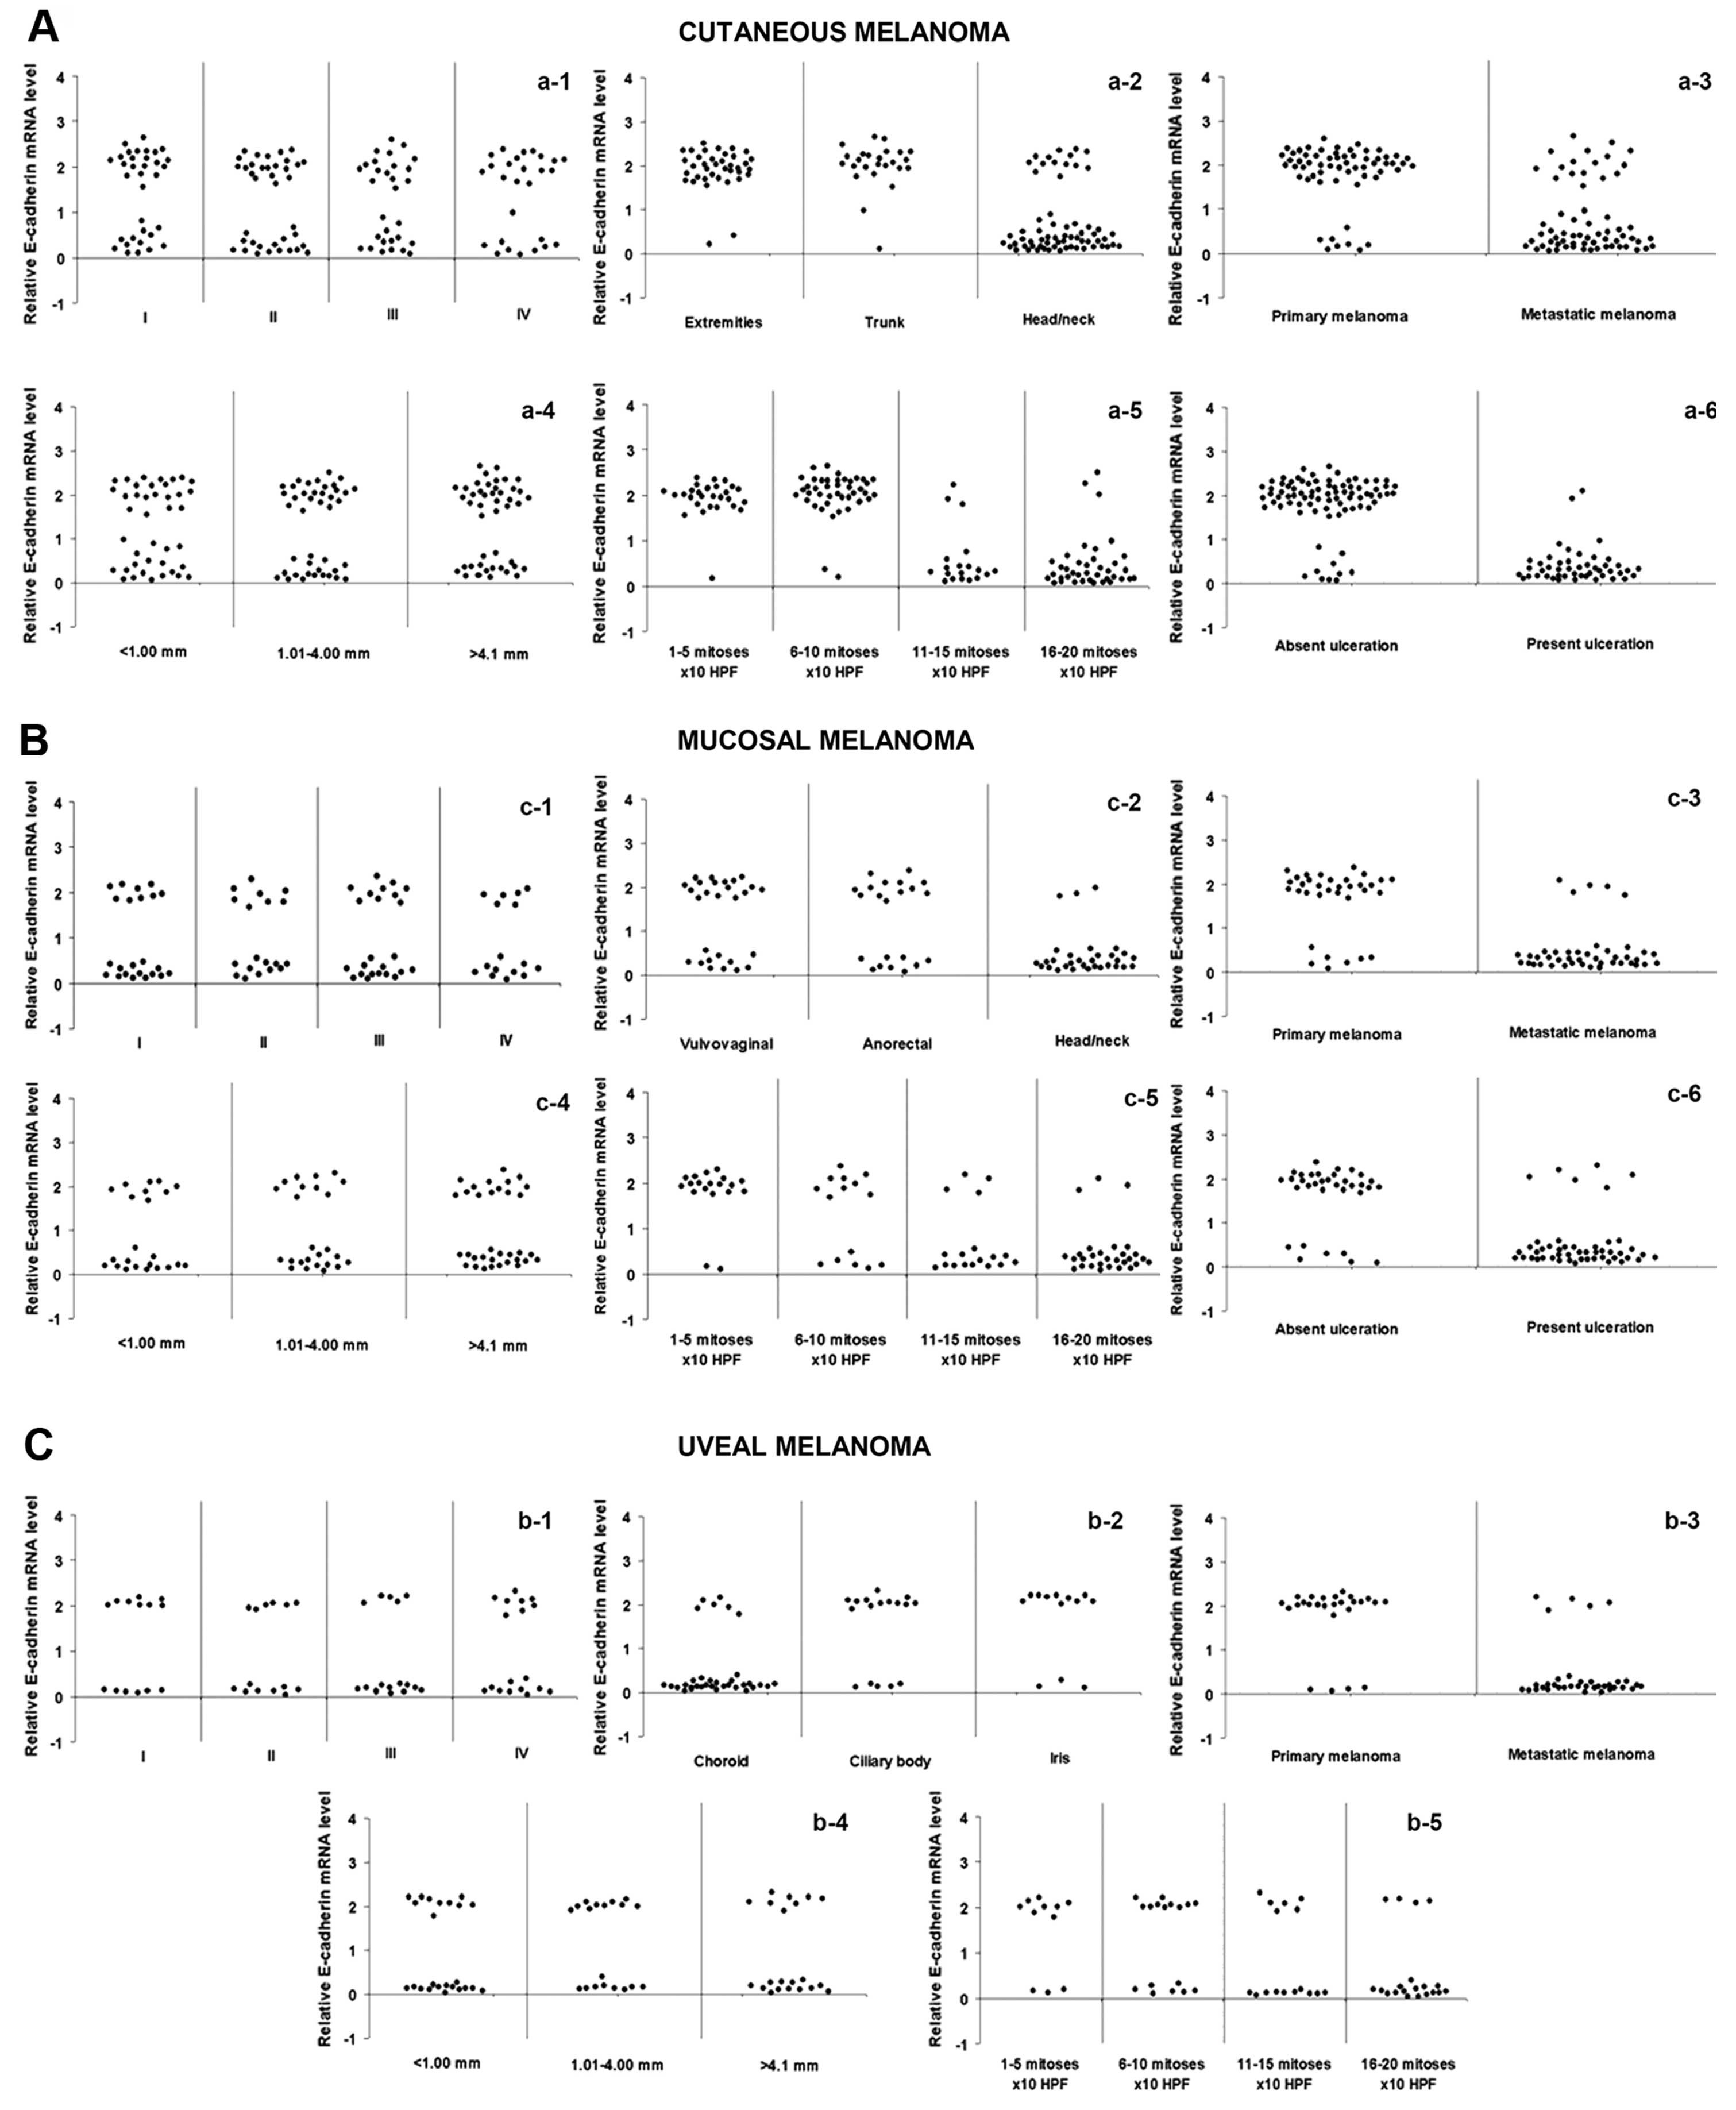 | Figure 4Correlations between E-cadherin
expression and clinicopathological characteristics in cutaneous,
mucosal and uveal melanoma. In (A) cutaneous and (B) mucosal
melanomas, decreased E-cadherin expression was correlated with
head/neck localization (p<0.0001; χ2 test) (a-2 and
b-2), metastasis (p<0.0001; χ2 test) (a-3 and b-3),
mitotic count (p<0.0001; χ2 test) (a-5 and b-5) and
ulceration (p<0.0001; χ2 test) (a-6 and b-6). No
association was found between E-cadherin expression and AJCC stage
(cutaneous melanoma, p=0.336; mucosal melanoma, p=0.358;
χ2 test) (a-1 and b-1) and Breslow thickness (cutaneous
melanoma, p=0.161; mucosal melanoma, p=0.207, χ2 test)
(a-4 and b-4). In (C) uveal melanoma, decreased E-cadherin
expression was correlated with choroidal localization (p<0.0001;
χ2 test) (c-2), metastasis (p<0.0001; χ2
test) (c-3) and mitotic index (p=0.002; χ2 test) (c-5).
No association was found between E-cadherin expression and AJCC
stage (p=0.424; χ2 test) (c-1) and Breslow thickness
(p=0.385; χ2 test) (c-4). |
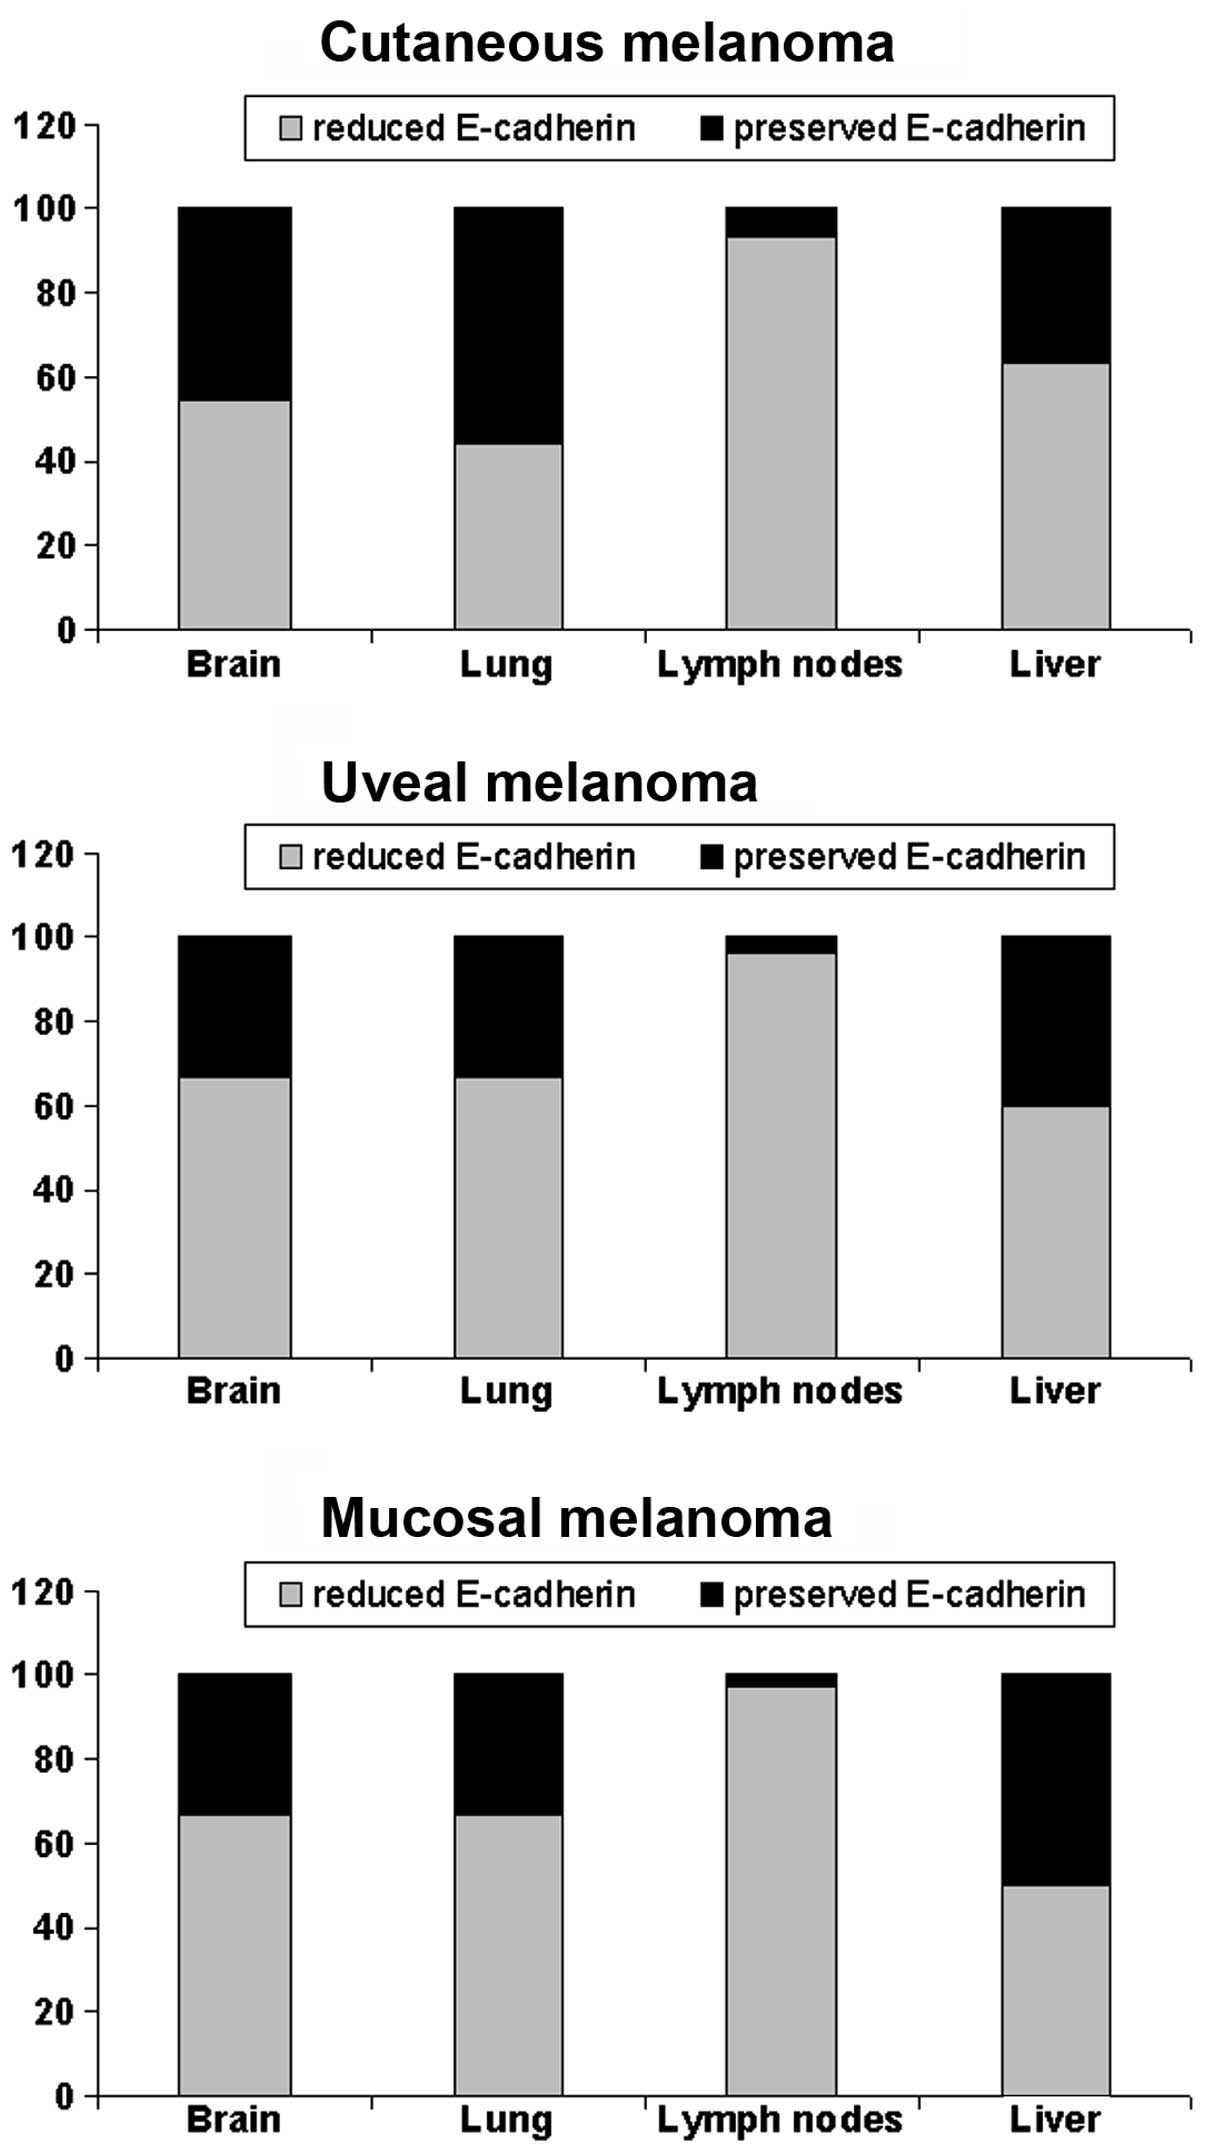
E-cadherin expression discriminates
site-specific melanoma metastasis
Analysis of the expression of E-cadherin in
metastatic tumor according to the metastasis site revealed that the
reduction in E-cadherin expression was significantly
associated with lymph node metastatic localization (Fig. 5).
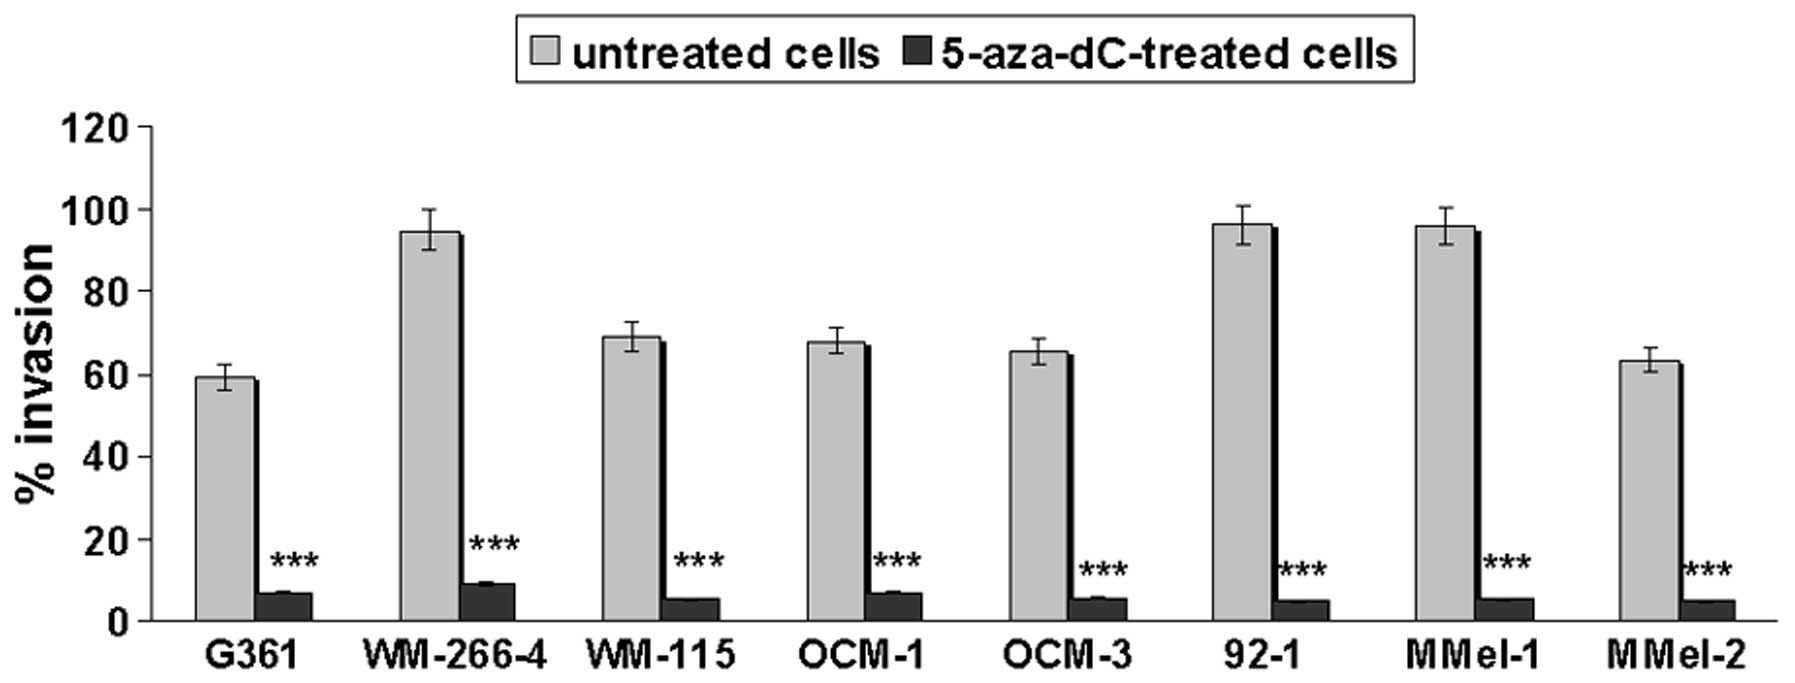
Restoration of E-cadherin negatively
correlates with the invasive potential of melanoma cells
Since a relationship between E-cadherin
silencing and melanoma metastasis was noted (Fig. 4), we aimed at evaluating the effect
of 5-aza-dC-induced E-cadherin reactivation on melanoma cell
invasiveness. As shown in Fig. 6,
demethylation markedly inhibited the invasion of all the examined
melanoma cell lines.
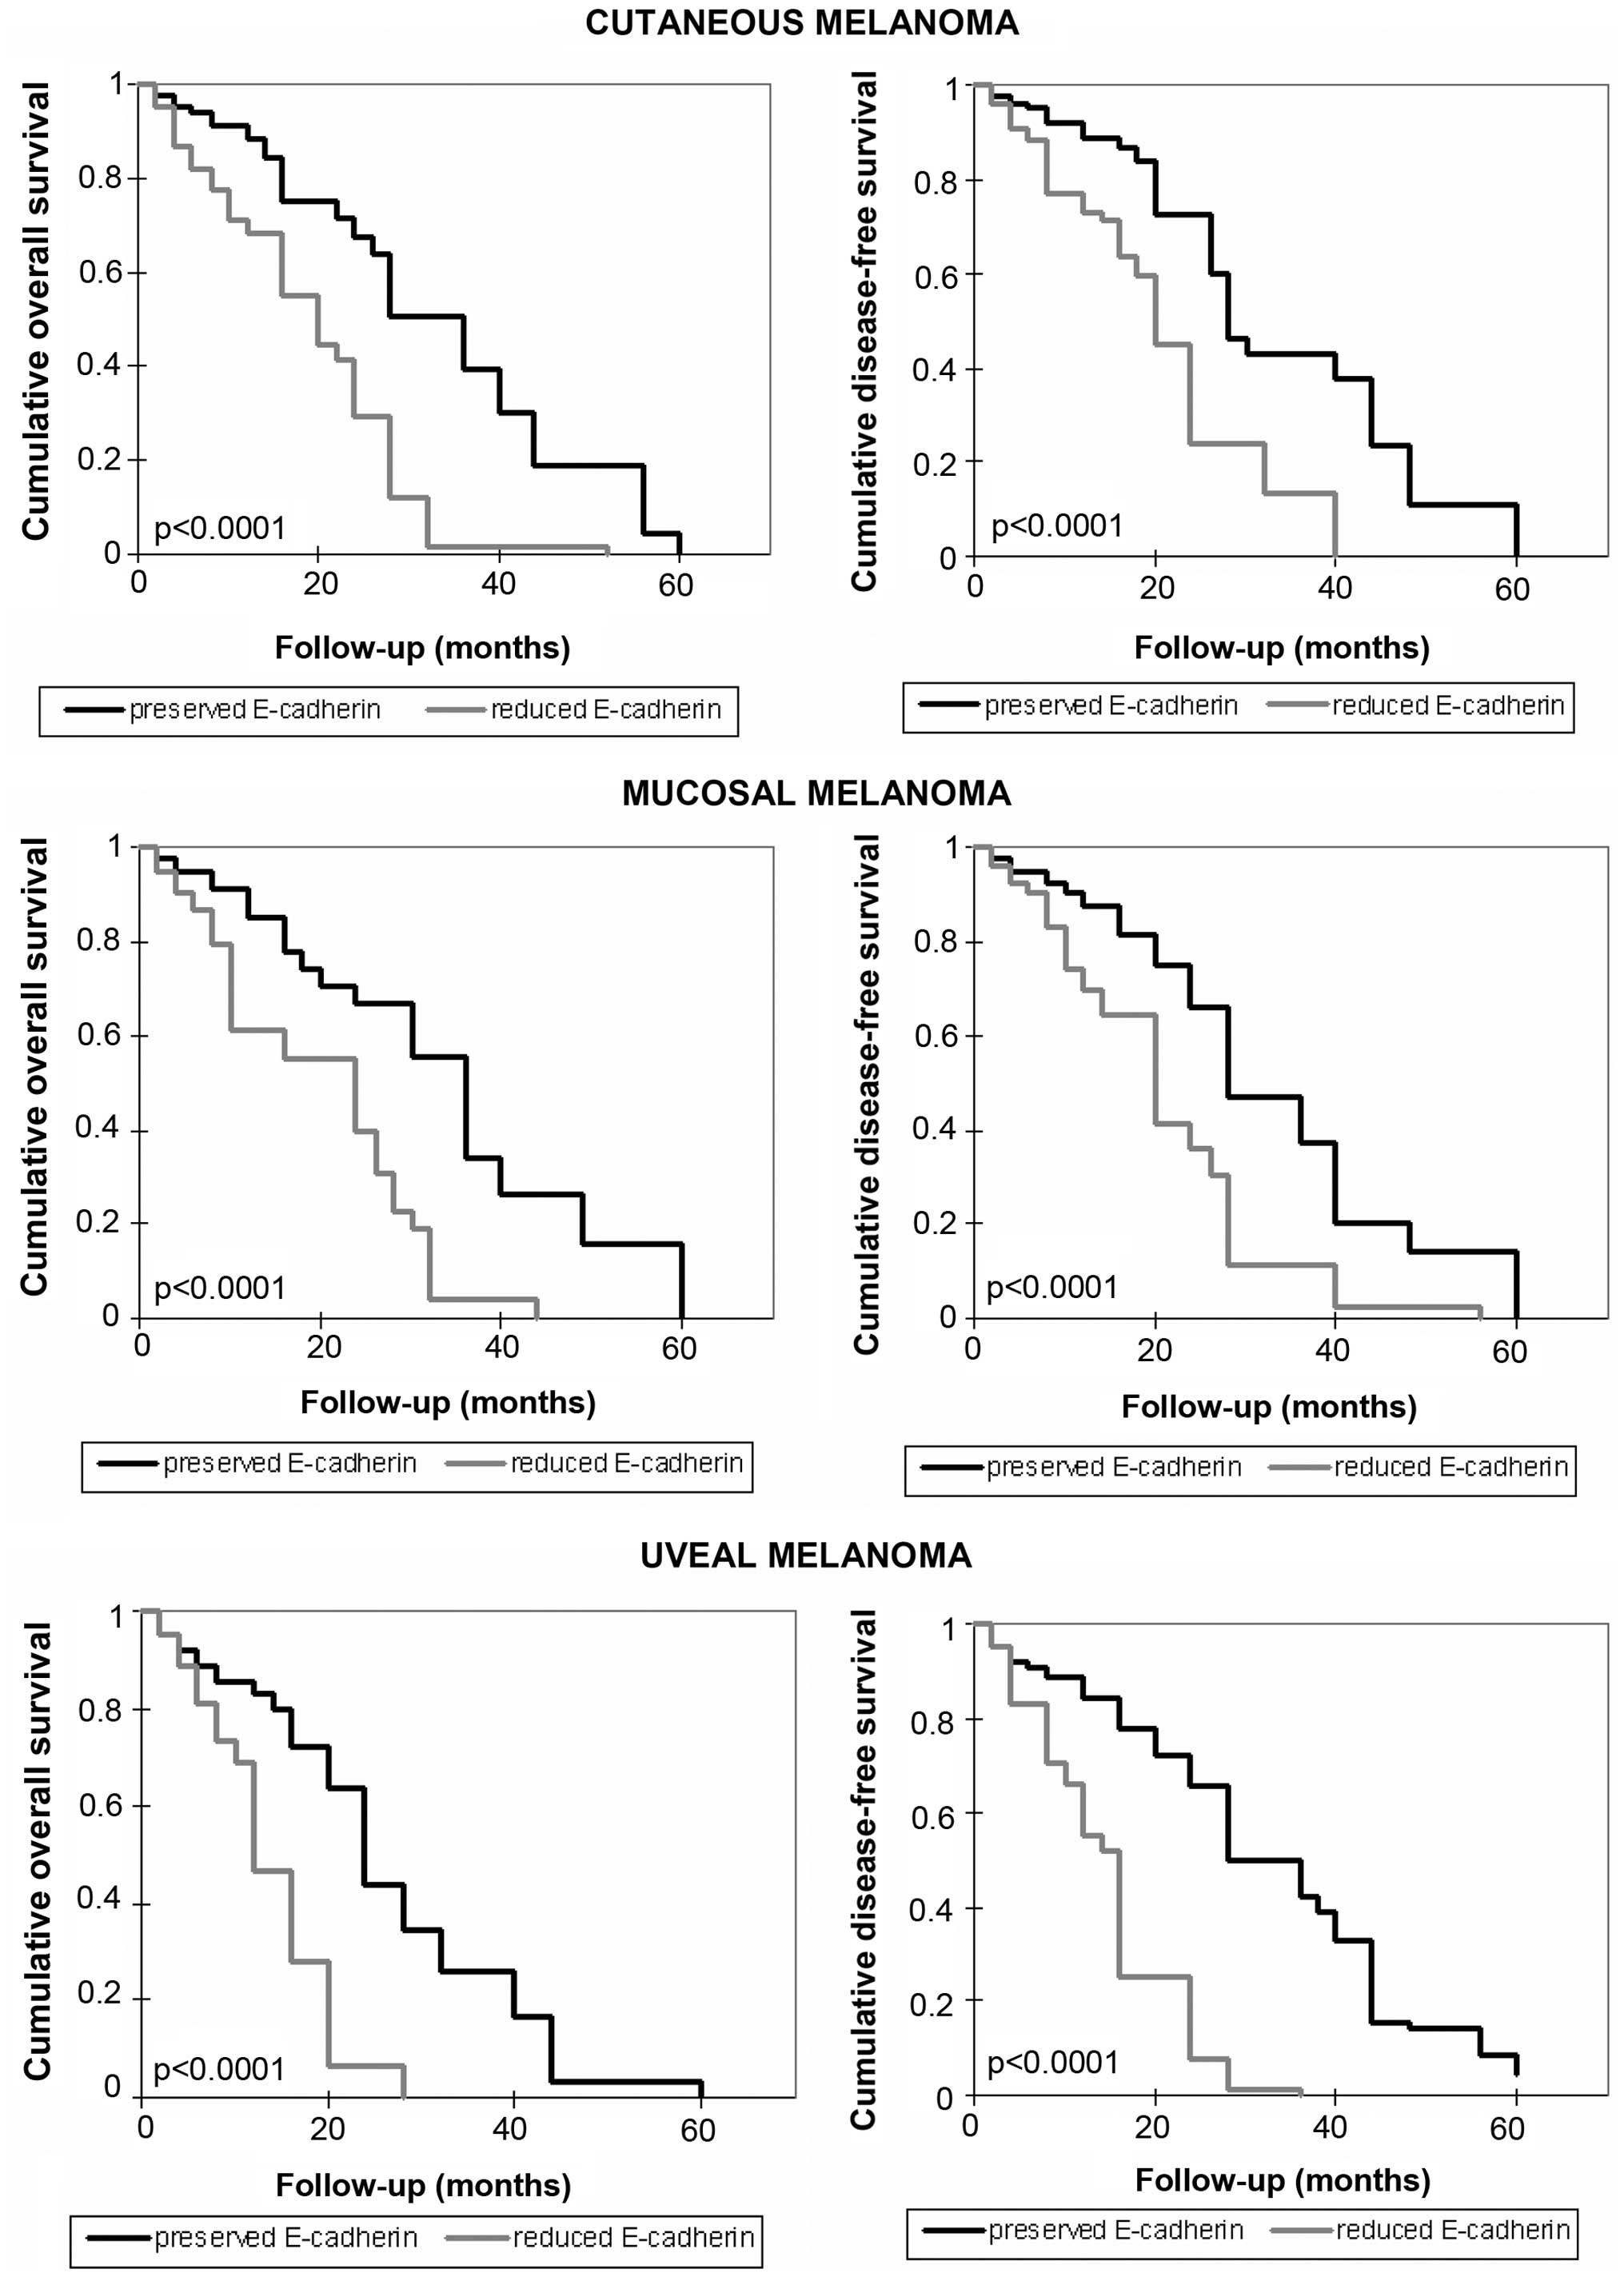
Correlation between E-cadherin levels and
patient survival
The overall and disease-free survival of melanoma
patients were also explored and the association with E-cadherin
expression was analyzed. As shown in Fig. 7, a shorter survival time for
patients with reduced levels of E-cadherin was documented
(p<0.0001). Compared to the overall survival time for patients
with preserved levels of E-cadherin (from 2 to 60 months, average
32.3 months, median 36 months in cutaneous melanoma; from 2 months
to 60 months, average 33.2 months, median 36 months in mucosal
melanoma; from 2 to 60 months, average 25.5 months, median 24
months in uveal melanoma), a shorter overall survival time in
patients with reduced expression of E-cadherin was observed (from 2
to 52 months, average 19.4 months, median 20 months in cutaneous
melanoma; from 2 to 44 months, average 19.2 months, median 24
months in mucosal melanoma; from 2 to 28 months, average 15.2
months, median 14 months in uveal melanoma). Disease-free survival
time was also shorter in patients with loss of expression of
E-cadherin, compared with the other patients. In the presence of
E-cadherin expression it was: 2 months, 60 months, average 32.7
months, median 28 months in patients with cutaneous melanoma; 2
months, 60 months, average 31.6 months, median 28 months in
patients with mucosal melanoma; 2 months 60 months, average 31.9
months, median 32 months in patients with uveal melanoma. In the
rest of the patients it was: 2 months, 40 months, average 21.4
months, median 20 months in patients with cutaneous melanoma; 2
months, 56 months, average 21.5 months, median 20 months in
patients with mucosal melanoma; 2 months, 36 months, average 16.9
months, median 16 months in patients with uveal melanoma.
Discussion
The role of E-cadherin as a 'suppressor of invasion'
(15) has been well established in
the context of melanoma, since its re-expression was accompanied by
suppression of tumor invasiveness and metastasis (16). Moreover, the significant role played
by E-cadherin in melanoma was very recently evidenced by
observations that the resistance to BRAF inhibitors displayed by
melanomas harboring mutations in BRAF was strictly
associated with a significant decrease in E-cadherin expression
(17). However, although reduced
E-cadherin expression has been well documented in malignant
melanoma and is associated with specific features of the tumor
(17–19), to the best of our knowledge, the
underlying mechanisms have not been extensively determined. In
fact, in only two cellular melanoma models the relationship between
E-cadherin silencing and promoter methylation was evidenced
(19,20). In the present study, we showed that
in cutaneous, uveal, and mucosal melanomas the methylation at
specific CpG sites in the E-cadherin promoter was
responsible for reduced gene expression (Figs. 1 and 2) and several clinicopathological
features. Indeed, E-cadherin downregulation was assumed to be an
important step in the progression from a melanoma in situ to
an invasive and metastasizing lesion and a determinant of tumor
depth (8,21). Thus, the demonstration that
E-cadherin expression is epigenetically regulated through
promoter methylation and that it can be reverted by demethylating
tools, such as 5-aza-dC treatment or DNMT1 silencing it may
be of clinical significance (Fig.
3). This latter data accounts for the prominent role of
DNMT1 in repressing E-cadherin transcription, as already
shown in another cancer model (22), and is in agreement with studies
reporting the near selective activity of 5-aza-dC in inhibiting
DNMT1 and neglecting DNMT3a and DNMT3b enzymes
(23,24). The identification of a likely
mechanism for E-cadherin downregulation in melanoma may pave the
way to alternative therapeutic strategies. This possibility is
further suggested by additional results of the present study, which
indicate that methylation and reduced expression of E-cadherin are
closely associated with clinicopathological markers, either
specific or common to each type of melanoma. This may be of some
interest, since up-to-date conflicting data emerge from the
literature. Initially, E-cadherin expression was shown to be rare
in both nevocellular nevi and early-stage melanoma, but preserved
in advanced-stage melanoma and melanoma metastases (25). More recently, however, E-cadherin
expression was found to be altered in different stages of melanoma
progression (19). Moreover,
information with regard to the actual meaning of E-cadherin
epigenetic silencing in melanoma was lacking. In the present study,
we showed that in cutaneous melanoma reduced E-cadherin expression
via promoter aberrant methylation was strongly associated with
several poor prognostic factors, namely ulceration, head/neck
localization, mitotic count and metastasis as well as with reduced
overall/disease-free survival (Figs.
4 and 7). No statistical
association was found with clinical stage or Breslow thickness. Our
findings allow us to hypothesize that reduced E-cadherin expression
through promoter hypermethylation may have a major impact on the
proliferation rate of melanoma. The inverse association between
E-cadherin expression and the mitotic index found by us is in line
with various studies, which reveal that downregulation of
E-cadherin prevents the control of melanocyte proliferation by
keratinocytes and is involved in melanocyte transformation
(16,26). Moreover, other studies have reported
that expression of E-cadherin results in inhibition of cell
motility and local invasion in melanoma cells (16,27),
as well as in other cell systems (28,29).
The higher frequency of E-cadherin methylation and silencing
in cutaneous melanoma occurring in head and neck regions, as
detected in the present study, deserves to be considered
separately. The incidence of melanoma of the head and neck has
increased in proportion to sun exposure, and it is often linked to
poor prognosis and reduced survival (30). Intense vascularization and abundance
of lymphatic vessels in the region may account for these malignancy
characteristics, but although it is generally believed that
molecular mechanisms different from those involved in melanoma
occurring in sun-protected areas are engaged (31,32),
little information about distinctive molecular markers of head/neck
melanoma are available. The positive correlation between the
methylation of E-cadherin and the location of melanoma in
the head and neck region highlighted here may explain the apparent
discrepancies with other studies reporting a low frequency of
methylation of the gene in this tumor. Indeed, in case studies by
Liu et al, melanomas of the head and neck were not included
(33). The silencing of
E-cadherin through aberrant promoter methylation may
contribute to add new insights into the mechanisms accounting for
the higher malignancy of head/neck melanoma. A similar hypothesis
may be advanced for head/neck mucosal melanomas, which, although
rare (34), represent half of all
mucosal melanomas and exhibit a more aggressive behavior as
compared to mucosal melanoma of other regions (35). Indeed, it is quite intriguing that,
among the various types of mucosal melanoma, methylation-mediated
downregulation of E-cadherin is almost entirely restricted to the
head and neck area (Fig. 4).
Likewise, we showed that the presence of ulcerated lesions, high
mitotic index, metastasis and reduced overall/disease-free survival
are conditions frequently associated with epigenetic downregulation
of E-cadherin in mucosal melanomas (Figs. 4 and 7). These data allow us to hypothesize that
cutaneous and mucosal melanomas not only use the same mechanism for
regulating E-cadherin expression, but also that both adopt it in
the same circumstances of transformation. Regarding uveal melanoma,
it is worth mentioning that the expression of E-cadherin, along
with other biomarkers, is considered to be the most accurate
predictor of metastasis (36).
Therefore, our findings that the downregulation of E-cadherin
correlates inversely with the mitotic index and directly with the
choroidal site, metastasis and reduced overall/disease-free
survival (Figs. 4 and 7) are not surprising, albeit indicative
from a clinicopathological point of view. In fact, it is well
recognized that high expression of E-cadherin is strictly
associated to the epithelial phenotype, while loss of E-cadherin is
indicative of mesenchymal transition and acquirement of
invasiveness characteristics (37,38).
In addition, it is even more interesting that all the melanoma
types share the association of methylation-induced E-cadherin
reduction with the metastatic phenotype (Fig. 4), the lymph nodal metastasis
localization (Fig. 5), the invasive
character (Fig. 6), and the reduced
overall/disease-free survival (Fig.
7). Such data, streaming from the well known role exerted by
E-cadherin as cell-cell adhesion molecule and central hub of
inhibitory signals of cell motility (39,40),
contribute to clarify why melanoma preferentially metastasizes to
distant sites and lymph nodes. Taken together, the results reported
in the present study highlight the crucial role of E-cadherin in
the events affecting melanoma progression and support the proposal
that E-cadherin itself may be considered as a prognostic factor for
melanoma.
In conclusion, in the light of the above
considerations, the findings reported in the present study,
indicate that promoter hypermethylation plays a significant role in
switching off E-cadherin gene expression in malignant
melanoma and suggest that loss of E-cadherin may contribute
to increased cell proliferation, invasiveness, ulcerative process,
metastasis, prevalently at lymph nodes, head and neck or choroidal
localization, and reduced disease-free/overall survival. Taken
together, the findings reported in the present study suggest that
E-cadherin downregulation may itself be considered a poor
prognostic factor in melanoma and raise the possibility that
reactivation of E-cadherin through promoter demethylation
may represent a promising therapeutic strategy for the treatment of
melanoma.
Acknowledgments
The authors acknowledge the critical review by
Professor Giuseppe Teti. The present study was supported in part by
funds granted to Scylla Biotech Srl by the Ministero
dell'Università e della Ricerca Scientifica of Italy (project
n.4/13 ex art. 11 D.M. n. 593).
Abbreviations:
|
FFPE
|
formalin-fixed paraffin-embedded
|
|
NHEMs
|
normal human epidermal melanocytes
|
|
qPCR
|
quantitative real-time PCR
|
|
MSP
|
methylation-specific PCR
|
|
HPF
|
high-power field
|
|
TSS
|
transcriptional start site
|
References
|
1
|
Demierre MF, Sabel MS, Margolin KA, Daud
AI and Sondak VK: State of the science 60th anniversary review: 60
Years of advances in cutaneous melanoma epidemiology, diagnosis,
and treatment, as reported in the journal Cancer. Cancer. 113(Suppl
7): S1728–S1743. 2008. View Article : Google Scholar
|
|
2
|
Venza M, Visalli M, Biondo C, Lentini M,
Catalano T, Teti D and Venza I: Epigenetic regulation of
p14ARF and p16INK4A expression in cutaneous
and uveal melanoma. Biochim Biophys Acta. 1849:247–256. 2015.
View Article : Google Scholar
|
|
3
|
Venza I, Visalli M, Oteri R, Teti D and
Venza M: Class I-specific histone deacetylase inhibitor MS-275
overrides TRAIL-resistance in melanoma cells by downregulating
c-FLIP. Int Immunopharmacol. 21:439–446. 2014. View Article : Google Scholar : PubMed/NCBI
|
|
4
|
Venza M, Visalli M, Catalano T, Fortunato
C, Oteri R, Teti D and Venza I: Impact of DNA methyltransferases on
the epigenetic regulation of tumor necrosis factor-related
apoptosis-inducing ligand (TRAIL) receptor expression in malignant
melanoma. Biochem Biophys Res Commun. 441:743–750. 2013. View Article : Google Scholar : PubMed/NCBI
|
|
5
|
Venza I, Visalli M, Oteri R, Cucinotta M,
Teti D and Venza M: Class II-specific histone deacetylase
inhibitors MC1568 and MC1575 suppress IL-8 expression in human
melanoma cells. Pigment Cell Melanoma Res. 26:193–204. 2013.
View Article : Google Scholar
|
|
6
|
Venza M, Visalli M, Biondo C, Oteri R,
Agliano F, Morabito S, Caruso G, Caffo M, Teti D and Venza I:
Epigenetic effects of cadmium in cancer: Focus on melanoma. Curr
Genomics. 15:420–435. 2014. View Article : Google Scholar
|
|
7
|
Schneider MR and Kolligs FT: E-cadherin's
role in development, tissue homeostasis and disease: Insights from
mouse models: Tissue-specific inactivation of the adhesion protein
E-cadherin in mice reveals its functions in health and disease.
BioEssays. 37:294–304. 2015. View Article : Google Scholar
|
|
8
|
Andersen K, Nesland JM, Holm R, Flørenes
VA, Fodstad Ø and Maelandsmo GM: Expression of S100A4 combined with
reduced E-cadherin expression predicts patient outcome in malignant
melanoma. Mod Pathol. 17:990–997. 2004. View Article : Google Scholar : PubMed/NCBI
|
|
9
|
Kuphal S and Bosserhoff AK: E-cadherin
cell-cell communication in melanogenesis and during development of
malignant melanoma. Arch Biochem Biophys. 524:43–47. 2012.
View Article : Google Scholar
|
|
10
|
Graff JR, Gabrielson E, Fujii H, Baylin SB
and Herman JG: Methylation patterns of the E-cadherin 5′ CpG island
are unstable and reflect the dynamic, heterogeneous loss of
E-cadherin expression during metastatic progression. J Biol Chem.
275:2727–2732. 2000. View Article : Google Scholar : PubMed/NCBI
|
|
11
|
Venza M, Visalli M, Biondo C, Oteri R,
Agliano F, Morabito S, Teti D and Venza I: Epigenetic marks
responsible for cadmium-induced melanoma cell overgrowth. Toxicol
In Vitro. 29:242–250. 2015. View Article : Google Scholar
|
|
12
|
Venza M, Visalli M, Oteri R, Agliano F,
Morabito S, Teti D and Venza I: The overriding of TRAIL resistance
by the histone deacetylase inhibitor MS-275 involves c-myc
up-regulation in cutaneous, uveal, and mucosal melanoma. Int
Immunopharmacol. 28:313–321. 2015. View Article : Google Scholar : PubMed/NCBI
|
|
13
|
Herman JG, Graff JR, Myöhänen S, Nelkin BD
and Baylin SB: Methylation-specific PCR: A novel PCR assay for
methylation status of CpG islands. Proc Natl Acad Sci USA.
93:9821–9826. 1996. View Article : Google Scholar : PubMed/NCBI
|
|
14
|
Ribeiro-Filho LA, Franks J, Sasaki M,
Shiina H, Li LC, Nojima D, Arap S, Carroll P, Enokida H, Nakagawa
M, et al: CpG hypermethylation of promoter region and inactivation
of E-cadherin gene in human bladder cancer. Mol Carcinog.
34:187–198. 2002. View
Article : Google Scholar : PubMed/NCBI
|
|
15
|
Vleminckx K, Vakaet L Jr, Mareel M, Fiers
W and van Roy F: Genetic manipulation of E-cadherin expression by
epithelial tumor cells reveals an invasion suppressor role. Cell.
66:107–119. 1991. View Article : Google Scholar : PubMed/NCBI
|
|
16
|
Hsu MY, Meier FE, Nesbit M, Hsu JY, Van
Belle P, Elder DE and Herlyn M: E-cadherin expression in melanoma
cells restores keratinocyte-mediated growth control and
down-regulates expression of invasion-related adhesion receptors.
Am J Pathol. 156:1515–1525. 2000. View Article : Google Scholar : PubMed/NCBI
|
|
17
|
Liu S, Tetzlaff MT, Wang T, Yang R, Xie L,
Zhang G, Krepler C, Xiao M, Beqiri M, Xu W, et al: miR-200c/Bmi1
axis and epithelial-mesenchymal transition contribute to acquired
resistance to BRAF inhibitor treatment. Pigment Cell Melanoma Res.
28:431–441. 2015. View Article : Google Scholar : PubMed/NCBI
|
|
18
|
Lade-Keller J, Riber-Hansen R, Guldberg P,
Schmidt H, Hamilton-Dutoit SJ and Steiniche T: E- to N-cadherin
switch in melanoma is associated with decreased expression of
phosphatase and tensin homolog and cancer progression. Br J
Dermatol. 169:618–628. 2013. View Article : Google Scholar : PubMed/NCBI
|
|
19
|
Seleit IA, Samaka RM, Basha MA and Bakry
OA: Impact of E-cadherin expression pattern in melanocytic nevi and
cutaneous malignant melanoma. Anal Quant Cytopathol Histpathol.
34:204–213. 2012.PubMed/NCBI
|
|
20
|
Tsutsumida A, Hamada J, Tada M, Aoyama T,
Furuuchi K, Kawai Y, Yamamoto Y, Sugihara T and Moriuchi T:
Epigenetic silencing of E- and P-cadherin gene expression in human
melanoma cell lines. Int J Oncol. 25:1415–1421. 2004.PubMed/NCBI
|
|
21
|
Johnson JP: Cell adhesion molecules in the
development and progression of malignant melanoma. Cancer
Metastasis Rev. 18:345–357. 1999. View Article : Google Scholar
|
|
22
|
Qiu X, Qiao F, Su X, Zhao Z and Fan H:
Epigenetic activation of E-cadherin is a candidate therapeutic
target in human hepatocellular carcinoma. Exp Ther Med. 1:519–523.
2010.PubMed/NCBI
|
|
23
|
Ghoshal K, Datta J, Majumder S, Bai S,
Kutay H, Motiwala T and Jacob ST: 5-Aza-deoxycytidine induces
selective degradation of DNA methyltransferase 1 by a proteasomal
pathway that requires the KEN box, bromo-adjacent homology domain,
and nuclear localization signal. Mol Cell Biol. 25:4727–4741. 2005.
View Article : Google Scholar : PubMed/NCBI
|
|
24
|
Palii SS, Van Emburgh BO, Sankpal UT,
Brown KD and Robertson KD: DNA methylation inhibitor
5-Aza-2′-deoxycytidine induces reversible genome-wide DNA damage
that is distinctly influenced by DNA methyltransferases 1 and 3B.
Mol Cell Biol. 28:752–771. 2008. View Article : Google Scholar :
|
|
25
|
Danen EHJ, de Vries TJ, Morandini R,
Ghanem GG, Ruiter DJ and van Muijen GNP: E-cadherin expression in
human melanoma. Melanoma Res. 6:127–131. 1996. View Article : Google Scholar : PubMed/NCBI
|
|
26
|
Hsu M, Andl T, Li G, Meinkoth JL and
Herlyn M: Cadherin repertoire determines partner-specific gap
junctional communication during melanoma progression. J Cell Sci.
113:1535–1542. 2000.PubMed/NCBI
|
|
27
|
Lu Z, Ghosh S, Wang Z and Hunter T:
Downregulation of caveolin-1 function by EGF leads to the loss of
E-cadherin, increased transcriptional activity of beta-catenin, and
enhanced tumor cell invasion. Cancer Cell. 4:499–515. 2003.
View Article : Google Scholar
|
|
28
|
Zhang L, Wang G, Wang L, Song C, Wang X
and Kang J: Valproic acid inhibits prostate cancer cell migration
by up-regulating E-cadherin expression. Pharmazie. 66:614–618.
2011.PubMed/NCBI
|
|
29
|
Bocca C, Bozzo F, Francica S, Colombatto S
and Miglietta A: Involvement of PPAR gamma and
E-cadherin/beta-catenin pathway in the antiproliferative effect of
conjugated linoleic acid in MCF-7 cells. Int J Cancer. 121:248–256.
2007. View Article : Google Scholar : PubMed/NCBI
|
|
30
|
Larson DL and Larson JD: Head and neck
melanoma. Clin Plast Surg. 37:73–77. 2010. View Article : Google Scholar
|
|
31
|
Whiteman DC, Watt P, Purdie DM, Hughes MC,
Hayward NK and Green AC: Melanocytic nevi, solar keratoses, and
divergent pathways to cutaneous melanoma. J Natl Cancer Inst.
95:806–812. 2003. View Article : Google Scholar : PubMed/NCBI
|
|
32
|
Maldonado JL, Fridlyand J, Patel H, Jain
AN, Busam K, Kageshita T, Ono T, Albertson DG, Pinkel D and Bastian
BC: Determinants of BRAF mutations in primary melanomas. J Natl
Cancer Inst. 95:1878–1890. 2003. View Article : Google Scholar : PubMed/NCBI
|
|
33
|
Liu S, Ren S, Howell P, Fodstad O and
Riker AI: Identification of novel epigenetically modified genes in
human melanoma via promoter methylation gene profiling. Pigment
Cell Melanoma Res. 21:545–558. 2008. View Article : Google Scholar : PubMed/NCBI
|
|
34
|
Bakkal FK, Başman A, Kızıl Y, Ekinci Ö,
Gümüşok M, Ekrem Zorlu M and Aydil U: Mucosal melanoma of the head
and neck: Recurrence characteristics and survival outcomes. Oral
Surg Oral Med Oral Pathol Oral Radiol. 120:575–580. 2015.
View Article : Google Scholar : PubMed/NCBI
|
|
35
|
Gavriel H, McArthur G, Sizeland A and
Henderson M: Review: Mucosal melanoma of the head and neck.
Melanoma Res. 21:257–266. 2011. View Article : Google Scholar : PubMed/NCBI
|
|
36
|
Chang SH, Worley LA, Onken MD and Harbour
JW: Prognostic biomarkers in uveal melanoma: Evidence for a stem
cell-like phenotype associated with metastasis. Melanoma Res.
18:191–200. 2008. View Article : Google Scholar : PubMed/NCBI
|
|
37
|
Tucci MG, Lucarini G, Brancorsini D, Zizzi
A, Pugnaloni A, Giacchetti A, Ricotti G and Biagini G: Involvement
of E-cadherin, beta-catenin, Cdc42 and CXCR4 in the progression and
prognosis of cutaneous melanoma. Br J Dermatol. 157:1212–1216.
2007. View Article : Google Scholar : PubMed/NCBI
|
|
38
|
Zeisberg M and Neilson EG: Biomarkers for
epithelial-mesenchymal transitions. J Clin Invest. 119:1429–1437.
2009. View Article : Google Scholar : PubMed/NCBI
|
|
39
|
Li Q and Mattingly RR: Restoration of
E-cadherin cell-cell junctions requires both expression of
E-cadherin and suppression of ERK MAP kinase activation in
Ras-transformed breast epithelial cells. Neoplasia. 10:1444–1458.
2008. View Article : Google Scholar : PubMed/NCBI
|
|
40
|
Siret C, Terciolo C, Dobric A, Habib MC,
Germain S, Bonnier R, Lombardo D, Rigot V and André F: Interplay
between cadherins and α2β1 integrin differentially regulates
melanoma cell invasion. Br J Cancer. 113:1445–1453. 2015.
View Article : Google Scholar : PubMed/NCBI
|