Introduction
Head and neck squamous cell carcinoma (HNSCC)
accounts for the major proportion of head and neck cancers and is
the sixth most common non-skin cancer worldwide (1). The high mortality rate of HNSCC
results from poor prognosis and lack of reliable prognostic
signatures. Thus, it is urgent to reveal more reliable prognostic
markers to achieve better outcomes for HNSCC patients.
MicroRNAs (miRNAs) are small non-protein-coding RNAs
of ~22 nucleotides, and they play roles in various biological
functions, such as cell growth, differentiation and the development
of disease (2). Dysregulation of
miRNAs is also closely related to the development, diagnosis and
prognosis of many types of cancers including HNSCC (3). For instance, miR-218 inhibits cell
migration and invasion by suppressing the expression of laminin-332
in HNSCC (4). By suppressing
invadopodia activity, miR-375 impairs the tumor invasion of HNSCC
and is implicated in the poor outcome of HNSCC (5,6).
Moreover, poorer overall survival of HNSCC has been found to be
linked with the promoter methylation of miR-137 (7). In addition, overexpression of miR-205
is able to mediate HNSCC growth and E2F1 signaling (8). Although more and more studies have
focused on uncovering miRNAs that are involved in HNSCC, few miRNAs
have been identified as potential prognostic markers for HNSCC.
In the present study, to identify potential
prognostic miRNA markers for HNSCC, miRNA expression profile and
clinical data of 397 HNSCC cases were obtained from The Cancer
Genome Atlas (TCGA) database. Survival and Cox regression analyses
were performed to identify the miRNAs that were potentially
associated with the survival of HNSCC patients. Furthermore, target
genes of those miRNAs were predicted and the functions of the
target genes were analyzed. The results may provide new information
for the further study of HNSCC, and the identified miRNAs may be
used as prognostic markers for HNSCC, which may be useful to
improve future clinical outcome of HNSCC.
Materials and methods
Data acquisition
The miRNA expression profiling and clinical data of
HNSCC were obtained from the TCGA database (http://cancergenome.nih.gov/, the deadline of data
downloading: July 20, 2014). The miRNA expression profiling data
included a total of 513 cases, and they were produced by two
platforms: BCGSC_IlluminaGA_miRNASeq (37 cases) and
BCGSC_IlluminaHiSeq_miRNASeq (476 cases). The clinical data
included 418 HNSCC cases. After data filtering, only cases with
both miRNA expression profile and clinical survival data (397
cases) were retained for further analysis.
Survival analysis
The average expression value of each miRNA in the
397 cases was calculated, and the mean value was set as the
critical value. Then, the cases were divided into two groups
according to the miRNA expression values higher or lower than the
critical value. Furthermore, survival estimates were calculated by
the Kaplan-Meier (KM) method and the log-rank test based on a
survival package in R (9). Only the
miRNAs with p<0.05 were considered significant. The miRNAs that
had a significant association with survival time were selected for
subsequent analysis.
Cox regression analysis
The miRNAs having a significant impact on survival
time and clinical survival data received Cox proportional hazards
regression analysis (10) based on
KMsurv package in R (11). Patients
with a high risk score were considered to have poor survival. The
miRNAs with p<0.05 were chosen for further analysis.
Target gene prediction
The target genes of the miRNAs with p<0.05 in the
Cox regression analysis were obtained based on the databases of
miRecords (http://c1.accurascience.com/miRecords/) (12) and MiRWalk (http://www.umm.uni-heidelberg.de/apps/zmf/mirwalk/)
(13). Only the regulatory
relationships recorded at least in 3 of the databases including
miRanda (14), MirTarget2 (15), PicTar (16), PITA (17) and TargetScan (18) were selected for further
analysis.
Construction of protein-protein
interaction (PPI) network for target genes
PPIs between target genes of the miRNAs were
analyzed via the online database Search Tool for the Retrieval of
Interacting Genes (STRING, http://string-db.org/) (19). Then, target gene pairs with a
combined score >0.4 were chosen to construct PPI networks, which
were visualized using the Cytoscape software (http://www.cytoscape.org/) (20). In the network, a node represents a
protein (gene), and lines represent the interactions of the
proteins. The 'degree' of each node is equal to the number of nodes
that interact with this node. The larger the degree is, the closer
the connections with other nodes are.
Functional analyses of target genes
The Database for Annotation, Visualization and
Integrated Discovery (DAVID; https://david.ncifcrf.gov/) was applied to investigate
the Kyoto Encyclopedia of Genes and Genomes (KEGG) pathways of the
target genes (21). p<0.05 was
chosen as the cut-off criterion.
To further investigate the function of the target
genes, the GenCLip tool (22) was
utilized to perform functional clustering for genes in the PPI
network based on literature mining, and the cut-off criteria were
p<1E-04 and hit ≥9. Additionally, pathway enrichment analysis
was performed for the genes in the PPI network, based on the Gene
Set Enrichment Analysis (GSEA) database (http://software.broadinstitute.org/gsea/index.jsp).
p<0.05 was set as the cut-off criterion.
Results
Survival analysis
In total, expression values of 1,046 miRNAs were
obtained from the TCGA database. Among the miRNAs, a total of 15
miRNAs were discovered to be significantly related to survival
time. Low expression of the 15 miRNAs was correlated with a higher
survival rate based on the Kaplan-Meier survival analysis. Among
the 15 miRNAs, miR-4292, miR-3685 and miR-1302.3 with no expression
values in most of the samples were deleted and 12 miRNAs were
finally screened.
Cox proportional hazards analyses
Cox proportional hazards analysis was performed with
the clinical data [demographic characteristics,
tumor-node-metastasis (TNM) classification, history of drinking and
smoking] and the 12 miRNAs. Compared with the other clinical
factors, miR-1251, miR-618 and miR-328 with p<0.05 were
significantly associated with risk factors of HNSCC (Table I).
 | Table IResults of the Cox proportional
hazard regression analysis. |
Table I
Results of the Cox proportional
hazard regression analysis.
| Factor | β | HR | P-value | Lower 95% | Upper 95% |
|---|
| Gender | 0.070 | 1.072 | 0.66 | 0.7878 | 1.459 |
| Smoke | 0.194 | 1.214 | 0.19 | 0.9094 | 1.620 |
| Alcohol | 0.089 | 1.093 | 0.55 | 0.8171 | 1.462 |
| Clinical_M | 0.576 | 1.778 | 0.14 | 0.8218 | 3.848 |
| Clinical_N | −0.049 | 0.952 | 0.32 | 0.8648 | 1.049 |
| Clinical_T | 0.023 | 1.023 | 0.76 | 0.8829 | 1.186 |
| Clinical_stage | 0.064 | 1.066 | 0.62 | 0.8269 | 1.374 |
| hsa-mir-643 | −0.123 | 0.884 | 0.39 | 0.6676 | 1.171 |
| hsa-mir-126 | 0.0000418 | 1.000 | 0.44 | 0.9999 | 1.000 |
| hsa-mir-1251 | 0.293 | 1.341 | 0.01 | 1.0897 | 1.649 |
| hsa-mir-521-2 | −0.001 | 0.999 | 1.00 | 0.2949 | 3.386 |
| hsa-mir-618 | 0.204 | 1.226 | 0.01 | 1.0558 | 1.423 |
| hsa-mir-502 | 0.0135 | 1.014 | 0.43 | 0.9799 | 1.048 |
| hsa-mir-328 | 0.0147 | 1.015 | 0.02 | 1.0024 | 1.027 |
| hsa-mir-193a | −0.001 | 0.999 | 0.05 | 0.9982 | 1.000 |
| hsa-mir-1301 | −0.016 | 0.984 | 0.22 | 0.9595 | 1.010 |
| hsa-mir-1231 | 0.775 | 2.170 | 0.09 | 0.8921 | 5.278 |
| hsa-mir-548y | 0.275 | 1.317 | 0.06 | 0.9906 | 1.750 |
| hsa-mir-519c | 0.068 | 1.070 | 0.60 | 0.8274 | 1.385 |
Analysis of PPI network of target
genes
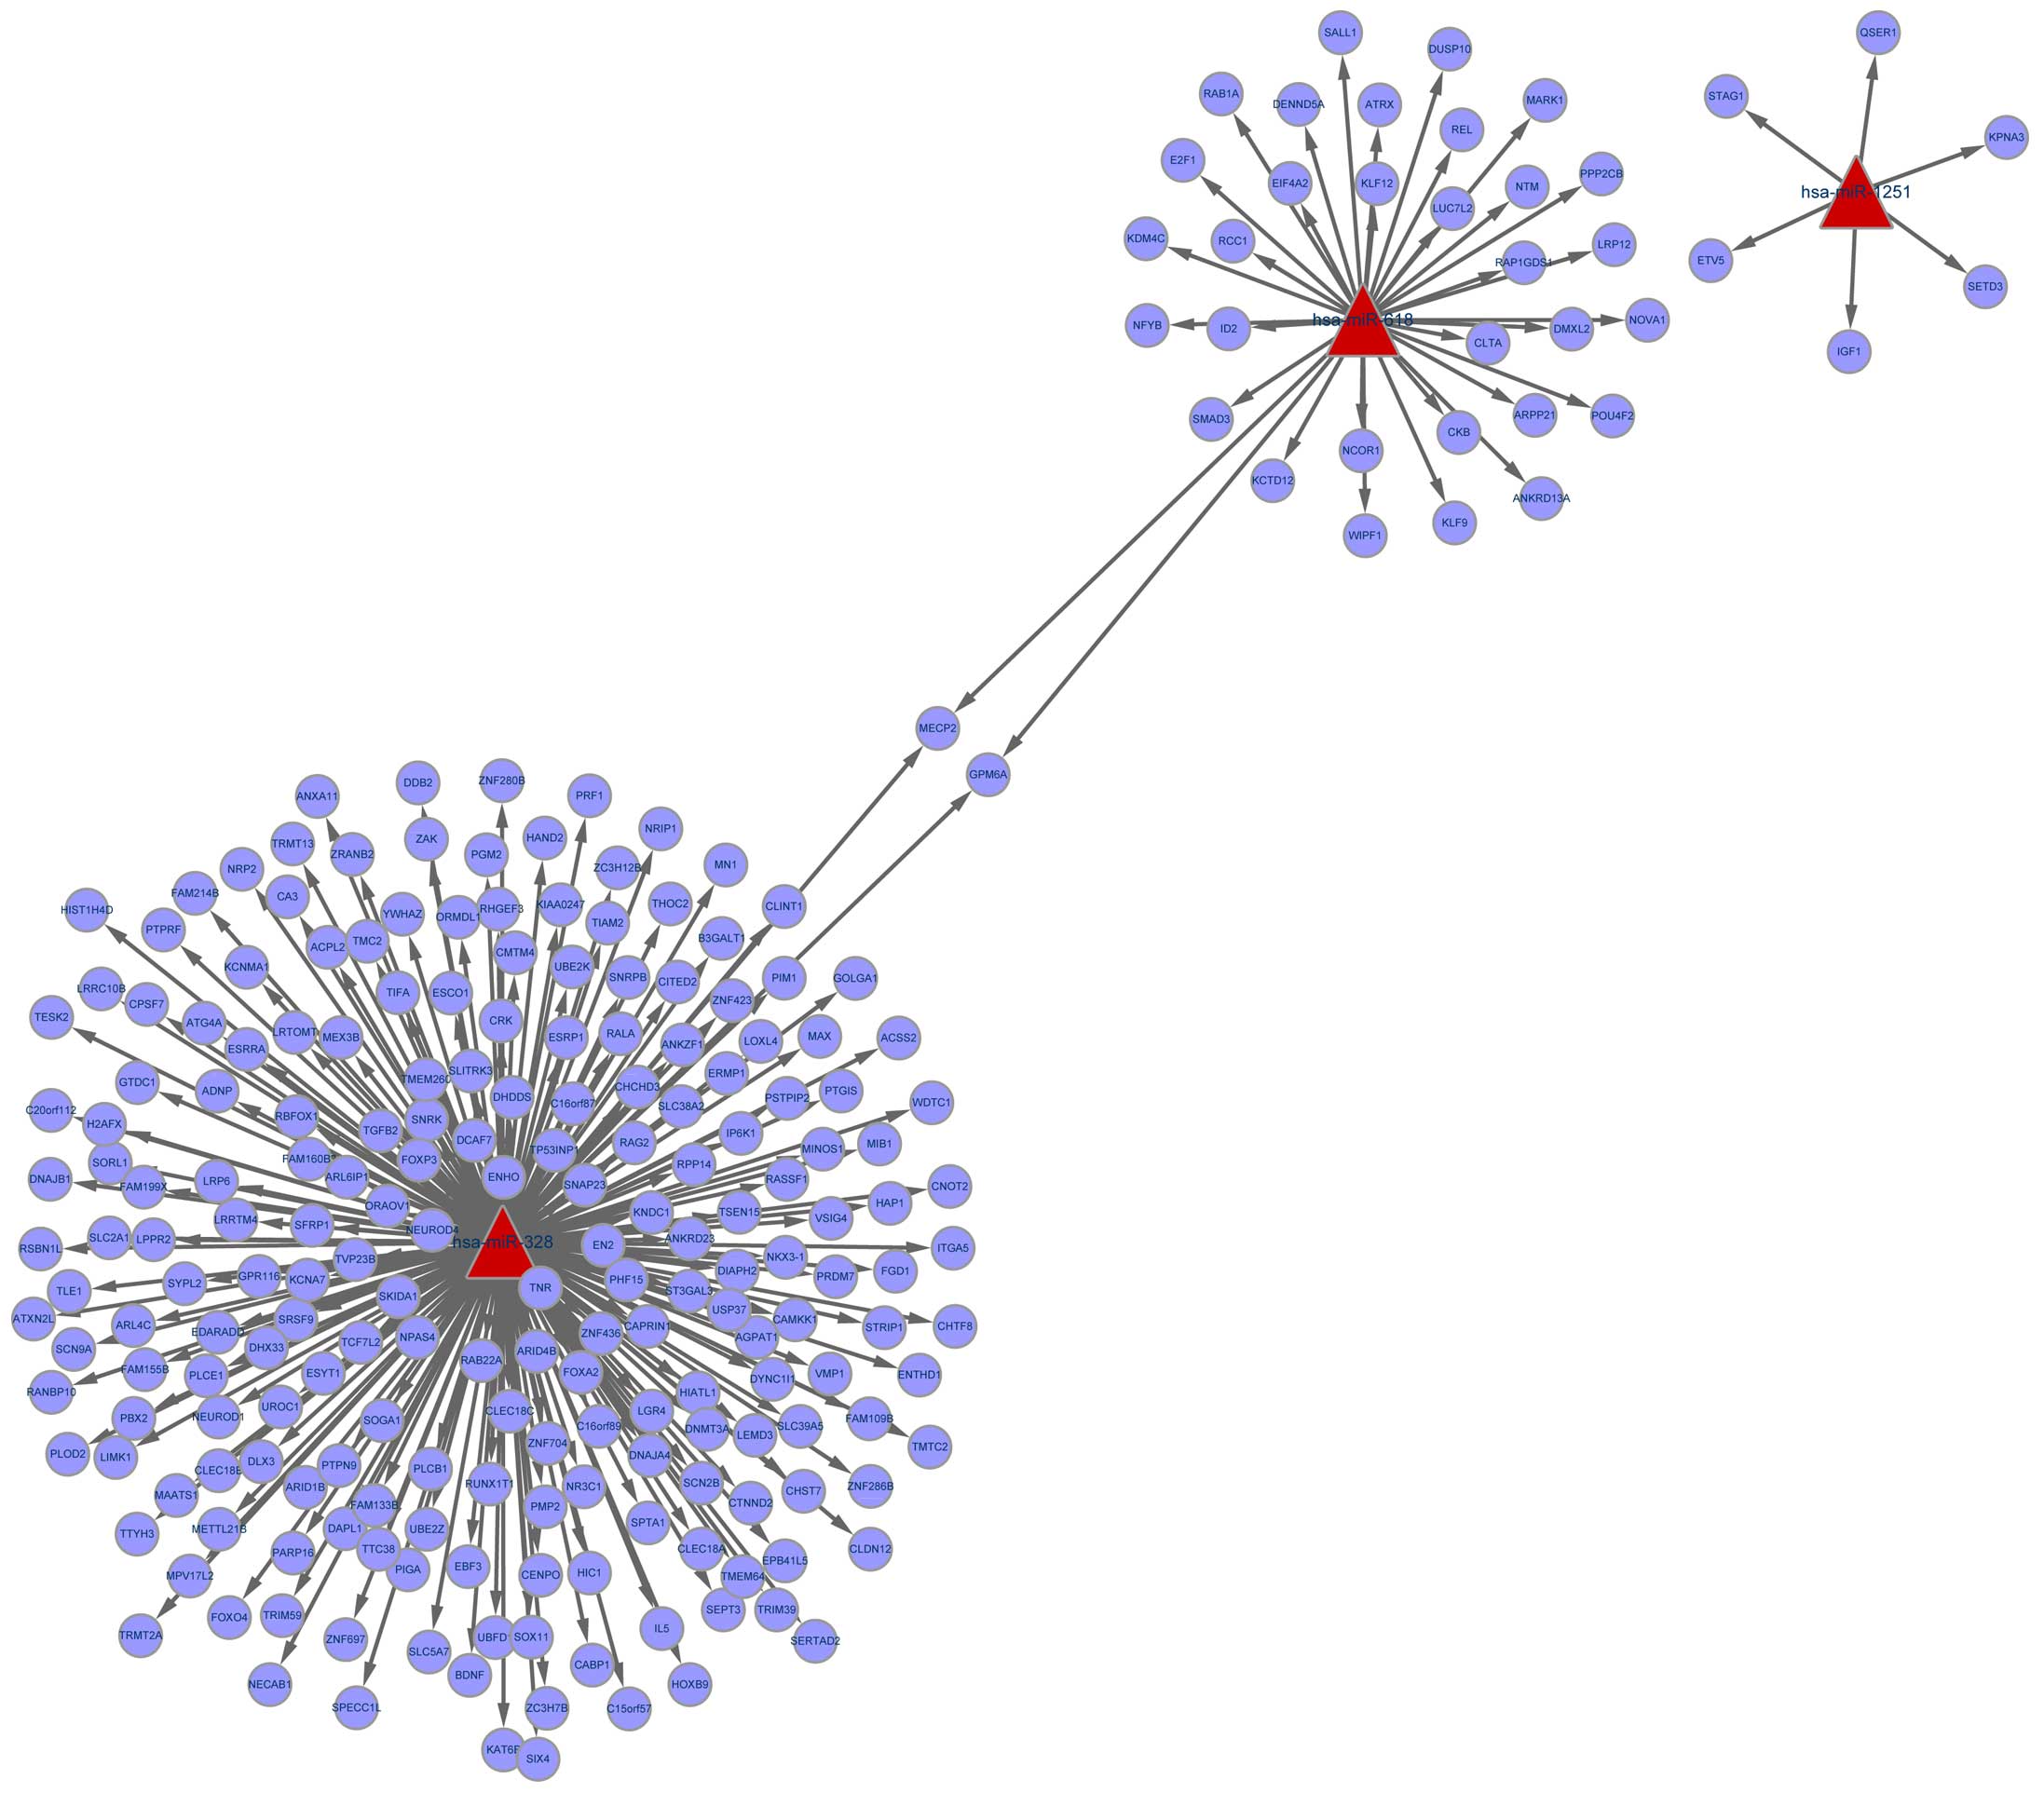
A total of 245 genes were discovered to be regulated
by miR-1251, miR-618 and miR-328. miR-328 modulated most of the
genes, such as MAX. miR-618 regulated genes such as
E2F1 and SMAD3. miR-1251 targeted 6 genes such as
IGF1 (Fig. 1).
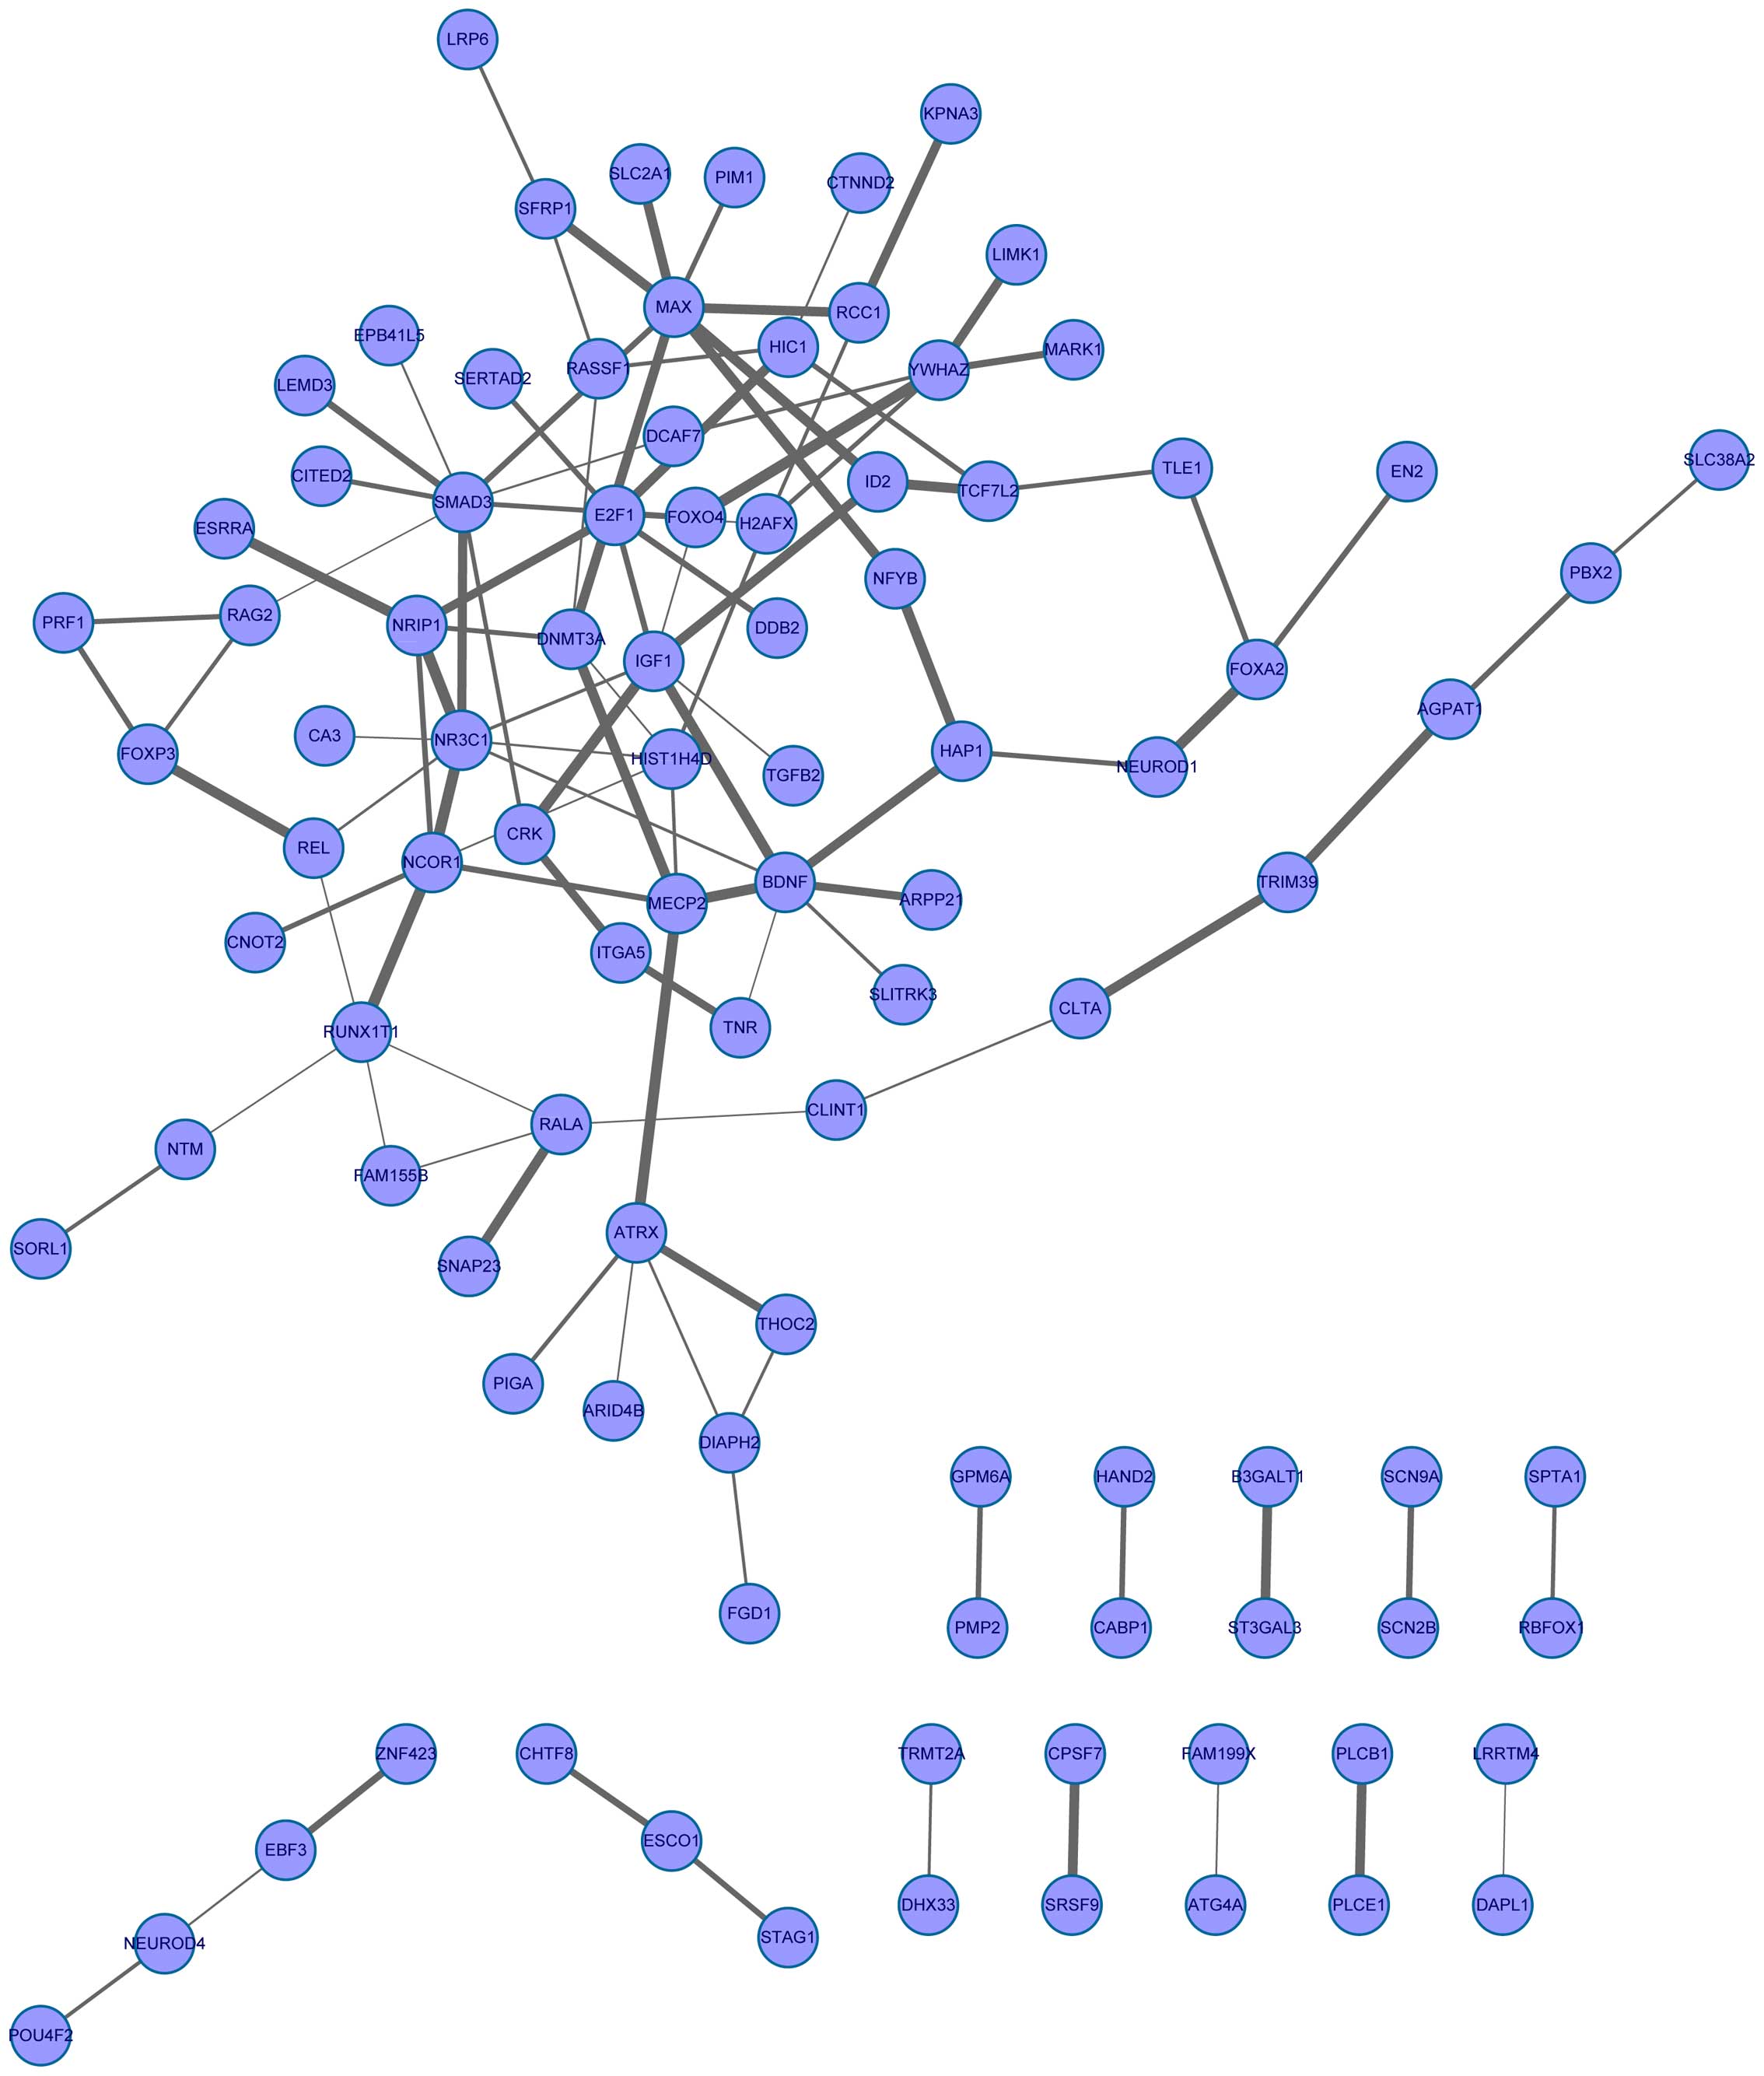
To further analyze the interactions of the target
genes, an interaction network of the target gene was further
constructed based on the STRING database. The PPI network was
composed of 97 nodes and 112 lines (Fig. 2). Several genes had strong
interactions with the other genes. For example, MAX strongly
interacted with 8 genes (e.g. E2F1); E2F1 interacted
with MAX, SMAD3 and E2F1.
Functional analysis of target genes
To investigate the functions of the three miRNAs
that were found to be potentially associated with risk factors of
HNSCC, GO functional and KEGG pathway enrichment analyses of the
target genes were performed. The target genes of hsa-mir-328 were
mainly enriched in the GO terms of positive regulation of
transcription (e.g. IL5 and FOXA2) and transcription
activator activity (e.g. FOXA2 and MAX), as well as
the pathways in cancer (e.g. MAX and SLC2A1)
(Table II). Meanwhile, the target
genes of hsa-mir-618 were mainly enriched in the GO terms of the
negative regulation of transcription from the RNA polymerase II
promoter (e.g. E2F1 and ID2) and transcription
repressor activity (e.g. E2F1 and ID2), as well as
the TGF-β signaling pathway (e.g. ID2 and SMAD3)
(Table III). There were no
significant GO and pathway terms enriched by the target genes of
hsa-mir-1251.
| Table IIThe enriched GO and pathway terms for
target genes of hsa-mir-328. |
Table II
The enriched GO and pathway terms for
target genes of hsa-mir-328.
| Category | Term | Count | P-value | Target genes |
|---|
| GOTERM_BP_FAT | GO:0045941-positive
regulation of transcription | 20 | 5.51E-06 | ESRRA,
IL5, FOXA2, SOX11, ARID1B,
NPAS4, SIX4, FOXO4, FOXP3,
TCF7L2, NRIP1, CITED2, PRDM7,
HAND2, EBF3, NEUROD1, HOXB9,
PBX2, SERTAD2, ZNF423 |
| GOTERM_BP_FAT | GO:0045935-positive
regulation of nucleobase, nucleoside, nucleotide and nucleic acid
metabolic process | 21 | 6.43E-06 | ESRRA,
IL5, FOXA2, SOX11, ARID1B,
NPAS4, SIX4, FOXO4, FOXP3,
TCF7L2, NRIP1, CITED2, PRDM7,
HAND2, EBF3, NEUROD1, HOXB9,
H2AFX, PBX2, SERTAD2, ZNF423 |
| GOTERM_BP_FAT | GO:0010628-positive
regulation of gene expression | 20 | 8.43E-06 | ESRRA,
IL5, FOXA2, SOX11, ARID1B, NPAS4, SIX4,
FOXO4, FOXP3, TCF7L2, NRIP1,
CITED2, PRDM7, HAND2, EBF3,
NEUROD1, HOXB9, PBX2, SERTAD2,
ZNF423 |
| GOTERM_BP_FAT | GO:0051173-positive
regulation of nitrogen compound metabolic process | 21 | 1.02E-05 | ESRRA, IL5, FOXA2,
SOX11, ARID1B, NPAS4, SIX4, FOXO4, FOXP3, TCF7L2,
NRIP1, CITED2, PRDM7, HAND2,
EBF3, NEUROD1, HOXB9, H2AFX,
PBX2, SERTAD2, ZNF423 |
| GOTERM_BP_FAT | GO:0010557-positive
regulation of macromolecule biosynthetic process | 21 | 1.28E-05 | ESRRA,
IL5, FOXA2, SOX11, ARID1B,
NPAS4, SIX4, FOXO4, FOXP3,
TCF7L2, NRIP1, TGFB2, CITED2,
PRDM7, HAND2, EBF3, NEUROD1,
HOXB9, PBX2, SERTAD2, ZNF423 |
| GOTERM_CC_FAT |
GO:0005829-cytosol | 22 | 0.018286095 | ARL6IP1,
FGD1, ARHGEF3, WDTC1, DIAPH2,
NR3C1, FOXO4, ACSS2, TCF7L2,
CAPRIN1, PLCE1, TIAM2, SNRPB,
SPTA1, UROC1, PLCB1, CRK,
CLINT1, TRIM39, PSTPIP2, AGPAT1,
EDARADD |
| GOTERM_CC_FAT | GO:0031981-nuclear
lumen | 22 | 0.042046874 | DNMT3A,
UBE2Z, SOX11, ADNP, TLE1, NR3C1,
NPAS4, ARID1B, ACSS2, TCF7L2,
NRIP1, HAND2, ANXA11, PHF15,
DDB2, SNRPB, DHX33, H2AFX,
DNAJB1, HIST1H4D, PBX2, TSEN15 |
| GOTERM_CC_FAT |
GO:0000785-chromatin | 6 | 0.04651322 | DNMT3A,
ARID4B, MECP2, H2AFX, HIST1H4D,
CITED2 |
| GOTERM_MF_FAT |
GO:0016563-transcription activator
activity | 14 | 5.97E-04 | FOXA2,
NPAS4, ARID1B, FOXP3, FOXO4,
NRIP1, CITED2, MAX, HAND2,
NKX3-1, NEUROD1, HOXB9, ZNF423,
SERTAD2 |
| GOTERM_MF_FAT |
GO:0030528-transcription regulator
activity | 31 | 9.24E-04 | FOXA2,
CNOT2, NR3C1, FOXO4, TCF7L2,
CITED2, HIC1, MAX, HAND2,
NKX3-1, SERTAD2, ZNF423, ESRRA,
SOX11, ADNP, RUNX1T1, MECP2,
TLE1, ARID1B, EN2, NPAS4, SIX4,
FOXP3, NRIP1, DLX3, EBF3,
ZRANB2, NEUROD1, NEUROD4, HOXB9,
PBX2 |
| GOTERM_MF_FAT |
GO:0008134-transcription factor
binding | 15 | 0.001574619 | YWHAZ,
MECP2, PIM1, TLE1, ARID1B,
FOXP3, FOXO4, TCF7L2, NRIP1,
CITED2, MAX, HAND2, NKX3-1,
NEUROD1, SERTAD2 |
| GOTERM_MF_FAT |
GO:0003700-transcription factor
activity | 22 | 0.002276973 | ESRRA, FOXA2,
SOX11, ADNP, RUNX1T1, NR3C1, EN2, SIX4, FOXO4,
FOXP3, TCF7L2, HIC1, CITED2,
DLX3, MAX, HAND2, ZRANB2,
NKX3-1, NEUROD1, HOXB9, PBX2,
ZNF423 |
| GOTERM_MF_FAT | GO:0003677-DNA
binding | 39 | 0.006490896 | FOXA2,
ARID4B, LEMD3, RAG2, NR3C1,
FOXO4, TCF7L2, HIC1, CITED2,
MAX, HAND2, ZNF697, NKX3-1,
H2AFX, HIST1H4D, ZNF423, DNMT3A,
ESCO1, ESRRA, ZNF280B, CHTF8,
SOX11, MECP2, RUNX1T1, ADNP,
ARID1B, SIX4, EN2, NPAS4, FOXP3,
DLX3, EBF3, ZRANB2, DDB2,
NEUROD1, NEUROD4, HOXB9, PBX2,
ZNF436 |
| KEGG_PATHWAY | hsa05200:pathways
in cancer | 9 | 0.025852862 | MAX, RASSF1,
SLC2A1, RUNX1T1, NKX3-1, RALA, CRK, TCF7L2, TGFB2 |
| Table IIIThe enriched GO and pathway terms for
target genes of hsa-mir-618. |
Table III
The enriched GO and pathway terms for
target genes of hsa-mir-618.
| Category | Term | Count | P-value | Target genes |
|---|
| GOTERM_BP_FAT | GO:0000122-negative
regulation of transcription from RNA polymerase II promoter | 7 | 9.04E-06 | E2F1,
ID2, KLF12, MECP2, SMAD3,
POU4F2, NCOR1 |
| GOTERM_BP_FAT | GO:0045892-negative
regulation of transcription, DNA-dependent | 7 | 4.69E-05 | E2F1,
ID2, KLF12, MECP2, SMAD3,
POU4F2, NCOR1 |
| GOTERM_BP_FAT | GO:0051253-negative
regulation of RNA metabolic process | 7 | 5.15E-05 | E2F1,
ID2, KLF12, MECP2, SMAD3,
POU4F2, NCOR1 |
| GOTERM_BP_FAT | GO:0016481-negative
regulation of transcription | 7 | 1.91E-04 | E2F1,
ID2, KLF12, MECP2, SMAD3,
POU4F2, NCOR1 |
| GOTERM_BP_FAT |
GO:0006355-regulation of transcription,
DNA-dependent | 12 | 2.22E-04 | E2F1,
ATRX, ID2, KLF12, KLF9, REL,
MECP2, SMAD3, POU4F2, NFYB,
NCOR1, RAB1A |
| GOTERM_CC_FAT |
GO:0044427-chromosomal part | 5 | 0.002702275 | ATRX,
ID2, PPP2CB, MECP2, RCC1 |
| GOTERM_CC_FAT |
GO:0000785-chromatin | 4 | 0.00353511 | ATRX,
ID2, MECP2, RCC1 |
| GOTERM_CC_FAT |
GO:0005694-chromosome | 5 | 0.00507017 | ATRX,
ID2, PPP2CB, MECP2, RCC1 |
| GOTERM_CC_FAT |
GO:0043228-non-membrane-bounded
organelle | 10 | 0.01099599 | ATRX,
ID2, LRP12, PPP2CB, MECP2,
WIPF1, RCC1, NCOR1, NOVA1,
MARK1 |
| GOTERM_CC_FAT |
GO:0043232-intracellular
non-membrane-bounded organelle | 10 | 0.01099599 | ATRX,
ID2, LRP12, PPP2CB, MECP2,
WIPF1, RCC1, NCOR1, NOVA1,
MARK1 |
| GOTERM_MF_FAT |
GO:0016564-transcription repressor
activity | 6 | 6.08E-04 | E2F1,
ID2, KLF12, MECP2, SMAD3,
NCOR1 |
| GOTERM_MF_FAT |
GO:0003700-transcription factor
activity | 9 | 0.001015664 | E2F1,
KLF12, KLF9, REL, SALL1, SMAD3,
POU4F2, NFYB, NCOR1 |
| GOTERM_MF_FAT |
GO:0030528-transcription regulator
activity | 11 | 0.001104363 | E2F1,
ID2, KLF12, KLF9, REL, SALL1,
MECP2, SMAD3, POU4F2, NFYB,
NCOR1 |
| GOTERM_MF_FAT |
GO:0003714-transcription corepressor
activity | 4 | 0.004030547 | E2F1,
KLF12, MECP2, NCOR1 |
| GOTERM_MF_FAT |
GO:0008134-transcription factor
binding | 6 | 0.005109515 | E2F1,
KLF12, MECP2, SMAD3, NCOR1,
RAB1A |
| KEGG_PATHWAY | hsa04350:TGF-beta
signaling pathway | 3 | 0.005747228 | ID2,
PPP2CB, SMAD3 |
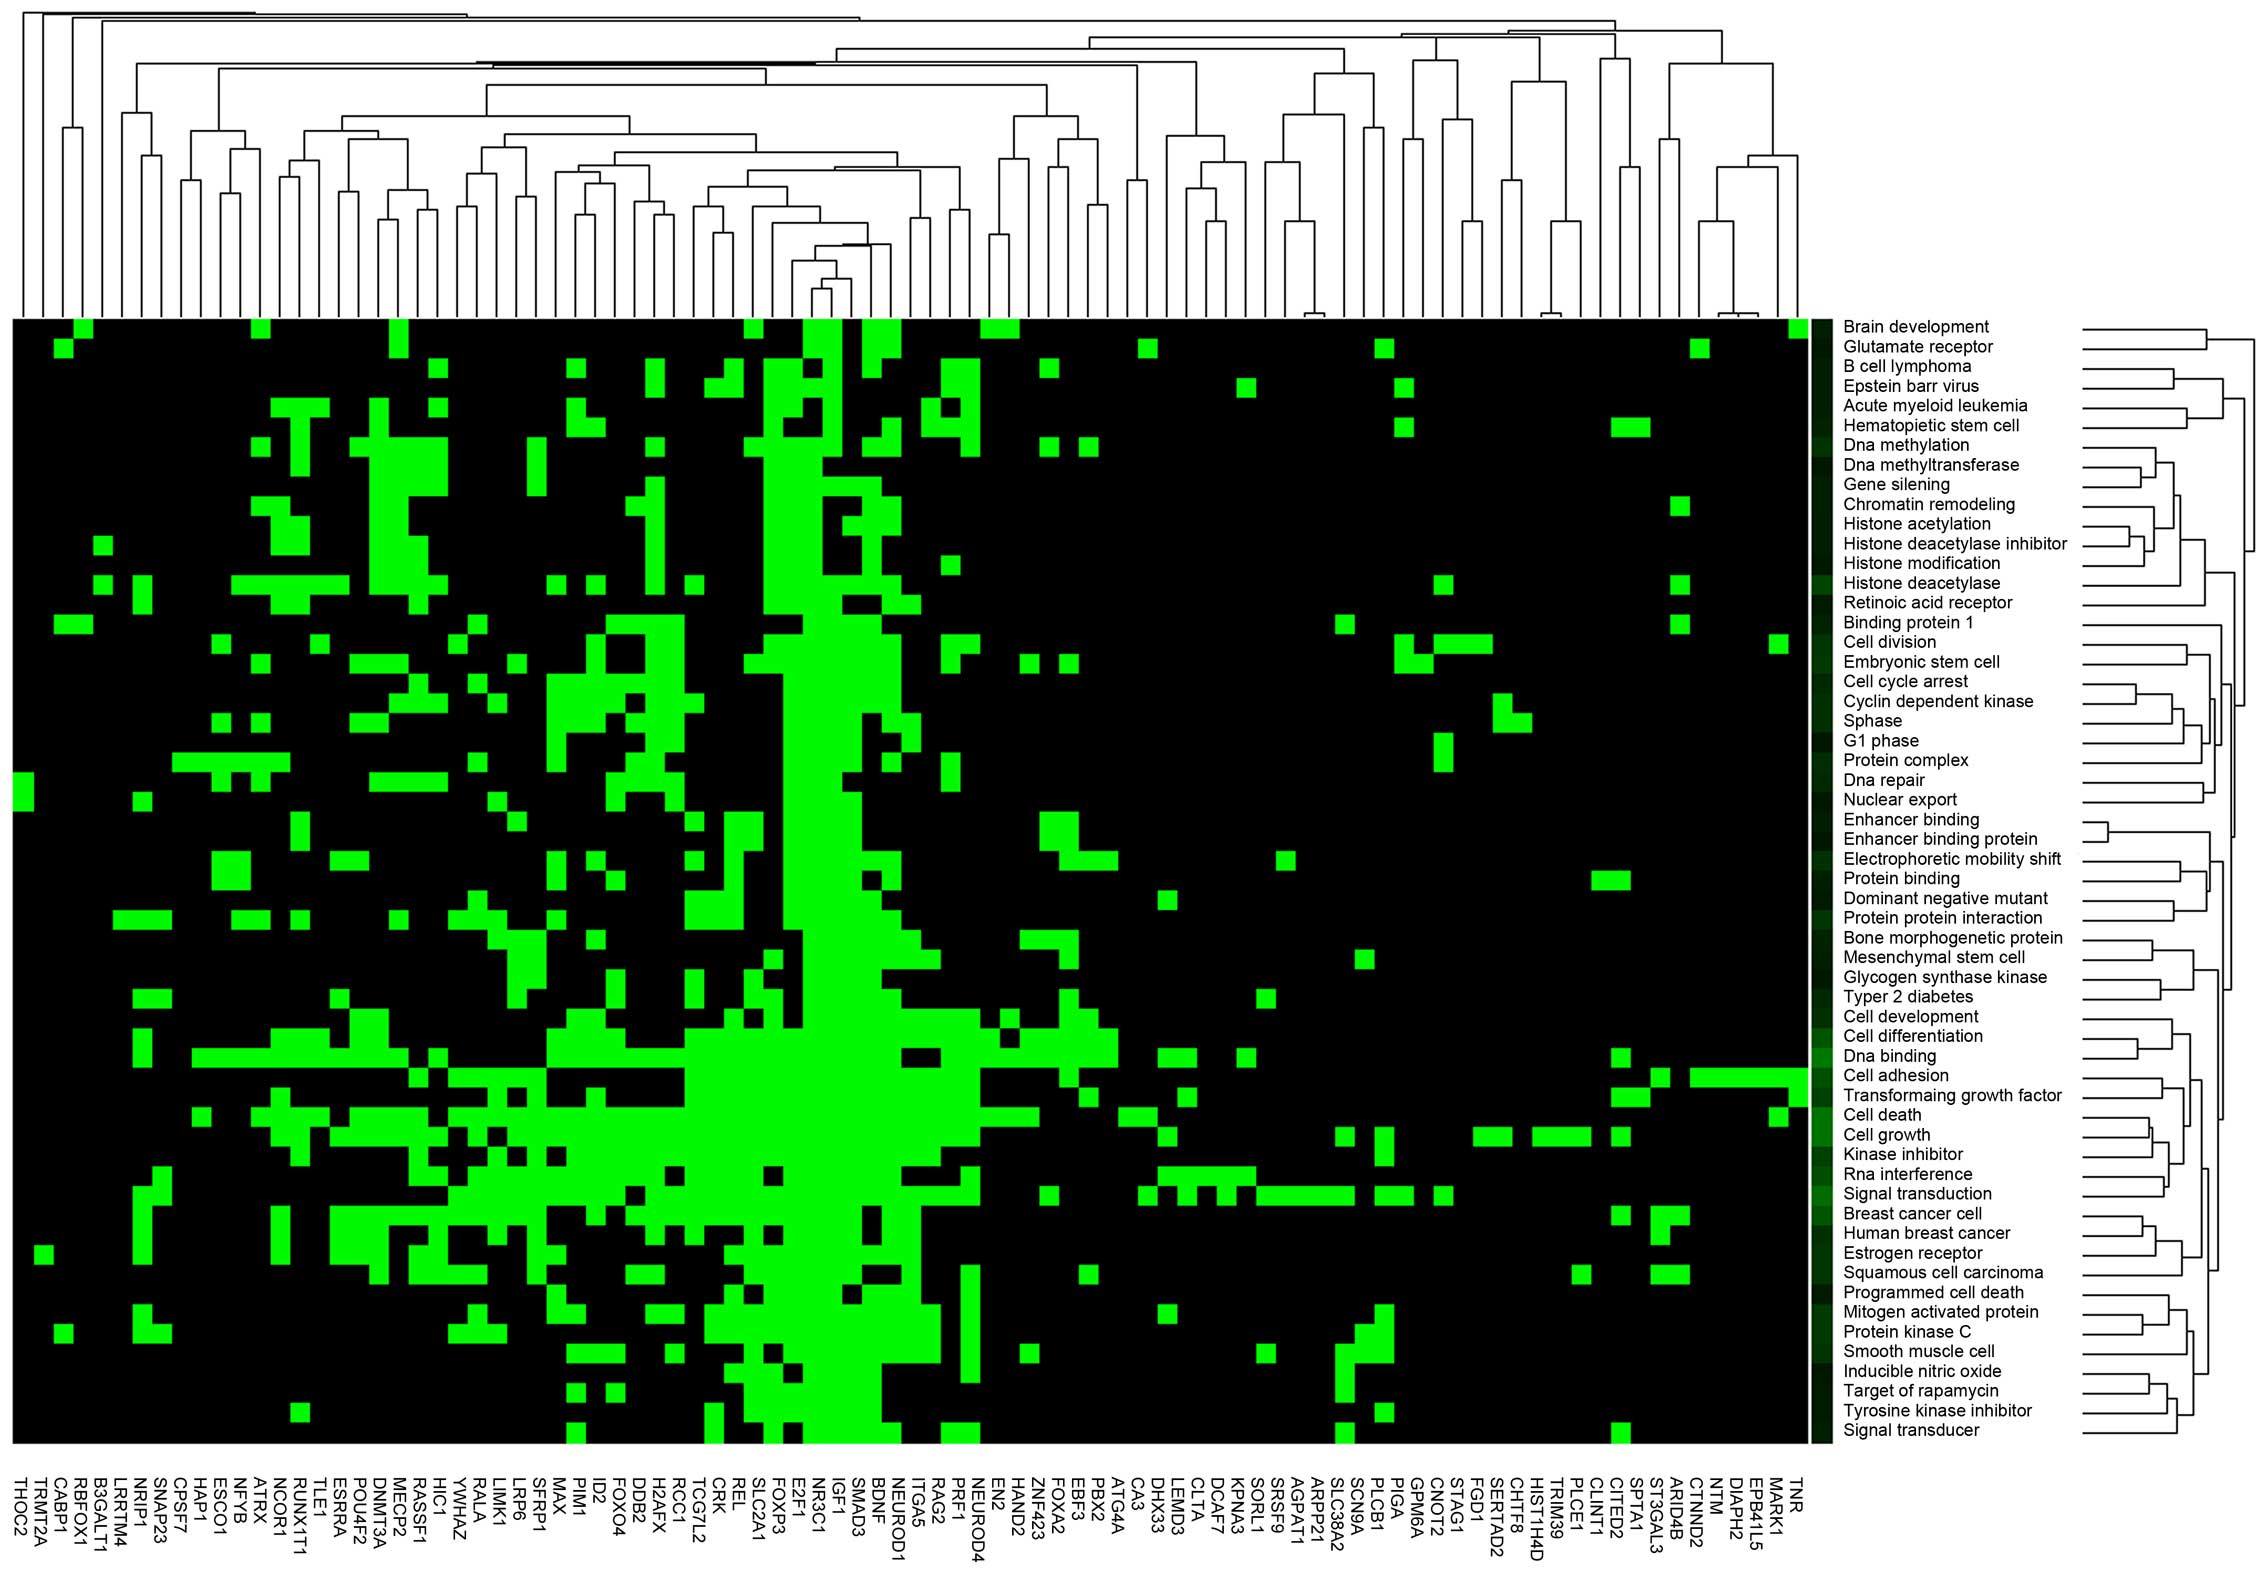
Furthermore, to further reveal the functions of 97
genes in the PPI interaction network, functional clustering and
pathway enrichment analysis were performed. According to the
functional clustering, 19 clusters were enriched. A set of genes
(e.g. E2F1, NR3C1, IGF1, SMAD3 and
BDNF) were significantly enriched in multiple functional
clusters, such as cell death and signal transduction (Fig. 3). Additionally, 26 genes in the
network were markedly enriched in 9 pathway clusters, such as
pathways in cancer (e.g. E2F1, MAX and SMAD3),
cell cycle (e.g. E2F1 and SMAD3) and the Wnt
signaling pathway (e.g. SMAD3) (Table IV).
| Table IVEnriched pathways of the target genes
in the protein-protein interaction network. |
Table IV
Enriched pathways of the target genes
in the protein-protein interaction network.
| Cluster | Pathway | Count | P-value | Genes |
|---|
| 1 | KEGG_Pathways in
cancer | 11 | 3.74E-06 | CRK,
E2F1, IGF1, MAX, RALA, RASSF1,
RUNX1T1, SLC2A1, SMAD3, TCF7L2,
TGFB2 |
| KEGG_Chronic
myeloid leukemia | 4 | 0.003836 | CRK,
E2F1, SMAD3, TGFB2 |
| KEGG_Renal cell
carcinoma | 3 | 0.023754 | CRK,
SLC2A1, TGFB2 |
| 2 | KEGG_Cell
cycle | 5 | 0.000997 | E2F1,
SMAD3, STAG1, TGFB2, YWHAZ |
| BIOCARTA_G1
pathway | 3 | 0.001847 | E2F1,
SMAD3, TGFB2 |
| KEGG_Pancreatic
cancer | 4 | 0.003295 | E2F1,
RALA, SMAD3, TGFB2 |
| KEGG_Colorectal
cancer | 3 | 0.017246 | SMAD3,
TCF7L2, TGFB2 |
| KEGG_TGFβ signaling
pathway | 3 | 0.039070 | ID2,
SMAD3, TGFB2 |
| 3 | KEGG_Acute myeloid
leukemia | 3 | 0.013764 | PIM1,
RUNX1T1, TCF7L2 |
| 4 | BIOCARTA_PPARA
pathway | 3 | 0.014425 | CITED2,
NCOR1, NRIP1 |
| 5 | KEGG_Wnt signaling
pathway | 5 | 0.005182 | LRP6,
PLCB1, SFRP1, SMAD3, TCF7L2 |
| Wnt_Signaling | 3 | 0.043830 | LRP6,
SFRP1, TLE1 |
| 6 | REACTOME_Clathrin
derived vesicle budding | 3 | 0.016514 | CLINT1,
CLTA, SNAP23 |
| REACTOME_Membrane
trafficking | 3 | 0.031420 | CLINT1,
CLTA, SNAP23 |
| 7 | ST_Integrin
signaling pathway | 3 | 0.031420 | CRK,
ITGA5, RALA |
| 8 | KEGG_Hypertrophic
cardiomyopathy HCM | 3 | 0.036795 | IGF1,
ITGA5, TGFB2 |
| KEGG_Dilated
cardiomyopathy | 3 | 0.045063 | IGF1,
ITGA5, TGFB2 |
| 9 | KEGG_Prostate
cancer | 3 | 0.043830 | E2F1,
IGF1, TCF7L2 |
Discussion
HNSCC is a common type of non-skin cancer worldwide
(1). In the present study, using
the miRNA expression profile and clinical data of 397 cases in the
TCGA database, miR-1251, miR-618 and miR-328 were screened out to
be significantly associated with risk factors for HNSCC, based on
the survival analysis and Cox regression analysis. A set of target
genes of these three miRNAs were significantly enriched in a series
of GO functions and pathways. For example, targets of miR-618,
E2F1 and SMAD3, were significantly enriched in
functions concerning regulation of transcription, and SMAD3
was also markedly enriched in the TGF-β signaling pathway. These
two genes interacted with each other in the PPI network.
E2F1 encodes an E2F transcription factor,
which mediates cell cycle and functions as a tumor-suppressor
protein (23). Overexpression of
E2F1 in vitro and in vivo suppresses HNSCC cell
growth through induction of apoptosis (24). Additionally, single nucleotide
polymorphisms (SNPs) of E2F1 are highly correlated with the
risk of HNSCC (25). Moreover, as a
transcriptional modulator and signal transducer, SMAD3
mediates multiple signaling pathways and plays a role in the
regulation of carcinogenesis (26).
In the present study, SMAD3 was predicted to interact with
E2F1, which has been reported in a previous study (27). In HNSCC, SMAD3 is
inactivated, which is associated with higher overall survival of
patients (28). In the present
study, SMAD3 was markedly enriched in the TGF-β signaling
pathway. The association of SMAD3 and TGF-β signaling has
been reported in numerous studies (29–31). A
previous study reported that overexpression of death-associated
protein kinase-related apoptosis-inducing kinase 1 (DRAK1)
binds to Smad3, and then inhibits TGF-β1 tumor suppressor activity
in HNSCC (32). Additionally, SNPs
in miR-618 are implicated in cancer risk (33). miR-618 has been discovered to be
progressively expressed in esophageal adenocarcinoma (34). There is no evidence that miR-618 is
associated with HNSCC risk or survival rate. Taken together,
miR-618 may play a crucial role in the prognosis of HNSCC by
regulating the genes E2F1 and SMAD3.
Furthermore, in the PPI network, the target gene of
miR-328, MAX, interacted with multiple genes, such as
E2F1. MAX was significantly enriched in the function
of transcription activator activity and the pathways in cancer. MYC
associated factor X (MAX) encodes a transcription factor
belonging to the helix-loop-helix leucine zipper (bHLHZ) family
(35). It is able to form a
homodimer and heterodimer with MYC, which is an oncoprotein
correlated with cell proliferation, differentiation and apoptosis
(35). There is no evidence to
prove the association of MAX with HNSCC. However,
overexpression of c-myc has been reported to be associated with the
poor prognosis of HNSCC (36).
Furthermore, c-myc promotes elevated levels of glutaminolysis and
glutamic acid, which marker aggressive tumorigenesis in HNSCC
(37). Additionally, miR-328 has
been confirmed to be highly expressed in salinomycin-treated HNSCC
cells (38). Additionally, the
expression level of miR-328 was found to be significantly higher in
early-stage non-small cell lung cancer (NSCLC), and shows good
diagnostic accuracy in NSCLC patients (39). These results indicate an important
role of miR-328 in cancer. Therefore, miR-328 may play a pivotal
role in the progression of HNSCC via targeting MAX, and it
may be associated with the survival time of HNSCC patients.
In addition, the target gene of miR-1251,
IGF1, also interacted with E2F1 in the PPI network,
and it was enriched in multiple function clusters, such as cell
death and signal transduction. Insulin-like growth factor I
(IGF1) is involved in regulating cell growth and development
(40), and the activation of
multiple signaling pathways in head and neck cancer (41). Previous studies have demonstrated
that IGF1 is able to stimulate the expression of vascular
endothelial growth factor, which is correlated with increased
progression and poor prognosis of HNSCC (42,43).
Moreover, miR-1251 has been discovered to be downregulated in
nasopharyngeal carcinoma (44).
There is no study to report the association of miR-1251 with HNSCC.
Therefore, miR-1251 may play a crucial role in the progression of
HNSCC via mediating the expression of IGF1, and it may be
closely associated with the survival of HNSCC patients.
Despite the aforementioned results, there were
several limitations in the present study. The predicted results
should be confirmed by laboratory data. In our further studies, the
expression levels of miR-1251, miR-618 and miR-328, as well as the
regulatory relationships of them and their target genes, will be
validated in a large scale of patients with HNSCC.
In conclusion, miR-1251, miR-618 and miR-328 were
predicted to be associated with the survival time of HNSCC
patients. They may play pivotal roles in the progression of HNSCC
via a set of genes associated with transcriptional regulation or
signal transduction, such as MAX, E2F1, SMAD3
and IGF1. The three miRNAs were considered as novel
prognostic markers in HNSCC. These findings contribute to our
further experimental study, and may provide new information for the
estimation of the prognosis of HNSCC.
Acknowledgments
The present study was supported by the Natural
Science Foundation of Liaoning Province (no. 201202287).
References
|
1
|
Stransky N, Egloff AM, Tward AD, Kostic
AD, Cibulskis K, Sivachenko A, Kryukov GV, Lawrence MS, Sougnez C,
McKenna A, et al: The mutational landscape of head and neck
squamous cell carcinoma. Science. 333:1157–1160. 2011. View Article : Google Scholar : PubMed/NCBI
|
|
2
|
Krol J, Loedige I and Filipowicz W: The
widespread regulation of microRNA biogenesis, function and decay.
Nat Rev Genet. 11:597–610. 2010.PubMed/NCBI
|
|
3
|
Farazi TA, Hoell JI, Morozov P and Tuschl
T: MicroRNAs in Human Cancer. MicroRNA Cancer Regulation, Advanced
Concepts, Bioinformatics and Systems Biology Tools. Schmitz U,
Wolkenhauer O and Vera J: Springer; pp. 1–20. 2013
|
|
4
|
Kinoshita T, Hanazawa T, Nohata N, Kikkawa
N, Enokida H, Yoshino H, Yamasaki T, Hidaka H, Nakagawa M, Okamoto
Y, et al: Tumor suppressive microRNA-218 inhibits cancer cell
migration and invasion through targeting laminin-332 in head and
neck squamous cell carcinoma. Oncotarget. 3:1386–1400. 2012.
View Article : Google Scholar : PubMed/NCBI
|
|
5
|
Jimenez L, Sharma VP, Lim J, Angeletti R,
Condeelis J, Harris T, Prystowsky MB, Childs G and Segall JE:
MicroRNA-375 impairs head and neck squamous cell carcinoma invasion
by suppressing invadopodia activity. Cancer Res. 74(1452): 2014
View Article : Google Scholar
|
|
6
|
Jimenez L, Harris T, Kawachi N, Belbin T,
Schlecht N, Lim J, Angeletti R, Prystowsky MB, Childs G and Segall
J: MicroRNA-375 regulates tumor invasion and metastasis phenotypes
and is associated with poor outcome in head and neck squamous cell
carcinoma. Cancer Res. 73(4939): 2013 View Article : Google Scholar
|
|
7
|
Langevin SM, Stone RA, Bunker CH,
Lyons-Weiler MA, LaFramboise WA, Kelly L, Seethala RR, Grandis JR,
Sobol RW and Taioli E: MicroRNA-137 promoter methylation is
associated with poorer overall survival in patients with squamous
cell carcinoma of the head and neck. Cancer. 117:1454–1462. 2011.
View Article : Google Scholar : PubMed/NCBI
|
|
8
|
Howard JD, Cheng H, Ratner E, Fertig EJ,
Perez J, Quon H, Considine M, Ochs M, Weidhaas J and Chung CH:
MicroRNA profiling reveals miR-205 upregulation is associated with
head and neck squamous cell carcinoma and modulates E2F1 signaling.
Cancer Res. 73(Suppl 8): 3100. 2013. View Article : Google Scholar
|
|
9
|
Therneau TM: Modeling survival data.
Extending the Cox Model. Springer; 2000, View Article : Google Scholar
|
|
10
|
Timsit JF, Alberti C and Chevret S: Cox
proportional hazards regression analysis. Rev Mal Respir.
22:1058–1064. 2005.In French. View Article : Google Scholar : PubMed/NCBI
|
|
11
|
Ferguson N, Datta S and Brock G: msSurv,
an R package for nonparametric estimation of multistate models. J
Stat Software. 50:1–24. 2012. View Article : Google Scholar
|
|
12
|
Piriyapongsa J, Bootchai C, Ngamphiw C and
Tongsima S: microPIR: An integrated database of microRNA target
sites within human promoter sequences. PLoS One. 7:e338882012.
View Article : Google Scholar : PubMed/NCBI
|
|
13
|
Dweep H, Sticht C, Pandey P and Gretz N:
miRWalk - database: Prediction of possible miRNA binding sites by
'walking' the genes of three genomes. J Biomed Inform. 44:839–847.
2011. View Article : Google Scholar : PubMed/NCBI
|
|
14
|
Enright AJ, John B, Gaul U, Tuschl T,
Sander C and Marks DS: MicroRNA targets in Drosophila. Genome Biol.
5:R1. 2003. View Article : Google Scholar
|
|
15
|
Wang X and El Naqa IM: Prediction of both
conserved and nonconserved microRNA targets in animals.
Bioinformatics. 24:325–332. 2008. View Article : Google Scholar
|
|
16
|
Krek A, Grün D, Poy MN, Wolf R, Rosenberg
L, Epstein EJ, MacMenamin P, da Piedade I, Gunsalus KC, Stoffel M,
et al: Combinatorial microRNA target predictions. Nat Genet.
37:495–500. 2005. View
Article : Google Scholar : PubMed/NCBI
|
|
17
|
Thomas M, Lieberman J and Lal A:
Desperately seeking microRNA targets. Nat Struct Mol Biol.
17:1169–1174. 2010. View Article : Google Scholar : PubMed/NCBI
|
|
18
|
Lewis BP, Shih IH, Jones-Rhoades MW,
Bartel DP and Burge CB: Prediction of mammalian microRNA targets.
Cell. 115:787–798. 2003. View Article : Google Scholar : PubMed/NCBI
|
|
19
|
Franceschini A, Szklarczyk D, Frankild S,
Kuhn M, Simonovic M, Roth A, Lin J, Minguez P, Bork P, von Mering
C, et al: STRING v9.1: Protein-protein interaction networks, with
increased coverage and integration. Nucleic Acids Res.
41:D808–D815. 2013. View Article : Google Scholar :
|
|
20
|
Smoot ME, Ono K, Ruscheinski J, Wang PL
and Ideker T: Cytoscape 2.8: New features for data integration and
network visualization. Bioinformatics. 27:431–432. 2011. View Article : Google Scholar :
|
|
21
|
Huang W, Sherman BT and Lempicki RA:
Systematic and integrative analysis of large gene lists using DAVID
bioinformatics resources. Nat Protoc. 4:44–57. 2009. View Article : Google Scholar
|
|
22
|
Huang ZX, Tian HY, Hu ZF, Zhou YB, Zhao J
and Yao KT: GenCLiP: A software program for clustering gene lists
by literature profiling and constructing gene co-occurrence
networks related to custom keywords. BMC Bioinformatics. 9:3082008.
View Article : Google Scholar : PubMed/NCBI
|
|
23
|
Ting JH: Novel roles of cell cycle
regulator E2F1 in the CNS: Implications for synaptic damage in
HIV-associated neurocognitive disorders. University of
Pennsylvania; Scholarly Commons: Publicly Accessible Penn
Dissertations. Paper 1471. 2014, http://repository.upenn.edu/edissertations/1471.
|
|
24
|
Liu TJ, Wang M, Breau RL, Henderson Y,
El-Naggar AK, Steck KD, Sicard MW and Clayman GL: Apoptosis
induction by E2F-1 via adenoviral-mediated gene transfer results in
growth suppression of head and neck squamous cell carcinoma cell
lines. Cancer Gene Ther. 6:163–171. 1999. View Article : Google Scholar : PubMed/NCBI
|
|
25
|
Lu M, Liu Z, Yu H, Wang LE, Li G, Sturgis
EM, Johnson DG and Wei Q: Combined effects of E2F1 and E2F2
polymorphisms on risk and early onset of squamous cell carcinoma of
the head and neck. Mol Carcinog. 51(Suppl 1): E132–E141. 2012.
View Article : Google Scholar : PubMed/NCBI
|
|
26
|
Murata M, Yoshida K and Matsuzaki K: Early
chronic inflammation and subsequent somatic mutations shift
phospho-Smad3 signaling from tumor-suppression to
fibro-carcinogenesis in human chronic liver diseases.
Hepatocellular Carcinoma-Future Outlook. Kaseb A: InTech; 2013,
View Article : Google Scholar : Available from:
http://www.intechopen.com/books/hepatocellular-carcinoma-future-outlook/early-chronic-inflammation-and-subsequent-somatic-mutations-shift-phospho-smad3-signaling-from-tumor.
|
|
27
|
Kowalik TF: Smad about E2F. TGFbeta
repression of c-Myc via a Smad3/E2F/p107 complex. Mol Cell. 10:7–8.
2002. View Article : Google Scholar : PubMed/NCBI
|
|
28
|
Xie W, Aisner S, Baredes S, Sreepada G,
Shah R and Reiss M: Alterations of Smad expression and activation
in defining 2 subtypes of human head and neck squamous cell
carcinoma. Head Neck. 35:76–85. 2013. View Article : Google Scholar
|
|
29
|
Derynck R and Zhang YE: Smad-dependent and
Smad-independent pathways in TGF-β family signalling. Nature.
425:577–584. 2003. View Article : Google Scholar : PubMed/NCBI
|
|
30
|
Massagué J and Wotton D: Transcriptional
control by the TGF-β/Smad signaling system. EMBO J. 19:1745–1754.
2000. View Article : Google Scholar
|
|
31
|
Heldin CH, Miyazono K and ten Dijke P:
TGF-β signalling from cell membrane to nucleus through SMAD
proteins. Nature. 390:465–471. 1997. View
Article : Google Scholar : PubMed/NCBI
|
|
32
|
Park Y, Kim W, Lee J, Park J, Cho JK, Pang
K, Lee J, Kim D, Park SW, Yang KM, et al: Cytoplasmic DRAK1
overexpressed in head and neck cancers inhibits TGF-β1 tumor
suppressor activity by binding to Smad3 to interrupt its complex
formation with Smad4. Oncogene. 34:5037–5045. 2015. View Article : Google Scholar
|
|
33
|
Pelletier C and Weidhaas JB: MicroRNA
binding site polymorphisms as biomarkers of cancer risk. Expert Rev
Mol Diagn. 10:817–829. 2010. View Article : Google Scholar : PubMed/NCBI
|
|
34
|
Wu X, Ajani JA, Gu J, Chang DW, Tan W,
Hildebrandt MA, Huang M, Wang KK and Hawk E: MicroRNA expression
signatures during malignant progression from Barrett's esophagus to
esophageal adenocarcinoma. Cancer Prev Res. 6:196–205. 2013.
View Article : Google Scholar
|
|
35
|
Blackwood EM and Eisenman RN: Max: A
helix-loop-helix zipper protein that forms a sequence-specific
DNA-binding complex with Myc. Science. 251:1211–1217. 1991.
View Article : Google Scholar : PubMed/NCBI
|
|
36
|
Field JK, Spandidos DA, Stell PM, Vaughan
ED, Evan GI and Moore JP: Elevated expression of the c-myc
oncoprotein correlates with poor prognosis in head and neck
squamous cell carcinoma. Oncogene. 4:1463–1468. 1989.PubMed/NCBI
|
|
37
|
Banda AD, Cortes MB, Kamarajan P,
Rajendiran T, Chinnaiyan AM and Kapila YL: Glutamic acid and
glutaminolysis mark aggressive tumorigenesis in head and neck
squamous cell carcinoma. Cancer Res. 75(Suppl 15): 11922015.
View Article : Google Scholar
|
|
38
|
Kuo SZ, Blair KJ, Rahimy E, Kiang A,
Abhold E, Fan JB, Wang-Rodriguez J, Altuna X and Ongkeko WM:
Salinomycin induces cell death and differentiation in head and neck
squamous cell carcinoma stem cells despite activation of
epithelial-mesenchymal transition and Akt. BMC Cancer. 12:5562012.
View Article : Google Scholar : PubMed/NCBI
|
|
39
|
Ulivi P, Foschi G, Mengozzi M, Scarpi E,
Silvestrini R, Amadori D and Zoli W: Peripheral blood miR-328
expression as a potential biomarker for the early diagnosis of
NSCLC. Int J Mol Sci. 14:10332–10342. 2013. View Article : Google Scholar : PubMed/NCBI
|
|
40
|
Woods KA, Camacho-Hübner C, Savage MO and
Clark AJ: Intrauterine growth retardation and postnatal growth
failure associated with deletion of the insulin-like growth factor
I gene. N Engl J Med. 335:1363–1367. 1996. View Article : Google Scholar : PubMed/NCBI
|
|
41
|
Rosenzweig SA and Holmes CO: Insulin-like
growth factor-1 receptors in head and neck cancer. Molecular
Determinants of Head and Neck Cancer. Springer. 113–130. 2014.
View Article : Google Scholar
|
|
42
|
Slomiany MG, Black LA, Kibbey MM, Day TA
and Rosenzweig SA: IGF-1 induced vascular endothelial growth factor
secretion in head and neck squamous cell carcinoma. Biochem Biophys
Res Commun. 342:851–858. 2006. View Article : Google Scholar : PubMed/NCBI
|
|
43
|
Jameson MJ, Beckler AD, Taniguchi LE,
Allak A, Vanwagner LB, Lee NG, Thomsen WC, Hubbard MA and Thomas
CY: Activation of the insulin-like growth factor-1 receptor induces
resistance to epidermal growth factor receptor antagonism in head
and neck squamous carcinoma cells. Mol Cancer Ther. 10:2124–2134.
2011. View Article : Google Scholar : PubMed/NCBI
|
|
44
|
Plieskatt JL, Rinaldi G, Feng Y, Levine
PH, Easley S, Martinez E, Hashmi S, Sadeghi N, Brindley PJ, Bethony
JM, et al: Methods and matrices: Approaches to identifying miRNAs
for nasopharyngeal carcinoma. J Transl Med. 12:32014. View Article : Google Scholar : PubMed/NCBI
|