Introduction
There are four relatively homologous human
tropomyosin (TPM) genes which exhibit varying degrees of expression
in human tissues (1–6). Expression has been shown to be
modulated at the transcriptional and translational level (7,8).
Multiple molecular TPM isoforms have been identified, which are the
results of alternative promoters or alternative splicing.
Tropomyosin proteins have been shown to make up some
of the stress fibers of human epithelial cells, and differences in
their expression have been demonstrated in malignant breast
epithelial cell lines and tissues compared to 'normal' breast cell
lines and tissues (1,3,9–15).
Much of this work has focused on TPM2β (also known as TM1) and
TPMIγ and δ. Recently, we have published on the expression of four
novel TPM1 gene RNA isoforms (λ, µ, ν and ξ) in human breast
cell lines (16). TPM1λ was the
most frequent novel isoform expressed in the malignant breast cell
lines, and it was not found in a normal breast epithelial cell
line. Its expression was inversely correlated in a statistically
significant degree with stress fiber formation in these human
breast epithelial cell lines. Also, the expression of TPM1δ, but
not TPM1γ, was positively correlated with stress fiber formation.
We have also published on the expression of novel TPM2 gene
isoforms (TPM2δ-η) in human cardiac tissues (17). Given the above observations, we
decided to re-examine TPM2 isoform expression in human breast
cancer cell lines. Hence, using a series of primer pairs and probes
and four different exon-specific human tropomyosin protein
antibodies, we examined TPM2 gene RNA and protein isoform
expression in nine malignant and three benign human breast cell
lines. Two human B-lymphocytic cell lines from two of the same
breast cancer patients, and human adult and fetal cardiac and adult
skeletal muscle were used as controls. The cell lines were also
examined for stress fiber formation.
Materials and methods
RNA of human adult and fetal cardiac tissue was
obtained from Zyagen (San Diego, CA, USA); similar protein samples
were obtained from Imgenex (San Diego, CA, USA). Human skeletal
muscle proteins were obtained from Imgenex. The non-malignant human
breast cell lines MCF-10A, MCF-12A and MCF-184B5, the normal human
B-cell lines HCC-1143 (BL) and HCC-187 (BL), and the malignant
human breast cancer cell lines HCC-1143, HCC-1187, BT-474,
mDAMB-157, HCC-1806, HCC-1419, mDAMB-453, mDAMB-468, and MCF7 were
obtained from American Type Culture Collection (ATCC; Manassas, VA,
USA).
Cell culture
MCF7 cells were cultured in Eagle's minimum
essential medium (ATCC) with 0.01 mg/ml bovine insulin
(Sigma-Aldrich, St. Louis, MO, USA) and 10% fetal bovine serum
(FBS) at 37°C in 5% CO2. MCF-10A cells and 184B5 cells
were cultured in Clonetics Mammary Epithelial Basal medium (Lonza,
Rochester, NY, USA) with 100 ng/ml (MCF-10A) or 1 ng/ml (184B5)
cholera toxin (Sigma-Aldrich) at 37°C in 5% CO2.
MDA-MB-468, MDA-MB-453, and MDA-MB-157 cells were cultured in
Leibovitz's L-15 medium with 10% FBS at 37°C in atmospheric
air.
Cells were cultured in Corning® T-75
flasks until 60–80% confluent and were then trypsinized, washed and
2–3×10⁵ cells were resuspended in 3 ml of the
appropriate culture medium and plated in MatTek Glass Bottom
Culture dishes (day 0). Plates were incubated at 37°C (5%
CO2 or atmospheric air) for 2 days and paraformaldehyde
fixed for staining (day 2). The cell lines were similarly cultured
and cells were harvested for RNA and protein extraction.
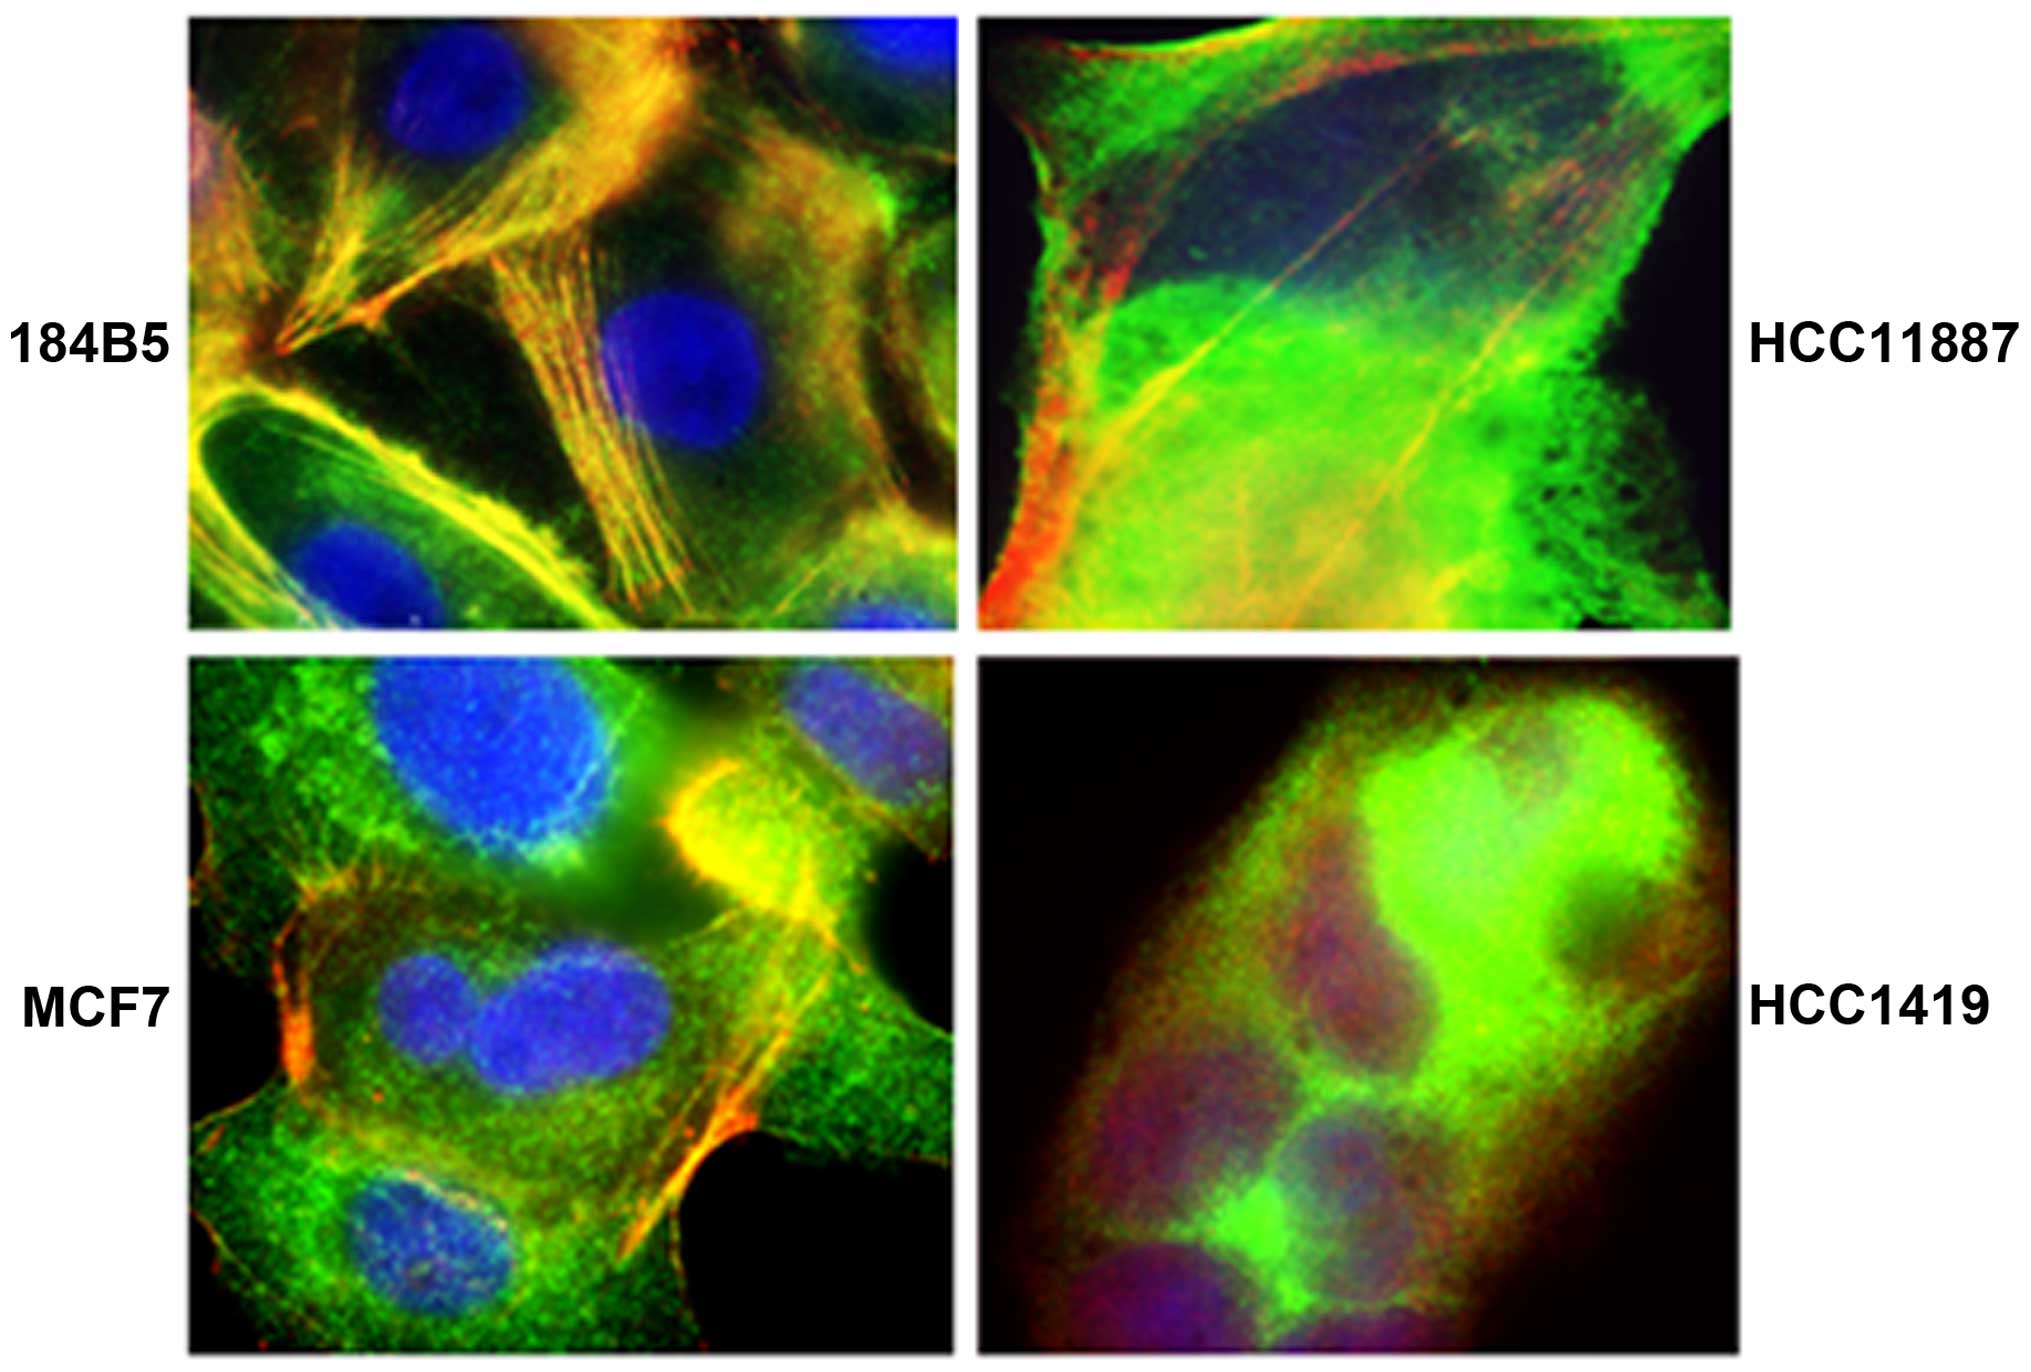
Immunofluorescence
Cells were fixed in 3% paraformaldehyde in
phosphate-buffered saline (PBS) for 15 min at room temperature. The
fixed cells were rinsed twice with standard salt solution (0.1 M
KCl), 0.01 M MgCl2, 0.01 M phosphate buffer, pH 7.0) and
permeablilized with 0.1% IGEPAL (Sigma-Aldrich) in standard salt
for 10 min at room temperature. The free aldehyde groups in
IGEPAL-treated cultured cells were removed by quenching with 50 mM
NH4Cl for 5 min. Cells were then washed with salt
solution for 2 min. The rinsing process was repeated 3 times and
the cells were blocked with 1% BSA in standard salt for 1 h. The
blocked cells were rinsed for 2 min with standard salt. The cells
were then incubated 2 h at room temperature with primary
anti-tropomyosin antibody TM311 (1:1,000 dilution; Abcam,
Cambridge, MA, USA). Cells were washed 8 times with standard salt
and washed cells were incubated with Alexa Fluor 488 secondary
antibody [donkey anti-mouse IgG H&L (Abcam)] in 1:20 dilution
for 1 h at 37°C. The cells were washed 8 times each for 3 min with
standard salt. The cells were next stained with Alexa Fluor 594
phalloidin (diluted stock 1:25; Life Technologies, Grand Island,
NY, USA) for 30 min at room temperature, rinsed with standard salt
(8 times) and distilled water for 5 min x3. Nuclei were then
stained with DNA-binding DAPI [(4′,6-diamidino-2-phenylindole);
Sigma-Aldrich] for 30 min and rinsed 3 times with standard salt.
Cells were mounted in Mowiol (Sigma-Aldrich) with 2.5% G n-propyl
gallate (Sigma-Aldrich). The specimens were sequentially activated
with different wavelengths of light and images were collected with
a Leica AF6000 Deconvolution microscope. The images were then
merged to make a composite picture.
RNA and protein analysis
Total cellular RNA and protein were prepared from
the samples as previously described (18). For RT-PCR, 0.5 µg of RNA in a
total volume of 40 ml was used to synthesize cDNA with
SuperScript® II (Life Sciences) and oligo-dT primers
following the manufacturer's specifications. For each PCR, 3
µl of cDNA was used. GAPDH housekeeping gene RNA and TPM2
RNA were amplified as previously described (18). Amplified cDNA was detected using
Southern blot hybridization, as previously described (19). Qualitative relative amounts of
signal intensity were scored as negative up to +++++. The primer
pairs and probes utilized are listed in Table I.
 | Table INucleotide sequences of the primer
pairs and probes used to amplify and detect TPM2 RNAs. |
Table I
Nucleotide sequences of the primer
pairs and probes used to amplify and detect TPM2 RNAs.
| Primer/probe | Nucleotide
sequences |
|---|
| GAPDH. P1(+): |
5′-GTTTACATGTTCCAATATGATTCCAC-3′ |
| GAPDH. P2(−): |
5′-TCATATTTGGCAGGTTTTCTAGA-3′ |
| GAPDH. Probe: |
5′-GTGGAGTCCACTGGCGTCTT-3′ |
| TPM2. Exon
1a(+): |
5′-ATGGACGCCATCAAGAAGAA-3′ |
| TPM2. Exon
9a(−): |
5′-CTTGTACTTCATCTTCTGGGCAT-3′ |
| TPM2. Exon
9d(−): |
5′-TGGGGCTGGCCCTCACAGGTT-3′ |
| TPM2. Probe Exon
5(+): |
5′-AGAGGGCTGAGGTGGCCGAGAGCCG-3′ |
The above primer pair/probe groups divided the known
TPM2 isoforms into two sets (Fig.
1). However, the generic probe utilized did not further
distinguish among the potential different isoforms. In order to
identify and quantify individual isoforms, the above amplified DNAs
were cloned and sequenced as previously described (20). Fourteen clones were examined for
each cell line and each positive primer pair set. The Southern
signal intensity obtained in the original RNA-PCR assay was then
divided among the different isoforms according to their percentage
of the 14 sequenced colonies.
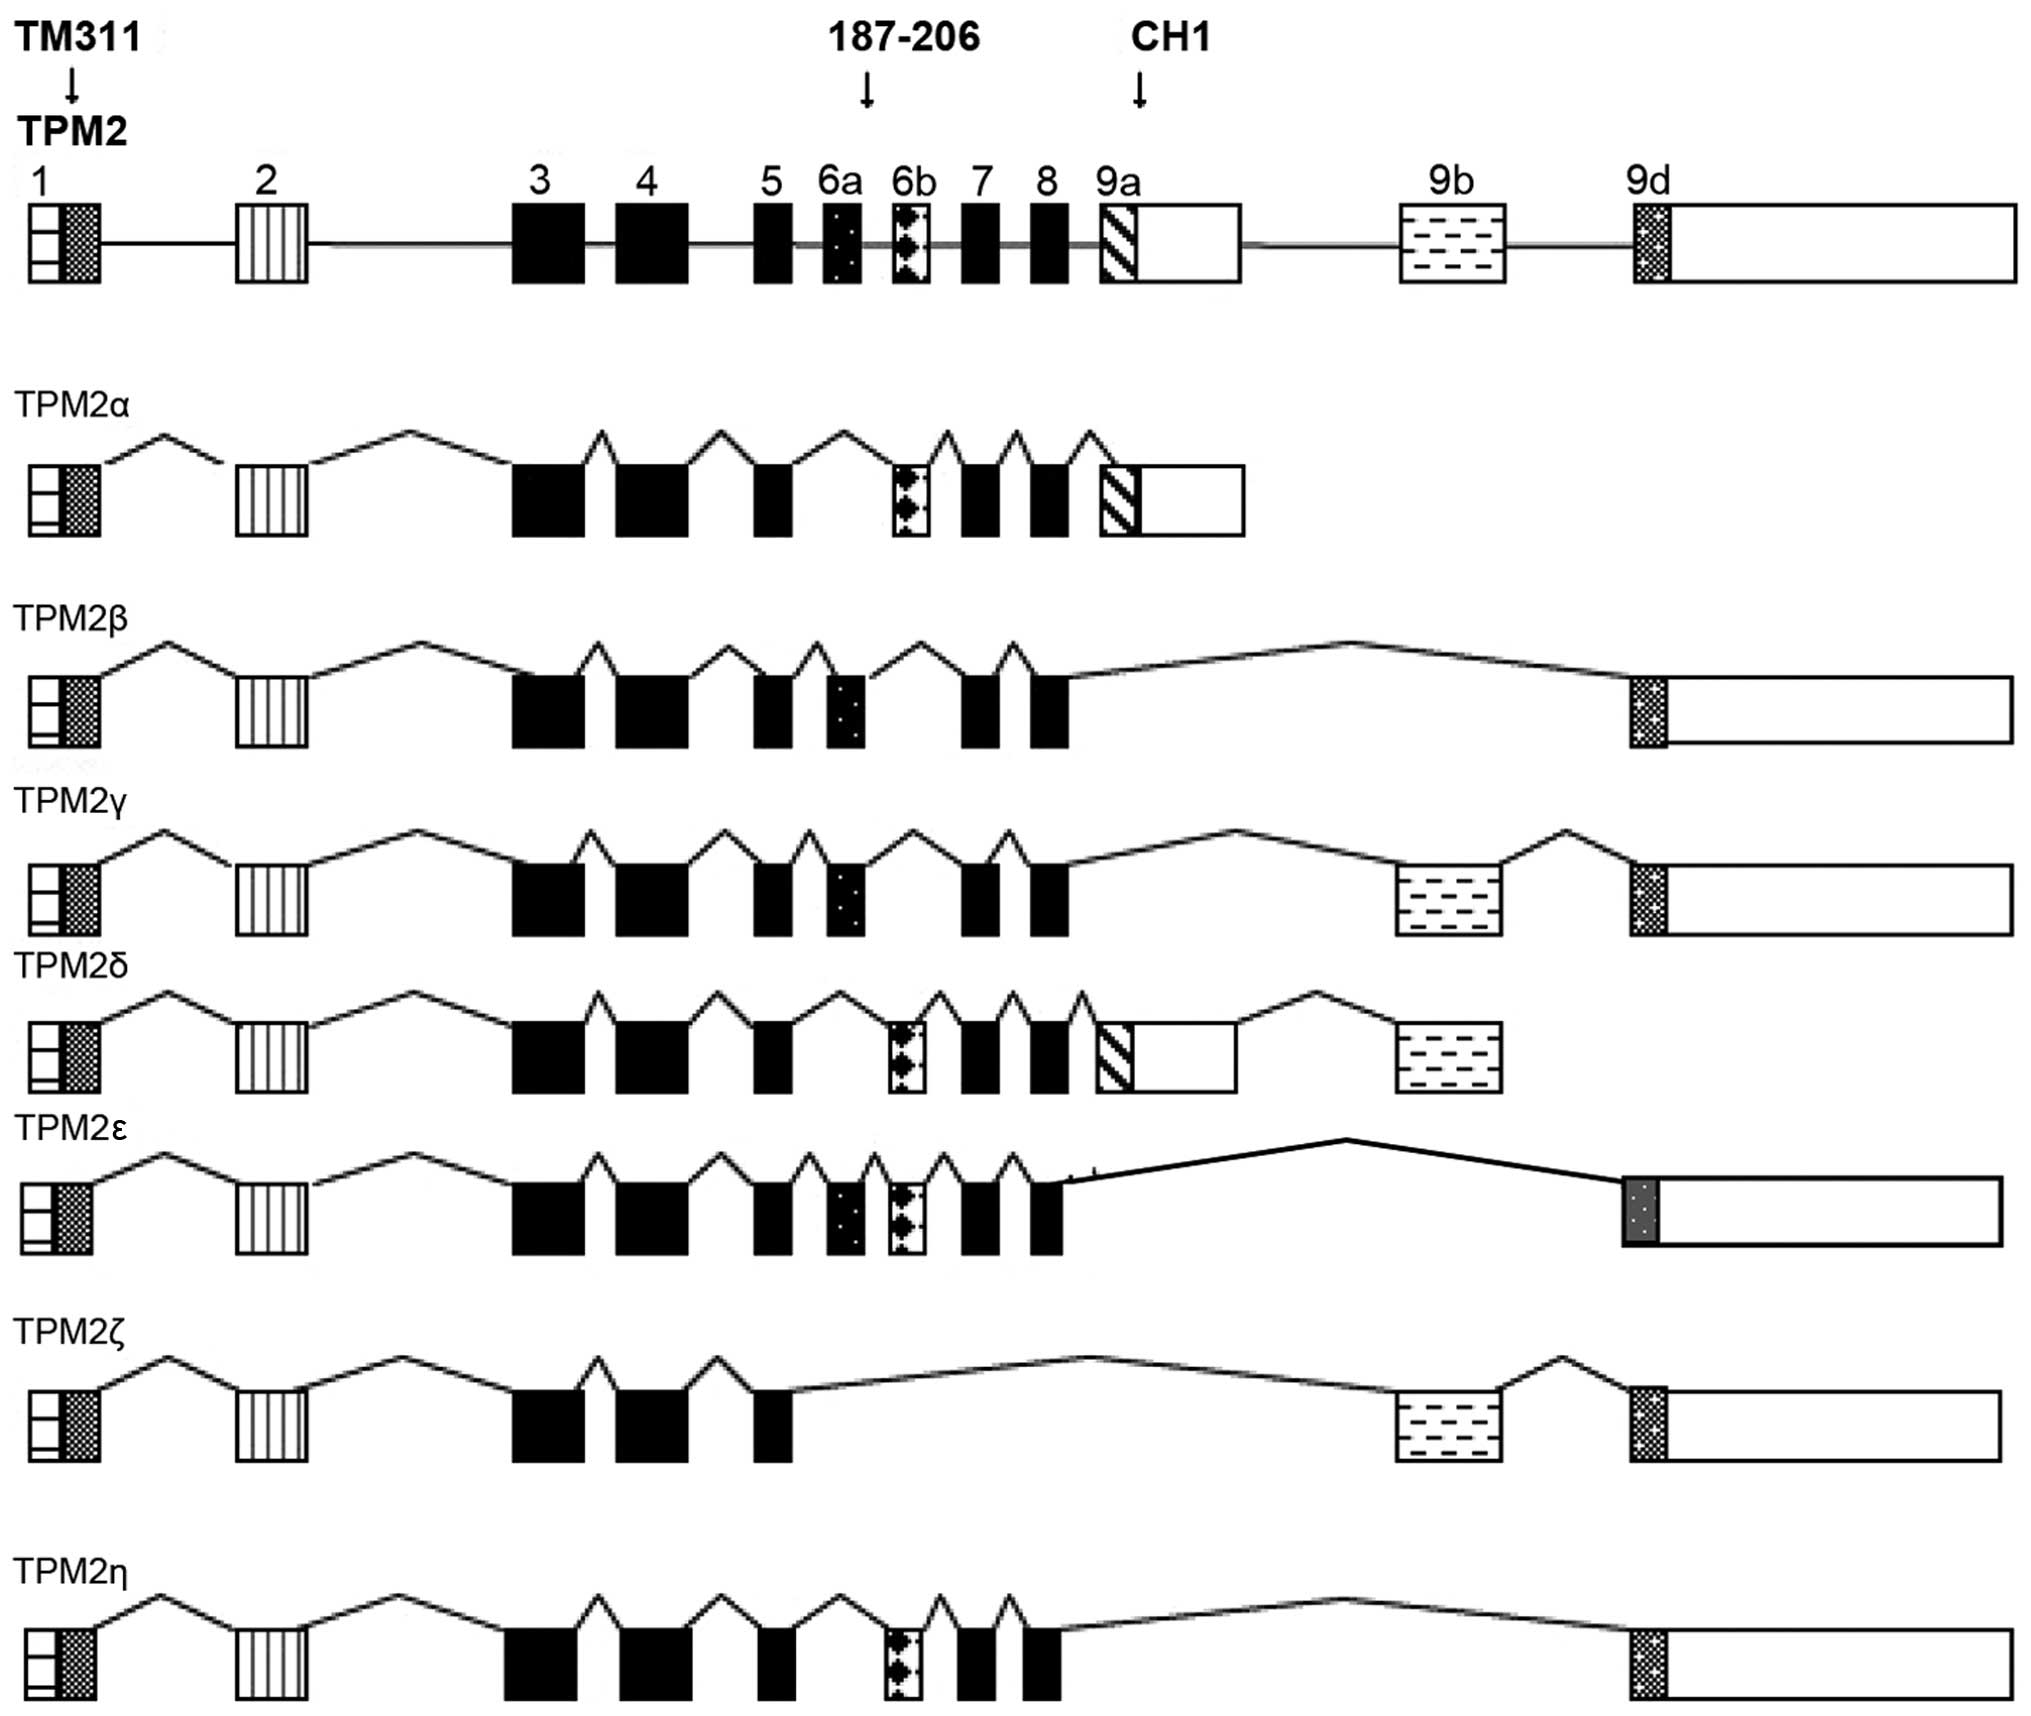 | Figure 1The various exons (boxes) and introns
(lines) of the human tropomyosin 2 gene and its various RNA
isoforms identified to date. The exons identified by the antibodies
TM311, which goes against all four TPM genes, 187–200, which is
TPM2-specific, and CH1, which goes against the TPM1, 2 and 3 genes,
are identified. TPM1E2α is not shown because it goes against only
the TPM1 gene. Those exons that are translated as peptides are
indicated by solid or hatched, markings, while those that are not,
are left blank. |
Protein from 106 cells of each cell line
was extracted with 100 µl of Cell Extraction buffer (Life
Technologies) containing 10 mM Tris, pH 7.4; 100 mM NaCl; 1 mM
EDTA; 1 mM EGTA; 1 mM NaF; 20 mM
Na4P2O7; 2 mM
Na3VO4; 1% Triton X-100; 10% glycerol; 0.1%
SDS; and 0.5% deoxycholate. The cell extraction buffer was
supplemented with 1 mM PMSF and protease inhibitor cocktail (Roche
Diagnostics Corporation, Indianapolis, IN, USA) following
manufacturer specifications. The pellets were discarded and 10
µl of supernatant from each sample was used for subsequent
western blot analyses following our published protocol (17). Primary antibodies included TM311
(Sigma-Aldrich), TPM1E2a, CH1 anti-sarcomeric tropomyosin
(Hybridoma Bank, DHSB, University of Iowa, IA, USA), and TPM2b
187–206 (kind gift of G.L. Prasad, Department of General Surgery
and Cancer Biology, Wake Forest University School of Medicine).
Secondary antibodies were goat anti-rabbit immunoglobulin HRP and
sheep anti-mouse immunoglobulin HRP (GE Healthcare Bio-Sciences,
Pittsburgh, PA, USA). Results were scored as negative or + to ++++.
Peptides encoded by TPM2 RNA exons identified by the above
antibodies are shown in Fig. 1.
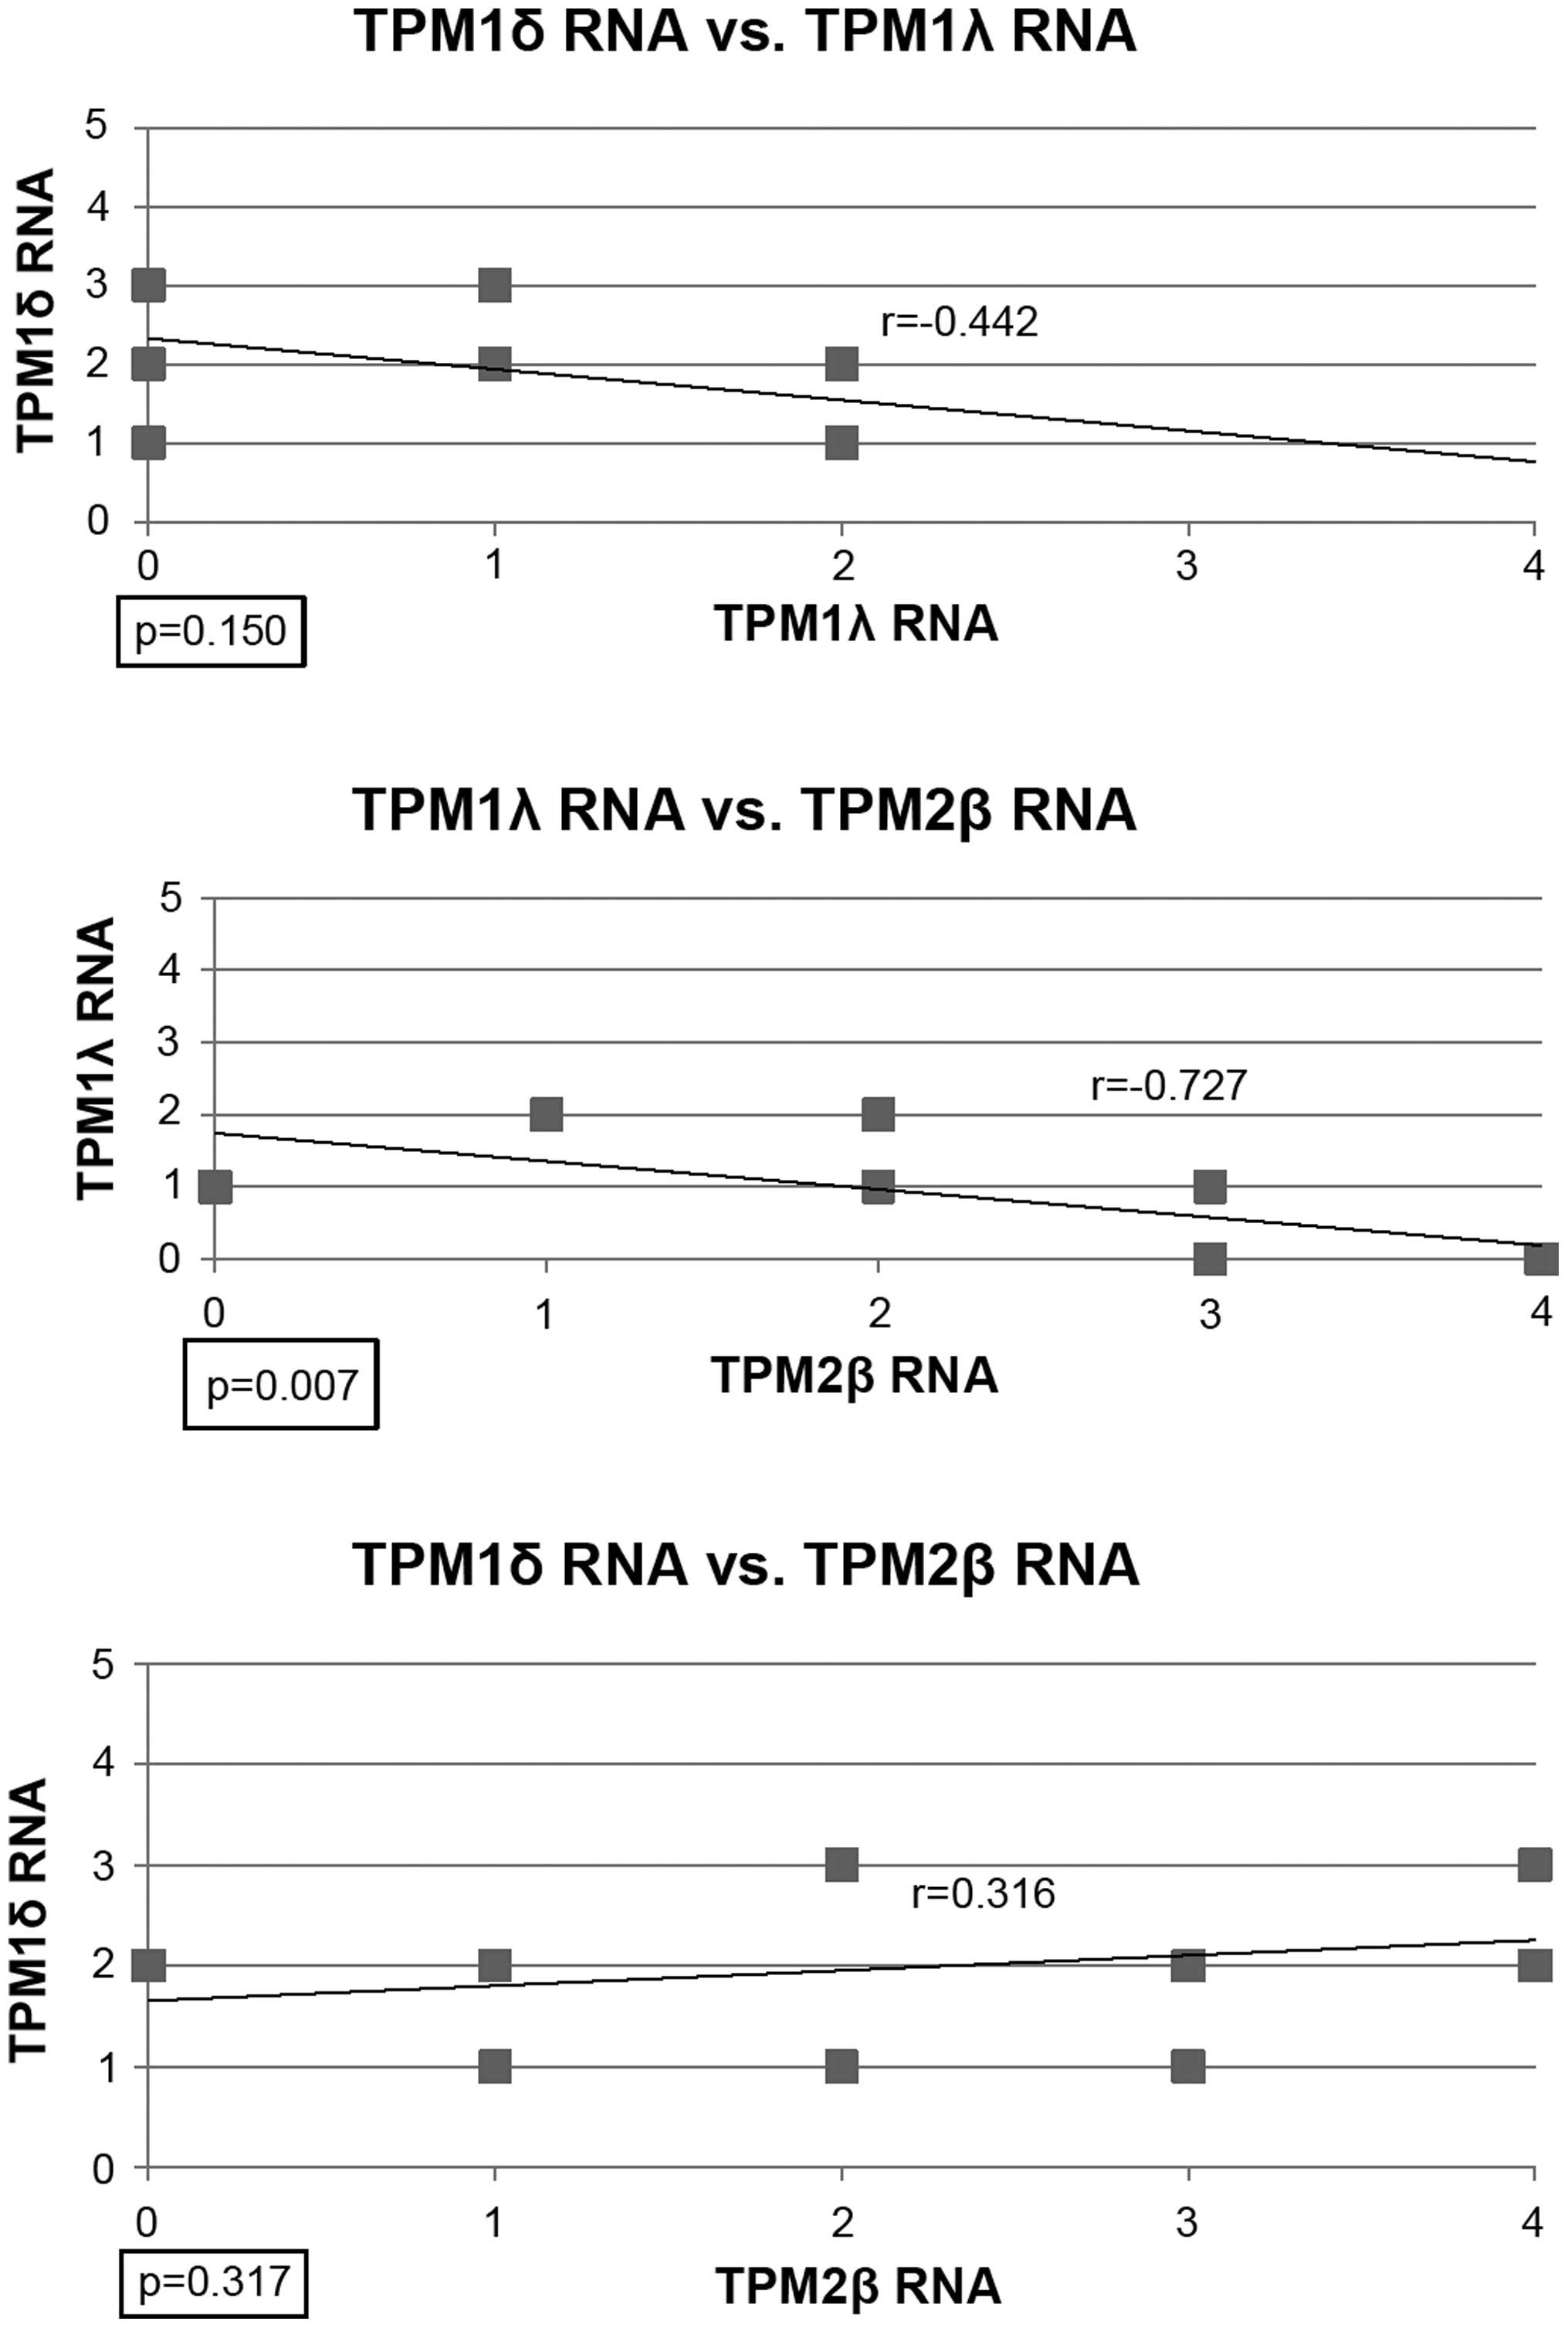
The correlation coefficients (r) between TPM1δ RNA
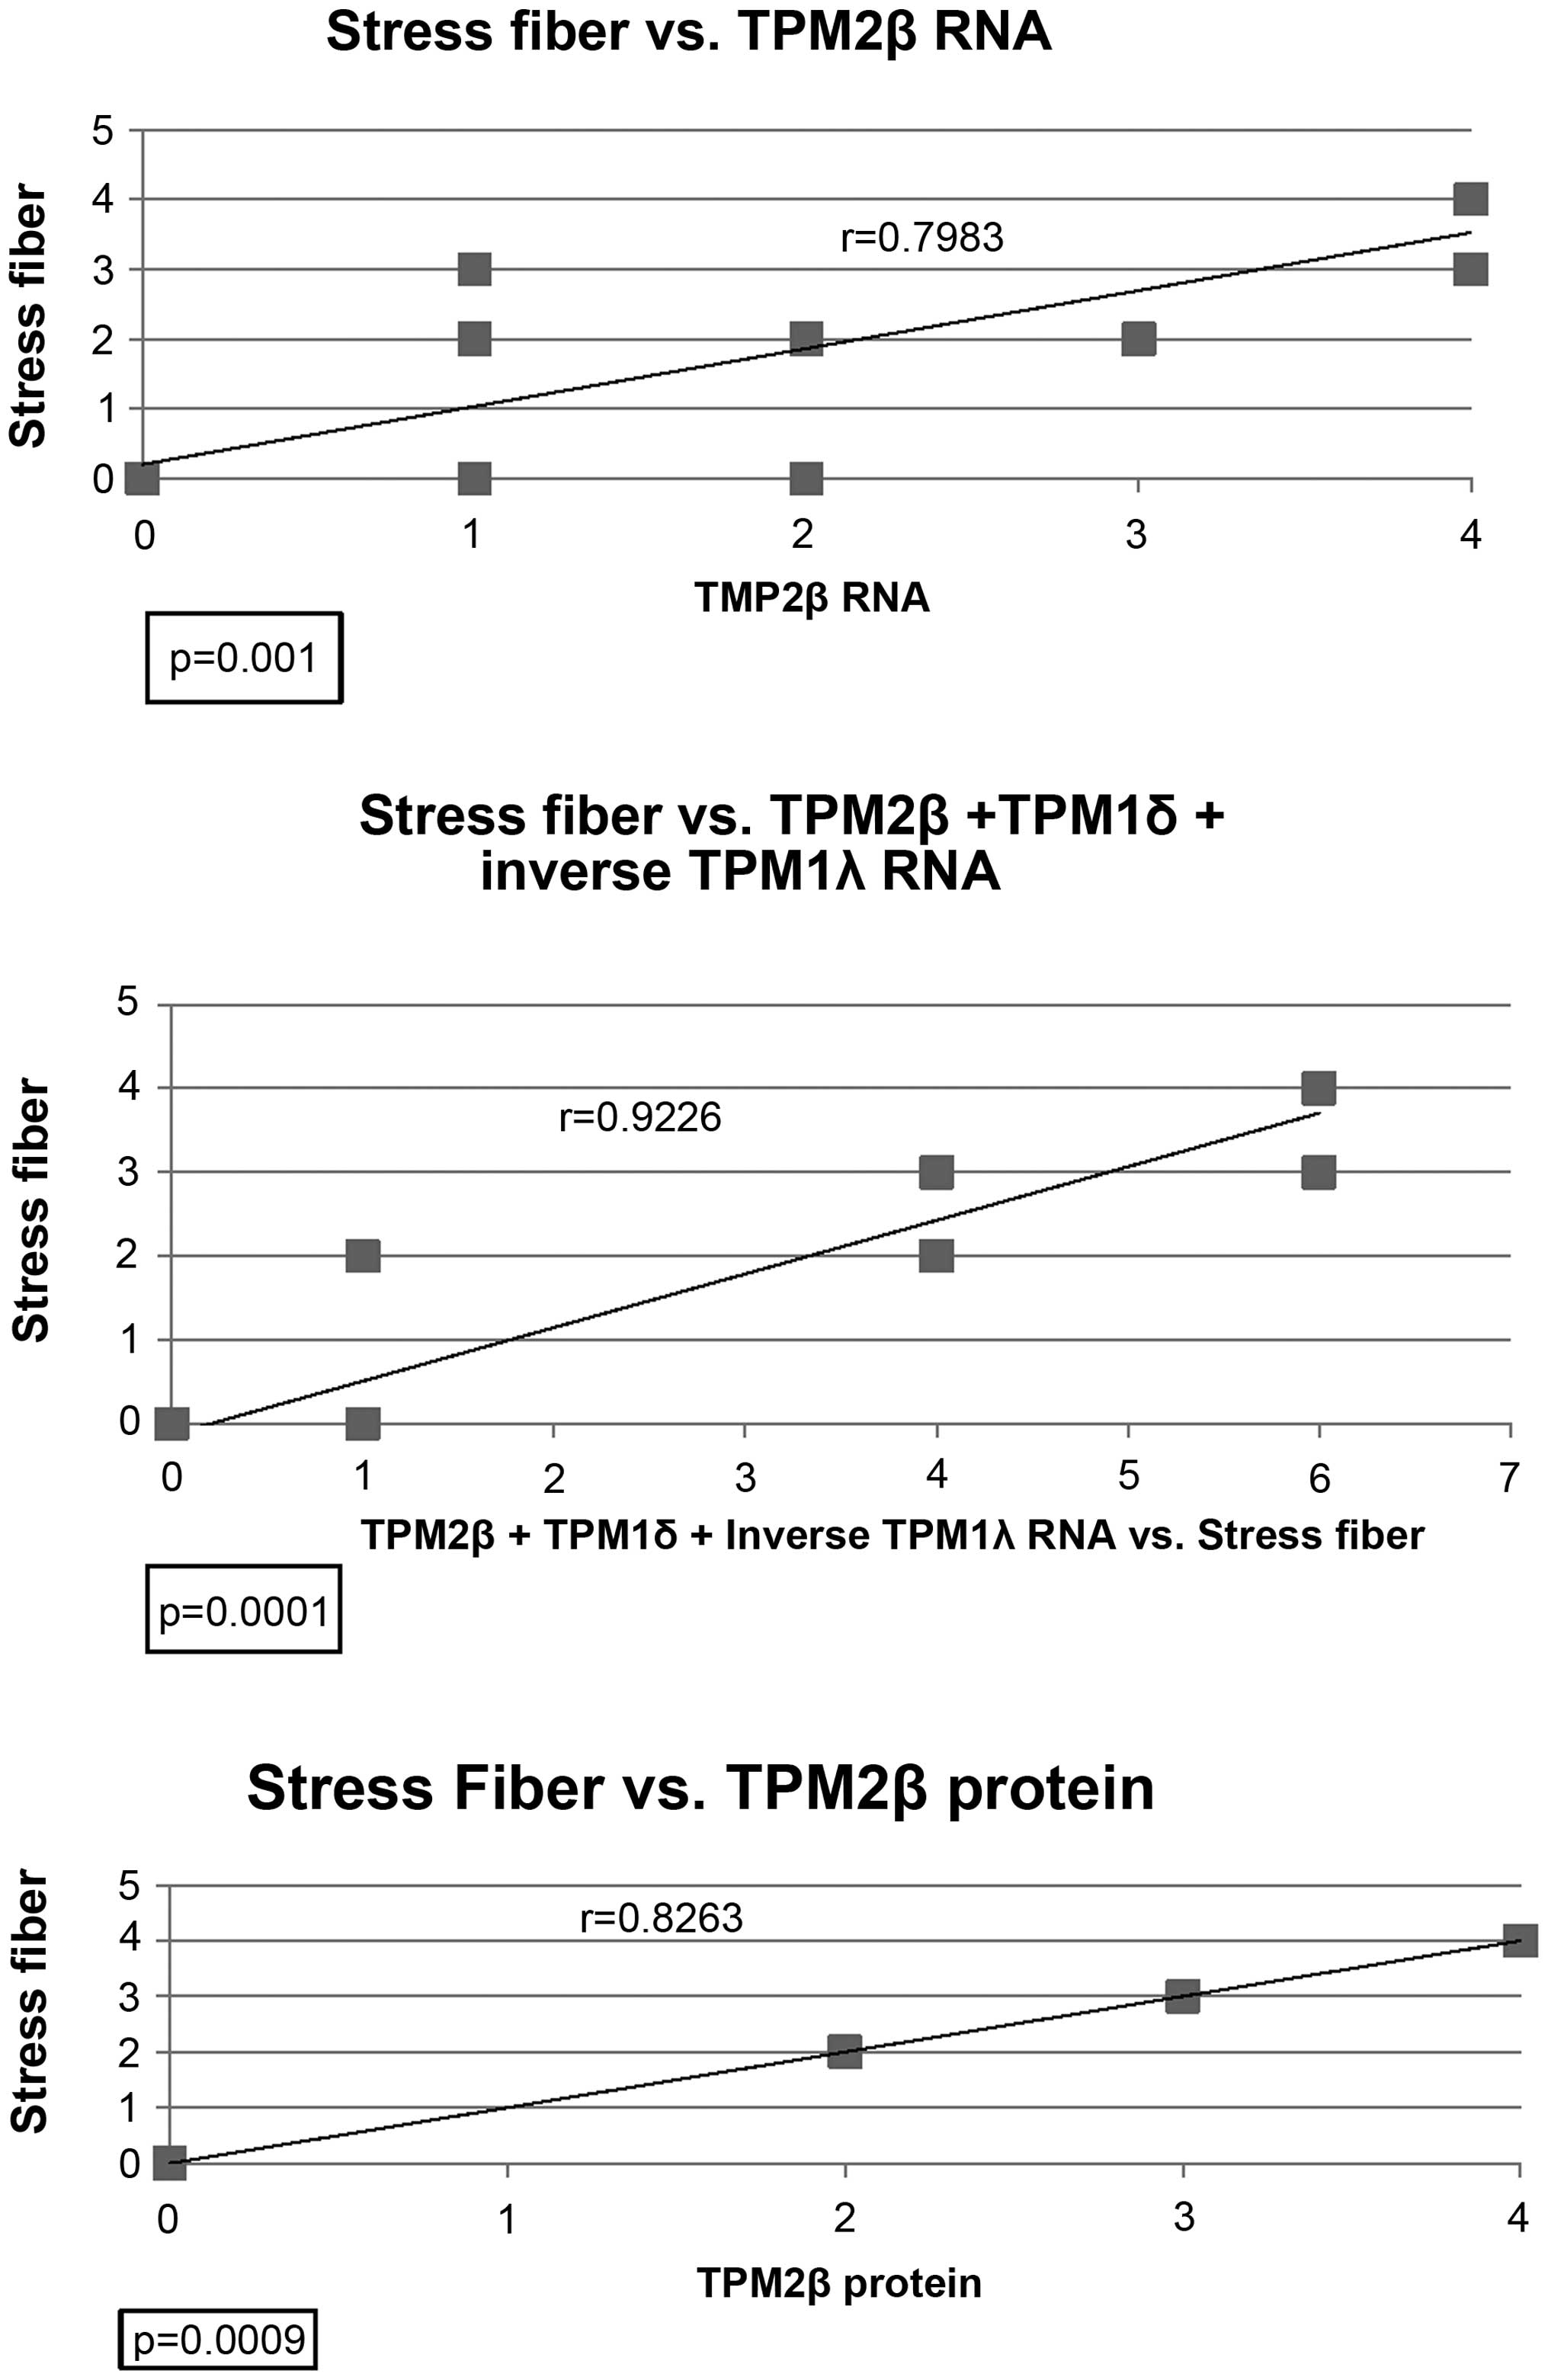
and TPM1λ RNA, TPM2 RNA and TPM1δ or λ RNA and between stress fiber
formation and TPM1λ RNA, TPM2β RNA, TPM2β protein or TBM2β RNA,
plus TPM1δ and the inverse of TPM1λ RNA were calculated and plotted
using Microsoft Excel. The p-values were calculated using the
Pearson's® analysis.
Results
Stress fibers containing both tropomyosin and actin
filaments were identified in the cell lines to varying degrees
ranging from negative to ++++ (Fig.
2 and Table II). No new TPM2
gene RNA isoforms were identified. TPM2β was the most frequently
expressed TPM2 RNA in the breast epithelial lines (Fig. 3 and Table III). TPM2β expression was ++++ in
all of the normal breast cell lines and was the only TPM2 gene RNA
expressed in these cell lines. TPM2β RNA was expressed at varying
degrees ranging from negative to ++++ in the malignant breast cell
lines. There was high expression of TPM2α in one of the malignant
breast cell lines and minimal expression of TPM2ε or TPM2η RNA in a
few of the malignant breast epithelial cell lines. There was TPM2
gene RNA expression in one of the B-cell lines and a quite
different pattern of expression in the cardiac tissues. Using the
four antibodies described, the RNA data and the process of
elimination, TPM2β was the only TPM2 protein expressed in any of
the breast cell lines (not shown). Expression was highest in the
three normal breast cell lines and was either negative or lower in
the malignant breast cell lines (Table
IV).
 | Figure 3Expression of TPM2α and TPM2β
transcripts in various malignant and non-malignant human breast
tumor cell lines. A: Southern hybridization of TPM2 cDNA amplified
with TPM2, Exon 1a(+) and TPM2, exon 9d(−) primers, and probed with
radio-labeled TPM2 exon 5(+) oligonucleotide probe. B: Southern
hybridization of cDNA amplified with TPM2, exon 1a(+) and TPM2,
exon 9a(−) and probed with radio labeled TPM2 exon 5(+)
oligonucleotide probe. C: Ethidium bromide-stained RT-PCR amplified
DNA of human GAPDH. Lane 1, MCF7; lane 2, MCF-10A; lane 3,
HCC-1143; lane 4, HCC-1143 BL; lane 5, MDA-MB-453; lane 6,
MDA-MB-468; lane 7, HCC-1806; lane 8, HCC-1187; lane 9, BT-474;
lane 10, MDA-MB-157; lane 11, HCC-1419; lane 12, HCC-1419 BL; lane
13, primer control. |
| Table IIStress fiber formation in human breast
malignant and non-malignant cell lines. |
Table II
Stress fiber formation in human breast
malignant and non-malignant cell lines.
| Cell line | Stress fiber
formation |
|---|
| Breast cancer | |
| HCC-1143 | +++ |
| HCC-1187 | ++ |
| BT-474 | − |
| mDAMB-157 | ++ |
| HCC-1806 | ++ |
| HCC-1419 | − |
| mDAMB-453 | − |
| mDAMB-468 | +++ |
| MCF 7 | − |
| MCF-10 (normal
breast) | ++++ |
| MCF-12A (normal
breast) | ++++ |
| MCF-184 B5 (normal
breast) | ++++ |
| HCC-1143 (BL) | − |
| HCC-1187 (BL) | − |
| Table IIITropomyosin 2 gene RNA isoform
expression in human breast malignant and non-malignant cell
lines. |
Table III
Tropomyosin 2 gene RNA isoform
expression in human breast malignant and non-malignant cell
lines.
| Cell line | RNA isoform
expression
|
|---|
| TPM2α | TPM2β | TPM2γ | TPM2δ | TPM2ε | TPM2ζ | TPM2η | GAPDH |
|---|
| Breast cancer | | | | | | | | |
| HCC-1143 | − | ++++ | − | − | − | − | − | +++++ |
| HCC-1187 | − | + | − | − | − | − | − | +++++ |
| BT-474 | − | − | − | − | − | − | − | +++++ |
| mDAMB-157 | ++++ | +++ | − | − | ++ | − | − | +++++ |
| HCC-1806 | − | +++ | − | − | − | − | − | +++++ |
| HCC-1419 | − | − | − | − | − | − | − | +++++ |
| mDAMB-453 | − | + | − | − | − | − | − | +++++ |
| mDAMB-468 | − | ++ | − | − | + | − | + | +++++ |
| MCF7 | − | ++ | − | − | + | − | − | +++++ |
| MCF-10A (normal
breast) | − | ++++ | − | − | − | − | − | +++++ |
| MCF-12A (normal
breast) | − | ++++ | − | − | − | − | − | +++++ |
| MCF-184 B5 (normal
breast) | − | ++++ | − | − | − | − | − | +++++ |
| HCC-1143 (BL) | − | ++ | − | − | − | − | − | +++++ |
| HCC-1419 (BL) | − | − | − | − | − | − | − | +++++ |
| Tissue type | | | − | | | | | |
| Fetal heart | ++ | ++ | − | + | + | + | + | +++++ |
| Adult heart | ++ | +++ | − | + | + | ++ | + | +++++ |
| Table IVTropomyosin protein expression in
breast cancer cell lines. |
Table IV
Tropomyosin protein expression in
breast cancer cell lines.
| Cell line |
Antibody
and TPM isoforms detecteda
|
|---|
TM311b
| TPM1E2a | CH1
TPM1α,κ,µ,ξ | TPM2b 187–206
|
|---|
| >40 kDa | 40 kDa | 38 kDa | 36 kDa | 34 kDa | <34 kDa | >40 kDa | 40 kDa | 38 kDa |
|---|
| TPM2γ | TPM1β,κ
TPM2α,δ,ε | TPM2β,η
TPM4δ,ε | TPM1δ,η
TPM1α,γ | TMP3α | TPM2ζ | TPM1β,κ,ξ | TPM2α,δ
TPM3α,δ,ε,θ,ι,κ,λ,µ | TPM2λ | TPM2ε | TPM2β |
|---|
| Breast cancer | | | | | | | | | | | |
| HCC-1143 | − | − | ++ | ++ | − | − | − | − | − | − | ++ |
| HCC-1187 | − | − | ++ | +++ | − | − | − | − | − | − | − |
| BT-474 | − | − | − | + | − | − | − | − | − | − | − |
| mDAMB-157 | − | − | + | ++++ | − | − | − | − | − | − | + |
| HCC-1806 | − | − | + | + | − | − | − | − | − | − | ++ |
| HCC-1419 | − | − | + | + | − | − | − | − | − | − | − |
| mDAMB-453 | − | − | ++ | ++ | − | − | − | − | − | − | − |
| mDAMB-468 | − | − | ++ | +++ | − | − | − | − | − | − | − |
| MCF7 | − | − | ++ | ++ | − | − | − | − | − | − | − |
|
| MCF-10A (normal
breast) | − | − | +++ | ++ | − | − | − | − | − | − | ++ |
| MCF-12A (normal
breast) | − | − | +++ | ++ | − | − | − | − | − | − | ++ |
| MCF-184-B5 (normal
breast) | − | − | +++ | ++ | − | − | − | − | − | − | ++ |
| HCC-1143 (BL) | − | − | − | − | − | − | − | − | − | − | − |
| HCC-1187 (BL) | − | − | − | − | − | − | − | − | − | − | − |
|
| Fetal heart | − | + | + | ++++ | − | + | + | ++++ | − | − | + |
| Adult heart | − | + | + | ++++ | − | + | + | ++++ | − | − | + |
| Skeletal
muscle | − | +++ | − | +++ | +++ | − | − | ++++ | − | − | + |
Fig. 4 shows the
relationship between TPM1δ and TPM1λ RNA. There was a negative
correlation but it was not statistically significant. Similarly
there was a non-significant positive correlation between TPM1δ RNA
and TPM2β RNA expression. However, there was a statistically
significant, high inverse correlation between TPM1λ RNA and TPM2β
RNA expression.
Fig. 5 shows the
relationship between stress fiber formation and either TPM2β RNA,
TPM2β protein, or TPM2β RNA plus TPM1δ RNA plus the inverse of
TPM1λ RNA in the 12 malignant and normal breast cell lines. TPM2β
RNA and protein expression both had high, statistically significant
positive correlations with stress fiber formation. The highest,
statistically significant, correlation was with the additive value
of both TPM2 RNA, TPM1δ RNA and the inverse of TPM1λ RNA.
Discussion
The actin cytoskeleton in epithelial cells contains
stress fibers comprised of actin microfilaments and various actin
binding proteins (21). They play a
major role in anchorage-dependence, cell locomotion, and
proliferation. Their dysregulation is considered to play a role in
cellular transformation and metastasis (9,11,22,15).
Various isoforms of tropomyosin play a critical role in the normal
function of these microfilaments and alterations in their
expression are believed to be involved in oncogenesis.
The high molecular weight isoforms TPM1γ and δ and
TPM2β have been shown to be expressed in normal human breast
epithelial cells and their protein products are incorporated into
stress fibers (9). The lower
molecular weight isoforms TPM1ε and TPM4γ have also been shown to
be expressed (9). Downregulation of
TPM1γ and δ and TPM2β isoforms has been observed in some but not
all malignant human breast cancer cell lines and primary breast
carcinomas (9,11,22,15).
Paradoxically, levels of TPM2β were found to be
elevated in primary breast cancers that gave rise to lymph node
metastases compared to those that did not (9). TPM2β is considered to protect actin
microfilaments from the degradation effects of cofilin (12). TPM2β, but not TPM1γ, restores the
microfilament organization and suppresses malignant growth of a
variety of transformed cells including human breast cancer cell
lines (11,22–24).
Given the identification and/or prediction of an
increasingly greater number of tropomyosin isoforms than known in
the past, the sometimes conflicting results mentioned above, and
the fact that many reagents used to study tropomyosins are not
isoform-specific, we have embarked on a systematic examination of
human breast epithelial cell lines for novel isoform expression.
Indeed, in a previous publication we detected four novel TPM1 RNA
isoforms (16). TPM1λ was the most
frequent novel isoform expressed in the malignant breast cell lines
and was not found in the three normal breast epithelial cell lines
examined. Interestingly, the expression of TPM1λ RNA had a high,
statistically significant, inverse correlation with stress fiber
formation in the normal and malignant breast cell lines. To date,
we do not have a TPM1λ-specific reagent or method to identify and
quantify TPM1λ protein, but the experiments are in progress.
In the data reported herein, we did not identify any
novel TPM2 isoforms in the breast epithelial cell lines. Of the
known TPM2 isoforms identified in any human tissues, only TPM2β was
routinely and robustly expressed at the RNA and protein levels
among the breast epithelial cell lines. Its expression inversely
correlated with that of TPM1λ, suggesting that one may influence
the expression of the other or that they share a common regulator
with opposite effects. Interestingly, while TPM2β expression had a
positive correlation with stress fiber formation, the strongest
impact on stress fiber formation was observed when the levels of
TPM2β RNA, TPM1δ RNA and the inverse of TPM1λ RNA were added
together. This suggests that their opposite effects could be
additive with TPM1λ expression promoting and TPM1δ and TPM2β
expression suppressing cell transformation.
In conclusion, the discovery and possible biological
impact of TPM1λ may explain some of the inconsistent observations
regarding TPM1δ and TPM2β cited above. Together, TPM1δ, TPM1λ and
TPM2β RNA levels could be considered as a tropomyosin expression
index that would very accurately predict stress fiber formation at
least in the cell lines studied.
We plan on examining human breast epithelial cell
lines for TPM3 and TPM4 expression and developing the techniques
and reagents to examine the interactive biology of all of the TPM
isoforms in these systems. In order to further delineate the role
of tropomyosin expression in the pathogenesis of human breast
cancer, these studies will be extended to fresh human tissues as
well.
Acknowledgments
The study was supported by a grant from the
Department of Medicine, SUNY Upstate Medical University, Syracuse,
New York to Dr J.P. Poiesz.
References
|
1
|
Gunning P, O'Neill G and Hardeman E:
Tropomyosin-based regulation of the actin cytoskeleton in time and
space. Physiol Rev. 88:1–35. 2008. View Article : Google Scholar : PubMed/NCBI
|
|
2
|
Lees-Miller JP and Helfman DM: The
molecular basis for tropomyosin isoform diversity. BioEssays.
13:429–437. 1991. View Article : Google Scholar : PubMed/NCBI
|
|
3
|
Perry SV: Vertebrate tropomyosin:
Distribution, properties and function. J Muscle Res Cell Motil.
22:5–49. 2001. View Article : Google Scholar : PubMed/NCBI
|
|
4
|
Pieples K and Wieczorek DF: Tropomyosin 3
increases striated muscle isoform diversity. Biochemistry.
39:8291–8297. 2000. View Article : Google Scholar : PubMed/NCBI
|
|
5
|
Pittenger MF, Kazzaz JA and Helfman DM:
Functional properties of non-muscle tropomyosin isoforms. Curr Opin
Cell Biol. 6:96–104. 1994. View Article : Google Scholar : PubMed/NCBI
|
|
6
|
Wieczorek DF: Regulation of alternatively
spliced α-tropomyosin gene expression by nerve extract. J Biol
Chem. 263:10456–10463. 1988.PubMed/NCBI
|
|
7
|
Dube DK, McLean MD, Zajdel RW, Dube S and
Poiesz BJ: Does non-coding RNA play a critical role in sarcomeric
tropomyosin expression and subsequent myofibrillogenesis in axolotl
heart? J Clin Exp Cardiolog. 4:e1322013.
|
|
8
|
Dube DK, McLean MD, Dube S and Poiesz BJ:
Translational control of tropomyosin expression in vertebrate
hearts. Anat Rec (Hoboken). 297:1585–1595. 2014. View Article : Google Scholar
|
|
9
|
Franzén B, Linder S, Uryu K, Alaiya AA,
Hirano T, Kato H and Auer G: Expression of tropomyosin isoforms in
benign and malignant human breast lesions. Br J Cancer. 73:909–913.
1996. View Article : Google Scholar : PubMed/NCBI
|
|
10
|
Bharadwaj S and Prasad GL: Tropomyosin-1,
a novel suppressor of cellular transformation is downregulated by
promoter methylation in cancer cells. Cancer Lett. 183:205–213.
2002. View Article : Google Scholar : PubMed/NCBI
|
|
11
|
Mahadev K, Raval G, Bharadwaj S,
Willingham MC, Lange EM, Vonderhaar B, Salomon D and Prasad GL:
Suppression of the transformed phenotype of breast cancer by
tropomyosin-1. Exp Cell Res. 279:40–51. 2002. View Article : Google Scholar : PubMed/NCBI
|
|
12
|
Bharadwaj S, Hitchcock-DeGregori S,
Thorburn A and Prasad GL: N terminus is essential for tropomyosin
functions: N-terminal modification disrupts stress fiber
organization and abolishes anti-oncogenic effects of tropomyosin-1.
J Biol Chem. 279:14039–14048. 2004. View Article : Google Scholar : PubMed/NCBI
|
|
13
|
Bakin AV, Safina A, Rinehart C, Daroqui C,
Darbary H and Helfman DM: A critical role of tropomyosins in TGF-β
regulation of the actin cytoskeleton and cell motility in
epithelial cells. Mol Biol Cell. 15:4682–4694. 2004. View Article : Google Scholar : PubMed/NCBI
|
|
14
|
Zhu S, Si ML, Wu H and Mo YY: MicroRNA-21
targets the tumor suppressor gene tropomyosin 1 (TPM1). J Biol
Chem. 282:14328–14336. 2007. View Article : Google Scholar : PubMed/NCBI
|
|
15
|
Helfman DM, Flynn P, Khan P and Saeed A:
Tropomyosin as a regulator of cancer-cell transformation.
Tropomyosin. Gunning P: Springer; Berlin: pp. 124–131. 2008,
View Article : Google Scholar
|
|
16
|
Dube S, Yalamanchili S, Lachant J, Abbott
L, Benz P, Mitschow C, Dube DK and Poiesz BJ: Expression of
tropomyosin 1 gene isoforms in human breast cancer cell lines. Int
J Breast Cancer. 2015(859427)2015. View Article : Google Scholar : PubMed/NCBI
|
|
17
|
Dube S, Yalamanchili S, Lachant J, Abbott
L, Benz P, Dube DK and Poiesz BJ: Expression of tropomyosin 2 gene
isoforms in human cardiac tissue. Int J Cardiol Res.
1(301)2014.
|
|
18
|
Pinnamaneni S, Dube S, Welch C, Shrestha
R, Benz P, Abbott L, Poiesz BJ and Dube DK: Effect of Shz-1, a
cardiogenic small molecule, on expression of tropomyosin in axolotl
hearts. Am Based Res J. 2:24–40. 2013.
|
|
19
|
Thomas A, Rajan S, Thurston HL, Masineni
SN, Dube P, Bose A, Muthu V, Dube S, Wieczorek DF, Poiesz BJ, et
al: Expression of a novel tropomyosin isoform in axolotl heart and
skeletal muscle. J Cell Biochem. 110:875–881. 2010. View Article : Google Scholar : PubMed/NCBI
|
|
20
|
Denz CR, Zhang C, Jia P, Du J, Huang X,
Dube S, Thomas A, Poiesz BJ and Dube DK: Absence of mutation at the
5′-upstream promoter region of the TPM4 gene from cardiac mutant
axolotl (Ambystoma mexicanum). Cardiovasc Toxicol. 11:235–243.
2011. View Article : Google Scholar : PubMed/NCBI
|
|
21
|
Tojkander S, Gateva G and Lappalainen P:
Actin stress fibers - assembly, dynamics and biological roles. J
Cell Sci. 125:1855–1864. 2012. View Article : Google Scholar : PubMed/NCBI
|
|
22
|
Prasad GL, Fuldner RA and Cooper HL:
Expression of transduced tropomyosin 1 cDNA suppresses neoplastic
growth of cells transformed by the ras oncogene. Proc Natl Acad Sci
USA. 90:7039–7043. 1993. View Article : Google Scholar : PubMed/NCBI
|
|
23
|
Braverman RH, Cooper HL, Lee HS and Prasad
GL: Anti-oncogenic effects of tropomyosin: Isoform specificity and
importance of protein coding sequences. Oncogene. 13:537–545.
1996.PubMed/NCBI
|
|
24
|
Prasad GL, Masuelli L, Raj MH and
Harindranath N: Suppression of src-induced transformed phenotype by
expression of tropomyosin-1. Oncogene. 18:2027–2031. 1999.
View Article : Google Scholar : PubMed/NCBI
|