Introduction
Colorectal cancer (CRC) is one of the most prevalent
types of cancer worldwide (1).
According to the American Cancer Society, CRC is the third most
common malignancy among both genders in the USA (2), and more than 136,000 new CRC cases
were diagnosed in 2014 and an estimated 50,000 deaths were reported
in 2015 in the USA alone (3). In
fact, current estimates predict that 5% of the population will be
diagnosed with CRC at some point in their lifetime (4). Most CRC patients are diagnosed at an
advanced stage with lymph node metastasis. Although the disease has
good therapeutic response at early stages, advanced stages are
associated with poor prognosis. Among various metastatic pathways,
the lymph node system plays an important role in affecting the
prognosis of CRC patients, and serves as the most frequent pathway
for metastasis. In theory, CRC patients with localized tumor and
without lymph node or distant metastases (i.e., stages I and II),
may be cured by surgical resection alone. Unfortunately, only 40%
of CRC patients are diagnosed at early, localized stages of the
disease. The overall five-year survival rate (FYSR) can reach
80–90% for non-metastatic CRC patients, while those diagnosed at
advanced stages have only a 13% FYSR (5). Unfortunately, mechanisms underlying
metastasis are still largely unknown. Thus, identifying novel
potential biomarkers for CRC and investigating the molecular
mechanisms of CRC metastasis are essential for diagnosis, treatment
and prognosis of this disease.
Cancer cells exhibit distinct metabolic phenotypes,
which are essential for supporting high proliferative rates.
Abnormal metabolism is an important characteristic of cancer, such
as the identified Warburg effect (6). The key metabolic pathways along with
distinguishing metabolites have been the focus of many cancer
studies (7–9). Metabolomics (10), as the end-point of the ‘-omics’
cascade and therefore the last step before phenotype, has been a
recently developed technology for the detection, identification and
quantification of small molecular weight metabolites, which are
included in the metabolism of a cellular or biological system at a
specified time under specific environmental conditions (11,12),
resulting in rapid progress in identifying biomarkers for the early
prediction and diagnosis of cancers (13,14) as
well as in obtaining fundamental mechanistic insights into
carcinogenesis, staging and metastasis of cancer over the past
decade (15–17). Recent technological advances in mass
spectrometry (MS) and nuclear magnetic resonance (NMR) spectroscopy
have also further improved the spectral resolution and sensitivity
for cancer metabolomic study (18).
Recently, metabolomics have been applied in human CRC study
16,19–21.
These studies have mainly focused on biomarker discovery for CRC or
discrimination of CRC rather than being based on lymph node
metastasis, an important prognostic factor in CRC. There has been a
lack of comprehensive studies on discriminating lymph node
metastatic CRC tissues from lymph node non-metastatic CRC
tissues.
In this study, we utilized an NMR-based non-targeted
metabolomic approach in conjunction with multivariate statistical
analyses to investigate differential metabolites of tissue samples
between normal controls and CRC patients, especially focusing on
those disturbances present in patients with lymph node metastasis.
To our knowledge, this was the first instance where an unbiased
high-throughput approach was adopted to identify progressive
metabolites altered in the lymph node metastasis of CRC. We aimed
to identify potential metabolic biomarkers of metastasis for early
diagnosis, staging and therapeutic strategies. The role and the
underlying mechanisms of CRC warrant further investigation.
Materials and methods
Chemicals
High-performance liquid chromatography (HPLC) grade
chloroform and methanol were purchased from Thermo Fisher
Scientific. Trimethylsilylpropionic acid-d4 sodium salt (TSP) was
purchased from Sigma-Aldrich. Deuterium water (99.8% D) was
purchased from Cambridge Isotope Laboratories (CIL). All of the
other chemicals used in this study were purchased from
Sigma-Aldrich and were analytically pure and of culture grade.
Sample collection
The study protocol was approved by the Ethics
Committee of the West China Hospital of Sichuan University. The CRC
patients included in the study provided written informed consent in
accordance with the institutional guidelines before sample
collection. In order to avoid interference, all subjects enrolled
in this study did not receive any chemotherapy or radiation therapy
prior to surgical treatment. During 2009–2010, 125 CRC patients
were recruited, and a total of 166 surgical specimens were
collected. Among them, 41 normal control tissues were extracted at
least 5–10 cm away from the edge of a tumor from the same sample,
thus 82 cases included matched tumor and normal control tissues.
The pathological diagnosis of CRC was confirmed using routine
histopathological H&E stained specimens. The clinical
characteristics of the patients are provided in Table I. Tissue samples were diagnosed for
TNM stage: no lymph node metastasis (n=73; males, 36; females, 37),
lymph node metastasis (n=52; males, 29; females, 23). The dissected
tissues were immediately frozen in liquid nitrogen to stop any
enzymatic or chemical reactions in the operating room and stored at
−80°C.
 | Table I.Clinical characteristics of the CRC
patients and normal controls analyzed by 1H NMR. |
Table I.
Clinical characteristics of the CRC
patients and normal controls analyzed by 1H NMR.
|
| CRC patients |
|
|---|
|
|
|
|
|---|
|
| Lymph node
non-metastatic | Lymph node
metastatic | Normal
controls |
|---|
| No. of
subjects | 73 | 52 | 41 |
| Age in years |
|
|
|
|
Mean | 57.8 | 51 | 56.8 |
|
Range | (28–86) | (31–71) | (35–85) |
| Gender
(male/female) | 36/37 | 29/23 | 16/25 |
| Nutritional
status |
|
|
|
|
SGA-A | 60 | 43 | 41 |
|
|
SGA-B | 11 | 6 |
|
|
SGA-C | 2 | 3 |
|
| Histology |
|
|
|
|
Adenocarcinoma | 73 | 52 |
|
| Pathological
grade |
|
|
|
| PD | 17 | 18 |
|
| MD | 48 | 30 |
|
| WD | 5 | 3 |
|
| NA | 3 | 1 |
|
| TNM stage |
|
|
|
| I | 34 |
|
|
|
IIA | 38 |
|
|
|
IIC | 1 |
|
|
|
IIIA |
| 6 |
|
|
IIIB |
| 28 |
|
|
IIIC |
| 4 |
|
|
IVA |
| 14 |
|
Sample preparation and 1H
NMR spectroscopic analysis
To extract the significant metabolites (e.g.,
carbohydrates, lipids, amino acids and other small metabolites),
the typical frozen sample size was 100 mg. Methanol, chloroform and
distilled water was ice-cold before the extraction. Approximately
100 mg of each frozen tissue sample was placed into 1.5-ml
microcentrifuge vials and weighed. The weighed tissues were minced
using liquid nitrogen. A total of 400 µl methanol (4 ml/g of
tissue) and 85 µl distilled water (0.85 ml/g of tissue) were added
and the mixture was vortexed for 1 min. A total of 200 µl
chloroform (2 ml/g of tissue) was then added. After vortexing, the
samples were kept on ice for 30 min to extract the metabolites,
followed by centrifugation at 1,000 × g for 30 min at 4°C. This
procedure separated the suspension into three phases, including the
top water phase, the middle denatured protein phase, and the bottom
lipid phase. The upper aqueous phase of each sample was transferred
into a new Eppendorf vial and evaporated to dryness. The residue
was reconstituted with 580 µl of D2O containing 30 µM
PBS (pH, 7.4) and 0.1–0.5 mM TSP, which respectively provided the
deuterium lock signal for the NMR spectrometer and the chemical
shift reference (δ0.0). The solution was centrifuged at 12,000 × g
for 5 min at 4°C, and 550 µl was transferred into a 5-mm NMR tube
for NMR spectroscopy (22).
The 1H NMR experiments were carried out
on a Bruker Avance II 600 spectrometer (Bruker BioSpin,
Rheinstetten, Germany) operating at 600.13 MHz and a temperature of
300 K. A one-dimensional spectrum for each sample was acquired by
using a standard (1D) Carr-Purcell-Meiboom-Gill (CPMG) pulse
sequence to observe metabolite signals. The water signal was
suppressed with a relaxation delay of 5 sec. Spectra results were
the summation of 67 free induction decays (FIDs), which were
collected into 64 K data points with a spectral width of 12,335.5
Hz and an acquisition time of 2.66 sec. The total pulse recycle
delay was 7.66 sec. Prior to Fourier transformation, the FIDs were
weighted by a Gaussian function with line-broadening factor of 0.3
Hz and spectra were referenced to TSP resonance at δ0.0 (23).
Data processing and multivariate
statistical analysis
The data processing was carried out using
MestReNova-6.1.1–6384 software. The raw NMR data (FIDs) were
manually Fourier transformed using it. The 1H NMR
spectra of all tissue samples were phase-adjusted and
baseline-corrected after referencing to TSP resonance at δ0.0. The
one-dimensional spectra ranging from 0.5 to 9.5 ppm was divided
into 4,500 integral segments δ0.002 ppm in width. The regions of
4.66–4.94 and 3.34–3.37 ppm were both removed for excluding the
effect of imperfect water and methanol signals. Moreover, to
eliminate the dilution or bulk mass differences among samples due
to the different weight of tissue, the integrated data were
normalized before pattern recognition analysis and assigned the
same total integration value for each spectrum.
The normalized data were exported into statistical
software SIMCA-P+ 11 (Umetrics AB), with which principal component
analysis (PCA), partial least squares-discriminant analysis
(PLS-DA), and orthogonal partial least squares-discriminant
analysis (OPLS-DA) were performed using standard procedures. The
analyses were conducted with reference to the established methods
(24,25). The PLS-DA models were
cross-validated by a 200-times permutation analysis, and the
resulting R2 and Q2 values were calculated,
which were used to assess the amount of variation. In order to
enhance interpretability of the model, the model coefficients were
then back-calculated from the y variables incorporating the weight
of the variables, which as specific model coefficients locate the
NMR variables. The coefficient plots were generated with Matlab
scripts, which were color-coded with the absolute value of
coefficients (r).
To identify the significant metabolites between
tumor tissues and normal controls, the variable importance in the
projection (VIP) >1 values of all peaks from OPLS-DA models and
unpaired (p<0.05) to the chemical shifts were analyzed and taken
as coefficients. Only those metabolites meeting VIP >1 and
p<0.05, were identified as distinguishing ones. The metabolite
identification met two conditions: the corresponding chemical shift
and multiplicity, according to previous literature and the Human
Metabolome Database (http://www.hmdb.ca/).
Results
Study population
In this study, a total of 166 tissue samples were
investigated, 125 of which were CRC tissue samples. The CRC tissues
were classified into two subgroups, a lymph node non-metastatic CRC
group (males, 36; females, 37; age range, 28–86 years; median age,
57.8 years) and a lymph node metastatic CRC group (males, 29;
females, 23; age range, 31–71 years; median age, 51 years).
Forty-one tissue samples were normal controls (males, 16; females,
25; age range, 35–85 years; median age, 56.8 years). The
clinicopathological characteristics of the CRC patients are
summarized in Table I. The
nutritional status, tissue histology, pathological grade and TNM
stages are presented in Table I.
The Stages of the lymph node non-metastatic CRC patients were
determined according to the American Joint Committee on Cancer
(AJCC) for CRC: stage I, 34 patients; stage IIA, 38 patients; stage
IIC, 1 patient. The stages of the lymph node metastatic CRC
patients were as follows: stage IIIA, 6 patients; stage IIIB, 28
patients; stage IIIC, 4 patients; stage IVA, 14 patients. The
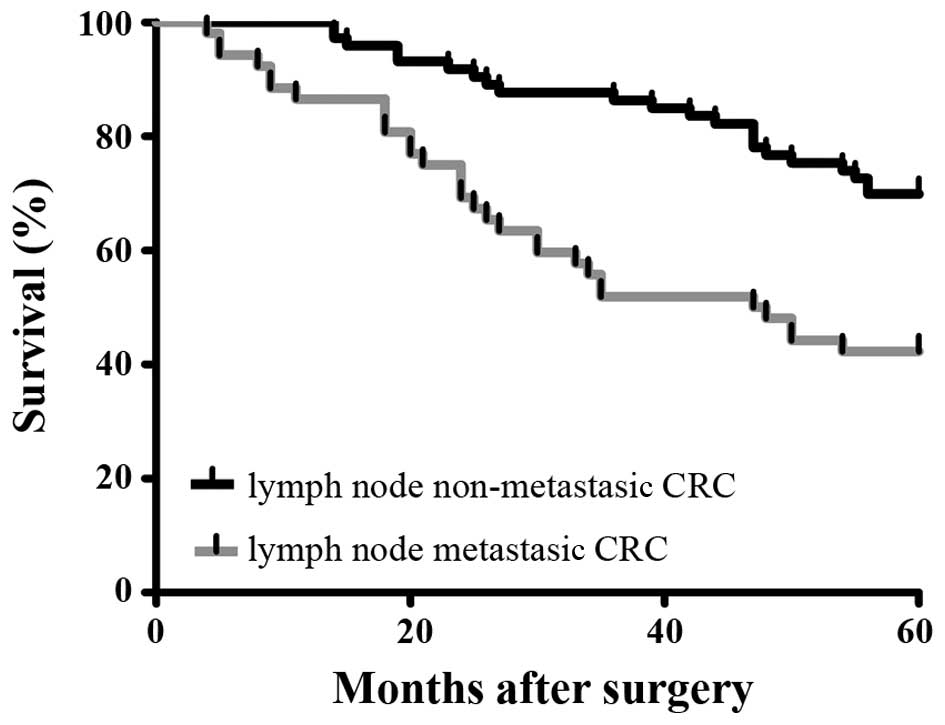
survival rate of the patients enrolled in this study is also shown
(Fig. 1). The FYSR of the lymph
node non-metastatic CRC patients was significantly higher than that
of the lymph node metastatic CRC patients.
1H NMR metabolic profiling
of CRC tissue samples
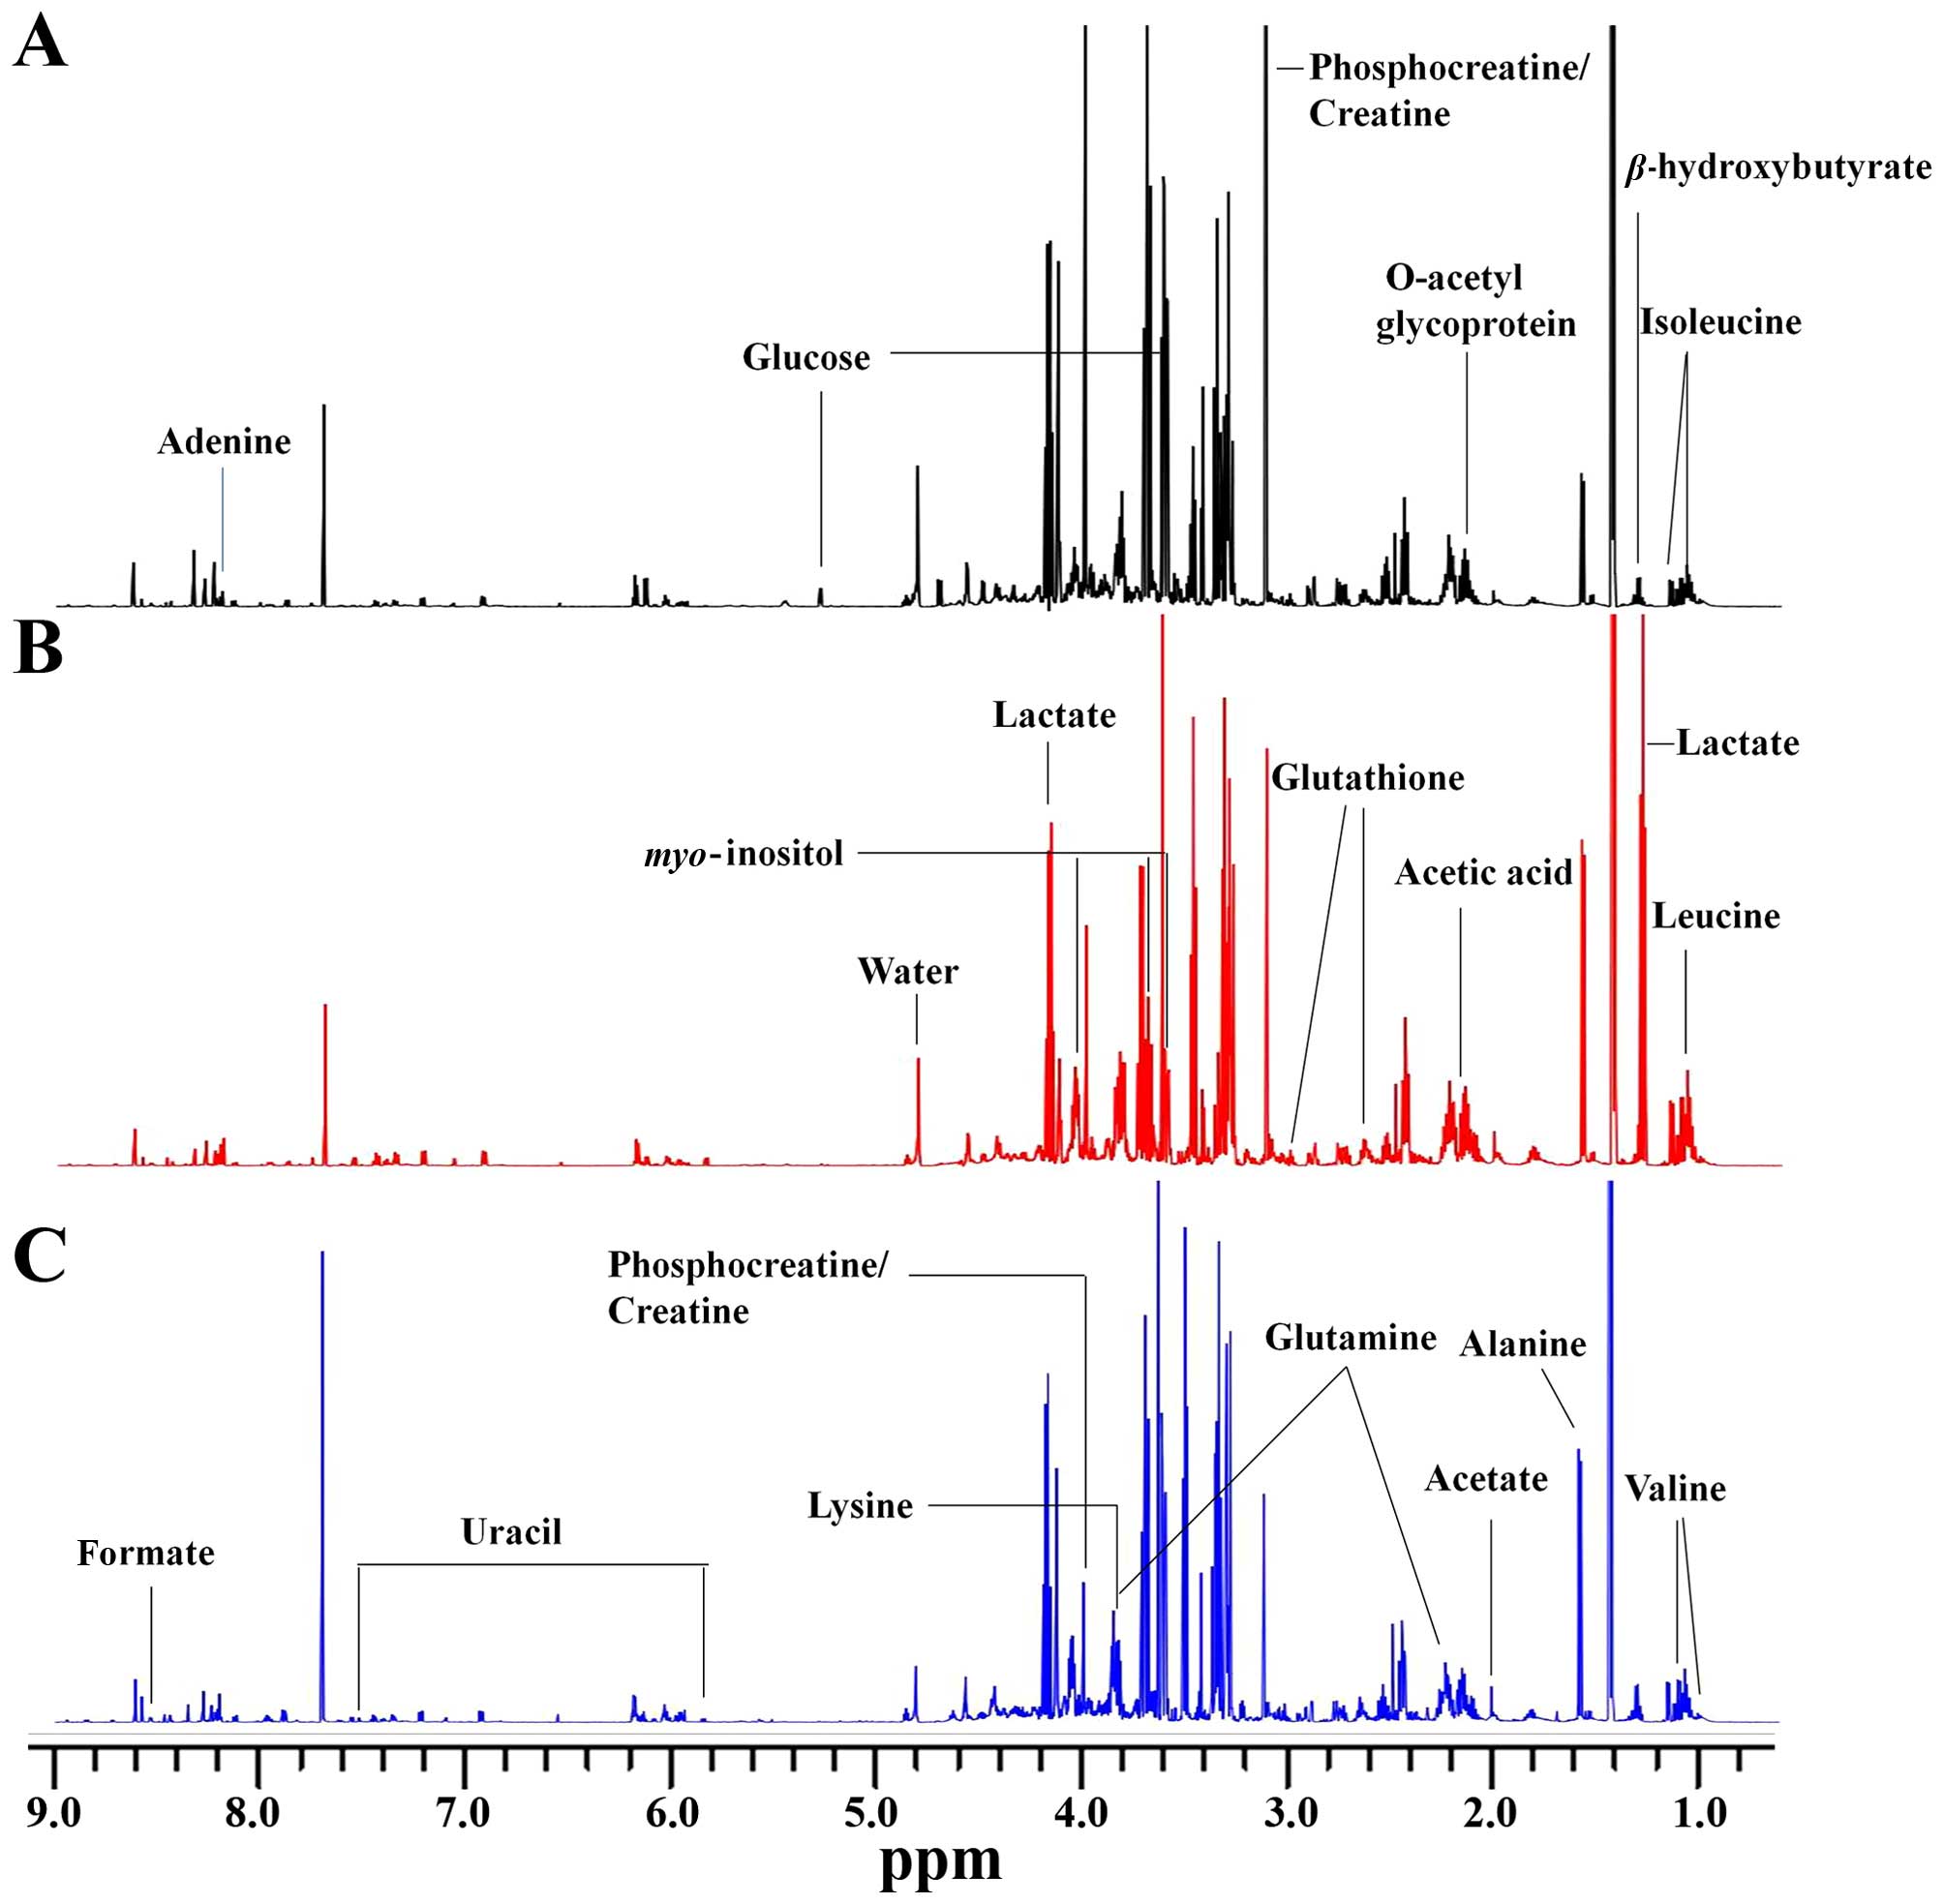
The representative 1H NMR spectrum of
aqueous phase extracts of non-metastatic CRC, metastatic CRC and
normal control tissues are shown (Fig.
2A-C), respectively. The spectrum was processed and converted
into 4,500 integral regions of δ0.002 ppm width as described in
‘Materials and methods’. The major spectrum can be assigned to
specific metabolites by comparing their chemical shifts and
spectral peak multiplicities with literature data and spectra of
standards acquired in Human Metabolome Database (http://www.hmdb.ca/). Fig.
2 shows clear visible differences among the three groups. As a
result, a series of altered endogenous metabolites were observed.
The spectral region from 0.5 to 5.0 ppm included many signals, such
as leucine, valine, β-hydroxybutyrate, lactate, acetate, glutamine,
glutathione (GSH), acetic acid, myo-inositol, lysine and
glucose. The specific signals from 5.0 to 9.5 ppm were few,
including glucose, uracil, adenine, formate and several unknown
signals. These major metabolites are involved in multiple metabolic
processes, especially in energy metabolism (25,26).
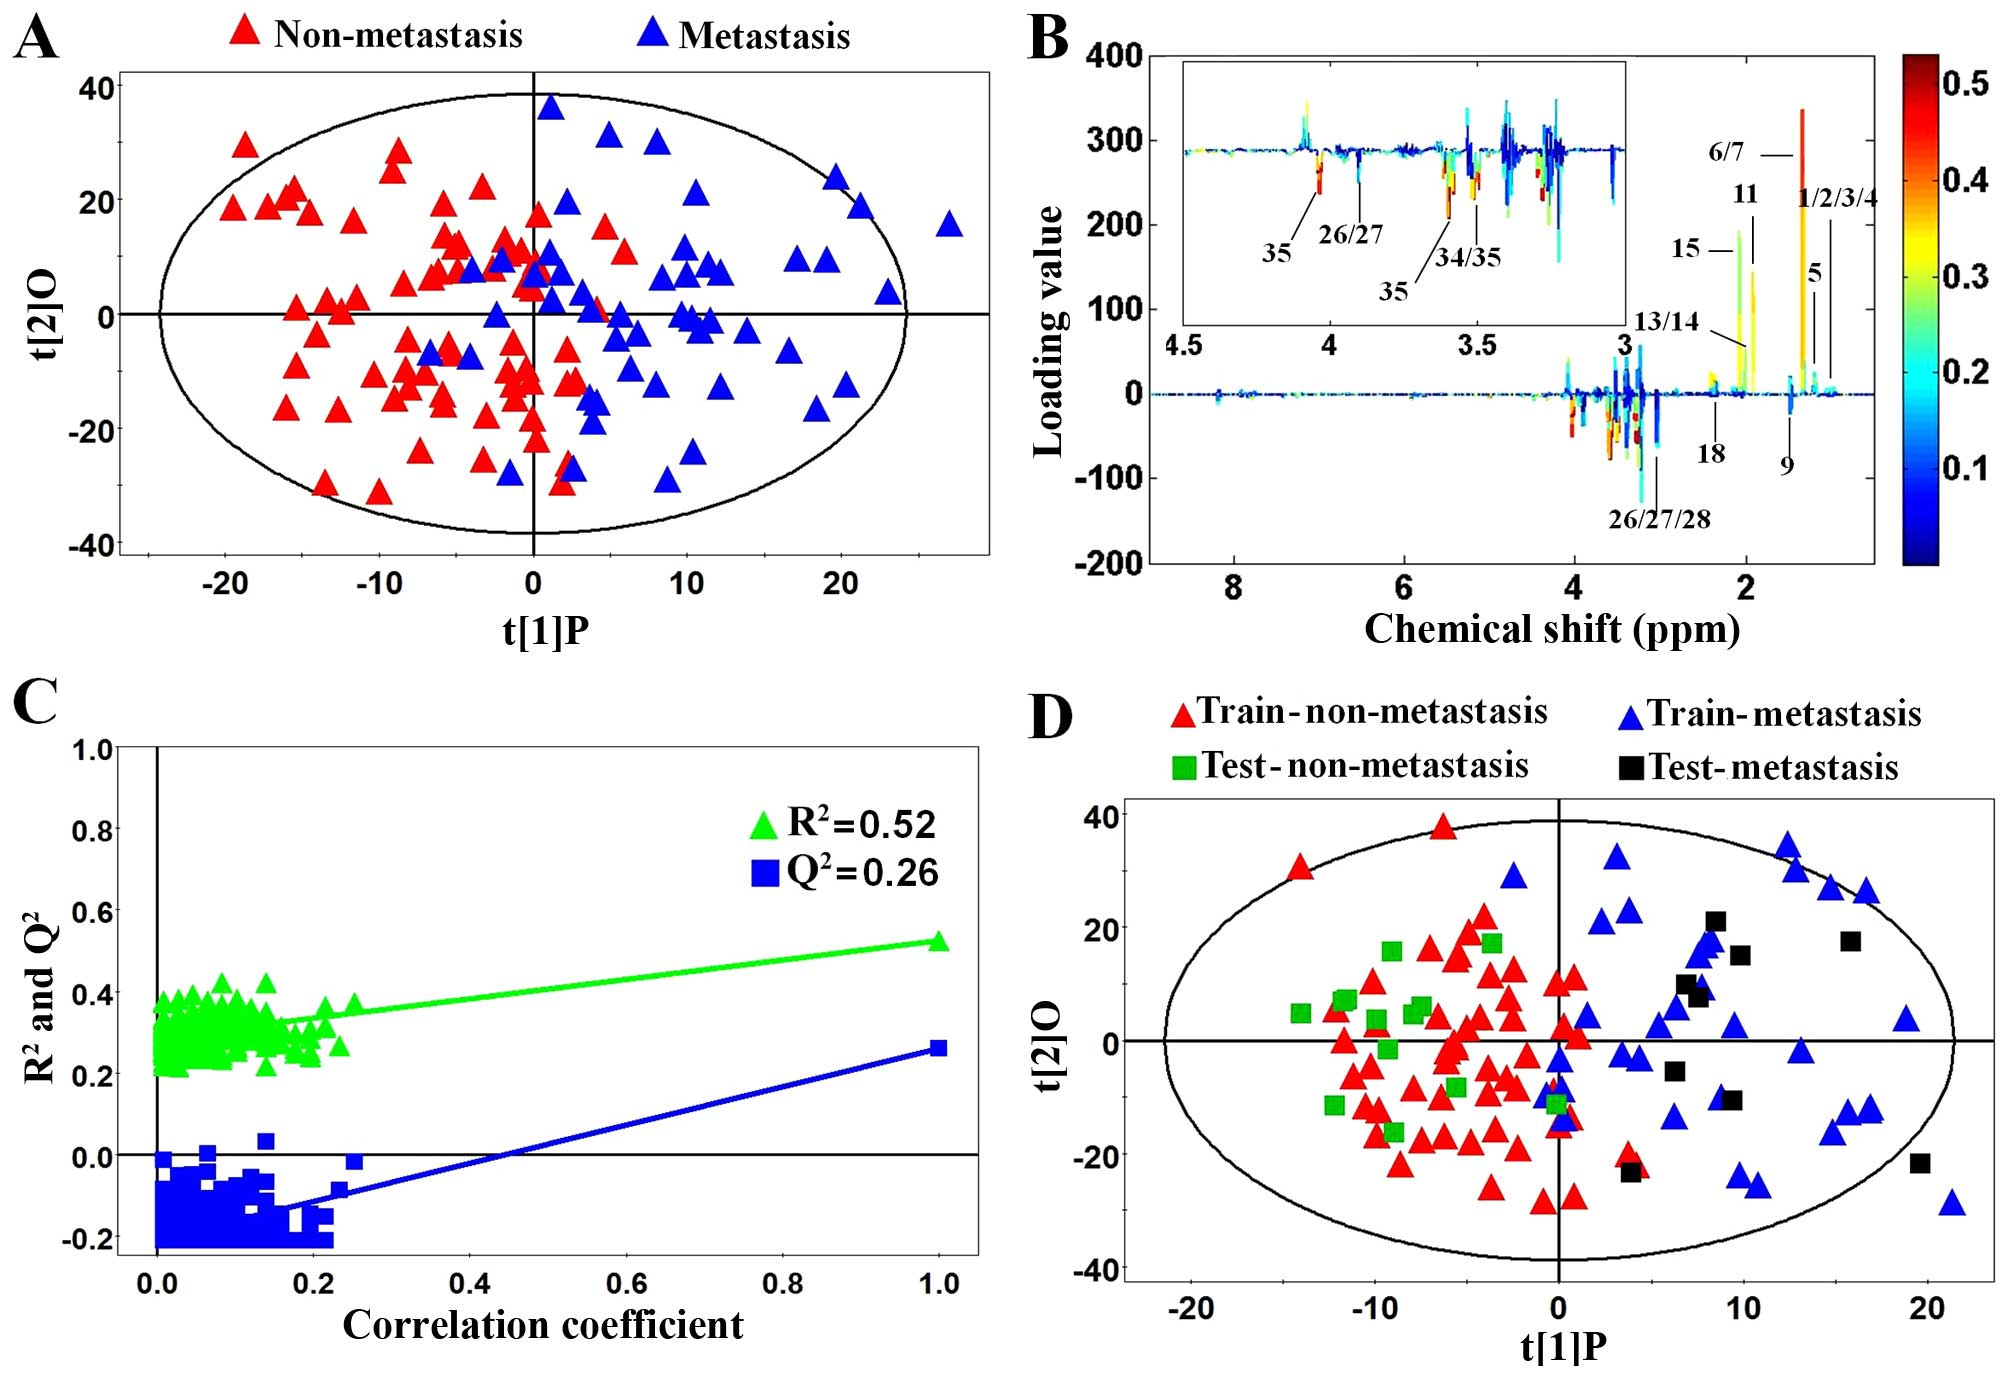
Multivariate statistical analysis of
non-metastatic tissues, metastatic tissues and normal controls
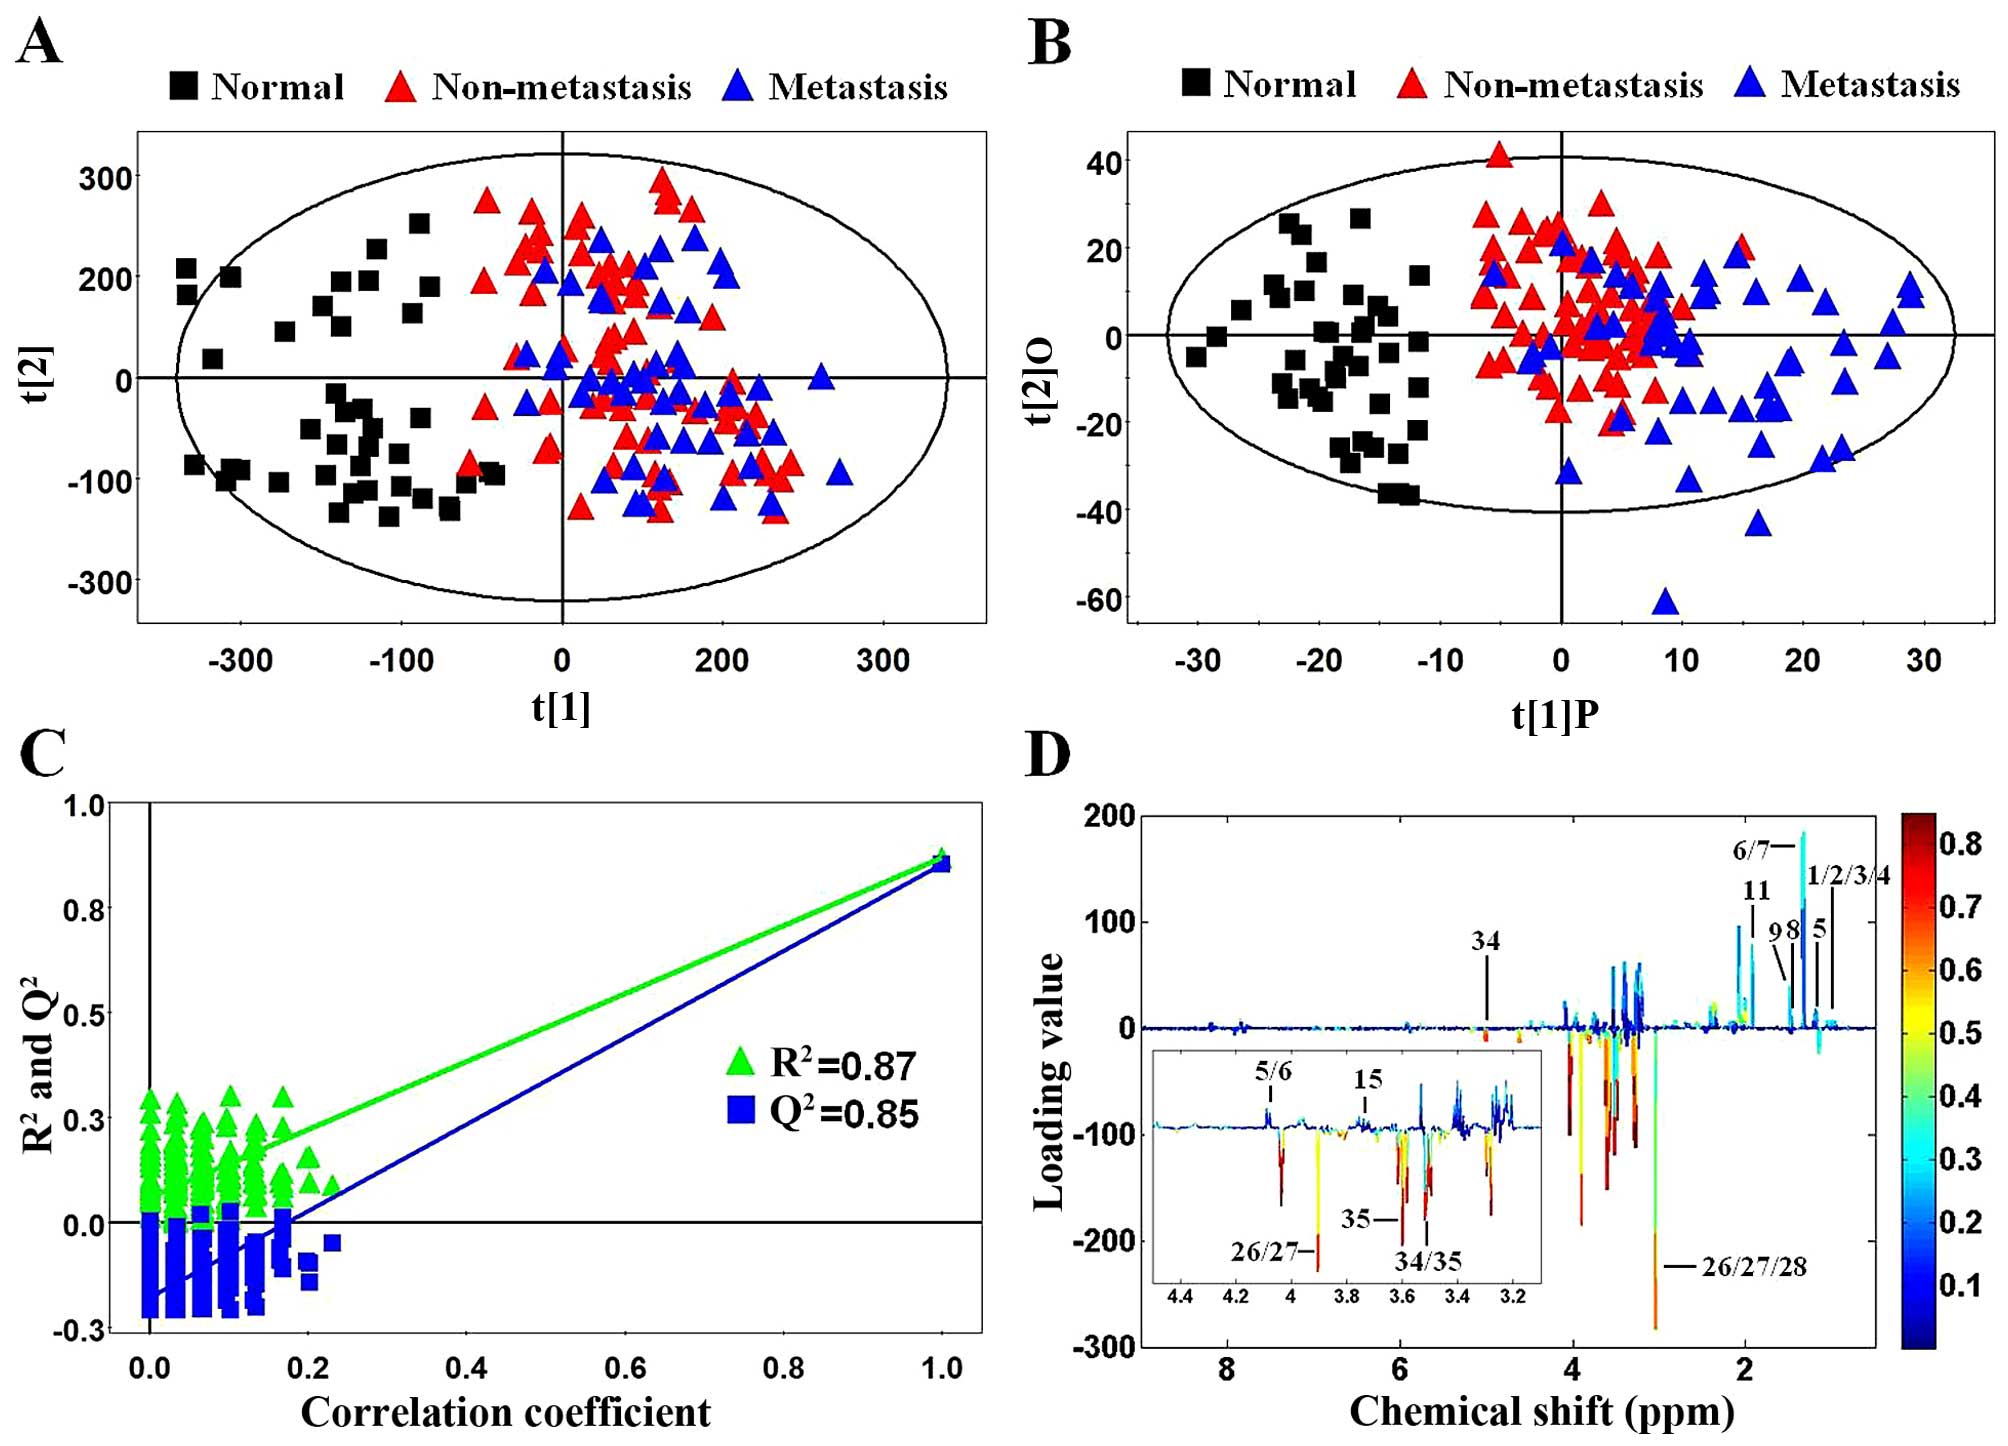
First, PCA, as an unsupervised multivariate
statistical model, was applied to illustrate intrinsic variations
among non-metastatic CRC, metastatic CRC and normal control tissues
after 1H NMR data normalization. The PCA score plot
(2PCs, R2X=0.44, Q2=0.277) showed that CRC
samples (color triangles) and normal controls (black blocks) were
scattered into different regions (Fig.
3A). The majority of samples were located in the 95% confidence
interval. Therefore, to ensure the maximum information, all of the
samples were used in the following analysis. However, there was no
significant difference between the non-metastatic (red triangles)
and metastatic (blue triangles) CRC samples in the PCA score plot
(Fig. 3A). Next, to enhance the
separation of the three groups, OPLS-DA was performed. As shown in
Fig. 3B, OPLS-DA showed a dramatic
difference between the CRC and normal control samples as well as an
obvious trend of profile separation between the non-metastatic and
metastatic CRC samples. Moreover, model validation assured that the
explained variation (R2=0.87) and the predictive
capability (Q2=0.85) were significantly high, which
demonstrated that it was an excellent model and reliable for
explaining and predicting the variations (Fig. 3C). The OPLS-DA loadings were colored
according to the absolute value of the coefficients (Fig. 3D) and showed the significant
class-discriminating metabolites responsible for the clustering
patterns. The signals in the positive quadrant represented the
upregulated metabolites in CRC tissues compared to normal controls.
On the other hand, the negative signals corresponded to the
downregulated metabolites in the CRC tissues.
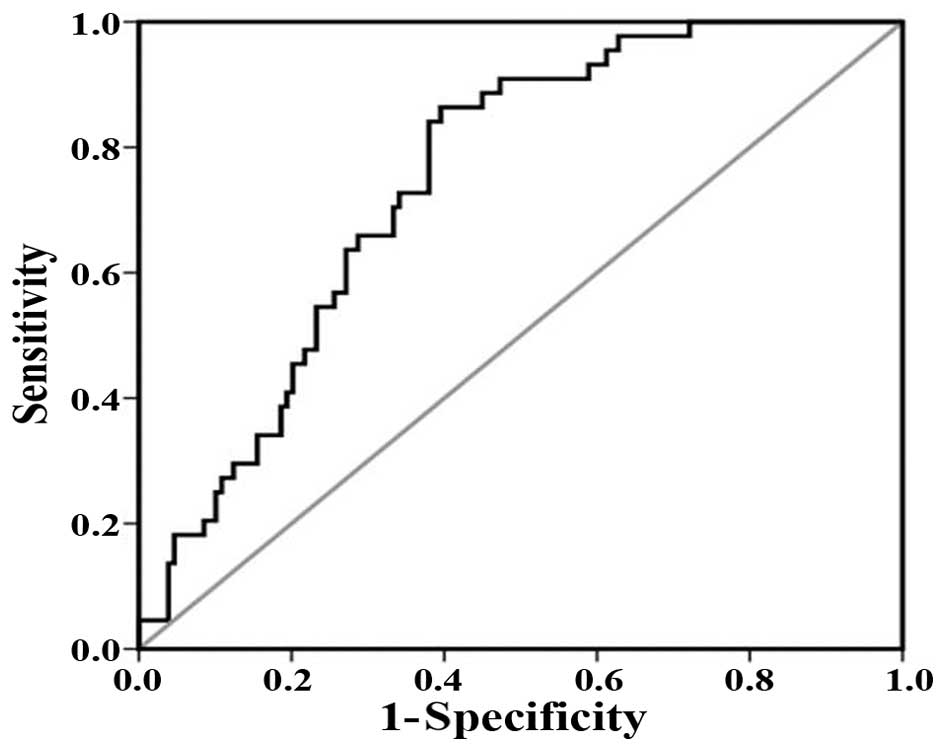
To prove the robustness of the OPLS-DA model in
discriminating CRC from controls, receiver operating characteristic
(ROC) analysis was carried out. Area under the curve (AUC) value
was 0.748 (Fig. 4). This diagnostic
model was used just to identify the tissue metabolic biomarkers
rather than to replace the established histopathologic diagnostic
standard for CRC. Using a combination of the VIP >1 with
p<0.05, the 30 and 39 distinguishing metabolites were identified
for the non-metastatic and metastatic CRC cases (Table II). Among them, 28 differential
metabolites were identified both in the non-metastatic and
metastatic CRC cases. The changed metabolites in the CRC cases
included upregulated and downregulated levels. The increased tissue
metabolites were lactate, threonine, lipid, succinate,
dimethylglycine (DMG), serine, arginine and uracil, whereas the
decreased metabolites included glucose, ketoglutarate,
phosphocreatine, creatine and myo-inositol. The abnormal
changes in tissue metabolites reflected the metabolic phenotype.
Moreover, they also provide insight into the underlying metabolism
of CRC, improving the systematic understanding of the pathological
changes of this disease.
| Table II.Differential tissue metabolites
identified among the non-metastatic CRC, metastatic CRC and normal
control samples. |
Table II.
Differential tissue metabolites
identified among the non-metastatic CRC, metastatic CRC and normal
control samples.
|
|
|
| Non-metastatic vs.
normal controls | Metastatic vs.
normal controls |
|---|
|
|
|
|
|
|
|---|
| Metabolites | Chemical shift |
Mutiplicitya | VIPb |
P-valuec | FCd | VIPb |
P-valuec | FCd |
|---|
| 2-Hydroxyisovaleric
acid | 0.98 | d | 1.91 | <0.001 | 1.28 | 1.41 | <0.001 | 1.32 |
|
| 4.13 | d | 1.63 | <0.001 | 1.14 | 1.67 | <0.05 | 1.11 |
| Isoleucine | 0.95 | t | 1.99 | 0.112 | 1.07 | 1.58 | 0.410 | 1.04 |
|
| 1.01 | d | 0.89 | <0.05 | 1.10 | 1.00 | <0.05 | 1.11 |
| Leucine | 0.96 | t | 0.80 | <0.05 | 1.11 | 1.32 | <0.05 | 1.13 |
| Valine | 0.99 | d | 1.91 | <0.001 | 1.28 | 1.41 | <0.001 | 1.32 |
|
| 1.05 | d | 1.26 | <0.001 | 1.30 | 1.33 | <0.001 | 1.36 |
|
β-hydroxybutyrate | 1.2 | d | 1.61 | 0.192 | 1.17 | 1.71 | <0.05 | 1.36 |
|
| 4.16 | m | 0.48 | <0.05 | 1.14 | 0.44 | 0.737 | 1.01 |
| Lactate | 1.33 | d | 1.08 | <0.001 | 1.22 | 2.12 | <0.001 | 1.21 |
|
| 4.11 | q | 0.86 | <0.001 | 1.18 | 1.51 | <0.001 | 1.14 |
| Threonine | 1.33 | d | 1.08 | <0.001 | 1.22 | 2.12 | <0.001 | 1.21 |
| Alanine | 1.48 | d | 1.87 | <0.001 | 1.46 | 1.27 | <0.001 | 1.39 |
| VLDL:
-CH2-CH2-CH2O | 1.58 | br | 1.36 | <0.001 | −1.32 | 0.86 | <0.05 | −1.16 |
| Thymine | 1.86 | d | 1.20 | <0.001 | −1.42 | 0.90 | 0.172 | −1.15 |
| Acetate | 1.93 | s | 0.08 | 0.335 | −1.09 | 1.75 | <0.001 | 3.64 |
| Lipid,
-CH2-CH=CH | 2.03 | br | 1.85 | <0.05 | 1.11 | 2.04 | <0.001 | 1.20 |
| O-acetyl
glycoprotein | 2.07 | s | 1.14 | <0.001 | 1.20 | 1.56 | <0.001 | 4.92 |
| Acetic acid | 2.08 | s | 1.14 | <0.001 | 1.20 | 1.56 | <0.001 | 4.92 |
| Glutamine | 2.14 | m | 0.98 | 0.721 | 1.01 | 1.53 | 0.088 | 1.06 |
|
| 3.77 | m | 0.73 | <0.001 | 1.11 | 1.09 | <0.001 | 1.08 |
| Lipid,
-CH2-C=O | 2.26 | br | 0.28 | 0.802 | 1.01 | 1.15 | <0.05 | 1.10 |
| Acetoacetate | 2.28 | s | 0.43 | 0.065 | 1.09 | 1.11 | <0.05 | 1.17 |
| Succinate | 2.41 | s | 1.23 | <0.05 | 1.18 | 1.88 | <0.001 | 1.41 |
|
α-ketoglutarate | 2.45 | t | 1.17 | <0.001 | −1.24 | 0.84 | <0.05 | −1.19 |
|
| 3.01 | t | 0.47 | 0.191 | −1.06 | 1.06 | 0.906 | −1.01 |
| Glutathione | 2.56 | m | 2.28 | <0.001 | 1.36 | 2.46 | <0.001 | 1.35 |
|
| 2.96 | m | 0.81 | <0.001 | 1.22 | 1.76 | <0.001 | 1.24 |
| Methylamine | 2.59 | s | 0.73 | <0.001 | 1.26 | 1.33 | <0.05 | 1.20 |
| Dimethylamine | 2.73 | s | 0.24 | 0.453 | −1.03 | 1.74 | <0.05 | 1.18 |
| Sarcosine | 2.75 | s | 0.12 | 0.906 | 1.01 | 1.04 | <0.05 | 1.18 |
| TMA | 2.88 | s | 0.92 | 0.470 | 1.08 | 1.58 | <0.05 | 1.31 |
| DMG | 2.91 | s | 1.38 | 0.252 | 1.12 | 1.42 | <0.05 | 1.33 |
|
| 3.71 | s | 2.55 | <0.001 | 1.46 | 2.44 | <0.001 | 1.68 |
|
Phosphocreatine | 3.04 | s | 2.89 | <0.001 | −2.11 | 3.22 | <0.001 | −1.94 |
|
| 3.93 | s | 1.54 | <0.001 | −1.93 | 2.34 | <0.001 | −1.83 |
| Creatine | 3.04 | s | 2.89 | <0.001 | −2.11 | 3.22 | <0.001 | −1.94 |
|
| 3.94 | s | 1.54 | <0.001 | −1.93 | 2.34 | <0.001 | −1.83 |
| Creatinine | 3.04 | s | 2.89 | <0.001 | −2.11 | 3.22 | <0.001 | −1.94 |
| PC | 3.21 | s | 1.37 | <0.05 | 1.16 | 1.20 | <0.05 | 1.16 |
| GPC | 3.23 | s | 1.75 | <0.001 | 1.29 | 1.58 | <0.05 | 1.19 |
| Arginine | 3.25 | t | 1.24 | <0.001 | 1.73 | 1.37 | <0.001 | 1.40 |
|
Trimethylamine-N-oxide | 3.27 | s | 1.24 | <0.001 | 1.87 | 1.37 | <0.001 | 1.51 |
| Taurine | 3.27 | t | 3.36 | <0.05 | 1.09 | 3.81 | <0.05 | 1.09 |
|
| 3.43 | t | 1.14 | <0.001 | 2.22 | 1.61 | <0.001 | 1.71 |
| Glucose | 3.55 | dd | 3.29 | <0.001 | −2.08 | 3.77 | <0.001 | −2.02 |
|
| 5.23 | dd | 3.03 | <0.001 | −5.16 | 3.11 | <0.001 | −4.41 |
|
myo-inositol | 3.55 | dd | 3.29 | <0.001 | −2.08 | 3.77 | <0.001 | −2.02 |
|
| 3.63 | t | 2.81 | <0.001 | −1.93 | 3.45 | <0.001 | −1.99 |
|
| 4.06 | t | 3.37 | <0.001 | −1.87 | 3.85 | <0.001 | −1.95 |
| Lysine | 3.77 | m | 0.73 | <0.001 | 1.11 | 1.09 | <0.001 | 1.08 |
| Glycolate | 3.93 | s | 1.54 | <0.001 | −1.93 | 2.34 | <0.001 | −1.83 |
| Serine | 3.98 | m | 1.68 | <0.001 | 1.41 | 1.87 | <0.001 | 1.24 |
| Uracil | 5.8 | d | 1.58 | <0.001 | 4.17 | 2.15 | <0.001 | 3.67 |
|
| 7.54 | d | 2.18 | <0.001 | 2.25 | 2.23 | <0.001 | 2.16 |
| Tryptophan | 7.29 | m | 1.55 | <0.05 | −1.18 | 0.96 | 0.061 | −1.11 |
| Adenine | 8.12 | m | 0.89 | <0.001 | 1.67 | 1.14 | <0.001 | 1.48 |
| Formate | 8.45 | s | 0.64 | <0.05 | 1.30 | 1.68 | <0.001 | 1.38 |
Performing metabolic profiling between
non-metastatic and metastatic CRC samples will be valuable in
identifying potential biomarkers of lymph node metastatic CRC and
understanding the molecular mechanisms involved. To our knowledge,
this study was the first to show the differences in metabolic
profiling between non-metastatic and metastatic CRC cases. The
score plot of OPLS-DA (2PCs, R2Y=0.742,
Q2=0.349) showed that the metastatic CRC cases could be
separated from non-metastatic CRC cases (Fig. 5A). To get an insight into the type
of metabolites responsible for the clustering patterns between the
subjects, the loading plots corresponding to OPLS-DA models are
presented (Fig. 5B). The relative
changes in metabolites with significant correlation coefficients
were a major discriminating factor between non-metastatic and
metastatic CRC cases, implying the biochemical alterations in
different morbidity. The permutation analysis of the corresponding
OPLS-DA is shown in Fig. 5C, which
indicated that the current model was reliable for explaining and
predicting the observed variations. Also, to further confirm the
performance of the model, each class of non-metastatic or
metastatic CRC samples was randomly classified into a training set
(80% samples) and a testing set (20% samples). Prediction
parameters of the testing sample using the OPLS-DA model
established with the training set were as follows:
R2X=0.196, R2Y=0.754, Q2=0.245. As
shown in Fig. 5D, the major testing
samples were predicted correctly, which proved that lymph node
metastasis could be used to stage CRC patients into two subgroups
with different prognostic effects.
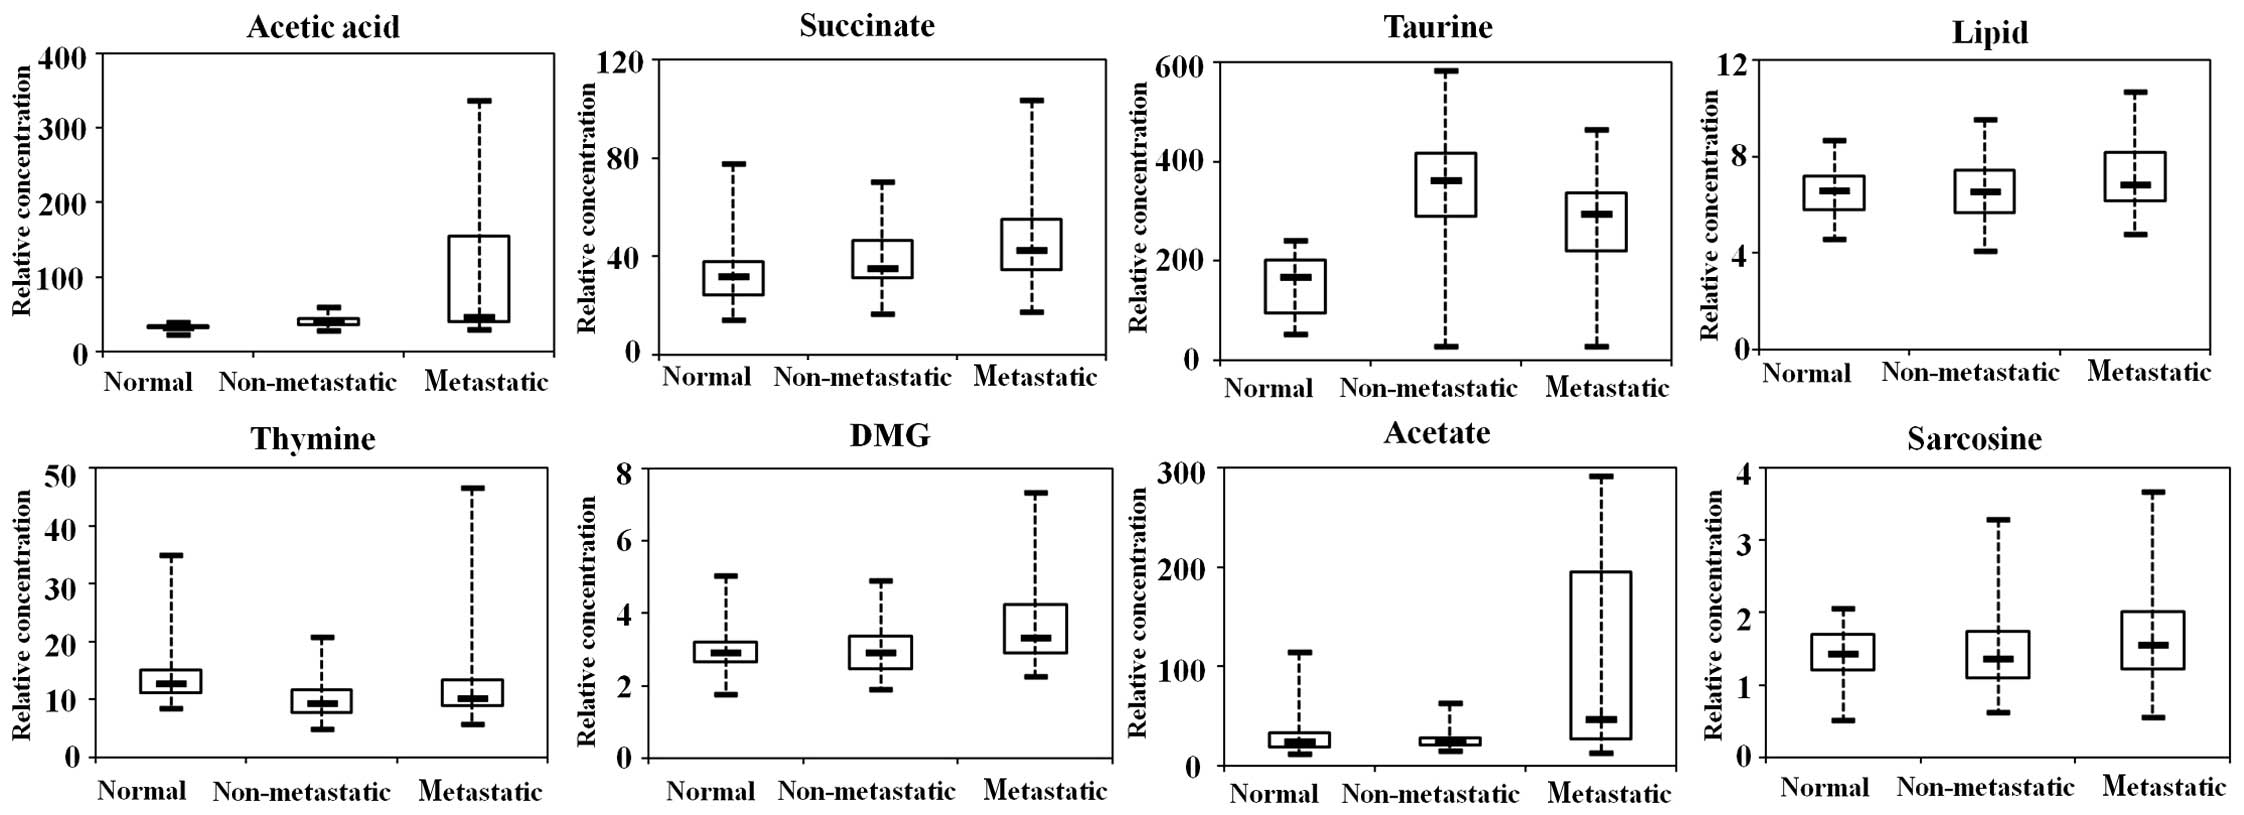
Tissue metabolic biomarker selection
and altered metabolic pathways
We have listed 42 distinguishing tissue metabolites
in Table II. Likewise, to further
analyze the metabolic differences between the non-metastatic and
metastatic CRC cases and identify the biomarkers in the process of
lymph node metastasis, 10 tissue metabolites (VIP >1 and
p<0.05) were identified as potential biomarkers for use in
discriminating between non-metastatic and metastatic CRC cases
(Table III). In order to better
show this result, the representative metabolites are displayed in
box-and-whisker plots (Fig. 6),
which show the concentration ranges, median quartiles and extremes.
Acetate, a short-chain fatty acid secreted by propionibacteria from
the human intestine, was significantly upregulated in metastatic
patients in comparison with normal controls and non-metastatic
cases. DMG, the product of the enzymatic conversion from betaine
and as alternative methyl group donors during folate deficiency,
was also increased in the metastatic CRC cases. The levels of
succinate and taurine were elevated in the CRC cases rather than
normal controls. However, thymine was decreased in the CRC
samples.
| Table III.Differential metabolites identified
between non-metastatic and metastatic CRC cases. |
Table III.
Differential metabolites identified
between non-metastatic and metastatic CRC cases.
|
|
|
| Metastatic vs.
non-metastatic |
|---|
|
|
|
|
|
|---|
| Metabolites | Chemical shift |
Multiplicitya | VIPb |
P-valuec | FCd |
|---|
| Thymine | 1.86 | d | 1.07 | <0.05 | 1.24 |
| Acetate | 1.93 | s | 2.87 | <0.001 | 3.98 |
| Lipid,
-CH2-CH2-CH=CH- | 1.96 | br | 1.55 | <0.05 | 1.28 |
| Acetic acid | 2.08 | s | 2.24 | <0.001 | 4.09 |
| Lipid,
-CH2-C=O | 2.26 | br | 1.18 | <0.05 | 1.09 |
| Acetoacetic
acid | 2.31 | s | 1.10 | <0.05 | 1.16 |
| Succinate | 2.41 | s | 2.53 | <0.001 | 1.20 |
| Dimethylglycine
(DMG) | 2.73 | s | 2.13 | <0.001 | 1.22 |
| Sarcosine | 2.75 | s | 1.17 | <0.05 | 1.17 |
| Taurine | 3.27 | t | 3.75 | <0.001 | −1.19 |
|
| 3.43 | t | 0.70 | <0.001 | −1.30 |
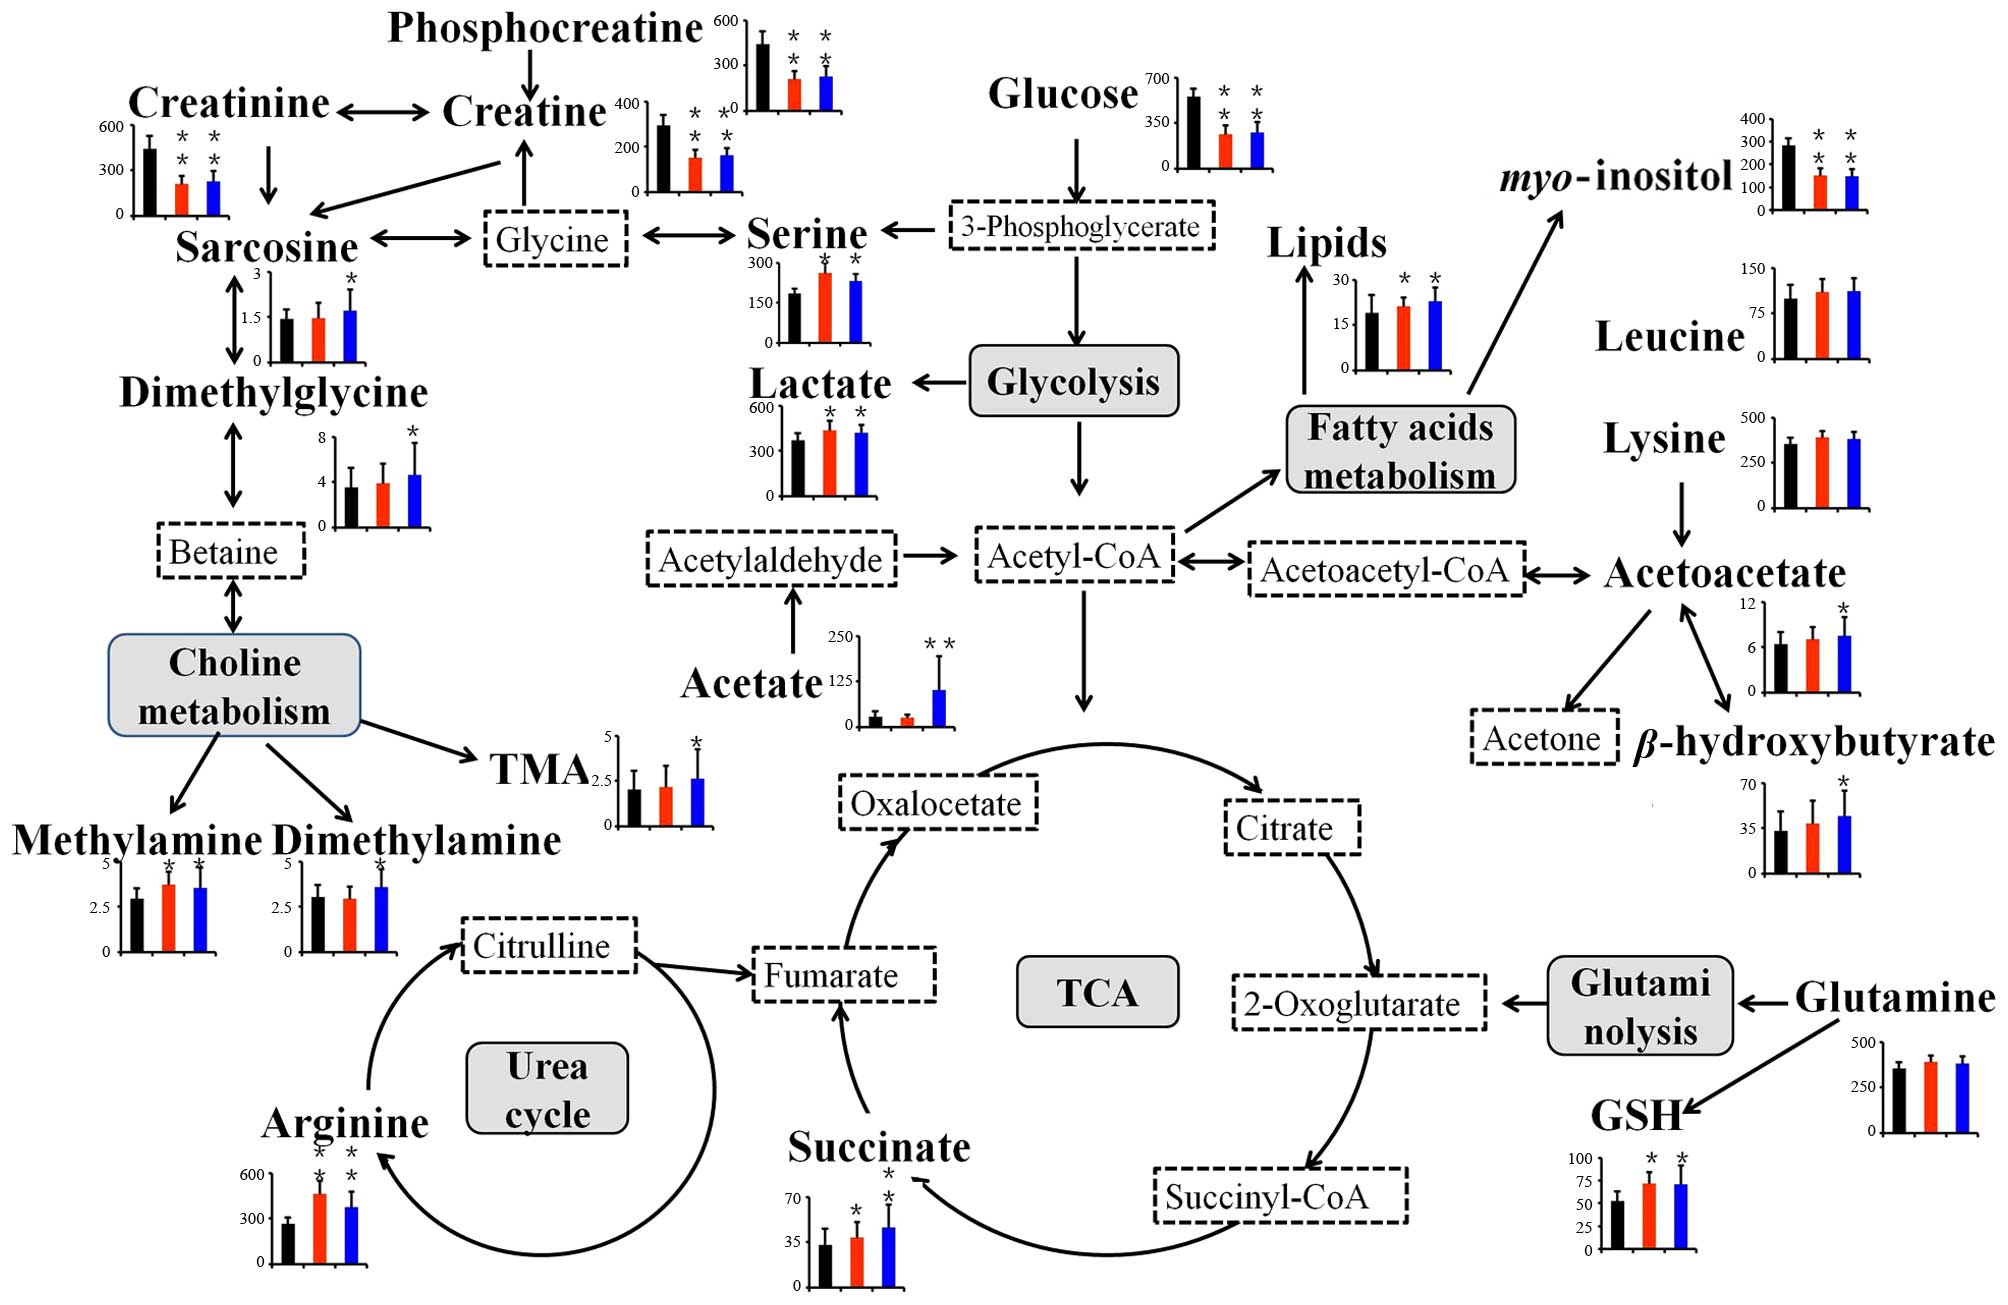
To further understand the possible connections among
these tissue metabolites, we proposed the related metabolic
pathways based on the modified metabolites and the information
obtained from the Kyoto Encyclopedia of Genes and Genomes website
(www.genome.jp/kegg/), which is presented
in Fig. 7. The changed metabolic
pathways included glycolysis (glucose and lactate), fatty acid
metabolism (lipids and myo-inositol), tricarboxylic acid
(TCA) (succinate), urea cycle (arginine), glutaminolysis (glutamine
and glutamate), serine synthesis (serine and glycine), ketoplasia
(acetoacetate, and β-hydroxybutyrate), choline metabolism
[trimethylamine (TMA), dimethylamine (DMA), methylamine,
dimethylglycine (DMG) and sarcosine] and amino acid metabolism
(leucine, lysine, serine and glycine).
Discussion
In this research, we studied the metabolic profiling
of human CRC tissues based on 1H NMR, and analyzed the
metabolic differences between the lymph node non-metastatic and
metastatic CRC cases to identify the potential biomarkers involved
in the progression of lymph node metastasis. In total, 42
distinguishing metabolites were identified, 28 of which were
identified both in the non-metastatic and metastatic CRC samples.
Among them, 10 metabolites were significantly altered between the
non-metastatic and metastatic CRC samples, which could be used as
potential biomarkers in discriminating the two classes. These
modified metabolites included thymine, acetate, succinate,
dimethylamine and sarcosine. Lymph node metastasis is the most
important prognostic factor for CRC. Compared with previous studies
concerning the metabolic profiling of human CRC samples (13,16,19,27),
to the best of our knowledge, the present study is the first to
show the differences in the metabolic profile between
non-metastatic and metastatic CRC cases. More importantly, we
identified the specific altered metabolites between the two
classes, which will be valuable in aiding accurate diagnosis and
enhancing the understanding of the potential molecular
mechanisms.
As shown in Fig. 7,
many metabolic pathways are altered between CRC patients and normal
controls. Compared with normal cells, cancer cells are
characterized by increased glycolysis and glutaminolysis to meet
the energy requirement for maintaining their rapid growth and
proliferation (28,29). The mean glucose levels were
apparently lowered in the non-metastatic and metastatic CRC
tissues, whereas lactate was consistently elevated, which matched
previous reports (30,31). Even in the presence of an adequate
oxygen supply, most cancer cells prefer to produce two molecules of
ATP through glycolytic breakdown of one molecule glucose instead of
36 molecules of ATP via mitochondrial oxidative phosphorylation,
which is known as the Warburg effect (6). This process is less efficient, thus
cancer cells must enhance glucose uptake. Along with the decrease
in glucose, lactate was found to accumulate in CRC tissues.
Lactate, as the end-product of glycolysis, is able to make the
tumor microenvironment consistently acidic, which stimulates tumor
cell metastasis in vivo and invasion in vitro
(26,32). In our study, the level of lactate
was not significantly disturbed between non-metastatic and
metastatic CRC tissues. Thus, glycolysis could play an important
role in CRC development, while the acidic microenvironment may not
be the main cause of lymph node metastasis in CRC.
In mammalian cells, glucose and glutamine are two of
the most abundant nutrients to support energy, precursors for
macromolecular synthesis, and substrates for other essential
functions (33). Glutamine, as the
most abundant amino acid, plays an important role in the metabolism
of tumor cells and proliferating cells. Due to the Warburg effect,
the amount of glucose-derived acetyl-CoA entering into the TCA
cycle decreases significantly, as a result, glutaminolysis is an
alternative source to replenish TCA cycle intermediates. Therefore,
glutaminolysis plays a unique role in generating ATP and
maintaining mitochondrial function. Increased glutaminolysis is an
important metabolic characteristic of cancer cells (29). Glutamine also serves as a major
source of nitrogen for biosynthesis, and a carbon substrate for
anabolic processes in cancer cells (34). Glutamine can be converted to
glutamate by glutaminase (GLS), releasing the amide nitrogen of
glutamine as ammonia, which contributes to multiple biosynthetic
pathways, including synthesis of other non-essential amino acids
and nucleotides (35). Glutamate is
converted to α-ketoglutarate (AKG) by two types of reactions, which
enters into TCA to support energy in the mitochondrion. Our results
showed that glutamine was upregulated in CRC tissues, which
suggested an excessive glutamine requirement to support the
proliferation of CRC cells as alternative energy, carbon and
nitrogen sources. Therefore the alternative modes of metabolism of
glucose and glutamine enable cancer cells to resist metabolic
stress and contribute to cancer cell survival and growth.
As an alternative process for glycolysis, the serine
synthesis pathway (SSP) was activated in CRC tissues, the mechanism
of which is poorly understood. Maddocks et al reported that
cancer cells rapidly use exogenous serine under metabolic stress
and serine deprivation-triggered activation of SSP, which
suppresses glycolysis and increases flux to the TCA cycle (36). Therefore the utility of serine
depletion will open a new therapeutic window in cancer cells that
show some sensitivity to serine depletion. Moreover, serine is
generated from the glycolytic intermediate 3-phosphoglycerate by
3-phosphoglycerate dehydrogenase (PHGDH). As a key metabolic enzyme
of SSP, PHGDH was reported to be amplified in melanoma (37), esophageal adenocarcinoma and
triple-negative breast cancer (38). Reducing PHGDH expression was found
to impair cancer cell proliferation, whereas overexpression of
PHGDH in human breast cells contributed to carcinogenesis by
facilitating glycolysis to SSP (39). Our findings together with previous
observations strongly support the hypothesis that disturbance of
SSP occurred in human CRC.
Sarcosine (N-methylglycine) is generated
during the metabolism and catabolism of glycine. As a
non-proteinogenic amino acid, it has a relationship with tumor
progression and the metastatic process in prostate cancer and was
studied as a sensitive tumor biomarker (40,41).
Moreover, sarcosine metabolism in metastatic breast cancer has yet
to been investigated (42,43). In our study, sarcosine was increased
in metastatic CRC samples compared with that in non-metastatic CRC
samples (p<0.05). Therefore, sarcosine may be a diagnostic
marker in lymph node metastatic CRC; the underlying molecular
mechanism needs further investigation.
Choline is an essential nutrient that is necessary
in phospholipid metabolism of cell membranes and functions as an
important methyl donor. It has been previously identified to play a
significant role in malignant transformation of tissues (44). Choline is degraded through two
pathways. One pathway involves the production of methylamines
(methylamine, dimethylamine, TMA). The levels of methylamines were
obviously upregulated in the CRC tissues in this study. The
methylamines are usually regarded as non-toxic. However, Lin et
al reported that they may induce hepatocarcinogenesis in rats
(45), thus we suspected that a
similar phenomenon may exist in human. The abundant accumulation of
the methylamines may indicate the disturbance of liver homeostasis
in the development of CRC, which is regarded as the primary target
organ of CRC metastasis. The other pathway involves oxidation to
betaine and donates a methyl group for homocysteine, finally
forming methionine and DMG. Methionine is in turn converted into
the universal methyl donor S-adenosyl methionine (SAM), as
the methyl group required for phospholipid metabolism. In our
study, DMG was significantly increased in metastatic CRC patients
(p<0.001), which indicated that the second metabolic pathway of
choline was activated. SAM is required for DNA methylation. Altered
DNA methylation is important in CRC (46,47).
Moreover, the recent study reported that aberrant methylation was
tightly related to lymph node metastasis of primary CRC (48). Therefore the disturbance in DMG may
suggest some changes in epigenetic mechanisms of CRC, which induces
lymph node metastasis. The upregulation of DMG may be a biomarker
in the diagnosis and therapy of CRC in the future.
As a short-chain fatty acid, acetate is secreted by
the intestinal diet propionibacteria, which induces mitochondrial
apoptosis in CRC cells and may be relevant in CRC prevention and
therapy (49,50). In tumor cells, acetate is activated
to form acetyl-CoA, which is a crucial central metabolite for fatty
acid synthesis, TCA cycle, ketoplasia and various acetylation
modifications of tumor cells. In our results, acetate was
significantly increased in metastatic than non-metastatic CRC
patients (FC=3.98). Lately, exogenous acetate was studied as an
important alternative fuel for cancer cells (51). The exogenous acetate was reported to
produce acetyl-CoA in the cytosol for epigenetic modifications and
lipogenesis under metabolic stresses in primary or metastatic brain
tumors (52). The incorporation of
acetate is mediated by acetyl-CoA synthetase 2 (ACSS2). The
increased ACSS2 was reported to play a critical role in diverse
human tumor types (51,52). Hypoxia-inducible factors (HIFs) are
frequently activated in cancer and can promote cell survival in a
tumor microenvironment of oxygen and glucose deficits. Acetate may
stimulate tumor growth and metastasis in an ACSS2- and
HIF-2-dependent manner (53).
Moreover, Marques et al reported that acetate-induced
apoptosis in CRC cells involved lysosomal membrane permeabilization
and cathepsin D release (54).
However, another study demonstrated that cathepsin D protected CRC
cells from acetate-induced apoptosis through autophagy-independent
degradation of damaged mitochondria (55). Thus, acetate has been proven to play
a critical role in CRC development and metastasis, although the
exact mechanism needs to be further investigated.
Cancer cells have increased reactive oxygen species
(ROS) levels and a disturbed redox environment compared to normal
cells, because of their accelerated metabolism, which distinguish
them from normal cells (56,57).
The ROS in cancer is a double-edged sword. On the one hand, ROS
plays a critical role in cancer cell development, proliferation,
metastasis and survival by inducing DNA mutations, genomic
instability and aberrant promoting tumorigenic cell signaling
(58). However, on the other hand,
the excessive ROS may also have a toxic effect on cancer cells and
induce cell death signaling, senescence and cell cycle arrest
(59). Therefore, various
antioxidants exist to reduce ROS levels in cells. GSH is a main
non-protein antioxidant in cancer cells, which is crucial for cell
proliferation and apoptosis and can protect cancer cells from
oxidative stress (60). Thus, in
our study the increase in GSH in non-metastatic and metastatic CRC
tissues compared to normal controls was the requirement of CRC to
maintain their proliferation and survival. The metabolic pathway
predominantly involved in GSH production is glutamine metabolism.
Glutamine, as the precursor of glutamate, is required for GSH
synthesis. The level of glutamine was also upregulated in our
results, indicating a high demand of GSH to reduce the ROS in CRC.
The contradictory ‘doubled-edged sword’ property of ROS makes
antioxidants a target for cancer therapy. One study reported that
the antioxidant treatment of overexpression of superoxide dismutase
3 (SOD3) inhibited breast cancer metastasis in a mouse xenograft
model (61). Another study showed
that N-acetylcysteine (NAC) and vitamin E accelerated the
progression of lung cancer by reducing ROS in mice (62). Chiang et al also exploited
ROS and GSH dual redox-responsive polymer micelles for anticancer
therapy (63). However, some
long-term randomized controlled trials of antioxidant supplements
did not prove that dietary antioxidant supplements were useful in
primary cancer prevention (64,65).
Overall, the increased levels of glutamine and GSH during CRC
progression suggest a progressive oxidative stress as well as a
potential indicator for the development and metastasis of CRC,
which may be a promising target of anticancer therapy.
Cancer is considered to be a type of metabolic
disease with enhanced metabolism, since malignant cells require
more amino acids to synthesize proteins and nucleic acids. The
levels of some amino acids were reported to be higher in cancer
than in normal controls (25,66).
Our results were also consistent with previous studies. In our
study, the levels of leucine, isoleucine, valine, alanine,
threonine, glutamine, arginine, lysine and serine were increased in
the CRC tissues. As branched-chain amino acids (BCAA), leucine,
isoleucine and valine are known to play a number of roles, such as
in muscle protein synthesis, insulin secretion, and energy
production through their catabolism (67). Threonine and methionine (produced by
choline metabolism in our results) are both essential for
maintaining the levels of SAM, which is important for subsequent
epigenetic regulation in cancer cells. The increased serine
indicated that the SSP was activated, which suppresses glycolysis
and increases flux to TCA (35).
Alanine and glutamine, as the key protein-derived glucose
precursor, are subsequently used by hepatic gluconeogenesis, which
produces a heavier burden for cancer patients. Arginine has long
been recognized as a critical nutrient for tissue healing and an
important component of immunonutrition. Dietary therapy containing
arginine and other components is associated with the improvement of
T-cell function (68). In addition,
there is evidence suggesting that arginine stimulates tumor growth
(68). However, the tryptophan was
decreased in CRC tissues compared to normal controls. Previous
studies showed that tryptophan was involved in a reduced immune
response mediated by indoleamine 2,3-dioxygenase (IDO), which
catalyzes tryptophan to produce kynurenine (69). So the downregulation of tryptophan
in CRC tissues possibly suggested a strong tryptophan catabolism
and an improved cancer cell immune escape in CRC. In a word, the
disturbances of amino acid catabolism reflected the needs for the
rapid proliferation and development of cancer cells.
In the present study, we globally analyzed the
tissue profiling and identified the characteristic metabolites
related to the carcinogenesis and metastasis of CRC based on
1H NMR spectroscopy combined with multivariate
statistical analysis. CRC patients were not only different from the
healthy controls, but also well-classified according to lymph node
metastasis by an OPLS-DA analysis. We identified a total of 10
tissue metabolite markers related to CRC lymph metastasis, of which
acetate and acetic acid were important (FC >3). Certainly, the
mechanism and clinical application will need future study. As far
as we know, the present study is the first to analyze the metabolic
prolifing between non-metastatic and metastatic CRC samples. The
identified metabolites may be valuable in monitoring the neoplasia,
invasion and metastasis of tumors. Further functional study and
more clinical sample analysis are needed to demonstrate the
potential application and the related mechanisms underlying
CRC.
Acknowledgements
This study was supported by the Project of the
National Natural Science Foundation of China (no. 81502096).
Glossary
Abbreviations
Abbreviations:
|
NMR
|
nuclear magnetic resonance
|
|
PCA
|
principal component analysis
|
|
PLS-DA
|
partial least squares-discriminant
analysis
|
|
OPLS-DA
|
orthogonal partial least
squares-discriminant analysis
|
|
VIP
|
variable importance in the
projection
|
|
ROC
|
receiver operating characteristic
|
|
AUC
|
area under the curve
|
References
|
1
|
Weitz J, Koch M, Debus J, Höhler T, Galle
PR and Büchler MW: Colorectal cancer. Lancet. 365:153–165. 2005.
View Article : Google Scholar : PubMed/NCBI
|
|
2
|
Jemal A, Siegel R, Xu J and Ward E: Cancer
statistics, 2010. CA Cancer J Clin. 60:277–300. 2010. View Article : Google Scholar : PubMed/NCBI
|
|
3
|
Siegel RL, Miller KD and Jemal A: Cancer
statistics, 2015. CA Cancer J Clin. 65:5–29. 2015. View Article : Google Scholar : PubMed/NCBI
|
|
4
|
Siegel R, Ma J, Zou Z and Jemal A: Cancer
statistics, 2014. CA Cancer J Clin. 64:9–29. 2014. View Article : Google Scholar : PubMed/NCBI
|
|
5
|
Abstracts from the 38th annual meeting of
the society of general internal medicine. J Gen Intern Med.
30:(Suppl 2). 45–551. 2015. View Article : Google Scholar : PubMed/NCBI
|
|
6
|
Warburg O: On the origin of cancer cells.
Science. 123:309–314. 1956. View Article : Google Scholar : PubMed/NCBI
|
|
7
|
Muñoz-Pinedo C, El Mjiyad N and Ricci JE:
Cancer metabolism: Current perspectives and future directions. Cell
Death Dis. 3:e2482012. View Article : Google Scholar : PubMed/NCBI
|
|
8
|
Jain M, Nilsson R, Sharma S, Madhusudhan
N, Kitami T, Souza AL, Kafri R, Kirschner MW, Clish CB and Mootha
VK: Metabolite profiling identifies a key role for glycine in rapid
cancer cell proliferation. Science. 336:1040–1044. 2012. View Article : Google Scholar : PubMed/NCBI
|
|
9
|
Gross S, Cairns RA, Minden MD, Driggers
EM, Bittinger MA, Jang HG, Sasaki M, Jin S, Schenkein DP, Su SM, et
al: Cancer-associated metabolite 2-hydroxyglutarate accumulates in
acute myelogenous leukemia with isocitrate dehydrogenase 1 and 2
mutations. J Exp Med. 207:339–344. 2010. View Article : Google Scholar : PubMed/NCBI
|
|
10
|
Fiehn O: Metabolomics - the link between
genotypes and phenotypes. Plant Mol Biol. 48:155–171. 2002.
View Article : Google Scholar : PubMed/NCBI
|
|
11
|
Song H, Wang L, Liu HL, Wu XB, Wang HS,
Liu ZH, Li Y, Diao DC, Chen HL and Peng JS: Tissue metabolomic
fingerprinting reveals metabolic disorders associated with human
gastric cancer morbidity. Oncol Rep. 26:431–438. 2011.PubMed/NCBI
|
|
12
|
Nicholson JK, Connelly J, Lindon JC and
Holmes E: Metabonomics: A platform for studying drug toxicity and
gene function. Nat Rev Drug Discov. 1:153–161. 2002. View Article : Google Scholar : PubMed/NCBI
|
|
13
|
Qiu Y, Cai G, Zhou B, Li D, Zhao A, Xie G,
Li H, Cai S, Xie D, Huang C, et al: A distinct metabolic signature
of human colorectal cancer with prognostic potential. Clin Cancer
Res. 20:2136–2146. 2014. View Article : Google Scholar : PubMed/NCBI
|
|
14
|
Jung J, Jung Y, Bang EJ, Cho SI, Jang YJ,
Kwak JM, Ryu H, Park S and Hwang GS: Noninvasive diagnosis and
evaluation of curative surgery for gastric cancer by using
NMR-based metabolomic profiling. Ann Surg Oncol. 21:(Suppl 4).
S736–S742. 2014. View Article : Google Scholar : PubMed/NCBI
|
|
15
|
Li Y, Song X, Zhao X, Zou L and Xu G:
Serum metabolic profiling study of lung cancer using ultra high
performance liquid chromatography/quadrupole time-of-flight mass
spectrometry. J Chromatogr B Analyt Technol Biomed Life Sci.
966:147–153. 2014. View Article : Google Scholar : PubMed/NCBI
|
|
16
|
Chen C, Deng L, Wei S, Gowda GA Nagana, Gu
H, Chiorean EG, Abu Zaid M, Harrison ML, Pekny JF, Loehrer PJ, et
al: Exploring metabolic profile differences between colorectal
polyp patients and controls using seemingly unrelated regression. J
Proteome Res. 14:2492–2499. 2015. View Article : Google Scholar : PubMed/NCBI
|
|
17
|
Ganti S, Taylor SL, Abu Aboud O, Yang J,
Evans C, Osier MV, Alexander DC, Kim K and Weiss RH: Kidney tumor
biomarkers revealed by simultaneous multiple matrix metabolomics
analysis. Cancer Res. 72:3471–3479. 2012. View Article : Google Scholar : PubMed/NCBI
|
|
18
|
Griffin JL and Shockcor JP: Metabolic
profiles of cancer cells. Nat Rev Cancer. 4:551–561. 2004.
View Article : Google Scholar : PubMed/NCBI
|
|
19
|
Zhu J, Djukovic D, Deng L, Gu H, Himmati
F, Chiorean EG and Raftery D: Colorectal cancer detection using
targeted serum metabolic profiling. J Proteome Res. 13:4120–4130.
2014. View Article : Google Scholar : PubMed/NCBI
|
|
20
|
Nuñez-Sánchez MA, García-Villalba R,
Monedero-Saiz T, García-Talavera NV, Gómez-Sánchez MB,
Sánchez-Álvarez C, García-Albert AM, Rodríguez-Gil FJ, Ruiz-Marín
M, Pastor-Quirante FA, et al: Targeted metabolic profiling of
pomegranate polyphenols and urolithins in plasma, urine and colon
tissues from colorectal cancer patients. Mol Nutr Food Res.
58:1199–1211. 2014. View Article : Google Scholar : PubMed/NCBI
|
|
21
|
Cheng Y, Xie G, Chen T, Qiu Y, Zou X,
Zheng M, Tan B, Feng B, Dong T, He P, et al: Distinct urinary
metabolic profile of human colorectal cancer. J Proteome Res.
11:1354–1363. 2012. View Article : Google Scholar : PubMed/NCBI
|
|
22
|
Beckonert O, Keun HC, Ebbels TM, Bundy J,
Holmes E, Lindon JC and Nicholson JK: Metabolic profiling,
metabolomic and metabonomic procedures for NMR spectroscopy of
urine, plasma, serum and tissue extracts. Nat Protoc. 2:2692–2703.
2007. View Article : Google Scholar : PubMed/NCBI
|
|
23
|
Hu Z, Deng Y, Hu C, Deng P, Bu Q, Yan G,
Zhou J, Shao X, Zhao J, Li Y, et al: ¹H NMR-based metabonomic
analysis of brain in rats of morphine dependence and withdrawal
intervention. Behav Brain Res. 231:11–19. 2012. View Article : Google Scholar : PubMed/NCBI
|
|
24
|
Wang H, Wang L, Zhang H, Deng P, Chen J,
Zhou B, Hu J, Zou J, Lu W, Xiang P, et al: ¹H NMR-based metabolic
profiling of human rectal cancer tissue. Mol Cancer. 12:1212013.
View Article : Google Scholar : PubMed/NCBI
|
|
25
|
Feng J, Liu H, Bhakoo KK, Lu L and Chen Z:
A metabonomic analysis of organ specific response to USPIO
administration. Biomaterials. 32:6558–6569. 2011. View Article : Google Scholar : PubMed/NCBI
|
|
26
|
Gu Y, Chen T, Fu S, Sun X, Wang L, Wang J,
Lu Y, Ding S, Ruan G, Teng L, et al: Perioperative dynamics and
significance of amino acid profiles in patients with cancer. J
Transl Med. 13:352015. View Article : Google Scholar : PubMed/NCBI
|
|
27
|
Martínez-Zaguilán R, Seftor EA, Seftor RE,
Chu YW, Gillies RJ and Hendrix MJ: Acidic pH enhances the invasive
behavior of human melanoma cells. Clin Exp Metastasis. 14:176–186.
1996. View Article : Google Scholar : PubMed/NCBI
|
|
28
|
Williams MD, Zhang X, Park JJ, Siems WF,
Gang DR, Resar LM, Reeves R and Hill HH Jr: Characterizing
metabolic changes in human colorectal cancer. Anal Bioanal Chem.
407:4581–4595. 2015. View Article : Google Scholar : PubMed/NCBI
|
|
29
|
Heiden MG Vander, Cantley LC and Thompson
CB: Understanding the Warburg effect: The metabolic requirements of
cell proliferation. Science. 324:1029–1033. 2009. View Article : Google Scholar : PubMed/NCBI
|
|
30
|
Daye D and Wellen KE: Metabolic
reprogramming in cancer: Unraveling the role of glutamine in
tumorigenesis. Semin Cell Dev Biol. 23:362–369. 2012. View Article : Google Scholar : PubMed/NCBI
|
|
31
|
Holst S, Stavenhagen K, Balog CI, Koeleman
CA, McDonnell LM, Mayboroda OA, Verhoeven A, Mesker WE, Tollenaar
RA, Deelder AM, et al: Investigations on aberrant glycosylation of
glycosphingolipids in colorectal cancer tissues using liquid
chromatography and matrix-assisted laser desorption time-of-flight
mass spectrometry (MALDI-TOF-MS). Mol Cell Proteomics.
12:3081–3093. 2013. View Article : Google Scholar : PubMed/NCBI
|
|
32
|
Ni Y, Xie G and Jia W: Metabonomics of
human colorectal cancer: New approaches for early diagnosis and
biomarker discovery. J Proteome Res. 13:3857–3870. 2014. View Article : Google Scholar : PubMed/NCBI
|
|
33
|
Schlappack OK, Zimmermann A and Hill RP:
Glucose starvation and acidosis: Effect on experimental metastatic
potential, DNA content and MTX resistance of murine tumour cells.
Br J Cancer. 64:663–670. 1991. View Article : Google Scholar : PubMed/NCBI
|
|
34
|
Dang CV: Links between metabolism and
cancer. Genes Dev. 26:877–890. 2012. View Article : Google Scholar : PubMed/NCBI
|
|
35
|
Pan T, Gao L, Wu G, Shen G, Xie S, Wen H,
Yang J, Zhou Y, Tu Z and Qian W: Elevated expression of glutaminase
confers glucose utilization via glutaminolysis in prostate cancer.
Biochem Biophys Res Commun. 456:452–458. 2015. View Article : Google Scholar : PubMed/NCBI
|
|
36
|
Maddocks OD, Berkers CR, Mason SM, Zheng
L, Blyth K, Gottlieb E and Vousden KH: Serine starvation induces
stress and p53-dependent metabolic remodelling in cancer cells.
Nature. 493:542–546. 2013. View Article : Google Scholar : PubMed/NCBI
|
|
37
|
Locasale JW, Grassian AR, Melman T,
Lyssiotis CA, Mattaini KR, Bass AJ, Heffron G, Metallo CM, Muranen
T, Sharfi H, et al: Phosphoglycerate dehydrogenase diverts
glycolytic flux and contributes to oncogenesis. Nat Genet.
43:869–874. 2011. View
Article : Google Scholar : PubMed/NCBI
|
|
38
|
Locasale JW and Cantley LC: Genetic
selection for enhanced serine metabolism in cancer development.
Cell Cycle. 10:3812–3813. 2011. View Article : Google Scholar : PubMed/NCBI
|
|
39
|
Possemato R, Marks KM, Shaul YD, Pacold
ME, Kim D, Birsoy K, Sethumadhavan S, Woo HK, Jang HG, Jha AK, et
al: Functional genomics reveal that the serine synthesis pathway is
essential in breast cancer. Nature. 476:346–350. 2011. View Article : Google Scholar : PubMed/NCBI
|
|
40
|
Khan AP, Rajendiran TM, Ateeq B, Asangani
IA, Athanikar JN, Yocum AK, Mehra R, Siddiqui J, Palapattu G, Wei
JT, et al: The role of sarcosine metabolism in prostate cancer
progression. Neoplasia. 15:491–501. 2013. View Article : Google Scholar : PubMed/NCBI
|
|
41
|
Baum CE, Price DK and Figg WD: Sarcosine
as a potential prostate cancer biomarker and therapeutic target.
Cancer Biol Ther. 9:341–342. 2010. View Article : Google Scholar : PubMed/NCBI
|
|
42
|
Cha YJ, Kim H, Jung WH and Koo JS:
Expression of sarcosine metabolism-related proteins according to
metastatic site in breast cancer. Int J Clin Exp Pathol.
7:7824–7833. 2014.PubMed/NCBI
|
|
43
|
Cha YJ, Jung WH, Cho NH and Koo JS:
Expression of sarcosine metabolism-related proteins in invasive
lobular carcinoma: Comparison to invasive ductal carcinoma. Yonsei
Med J. 56:598–607. 2015. View Article : Google Scholar : PubMed/NCBI
|
|
44
|
Glunde K, Bhujwalla ZM and Ronen SM:
Choline metabolism in malignant transformation. Nat Rev Cancer.
11:835–848. 2011.PubMed/NCBI
|
|
45
|
Lin JK and Ho YS: Hepatotoxicity and
hepatocarcinogenicity in rats fed squid with or without exogenous
nitrite. Food Chem Toxicol. 30:695–702. 1992. View Article : Google Scholar : PubMed/NCBI
|
|
46
|
Lin PC, Lin JK, Lin CH, Lin HH, Yang SH,
Jiang JK, Chen WS, Chou CC, Tsai SF and Chang SC: Clinical
relevance of plasma DNA methylation in colorectal cancer patients
identified by using a genome-wide high-resolution array. Ann Surg
Oncol. 22:(Suppl 3). S1419–S1427. 2015. View Article : Google Scholar : PubMed/NCBI
|
|
47
|
Michailidi C, Theocharis S, Tsourouflis G,
Pletsa V, Kouraklis G, Patsouris E, Papavassiliou AG and Troungos
C: Expression and promoter methylation status of hMLH1, MGMT, APC,
and CDH1 genes in patients with colon adenocarcinoma. Exp Biol Med
(Maywood). 240:1599–1605. 2015. View Article : Google Scholar : PubMed/NCBI
|
|
48
|
Nakamura K, Yamashita K, Sawaki H, Waraya
M, Katoh H, Nakayama N, Kawamata H, Nishimiya H, Ema A, Narimatsu
H, et al: Aberrant methylation of GCNT2 is tightly related to lymph
node metastasis of primary CRC. Anticancer Res. 35:1411–1421.
2015.PubMed/NCBI
|
|
49
|
Hinnebusch BF, Meng S, Wu JT, Archer SY
and Hodin RA: The effects of short-chain fatty acids on human colon
cancer cell phenotype are associated with histone hyperacetylation.
J Nutr. 132:1012–1017. 2002.PubMed/NCBI
|
|
50
|
Lan A, Lagadic-Gossmann D, Lemaire C,
Brenner C and Jan G: Acidic extracellular pH shifts colorectal
cancer cell death from apoptosis to necrosis upon exposure to
propionate and acetate, major end-products of the human probiotic
propionibacteria. Apoptosis. 12:573–591. 2007. View Article : Google Scholar : PubMed/NCBI
|
|
51
|
Comerford SA, Huang Z, Du X, Wang Y, Cai
L, Witkiewicz AK, Walters H, Tantawy MN, Fu A, Manning HC, et al:
Acetate dependence of tumors. Cell. 159:1591–1602. 2014. View Article : Google Scholar : PubMed/NCBI
|
|
52
|
Mashimo T, Pichumani K, Vemireddy V,
Hatanpaa KJ, Singh DK, Sirasanagandla S, Nannepaga S, Piccirillo
SG, Kovacs Z, Foong C, et al: Acetate is a bioenergetic substrate
for human glioblastoma and brain metastases. Cell. 159:1603–1614.
2014. View Article : Google Scholar : PubMed/NCBI
|
|
53
|
Chen R, Xu M, Nagati JS, Hogg RT, Das A,
Gerard RD and Garcia JA: The acetate/ACSS2 switch regulates HIF-2
stress signaling in the tumor cell microenvironment. PLoS One.
10:e01165152015. View Article : Google Scholar : PubMed/NCBI
|
|
54
|
Marques C, Oliveira CS, Alves S, Chaves
SR, Coutinho OP, Côrte-Real M and Preto A: Acetate-induced
apoptosis in colorectal carcinoma cells involves lysosomal membrane
permeabilization and cathepsin D release. Cell Death Dis.
4:e5072013. View Article : Google Scholar : PubMed/NCBI
|
|
55
|
Oliveira CS, Pereira H, Alves S, Castro L,
Baltazar F, Chaves SR, Preto A and Côrte-Real M: Cathepsin D
protects colorectal cancer cells from acetate-induced apoptosis
through autophagy-independent degradation of damaged mitochondria.
Cell Death Dis. 6:e17882015. View Article : Google Scholar : PubMed/NCBI
|
|
56
|
Nogueira V and Hay N: Molecular pathways:
reactive oxygen species homeostasis in cancer cells and
implications for cancer therapy. Clin Cancer Res. 19:4309–4314.
2013. View Article : Google Scholar : PubMed/NCBI
|
|
57
|
Glasauer A and Chandel NS: Targeting
antioxidants for cancer therapy. Biochem Pharmacol. 92:90–101.
2014. View Article : Google Scholar : PubMed/NCBI
|
|
58
|
Weinberg F, Hamanaka R, Wheaton WW,
Weinberg S, Joseph J, Lopez M, Kalyanaraman B, Mutlu GM, Budinger
GR and Chandel NS: Mitochondrial metabolism and ROS generation are
essential for Kras-mediated tumorigenicity. Proc Natl Acad Sci USA.
107:8788–8793. 2010. View Article : Google Scholar : PubMed/NCBI
|
|
59
|
Moon DO, Kim MO, Choi YH, Hyun JW, Chang
WY and Kim GY: Butein induces G(2)/M phase arrest and apoptosis in
human hepatoma cancer cells through ROS generation. Cancer Lett.
288:204–213. 2010. View Article : Google Scholar : PubMed/NCBI
|
|
60
|
Fiser B, Szori M, Jójárt B, Izsák R,
Csizmadia IG and Viskolcz B: Antioxidant potential of glutathione:
A theoretical study. J Phys Chem B. 115:11269–11277. 2011.
View Article : Google Scholar : PubMed/NCBI
|
|
61
|
Teoh-Fitzgerald ML, Fitzgerald MP, Zhong
W, Askeland RW and Domann FE: Epigenetic reprogramming governs
EcSOD expression during human mammary epithelial cell
differentiation, tumorigenesis and metastasis. Oncogene.
33:358–368. 2014. View Article : Google Scholar : PubMed/NCBI
|
|
62
|
Silani V: Editorial on the original
article entitled ‘Genetic validation of a therapeutic target in a
mouse model of ALS’ published in the Science Translational Medicine
on August 6, 2014. Ann Transl Med. 3:(Suppl 1). S272015.PubMed/NCBI
|
|
63
|
Chiang YT, Yen YW and Lo CL: Reactive
oxygen species and glutathione dual redox-responsive micelles for
selective cytotoxicity of cancer. Biomaterials. 61:150–161. 2015.
View Article : Google Scholar : PubMed/NCBI
|
|
64
|
Qiao YL, Dawsey SM, Kamangar F, Fan JH,
Abnet CC, Sun XD, Johnson LL, Gail MH, Dong ZW, Yu B, et al: Total
and cancer mortality after supplementation with vitamins and
minerals: Follow-up of the Linxian General Population Nutrition
Intervention Trial. J Natl Cancer Inst. 101:507–518. 2009.
View Article : Google Scholar : PubMed/NCBI
|
|
65
|
Klein EA, Thompson IM Jr, Tangen CM,
Crowley JJ, Lucia MS, Goodman PJ, Minasian LM, Ford LG, Parnes HL,
Gaziano JM, et al: Vitamin E and the risk of prostate cancer: The
Selenium and Vitamin E Cancer Prevention Trial (SELECT). JAMA.
306:1549–1556. 2011. View Article : Google Scholar : PubMed/NCBI
|
|
66
|
Brosnan JT and Brosnan ME: Branched-chain
amino acids: Enzyme and substrate regulation. J Nutr. 136:(Suppl).
207S–211S. 2006.PubMed/NCBI
|
|
67
|
Zhu X, Herrera G and Ochoa JB:
Immunosupression and infection after major surgery: A nutritional
deficiency. Crit Care Clin. 26:491–500. 2010. View Article : Google Scholar : PubMed/NCBI
|
|
68
|
Phillips MM, Sheaff MT and Szlosarek PW:
Targeting arginine-dependent cancers with arginine-degrading
enzymes: Opportunities and challenges. Cancer Res Treat.
45:251–262. 2013. View Article : Google Scholar : PubMed/NCBI
|
|
69
|
Platten M, Wick W and Van den Eynde BJ:
Tryptophan catabolism in cancer: Beyond IDO and tryptophan
depletion. Cancer Res. 72:5435–5440. 2012. View Article : Google Scholar : PubMed/NCBI
|