Introduction
Bladder cancer, as one of the most common types of
cancer of the urinary tract, accounts for ~380,000 new cases and
~150,000 deaths every year, worldwide (1). Statistics show that the incidence of
bladder cancer experience an increase of 19.4% adjusted for the
increase in total world population from 1990 to 2010 (2). In the US, the 5-year survival rate is
~77% (3). Epidemiological research
has shown that age is one of the most significant risk factor, and
the average age at diagnosis of bladder cancer is ~70-year old
(4). Apart from age, smoking is
considered as the leading environmental risk factor, and more than
half of bladder cancer cases can be attributed to smoking (4).
Considering the complexity of bladder cancer
molecular mechanisms, extensive research has been carried out using
microarray or next-generation sequencing technologies. In addition,
several mRNAs and miRNAs have been identified to be differentially
expressed based on RNA-seq data from 129 tumors. One of them is
FGFR3 which is upregulated in the papillary-like bladder
cancer cluster. Moreover, miR-99a and miR-100 that downregulate
FGFR3 were found to be downregulated in bladder cancer
(5). In addition, 32 significant
somatic mutations including TP53, RB1, FGRF3,
were identified in 130 paired tumor and normal samples using
whole-exome sequencing (5).
Researches also showed that several pathways were frequently
dysregulated in bladder cancer such as cell cycle regulation,
kinase and phosphatidylinositol-3-OH kinase and chromatin
remodeling (5).
Although research has been carried to explore
bladder cancer molecular mechanisms, research based on the
integration of mRNA and miRNA expression profiles has not been
widely explored. With the development of microarray and sequencing
technology, more and more datasets have been submitted to the Gene
Expression Omnibus (GEO) database, and hence re-analyses of the
deposited datasets with advanced bioinformatic methods can further
promote the understanding of bladder cancer molecular mechanisms
(6). In the present study, DEGs in
bladder cancer were firstly identified based on two mRNA expression
datasets from different laboratories. Then, the common DEGs were
subjected to function and pathway analyses. Furthermore, mRNA and
miRNA regulatory networks were constructed. Finally, several
critical DEGs were validated using SurvExpress database and RT-PCR
method.
Materials and methods
Acquisition of microarray data
Public available datasets were used in the present
study. Gene expression profiles GSE13507 and GSE37815 were
downloaded from the GEO database (http://www.ncbi.nlm.nih.gov/geo/). These two datasets
were submitted by Kim et al in 2008 (7) and Kim et al in 2012 (8), respectively. Dataset GSE13507 consists
of 188 tumor and 68 normal tissues, and dataset GSE37815 consists
of 24 expression profiles including 6 normal and 18 tumor tissues.
RNAs were extracted and hybridized to Illumina human-6 v2.0
expression beadchip according to the manufacturer's instructions.
Detailed information concerning the experiment design and samples
were documented in previous studies (8,9).
Identification of differentially
expressed mRNAs
To identify DEGs, raw data were systematically
analyzed using in-house R script. Firstly, mRNA expression values
were subjected to 1og2 transformation, background correction and
normalization using GeneChip Robust Multi-Array Analysis (GC-RMA)
(10) algorithm with default
parameters. Then, uninformative control probe sets were filtered
out, and the average expression value was calculated for genes with
multiple probes. Finally, DEGs were identified using Linear Models
for Microarray Analysis (Limma) package (11) with criteria of adjusted p≤0.01 and
|log2 fold-change (FC)| ≥2. Common DEGs between the two datasets
were presented using Venn diagram. Heat map of DEGs was constructed
using heatmap.2 method within ggplot package.
Function and pathway enrichment
analysis
To illuminate the biology functions related to the
identified DEGs, Gene Ontology (GO) and KEGG pathway enrichment for
the common DEGs were carried out using Database for Annotation,
Visualization and Integrated Discovery (DAVID) online tools
(12). GO terms, consisting of
biological process (BP), cellular component (CC) and molecular
function (MF), were screened out with p<0.05.
miRNA-mRNA regulatory network
Research has shown that miRNAs can regulate
carcinogenesis, malignant transformation, and metastatic processes
by preventing mRNA expression or directly participating in those
processes (13). In the present
study, 6 miRNAs documented in previous research were used for the
construction of miRNA-mRNA pairings contributing to bladder cancer.
Combination of the 6 miRNAs has been demonstrated to be the best
predictor to distinguish patients with urothelial bladder cancer
from normal controls (14).
miRNA-mRNA regulatory network was constructed using CyTargetLinker
plugin (15) of Cytoscape (16). The prediction of miRNA targets were
based on microcosm, miRTarBase and TargetScan databases. Common
target genes from the 3 databases were selected, and the
interaction between the 6 miRNAs and the common DEGs were
constructed.
Virtual validation and RT-PCR
validation
Clinical outcome validation for the common DEGs were
carried out using online tool SurvExpress, which is based on a
cancer-wide gene expression database with clinical outcomes
(17). Four bladder cancer datasets
in this database were used for virtual validation. Parameter
settings were carefully selected according to the manufacturer's
instructions.
Six DEGs including ALDH1A1, FLNC,
CNN1, SRPX, HSPB6 and FAM107A were
selected for further RT-PCR validation based on the criterion that
DEGs can be regulated by miRNAs and were identified in the
SurvExpress analysis. Total RNAs were extracted from 10 bladder
cancer and adjacent normal tissues with TRIzol reagent from
ThermoFisher (Waltham, MA, USA). Extraction was based on the
standard protocol and manufacturer's instructions. Then, cDNA were
obtained with M-MLV Reverse Transcriptase from Promega (Madison,
WI, USA). mRNA expression values were detected using 7500 Real-Time
PCR System (ThermoFisher). The internal GAPDH mRNA
expression was used for normalization and relative quantification
was calculated using the 2−ΔCt method. Primer sequences
for the 6 genes were as follows: HSPB6,
5′-TTGCTGTCAAGGTGGTGGGC-3′ (forward) and 5′-CGGTAGCGACGGTGGAACT-3′
(reverse); SRPX, 5′-CCCACAGCCCGAAACCT-3′ (forward) and
5′-TGCTCCTATCCTGCCAATG-3′ (reverse); CNN1,
5′-ACCCTCCTGGCTTTGGC-3′ (forward) and 5′-AATGATGTTCCGCCCTTCT-3′
(reverse); FLNC, 5′-AGAGAAGTTGGAGAGGAGAGTAG-3′ (forward) and
5′-AACCRCTATTATTCATCATACTAAC-3′ (reverse); ALDH1A1,
5′-CTTGGAATTTCCCGTTGG-3′ (forward) and 5′-TTGCTCTGCTGGTTTGACA-3′
(reverse); FAM107A, 5′-AGCAACACGCTCCTGACTT-3′ (forward) and
5′-TGGCGGCCTTATTGTCTA-3′ (reverse).
Results
DEGs in bladder cancer
Background correction and normalization were applied
to the two datasets, and the medians of the gene expression values
were almost at the same level indicating that the data were
appropriate for subsequent analysis (data not shown). After
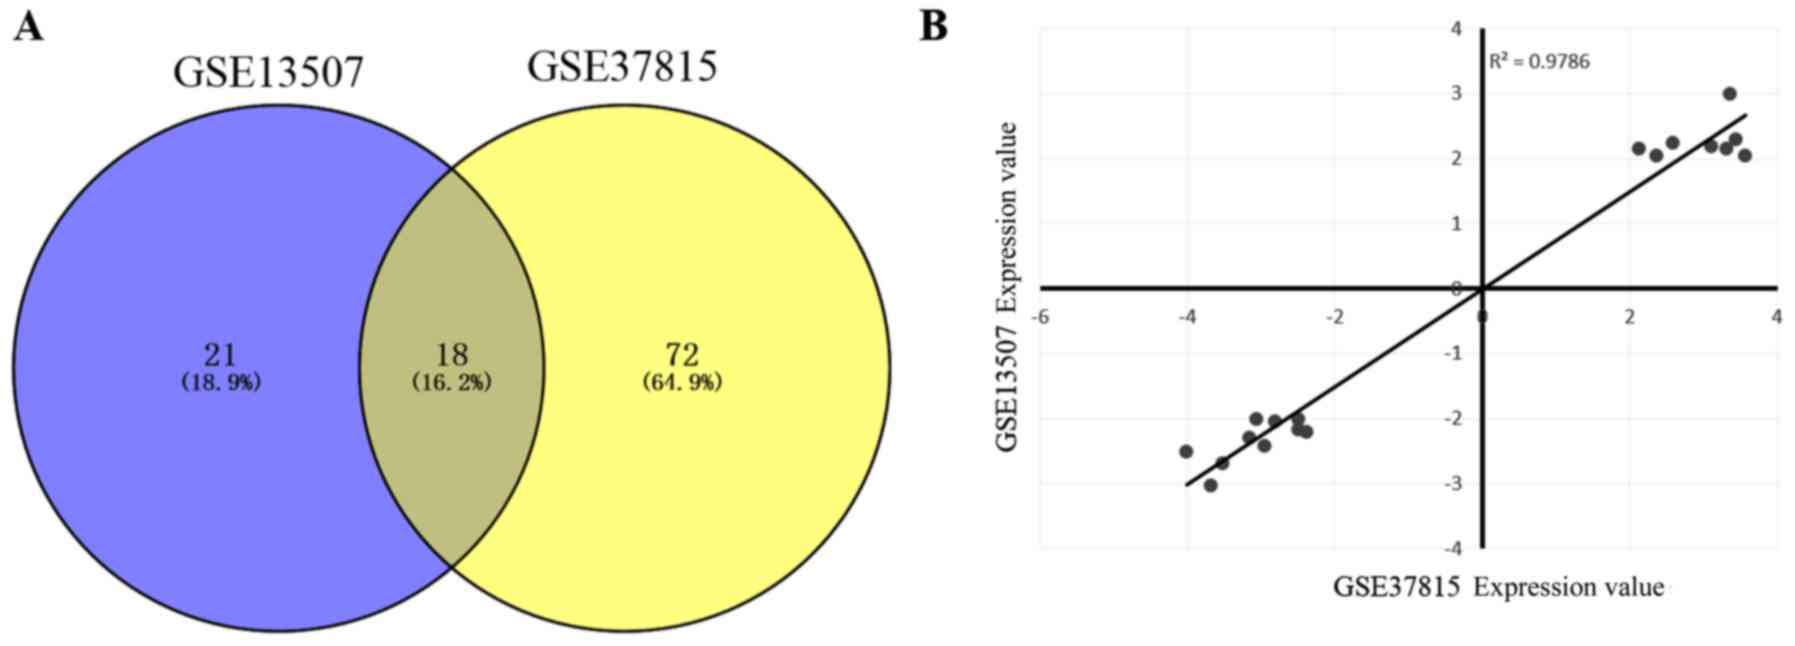
independent DEG analysis, a total of 21 and 72 DEGs were screened
out for GSE13507 and GSE37815, respectively. In addition, 18 DEGs
(Table I) were identified to be
differentially expressed in the two datasets (Fig. 1A). Among these common DEGs, 8 DEGs
were upregulated and 10 DEGs were downregulated. In addition, there
was a high correlation (R2=0.97) for the common DEG
expression values between GSE13507 and GSE37815 (Fig. 1B).
 | Table I.The identified 18 common DEGs in
GSE37817 and GSE13507. |
Table I.
The identified 18 common DEGs in
GSE37817 and GSE13507.
|
| GSE37817 | GSE13507 |
|---|
|
|
|
|
|---|
| Gene | P-value | FC | P-value | FC |
|---|
| ALDH1A1 | 0.00122 | 3.57 | 5.44E-19 | 2.050259 |
| C2orf40 | 0.002817 | 2.36 | 2.34E-16 | 2.045515 |
| CNN1 | 0.00986 | 3.36 | 5.03E-18 | 3.006849 |
| COL16A1 | 0.004753 | −2.5 | 2.52E-23 | −2.16685 |
| CPED1 | 0.001365 | −2.5 | 2.70E-23 | −2.00774 |
| CRYAB | 0.004264 | 3.31 | 1.23E-15 | 2.154952 |
| DCN | 0.004807 | 2.58 | 1.26E-22 | 2.253045 |
| FAM107A | 0.000146 | −3.17 | 5.11E-28 | −2.28816 |
| FLNC | 0.009383 | −3.69 | 1.94E-19 | −3.02438 |
| HSPB6 | 0.002658 | −2.96 | 2.14E-19 | −2.41159 |
| PCP4 | 0.000849 | −4.01 | 3.03E-14 | −2.51219 |
| PDLIM3 | 0.007189 | 2.12 | 1.96E-16 | 2.15556 |
| PLAC9 | 0.000661 | −2.81 | 2.15E-20 | −2.03664 |
| PRUNE2 | 0.001365 | 3.44 | 3.27E-15 | 2.298053 |
| SMOC2 | 0.007966 | −2.39 | 1.16E-20 | −2.21085 |
| SRPX | 0.000761 | −3.52 | 1.77E-27 | −2.68146 |
| SYNM | 0.002099 | 3.11 | 1.33E-14 | 2.198553 |
| TCEAL2 | 0.000251 | −3.06 | 3.26E-20 | −2.01581 |
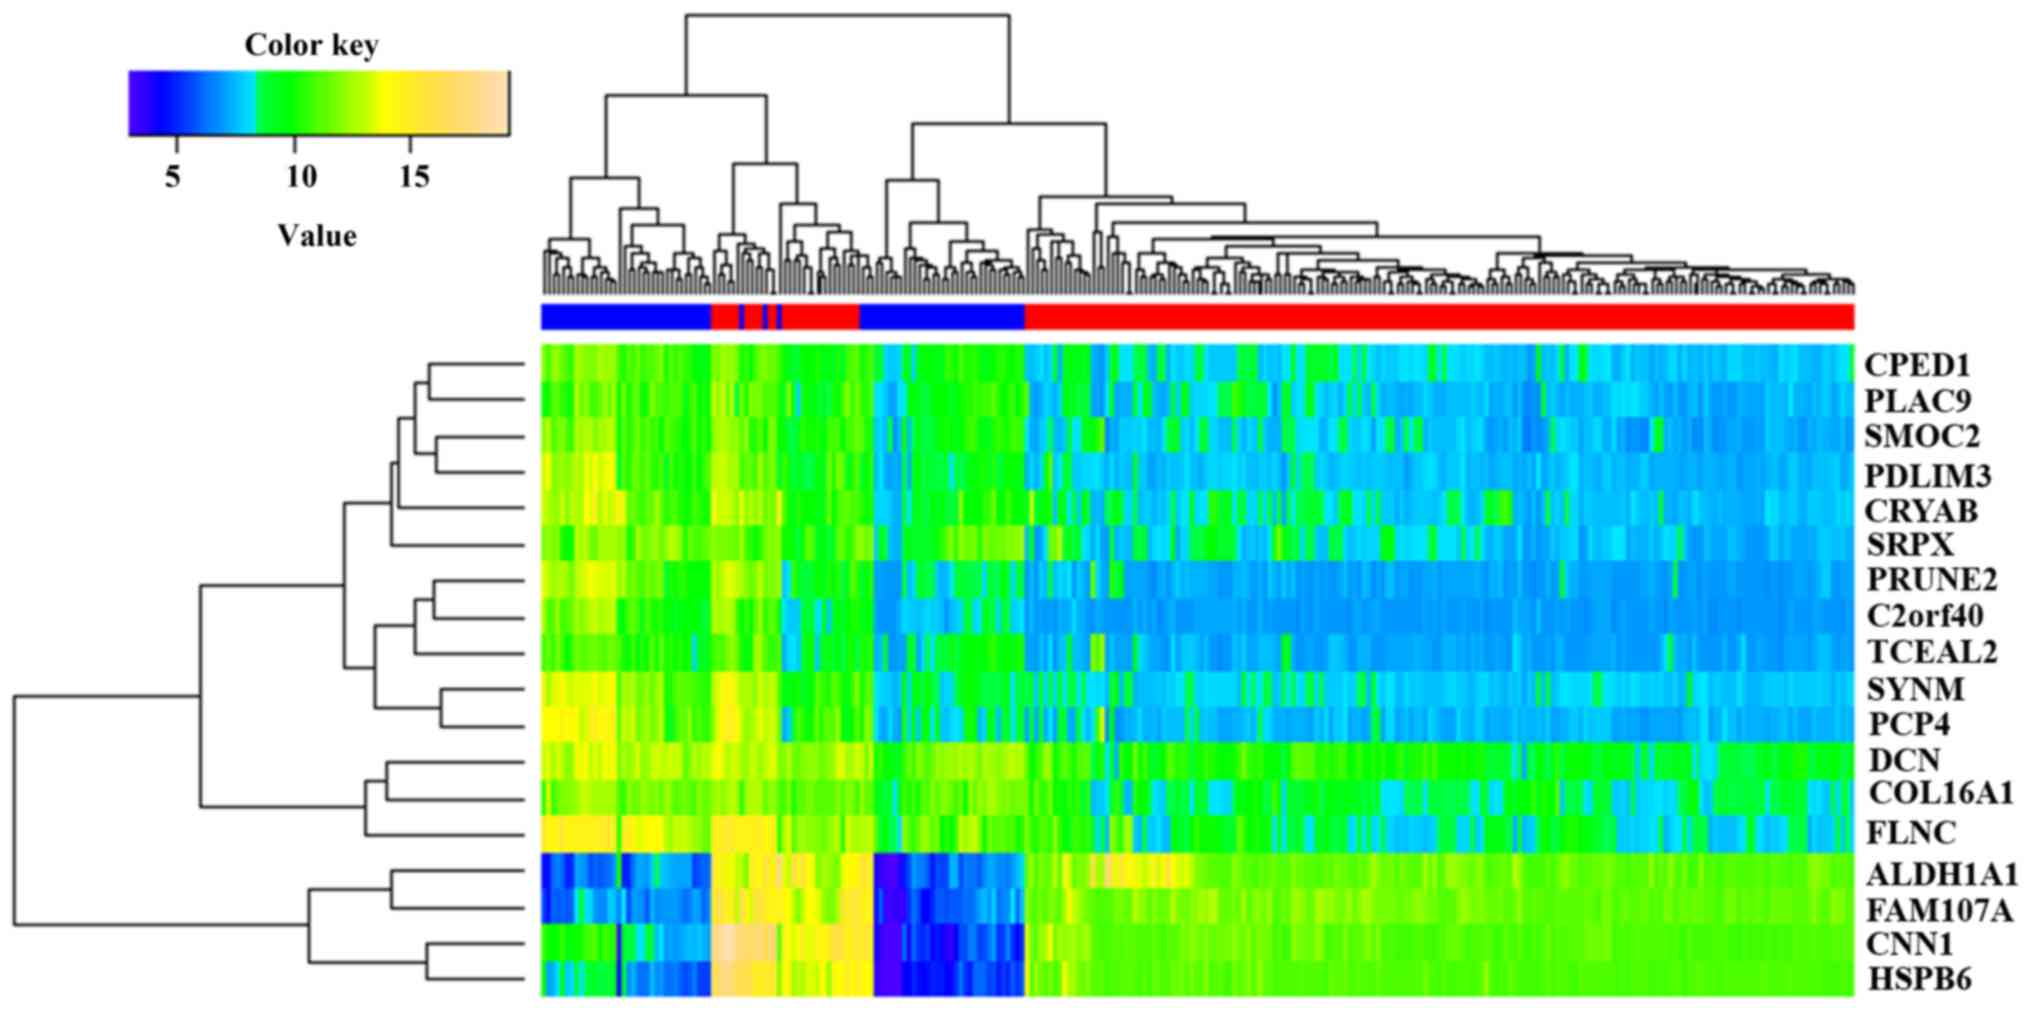
Furthermore, hierarchical clustering of the tumor
and normal tissues was carried out based on the common DEGs. As
indicated in Fig. 2, the tumor and
normal tissues were able to be almost clearly classified into
different clusters. Error assignment of several samples may have
been caused by tumor heterogeneity or smaller expression value
variation.
GO and KEGG pathway enrichment
analysis
To explore the biology functions of the common DEGs,
GO and KEGG pathway enrichment were conducted using DAVID online
tool. Results showed that 3 KEGG pathways were identified.
ALDH1A1 participates in retinol metabolism pathway,
DCN is involved in the TGF-β signaling pathway, and
FLNC plays a role in the MAPK signaling pathway. In
addition, the common DEGs were mainly related to the cellular
component of myofibril (p=1.0E-04), contractile fiber part
(p=1.0E-04) and Z-disc (p=1.2E-04) (Table II). Several common DEGs, such as
CRYAB, PDLIM3, SYNM, CNN1,
COL16A1 and FLNC, were significantly enriched in the
cytoskeletal protein binding function (p=2.4E-04), structural
molecule activity function (p=0.007), and structural constituent of
muscle function (p=0.02) (Table
II). However, the biological processes of cytoskeleton
organization (p=0.004) and response to heat (p=0.04) were also
enriched (Table II).
| Table II.GO enrichment analysis results for
the common DEGs |
Table II.
GO enrichment analysis results for
the common DEGs
| Category | ID | GO term | P-value | Genes |
| BP | GO:0007010 | Cytoskeleton
organization | 0.00 | CRYAB,
PDLIM3, SYNM, CNN1 |
|
| GO:0009408 | Response to
heat | 0.04 | HSPB6,
CRYAB |
| CC | GO:0030016 | Myofibril | 0.00 | CRYAB,
PDLIM3, SYNM, FLNC |
|
| GO:0044449 | Contractile fiber
part | 0.00 | CRYAB,
PDLIM3, SYNM, FLNC |
|
| GO:0030018 | Z-disc | 0.00 | CRYAB,
PDLIM3, FLNC |
| MF | GO:0008092 | Cytoskeletal
protein binding | 0.00 | CRYAB,
PDLIM3, SYNM, CNN1, FLNC |
|
| GO:0005198 | Structural molecule
activity | 0.01 | CRYAB,
PDLIM3, SYNM, COL16A1 |
|
| GO:0008307 | Structural
constituent of muscle | 0.03 | PDLIM3,
SYNM |
miRNA-mRNA regulatory network
To generate a catalog of miRNA-mRNA pairings, the
predicted target mRNAs of 6 reported miRNAs were intersected with
the defined common DEGs. Predication results showed that 4,279,
1,818 and 3,086 target mRNAs, in microcosm, miRTarBase and
TargetScan database, respectively, were able to be regulated by the
6 miRNAs. Among the target mRNAs, 93 common mRNAs were identified
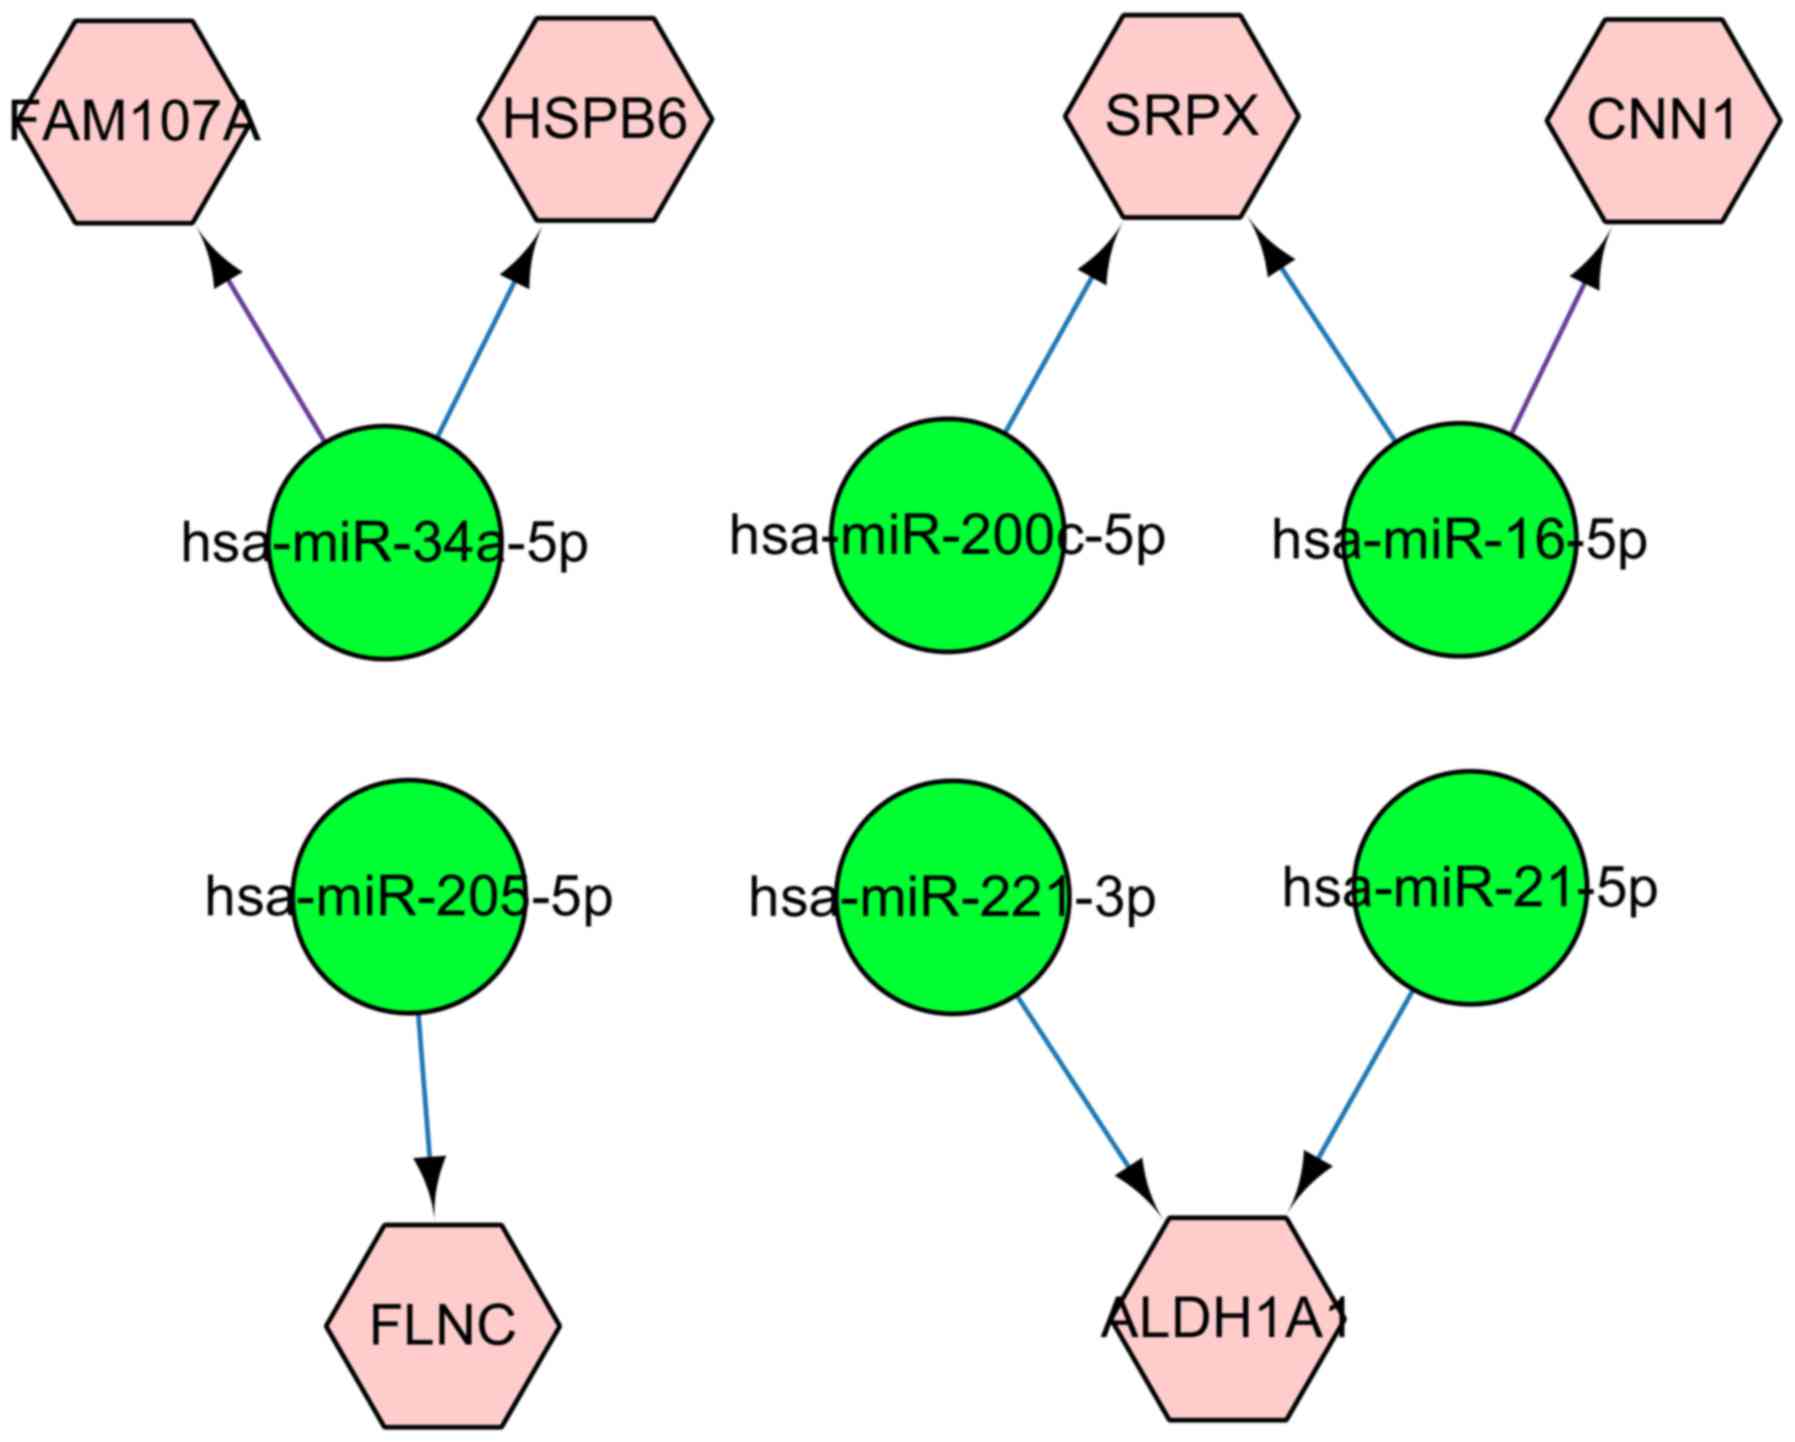
after intersection between the 3 databases. In addition, 8
miRNA-mRNA pairings were identified with the criteria that the
prediction of target mRNAs were also differentially expressed in
the microarray analysis. The regulatory network for the 8
miRNA-mRNA pairings are displayed in Fig. 3. Based on Fig. 3, it is evident that miRNA
hsa-miR-34a-5p regulates FAM107A and HSPB6,
respectively. ALDH1A1 and CNN1 are regulated by
hsa-miR-221-3p, hsa-miR-21-5p and hsa-miR-16-5p.
Virtual validation and RT-PCR
validation
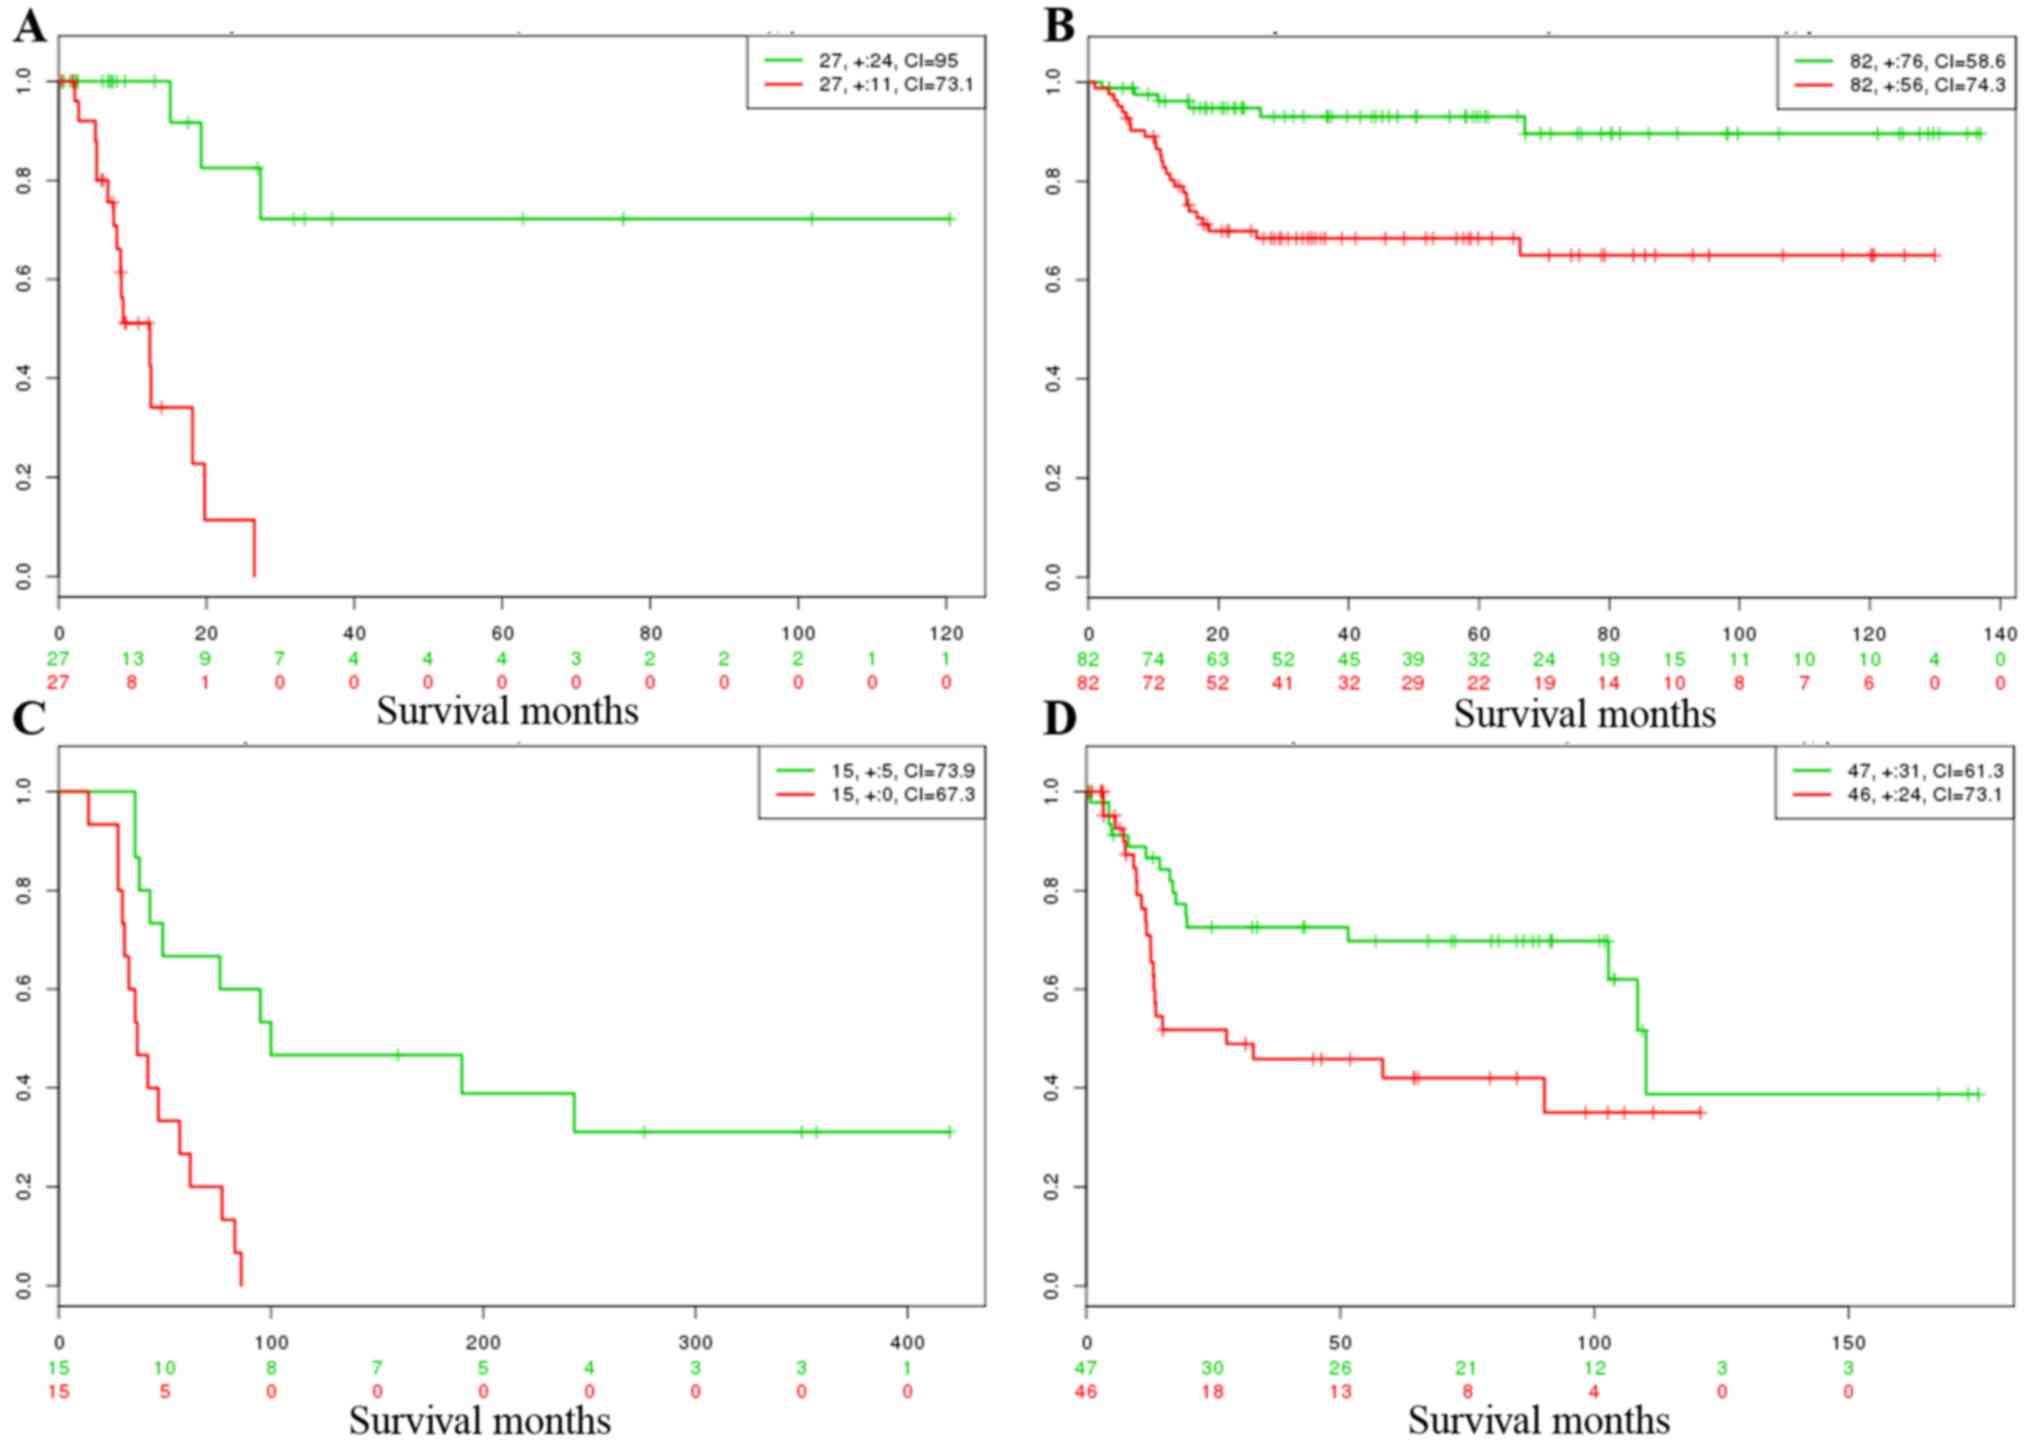
It is critical for the validation of multi-gene
biomarkers in the study of the molecular mechanisms of cancer. To
verify the prognostic performance of the identified common DEGs, we
firstly employed the SurvExpress online tool which provides
survival analysis and risk assessment. Results are shown in
Fig. 4 and are summarized in
Table III. Survival analysis
using Kaplan-Meier curves indicated that the common DEGs were able
to significantly differentiate low- and high-risk groups in the 4
datasets, and the p-values were 0.0028, 0.00056, 0.0011 and 0.021,
respectively. A higher concordance index (CI) value (Table III; CI >50) also demonstrated
that better predication was achieved between low- and high-risk
groups.
| Table III.Virtual validation results of the
common DEGs in 4 bladder cancer datasets. |
Table III.
Virtual validation results of the
common DEGs in 4 bladder cancer datasets.
|
|
|
|
|
| DEG between risk
groups |
| Dataset | Samples | Genes found | Risk groups
(p-value) | CI | No. | DEGs |
| TCGA | 54 | 18 | 0.00029 | 87.2 | 8 | C2orf40,
CRYAB, DCN, FLNC, HSPB6, PDLIM3,
SRPX, SYNM |
| GSE13507 | 246 | 18 | 0.00056 | 78.1 | 1 | COL16A1 |
| GSE5287 | 30 | 15 | 0.0011 | 77.3 | 1 | HSPB6 |
| GSE31684 | 93 | 14 | 0.021 | 68.6 | 7 | CNN1,
COL16A1, CRYAB, DCN, PDLIM3,
SRPX, TCEAL2 |
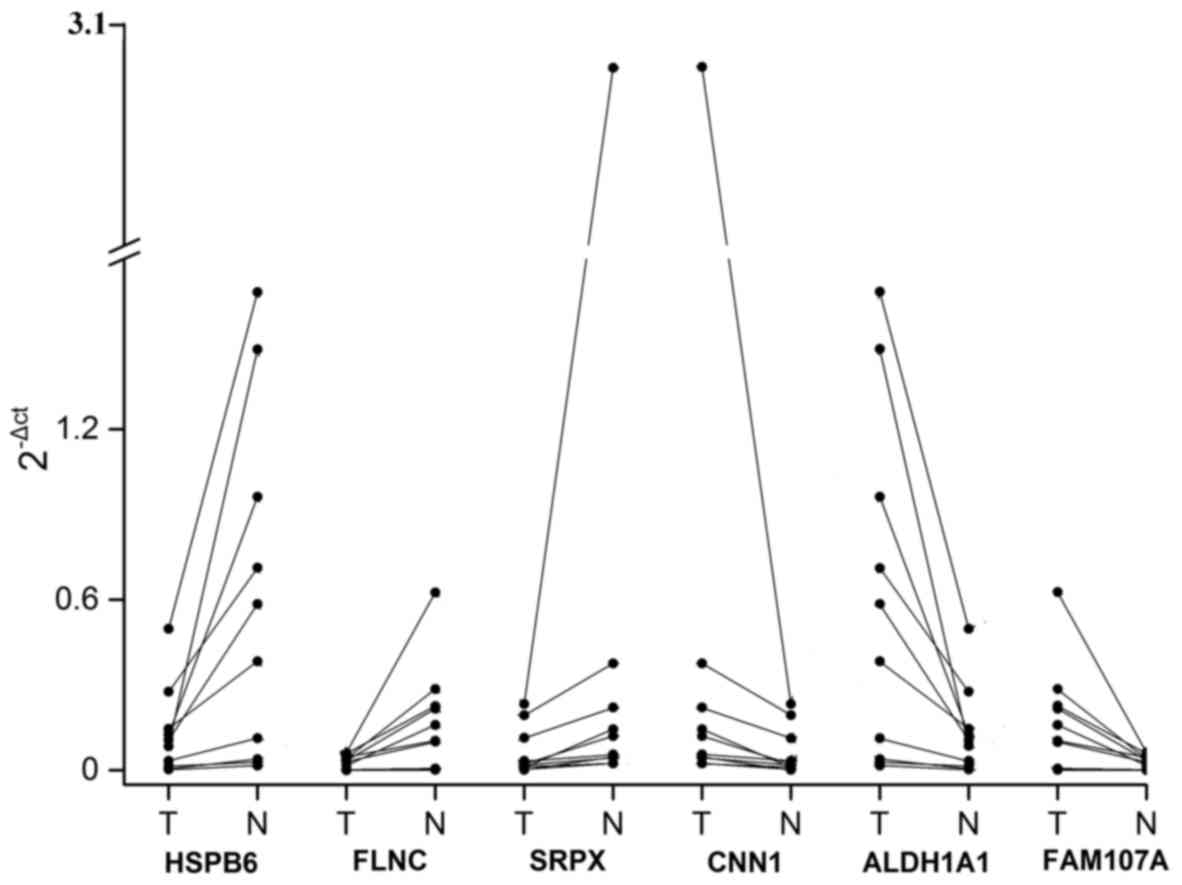
Furthermore, RT-PCR validation was carried out using
10 specimens from patients to validate the microarray analysis
results. Based on the criterion that the DEGs can be regulated by
miRNAs and identified in the SurvExpress analysis, a total of 6
DEGs were selected for RT-PCR validation including HSPB6,
SRPX, CNN1, FLNC, ALDH1A1 and
FAM107A. The mRNA expression values for those selected DEGs
were measured in tumor and adjacent normal tissues. The results
indicated that the expression levels of HSPB6, FLNC
and SRPX were slightly lower in the tumor tissues when
compared with these levels in the adjacent normal tissues (Fig. 5); whereas, mRNA expression levels
for the remaining 3 DEGs were significant higher in the tumor
tissues (Fig. 5). All these results
were nearly concordant with the results of the microarray
analysis.
Discussion
Microarray and next generation sequencing
technologies have significantly advanced the understanding of the
molecular mechanisms of bladder cancer. Extensive research
concerning mRNA or miRNA expression, and whole-genome or exome
sequencing, has been widely carried out in the past few years.
However, efforts that attempt to unveil the complex mechanisms of
bladder cancer using the integration of different omic data are
rare. In the present study, a total of 18 genes were found to be
simultaneously differentially expressed in 206 tumor tissues, and
10 were upregulated and 8 were downregulated. Notably, the tumor
and normal samples were able to be clearly classified into 3 groups
based on these common DEGs. Several normal samples were assigned
into the tumor cluster incorrectly, which was probably caused by
tumor heterogeneity or sample quality.
Pathway enrichment analysis revealed that the common
DEGs were involved in the TGF-β signaling pathway. Although the
molecular mechanism between bladder cancer and the TGF-β signaling
pathway is unclear, TGF-β1 production has been demonstrated to be
significantly associated with the phenotype of bladder cancer
(18). RT-PCR results showed that
BMP2 and INHBB within the TGF-β signaling pathway
were significantly associated with tumorigenicity (p=0.02) and
invasiveness (p=0.04) (19).
Another important MAPK pathway was also enriched based on the
common DEGs. Jebar et al found that mutually exclusive
mutation of FGFR3 or RAS (HRAS or KRAS)
can activate the MAPK pathway, and the exact role of FGFR3
in activation of the MAPK pathway warrants further studies
(20).
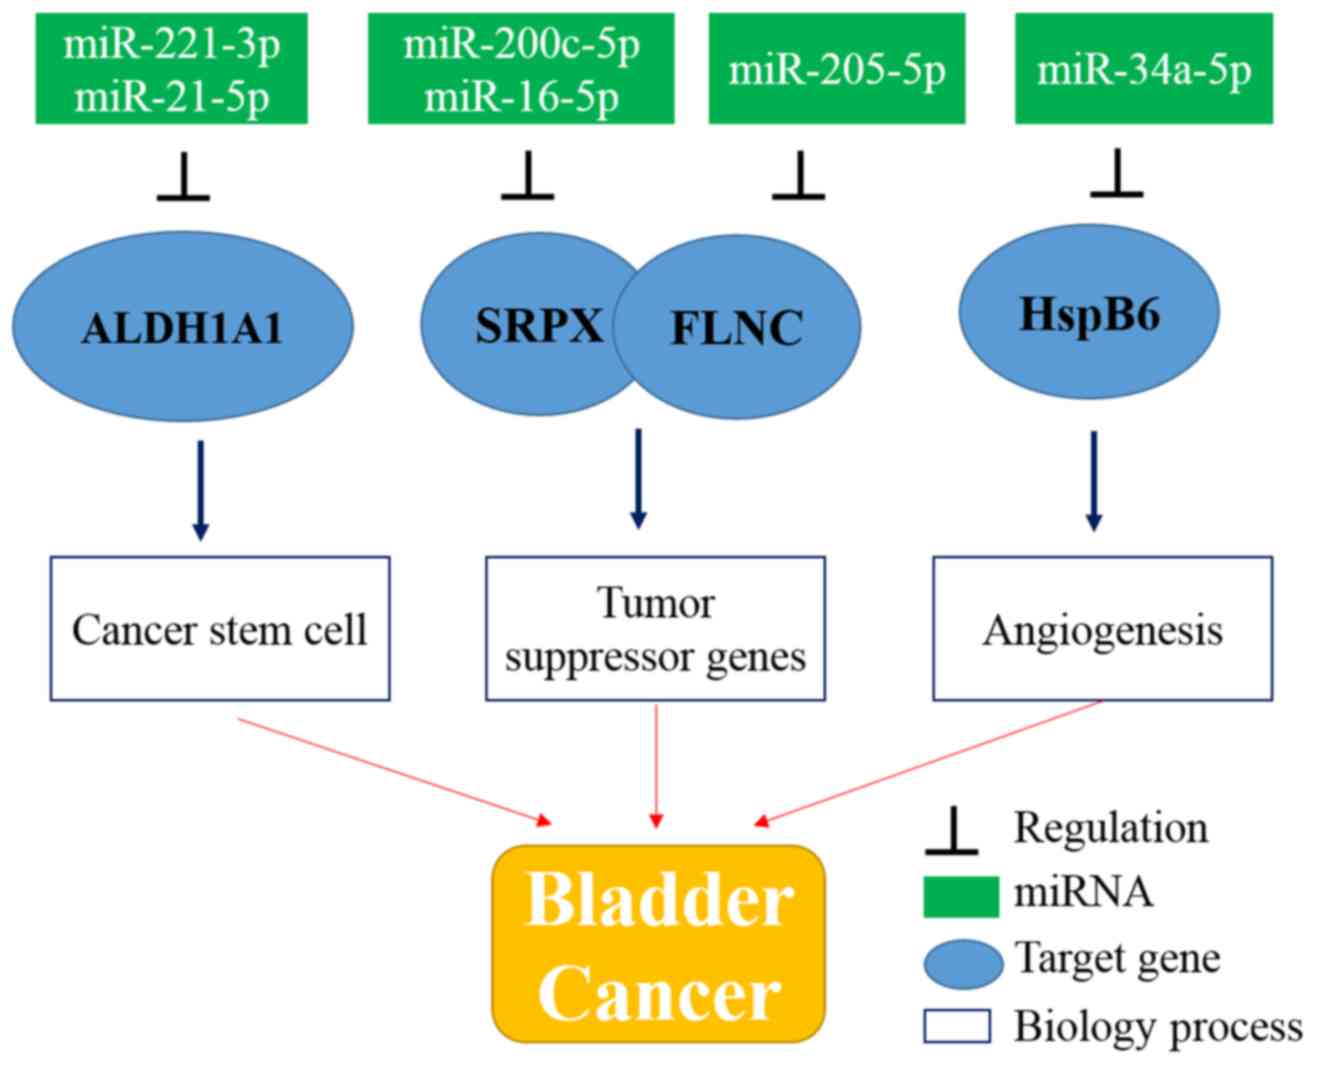
Further analyses based on the mRNA and miRNA
regulatory network partially unveiled the complex mechanisms of
bladder cancer. The development and progression of bladder cancer
probably involve multi-path processes including cancer stem cell
processes, downregulation of the expression of tumor-suppressor
genes, and promotion of cancer cell migration and angiogenesis
(Fig. 6).
Recently, extensive research has focused on the
study of cancer stem cells, which are believed to contribute to
tumor self-renewal and metastasis (21). In the present study, it was found
that putative cancer stem cell biomarker ALDH1A1 probably
contributes to the poor prognosis of bladder cancer. In addition,
based on the miRNA regulation network, the upregulation of
ALDH1A1 is likely to be the consequence of the
downregulation of the expression of miR-221-3p and miR-21-5p.
ALDH1A1 combined with CD44 has been identified as a
promising cancer stem cell biomarker in various types of cancers
(22–24). Keymoosi et al demonstrated
that ALDH1A1 was highly expressed in almost 16% (25/159) of
bladder cancer cases based on immunohistochemistry. In addition,
high expression of ALDH1A1 was found to be significantly
correlated with clinical characteristics such as tumor size
(p=0.002), pathologic stage (T1, p=0.007 and T2, p-value<0.001)
and high recurrence rate (p=0.013) (22). In ovarian cancer, knockdown of
ALDH1A1 lead to S and G2 phase cell accumulation via marked
decrease in KLF4 and p21 (25). In addition, DNA damage was also
increased after ALDH1A1 knockdown evidenced by induction of
γ-H2AX and BAX-mediated apoptosis (25). All of these findings indicate that
ALDH1A1 participates in the regulation of cell cycle
checkpoints and DNA repair networks in cancer stem-like cells
(25).
Moreover, downregulation of the expression of
tumor-suppressor genes also plays an important role in tumor
development and metastasis. In the present study, downregulation of
the expression of SRPX and FLNC was identified, which
probably was inhibited by miR-200c-5p or miR-16-5p and miR-205-5p,
respectively. SRPX was firstly isolated as a novel
transformation suppressor gene, and SRPX expression is
downregulated by retroviral oncogenes such as v-src or
v-ras (26). Research has
demonstrated that SRPX expression is markedly reduced in
various human cancer cell lines (26,27).
Tambe et al documented that the C-terminal region and the 3
consensus repeats in the N-terminal region of SRPX are
critical in SRPX-induced apoptosis. Low expression of
SRPX can sequentially activate caspase-12, −9 and −3 rather
than the mitochondrial pathway and induce apoptosis (28). Furthermore, SRPX can interact
with apoptosis-inducing protein ASY/Nogo-B/RTN-xS leading to
apoptosis (28). FLNC as one
member of the filamin protein family can crosslink actin filaments
into orthogonal networks (29). The
promoter of FLNC has been frequently identified to be
methylated in several types of human cancers such as prostate
(30,31), ovarian (32,33)
and gastric cancer (34). Kaneda
et al showed that >66% of gastric cancer cell lines are
methylated in one CpG island of the FLNC promoter, and the
methylation is considered as the result of H. pylori
infection (34). In addition, the
methylation of the FLNC promoter is expected to impair its
mRNA expression (35). In 2014,
Qiao et al reported that downregulation of the expression of
endogenous FLNC can promote cancer cell migration and
invasion, and opposite effects were observed with high expression
of FLNC (36). Moreover, the
downregulation of the expression of FLNC can induce the
upregulation of matrix metallopeptidase 2 which participates in the
degradation of extracellular matrix and cancer metastasis (37).
In addition, another important factor that can
promote cancer cell proliferation and metastasis is angiogenesis
which can provide adequate oxygen and nutrient supplies (38). In the present study, angiogenesis
was activated by the high expression of HspB6. In addition,
based on the miRNA regulation network, the upregulation of
HspB6 was likely to be the consequence of miR-34a-5p.
HspB6, also referred to as hsp20, has been reported
to be activated in physiological or pathological stress (39,40)
and non-small cell lung cancer (41). Wang et al showed that
HspB6 can promote growth factor secretion including
VEGF and bFGF and induce myocardial angiogenesis
(42). The angiogenesis process may
be promoted via activation of VEGFR2 by HspB6 based
on protein binding assay and immunostaining results (43). However, the complex regulatory
mechanism of HspB6 in bladder cancer remains to be
explored.
In summary, the development and progression of
bladder cancer are induced via various processes. Firstly, the cell
cycle checkpoints and DNA repair networks in cancer stem-like cell
are regulated by high expression of ALDH1A1, and hence
promote tumor self-renewal or metastasis. Then, activation of
HspB6 promotes angiogenesis which can provide necessary
nutrients and oxygen for tumor cells. Finally, downregulation of
the expression of SRPX and FLNC further promote
apoptosis and metastasis.
Acknowledgements
The present study was supported by grants from the
National Natural Science Foundation of China (nos. 81571395,
81371748 and 81373075).
References
|
1
|
Ferlay J, Shin HR, Bray F, Forman D,
Mathers C and Parkin DM: Estimates of worldwide burden of cancer in
2008: GLOBOCAN 2008. Int J Cancer. 127:2893–2917. 2010. View Article : Google Scholar : PubMed/NCBI
|
|
2
|
Lozano R, Naghavi M, Foreman K, Lim S,
Shibuya K, Aboyans V, Abraham J, Adair T, Aggarwal R, Ahn SY, et
al: Global and regional mortality from 235 causes of death for 20
age groups in 1990 and 2010: A systematic analysis for the Global
Burden of Disease Study 2010. Lancet. 380:2095–2128. 2012.
View Article : Google Scholar : PubMed/NCBI
|
|
3
|
National Cancer Institute Surveillance, .
Epidemiology, and End Results Program: SEER stat fact sheets.
Bladder Cancer; 2014, http://seer.cancer.gov/statfacts/html/urinb.html
|
|
4
|
Knowles MA and Hurst CD: Molecular biology
of bladder cancer: New insights into pathogenesis and clinical
diversity. Nat Rev Cancer. 15:25–41. 2015. View Article : Google Scholar : PubMed/NCBI
|
|
5
|
Cancer Genome Atlas Research Network:
Comprehensive molecular characterization of urothelial bladder
carcinoma. Nature. 507:315–322. 2014. View Article : Google Scholar : PubMed/NCBI
|
|
6
|
Berger B, Peng J and Singh M:
Computational solutions for omics data. Nat Rev Genet. 14:333–346.
2013. View
Article : Google Scholar : PubMed/NCBI
|
|
7
|
Kim WJ, Kim EJ, Kim SK, Kim YJ, Ha YS,
Jeong P, Kim MJ, Yun SJ, Lee KM, Moon SK, et al: Predictive value
of progression-related gene classifier in primary non-muscle
invasive bladder cancer. Mol Cancer. 9:32010. View Article : Google Scholar : PubMed/NCBI
|
|
8
|
Kim YJ, Yoon HY, Kim JS, Kang HW, Min BD,
Kim SK, Ha YS, Kim IY, Ryu KH, Lee SC, et al: HOXA9, ISL1 and
ALDH1A3 methylation patterns as prognostic markers for nonmuscle
invasive bladder cancer: Array-based DNA methylation and expression
profiling. Int J Cancer. 133:1135–1142. 2013. View Article : Google Scholar : PubMed/NCBI
|
|
9
|
Lee JS, Leem SH, Lee SY, Kim SC, Park ES,
Kim SB, Kim SK, Kim YJ, Kim WJ and Chu IS: Expression signature of
E2F1 and its associated genes predict superficial to invasive
progression of bladder tumors. J Clin Oncol. 28:2660–2667. 2010.
View Article : Google Scholar : PubMed/NCBI
|
|
10
|
Gentleman RC, Carey VJ, Bates DM, Bolstad
B, Dettling M, Dudoit S, Ellis B, Gautier L, Ge Y, Gentry J, et al:
Bioconductor: Open software development for computational biology
and bioinformatics. Genome Biol. 5:R802004. View Article : Google Scholar : PubMed/NCBI
|
|
11
|
Kerr MK: Linear models for microarray data
analysis: Hidden similarities and differences. J Comput Biol.
10:891–901. 2003. View Article : Google Scholar : PubMed/NCBI
|
|
12
|
Dennis G Jr, Sherman BT, Hosack DA, Yang
J, Gao W, Lane HC and Lempicki RA: DAVID: Database for Annotation,
Visualization, and Integrated Discovery. Genome Biol. 4:P32003.
View Article : Google Scholar : PubMed/NCBI
|
|
13
|
Acunzo M and Croce CM: MicroRNA in cancer
and cachexia - a mini-review. J Infect Dis. 212 Suppl 1:S74–S77.
2015. View Article : Google Scholar : PubMed/NCBI
|
|
14
|
Sapre N, Macintyre G, Clarkson M, Naeem H,
Cmero M, Kowalczyk A, Anderson PD, Costello AJ, Corcoran NM and
Hovens CM: A urinary microRNA signature can predict the presence of
bladder urothelial carcinoma in patients undergoing surveillance.
Br J Cancer. 114:454–462. 2016. View Article : Google Scholar : PubMed/NCBI
|
|
15
|
Kutmon M, Kelder T, Mandaviya P, Evelo CT
and Coort SL: CyTargetLinker: A cytoscape app to integrate
regulatory interactions in network analysis. PLoS One.
8:e821602013. View Article : Google Scholar : PubMed/NCBI
|
|
16
|
Shannon P, Markiel A, Ozier O, Baliga NS,
Wang JT, Ramage D, Amin N, Schwikowski B and Ideker T: Cytoscape: A
software environment for integrated models of biomolecular
interaction networks. Genome Res. 13:2498–2504. 2003. View Article : Google Scholar : PubMed/NCBI
|
|
17
|
Aguirre-Gamboa R, Gomez-Rueda H,
Martínez-Ledesma E, Martínez-Torteya A, Chacolla-Huaringa R,
Rodriguez-Barrientos A, Tamez-Peña JG and Treviño V: SurvExpress:
An online biomarker validation tool and database for cancer gene
expression data using survival analysis. PLoS One. 8:e742502013.
View Article : Google Scholar : PubMed/NCBI
|
|
18
|
Zhuang J, Lu Q, Shen B, Huang X, Shen L,
Zheng X, Huang R, Yan J and Guo H: TGFβ1 secreted by
cancer-associated fibroblasts induces epithelial-mesenchymal
transition of bladder cancer cells through lncRNA-ZEB2NAT. Sci Rep.
5:119242015. View Article : Google Scholar : PubMed/NCBI
|
|
19
|
Hung TT, Wang H, Kingsley EA, Risbridger
GP and Russell PJ: Molecular profiling of bladder cancer:
Involvement of the TGF-beta pathway in bladder cancer progression.
Cancer Lett. 265:27–38. 2008. View Article : Google Scholar : PubMed/NCBI
|
|
20
|
Jebar AH, Hurst CD, Tomlinson DC, Johnston
C, Taylor CF and Knowles MA: FGFR3 and Ras gene mutations are
mutually exclusive genetic events in urothelial cell carcinoma.
Oncogene. 24:5218–5225. 2005. View Article : Google Scholar : PubMed/NCBI
|
|
21
|
Kreso A and Dick JE: Evolution of the
cancer stem cell model. Cell Stem Cell. 14:275–291. 2014.
View Article : Google Scholar : PubMed/NCBI
|
|
22
|
Keymoosi H, Gheytanchi E, Asgari M,
Shariftabrizi A and Madjd Z: ALDH1 in combination with CD44 as
putative cancer stem cell markers are correlated with poor
prognosis in urothelial carcinoma of the urinary bladder. Asian Pac
J Cancer Prev. 15:2013–2020. 2014. View Article : Google Scholar : PubMed/NCBI
|
|
23
|
Steg AD, Bevis KS, Katre AA, Ziebarth A,
Dobbin ZC, Alvarez RD, Zhang K, Conner M and Landen CN: Stem cell
pathways contribute to clinical chemoresistance in ovarian cancer.
Clin Cancer Res. 18:869–881. 2012. View Article : Google Scholar : PubMed/NCBI
|
|
24
|
Marcato P, Dean CA, Giacomantonio CA and
Lee PW: Aldehyde dehydrogenase: Its role as a cancer stem cell
marker comes down to the specific isoform. Cell Cycle.
10:1378–1384. 2011. View Article : Google Scholar : PubMed/NCBI
|
|
25
|
Meng E, Mitra A, Tripathi K, Finan MA,
Scalici J, McClellan S, da Silva L Madeira, Reed E, Shevde LA,
Palle K, et al: ALDH1A1 maintains ovarian cancer stem cell-like
properties by altered regulation of cell cycle checkpoint and DNA
repair network signaling. PLoS One. 9:e1071422014. View Article : Google Scholar : PubMed/NCBI
|
|
26
|
Mukaisho K, Suo M, Shimakage M, Kushima R,
Inoue H and Hattori T: Down-regulation of drs mRNA in colorectal
neoplasms. Jpn J Cancer Res. 93:888–893. 2002. View Article : Google Scholar : PubMed/NCBI
|
|
27
|
Kim CJ, Shimakage M, Kushima R, Mukaisho
K, Shinka T, Okada Y and Inoue H: Down-regulation of drs mRNA in
human prostate carcinomas. Hum Pathol. 34:654–657. 2003. View Article : Google Scholar : PubMed/NCBI
|
|
28
|
Tambe Y, Isono T, Haraguchi S,
Yoshioka-Yamashita A, Yutsudo M and Inoue H: A novel apoptotic
pathway induced by the drs tumor suppressor gene. Oncogene.
23:2977–2987. 2004. View Article : Google Scholar : PubMed/NCBI
|
|
29
|
Duff RM, Tay V, Hackman P, Ravenscroft G,
McLean C, Kennedy P, Steinbach A, Schöffler W, van der Ven PF,
Fürst DO, et al: Mutations in the N-terminal actin-binding domain
of filamin C cause a distal myopathy. Am J Hum Genet. 88:729–740.
2011. View Article : Google Scholar : PubMed/NCBI
|
|
30
|
Vanaja DK, Ehrich M, van den Boom D,
Cheville JC, Karnes RJ, Tindall DJ, Cantor CR and Young CY:
Hypermethylation of genes for diagnosis and risk stratification of
prostate cancer. Cancer Invest. 27:549–560. 2009. View Article : Google Scholar : PubMed/NCBI
|
|
31
|
Mahapatra S, Klee EW, Young CY, Sun Z,
Jimenez RE, Klee GG, Tindall DJ and Donkena KV: Global methylation
profiling for risk prediction of prostate cancer. Clin Cancer Res.
18:2882–2895. 2012. View Article : Google Scholar : PubMed/NCBI
|
|
32
|
Imura M, Yamashita S, Cai LY, Furuta J,
Wakabayashi M, Yasugi T and Ushijima T: Methylation and expression
analysis of 15 genes and three normally-methylated genes in 13
Ovarian cancer cell lines. Cancer Lett. 241:213–220. 2006.
View Article : Google Scholar : PubMed/NCBI
|
|
33
|
Zeller C, Dai W, Steele NL, Siddiq A,
Walley AJ, Wilhelm-Benartzi CS, Rizzo S, van der Zee A, Plumb JA
and Brown R: Candidate DNA methylation drivers of acquired
cisplatin resistance in ovarian cancer identified by methylome and
expression profiling. Oncogene. 31:4567–4576. 2012. View Article : Google Scholar : PubMed/NCBI
|
|
34
|
Kaneda A, Kaminishi M, Yanagihara K,
Sugimura T and Ushijima T: Identification of silencing of nine
genes in human gastric cancers. Cancer Res. 62:6645–6650.
2002.PubMed/NCBI
|
|
35
|
Oue N, Mitani Y, Motoshita J, Matsumura S,
Yoshida K, Kuniyasu H, Nakayama H and Yasui W: Accumulation of DNA
methylation is associated with tumor stage in gastric cancer.
Cancer. 106:1250–1259. 2006. View Article : Google Scholar : PubMed/NCBI
|
|
36
|
Qiao J, Cui SJ, Xu LL, Chen SJ, Yao J,
Jiang YH, Peng G, Fang CY, Yang PY, Liu F and Filamin C: A
dysregulated protein in cancer revealed by label-free quantitative
proteomic analyses of human gastric cancer cells. Oncotarget.
6:1171–1189. 2015. View Article : Google Scholar : PubMed/NCBI
|
|
37
|
Kessenbrock K, Plaks V and Werb Z: Matrix
metalloproteinases: Regulators of the tumor microenvironment. Cell.
141:52–67. 2010. View Article : Google Scholar : PubMed/NCBI
|
|
38
|
Nishida N, Yano H, Nishida T, Kamura T and
Kojiro M: Angiogenesis in cancer. Vasc Health Risk Manag.
2:213–219. 2006. View Article : Google Scholar : PubMed/NCBI
|
|
39
|
Latchman DS: Heat shock proteins and
cardiac protection. Cardiovasc Res. 51:637–646. 2001. View Article : Google Scholar : PubMed/NCBI
|
|
40
|
Willis MS and Patterson C: Hold me tight:
Role of the heat shock protein family of chaperones in cardiac
disease. Circulation. 122:1740–1751. 2010. View Article : Google Scholar : PubMed/NCBI
|
|
41
|
Chen S, Huang H, Yao J, Pan L and Ma H:
Heat shock protein B6 potently increases non-small cell lung cancer
growth. Mol Med Rep. 10:677–682. 2014.PubMed/NCBI
|
|
42
|
Wang X, Zhao T, Huang W, Wang T, Qian J,
Xu M, Kranias EG, Wang Y and Fan GC: Hsp20-engineered mesenchymal
stem cells are resistant to oxidative stress via enhanced
activation of Akt and increased secretion of growth factors. Stem
Cells. 27:3021–3031. 2009.PubMed/NCBI
|
|
43
|
Zhang X, Wang X, Zhu H, Kranias EG, Tang
Y, Peng T, Chang J and Fan GC: Hsp20 functions as a novel
cardiokine in promoting angiogenesis via activation of VEGFR2. PLoS
One. 7:e327652012. View Article : Google Scholar : PubMed/NCBI
|