Introduction
Colorectal cancer (CRC) is the third most commonly
diagnosed cancer worldwide, having a mortality rate near 50%
(1). Recent studies have shown that
these tumors retain multilineage differentiation processes similar
to those of the normal intestinal epithelium, mainly the goblet
cell and enterocyte lineages (2).
Furthermore, molecular classifications representing these cellular
phenotypes can have prognostic value and be predictive of response
to different therapeutic agents (3).
Metallothioneins (MTs) are a family of
low-molecular-weight, cysteine-rich proteins involved in zinc and
redox metabolism. By chelating zinc ions through redox-active thiol
groups, they have the capacity to regulate the exchangeable,
loosely-bound pool of intracellular zinc, termed the ‘labile’ pool,
which participates in zinc transfer reactions and intracellular
signaling. Thus MTs have been implicated in many aspects of tumor
biology, such as proliferation, differentiation, apoptosis,
angiogenesis, redox and zinc homeostasis, anti-inflammatory
reactions and immunomodulation (4–7). The
human genome encodes at least 11 functional MT isoforms that share
structural and functional similarities. Due to their structural
similarity, commercially available antibodies do not distinguish
between individual MT isoforms, and therefore their individual mRNA
expression levels can be measured by qRT-PCR. However, due to the
fact that they are variably expressed in tissues and induced by
several stimuli, it is possible that different tumors express
distinct MT genes, which could help explain the conflicting data on
MT function in different tumor types (6,7). We
and others have previously shown that multiple MT1 isoforms and
MT2A are downregulated during CRC progression (especially isoform
MT1G) mainly through epigenetic mechanisms, and that this is
associated with shorter patient survival (8–11).
Several agents such as DNA methyltransferase inhibitors, histone
deacetylase inhibitors or zinc are capable of re-inducing MT
expression in colorectal tumors, which can slow down in vivo
tumor growth and sensitize these tumors to chemotherapeutic agents
(12).
In order to help understand the phenotypic
consequences of MT induction, in the present study we investigated
the effects of stable overexpression of the most downregulated
isoform in CRC, namely MT1G, on the HT-29 CRC cell line. We
uncovered a new role for this isoform in modulating tumor
differentiation and thus expand the mechanisms by which this gene
may act as a tumor suppressor in CRC.
Materials and methods
Reagents and cell lines
The MT1G cDNA was cloned into the
pcDNA3.1/myc-His(−)A expression vector, resulting in an MT1G-myc
fusion protein as previously described (12). Sodium butyrate and
N,N,N',N'-tetrakis(2-pyridylmethyl) ethylenediamine (TPEN) were
purchased from Sigma-Aldrich Inc. (St. Louis, MO, USA), and
FluoZin-3-AM (FZ) from Invitrogen (San Diego, CA, USA). The human
CRC cell lines HT-29 and HCT116 were obtained from the American
Type Culture Collection (ATCC; Manassas, VA, USA), maintained as
previously described (8), and
subjected to STR profiling for authentication after all experiments
were finalized. For post-confluent growth, day 0 was considered the
day when cells reached 100% confluence, and fresh medium was
replaced every 1–2 days thereafter.
Animal studies and histological
procedures
Eight- to 10-week-old male nude mice were
subcutaneously injected (2×10⁶ cells each) with two
independent clones of MOCK or MT1G+ cells (5 mice/group)
and tumor size was measured with a caliper to calculate tumor
volume using the formula: Tumor volume (mm3) = [length
(mm)]×[width (mm)]2×π/6. All animal procedures were
approved by the Institutional Animal Care Board of the Leloir
Institute. After 50 days, tumors were excised, formalin-fixed and
paraffin-embedded for histological examination. A fraction of each
tumor was preserved in RNAlater medium (Ambion Inc., Austin TX,
USA) at 4̊C for 24 h, and then stored at −80̊C. RNA was extracted
from RNAlater-preserved tissues using the TRIzol method
(Invitrogen), and quantification and quality control were performed
with the Agilent 2100 Bioanalyzer (Agilent Technologies, Santa
Clara, CA, USA). Paraffin sections (4 µm thick) were re-hydrated
and stained with Alcian Blue stain (1% in 3% acetic acid, pH 2.5)
or processed for immunohistochemistry using the Vectastain
Universal Elite ABC kit (Vector Laboratories, Inc., Burlingame, CA,
USA) with citrate buffer antigen retrieval and the following
antibodies: anti-cytokeratin 20 (KS 20.8; Dako Corporation,
Carpinteria, CA, USA) and anti-CDX2 (clone EPR2764Y; Cell Marque,
Rocklin, CA, USA).
For transmission electron microscopy, freshly
xenografted tumors were cut into small (~1-mm thick) pieces and
promptly fixed in 2.5% glutaraldehyde in phosphate-buffered saline
(PBS) for 2 h, washed and fixed for 90 min in 1% osmium tetroxide
in phosphate-buffered saline (PBS), de-hydrated in acetone
gradients and included in resin. Semi-(0.5 µm) and ultra-thin (70
nm) sections were cut and contrasted in 2.5% uranyl-acetate, and
visualized using a Zeiss EM 109T microscope coupled to a digital
CCD Gatan ES1000W camera.
Gene expression profile analysis and
qRT-PCR
Total RNA was extracted, and mRNA expression was
analyzed using an Agilent Custom microarray 8×15K (Agilent
Technologies, Palo Alto, CA, USA), which contained 15,744
oligonucleotide probes representing >8,200 different human
transcripts. Two samples from each group were used to detect mRNA
expression; each biological replicate was run in duplicate, and the
fluorochromes were swapped to reduce dye-bias; in total eight 15K
microarrays were scanned using the Axon Confocal Scanner 4000B
(Molecular Devices, Sunnyvale, CA, USA) with optimized settings:
dye channel, 635 nm, PMT=720, laser power, 30%, scan resolution, 10
nm; dye channel, 532 nm, PMT=540, laser power, 30%, scan
resolution, 10 nm; line average, 4 lines. The data were analyzed
using GenePix® Pro 6 Microarray Acquisition and Analysis
Software (Molecular Devices) and normalized with the MIDAS v2.2:
Microarray Data Analysis System (TIGR's Microarray Data Analysis
System). Normalization was necessary to compensate for variability
between slides and fluorescent dyes. To this end we employed a
locally weighted linear regression [Lowess (13,14)];
data were filtered using low-intensity cutoff and replicate
consistency trimming.
The differentially expressed genes among the
MT1G+, and control (MOCK) sets were identified using the
significant analysis of microarray (SAM) statistical software from
MultiExperiment Viewer (MeV) (TIGR's Microarray Data Analysis
System). In the comparisons of MT1G+ vs. MOCK, the genes
that were all upregulated in the comparisons were identified as the
persistently upregulated genes, and the genes that were all
downregulated in the comparisons were defined as the persistently
downregulated genes.
The gene annotation enrichment analysis using Gene
Ontology (GO) (http://www.geneontology.org/) and Kyoto Encyclopedia
of Genes and Genomes (KEGG) (http://www.genome.jp/kegg/) data for gene sets was
performed using Database for Annotation, Visualization, and
Integrated Discovery (DAVID) software (15,16). A
Benjamini p-value of 0.05 was used in the analysis.
Quantitative reverse-transcription PCR (qRT-PCR) was
used to quantify mRNA levels as previously described (8). Briefly, PCR runs were carried out
using SYBR Universal Master Mix (Applied Biosystems, Carlsbad, CA,
USA), and relative expression levels were determined by the ΔΔCt
method using ACTB gene expression to normalize all samples. The
primers used are listed in Table
I.
 | Table I.Primer sequences. |
Table I.
Primer sequences.
| Gene | Forward primer | Reverse primer |
|---|
| MT1G |
CTTCTCGCTTGGGAACTCTA |
AGGGGTCAAGATTGTAGCAAA |
| MT2A |
GCAACCTGTCCCGACTCTAG |
TTGCAGGAGGTGCATTTG |
| ACTB |
GCCATCTCTTGCTCGAAGTCCAG |
ATGTTTGAGACCTTCAACACCCC |
| CDKN1A |
AAGACCATGTGGACCTGT |
GGTAGAAATCTGTCATGCTG |
| HSI |
GAGGACACTGGCTTGGAGAC |
ATCCAGCGGGTACAGAGATG |
| HALPI |
GACCACTCCCATGTCTTCTCCTT |
TCGCACGCCTGAGTTGAA |
| CA2 |
CCGCGGACACACAGTGCAGG |
CCAGTGCTCAGGTCCGTTGTGT |
| CA1 |
CAGAACATACAGTGGATGGAGTCAA |
GGCCTCACCAACCTTCATCA |
| K20 |
AAATGCTCGGTGTGTCCTG |
ACTTCCTCCTGATGCTCCTT |
| ATOH1 |
CCCCGGGAGCATCTTG |
GGGACCGAGGCGAAGTT |
| TFF3 |
CTCCAGCTCTGCTGAGGAGT |
GCTTGAAACACCAAGGCACT |
| HMUC2 |
CAGCACCGATTGCTGAGTTG |
GCTGGTCATCTCAATGGCAG |
| CDX2 |
GATGGTGATGTAGCGACTGTAGTGA |
CTCGGCAGCCAAGTGAAAAC |
Alkaline phosphatase activity
measurement
The activity of this enzyme was used as a marker of
differentiation of HT-29 cells (17). For this purpose, confluent cell
lines were lysed in 10 mM Tris (pH 7.4), 1 mM MgCl2, 20
µM ZnCl2, 0.2% Triton X-100 + protease inhibitors, and
incubated with NBT-BCIP as the chromogenic substrate for 16 h at
37̊C. The resulting brown precipitate was solubilized in 10% SDS,
10% HCl and absorbance was measured at 595 nm.
siRNA transfection
Two siRNAs targeting the MT1G isoform (si1G.1 and
si1G.2) and one targeting all functional MT-1 and MT-2 isoforms
were previously validated (12),
and transfected at 125 nM using LF2000 (Invitrogen) as described by
the manufacturer. After 24 h of siRNA treatment, medium was
replaced with or without 2 mM sodium butyrate for 48 h, and cells
were collected for RNA extraction or ALP activity measurement.
Scratch assays and gelatin
zymography
We used the scratch assay to estimate the migration
capacities of MOCK and MT1G+ cell lines, which were
plated in triplicate in 24-well plates until they reached
confluence. Two perpendicular scratches were made with a pipette
tip, after which the cells were washed thrice in PBS and replaced
with 1% fetal bovine serum (FBS) medium. Areas with the same wound
length were selected and photographed until complete wound closure.
Wound closure at a given time t was calculated as: (initial wound
length - wound length at time t)/initial wound length×100.
To determine gelatinase activity of matrix
metalloproteinases (MMPs), upon reaching confluence medium was
replaced with serum-free Dulbeccos modified Eagles medium (DMEM)
for 24 h, and the conditioned medium was centrifuged at 1,200 × g
for 5 min, and immediately loaded into 10% polyacrylamide
electrophoretic gels with or without 2.5 mg/ml gelatin
(Sigma-Aldrich) as described in (18). Coomasie Blue staining of the
non-gelatin gels were used as a loading control.
Measurement of intracellular labile
zinc
For this purpose we employed the cell-permeable
zinc-specific fluorophore FZ as described in (12). Briefly, cells were plated in
triplicate in sterile plastic coverslips (for fluorescence
microscopy) or in 96-well plates (for fluorimetric analysis), and
incubated for 30 min at room temperature with 2 µM FZ in PBS,
washed in PBS and incubated a further 30 min in PBS at room
temperature. Propidium iodide staining was used to control for
plating differences and data are expressed as normalized
fluorescence FZ = (F - FTPEN)/(FZn - FTPEN), so as to get values
relative to a ‘maximum’ intensity given by pretreatment with zinc
400 µM for 8 h (FZn, resulting in FZ=1) and a ‘minimum’ intensity
given by 20 µM TPEN treatment during the final 30 min incubation of
fluozin (FTPEN, resulting in FZ=0). This score allowed us to better
compare results of the different experiments.
Statistical analysis
Data are expressed as mean ± SEM and p-values
<0.05 were considered significant. Comparison of means was
carried out using Student's t-test, with one-way ANOVA followed by
Dunnett's post hoc t-test for three or more groups, or with two-way
ANOVA followed by Bonferroni's post hoc t-test for two variables.
GraphPad Prism 5.0 (GraphPad Software, Inc., La Jolla, CA, USA)
software was used for analysis.
Results
MT1G overexpression in the HT-29 CRC
cell line
We stably expressed MT1G as a myc-epitope fusion
protein in HT-29 cells. When grown in vivo as subcutaneous
xenografts on nude mice, these MT1G+ cells grew at
similar rates compared to the empty-vector (‘MOCK’)-transfected
cells (data not shown), in stark contrast to the antiproliferative
effects we had previously observed using the HCT116 cell line
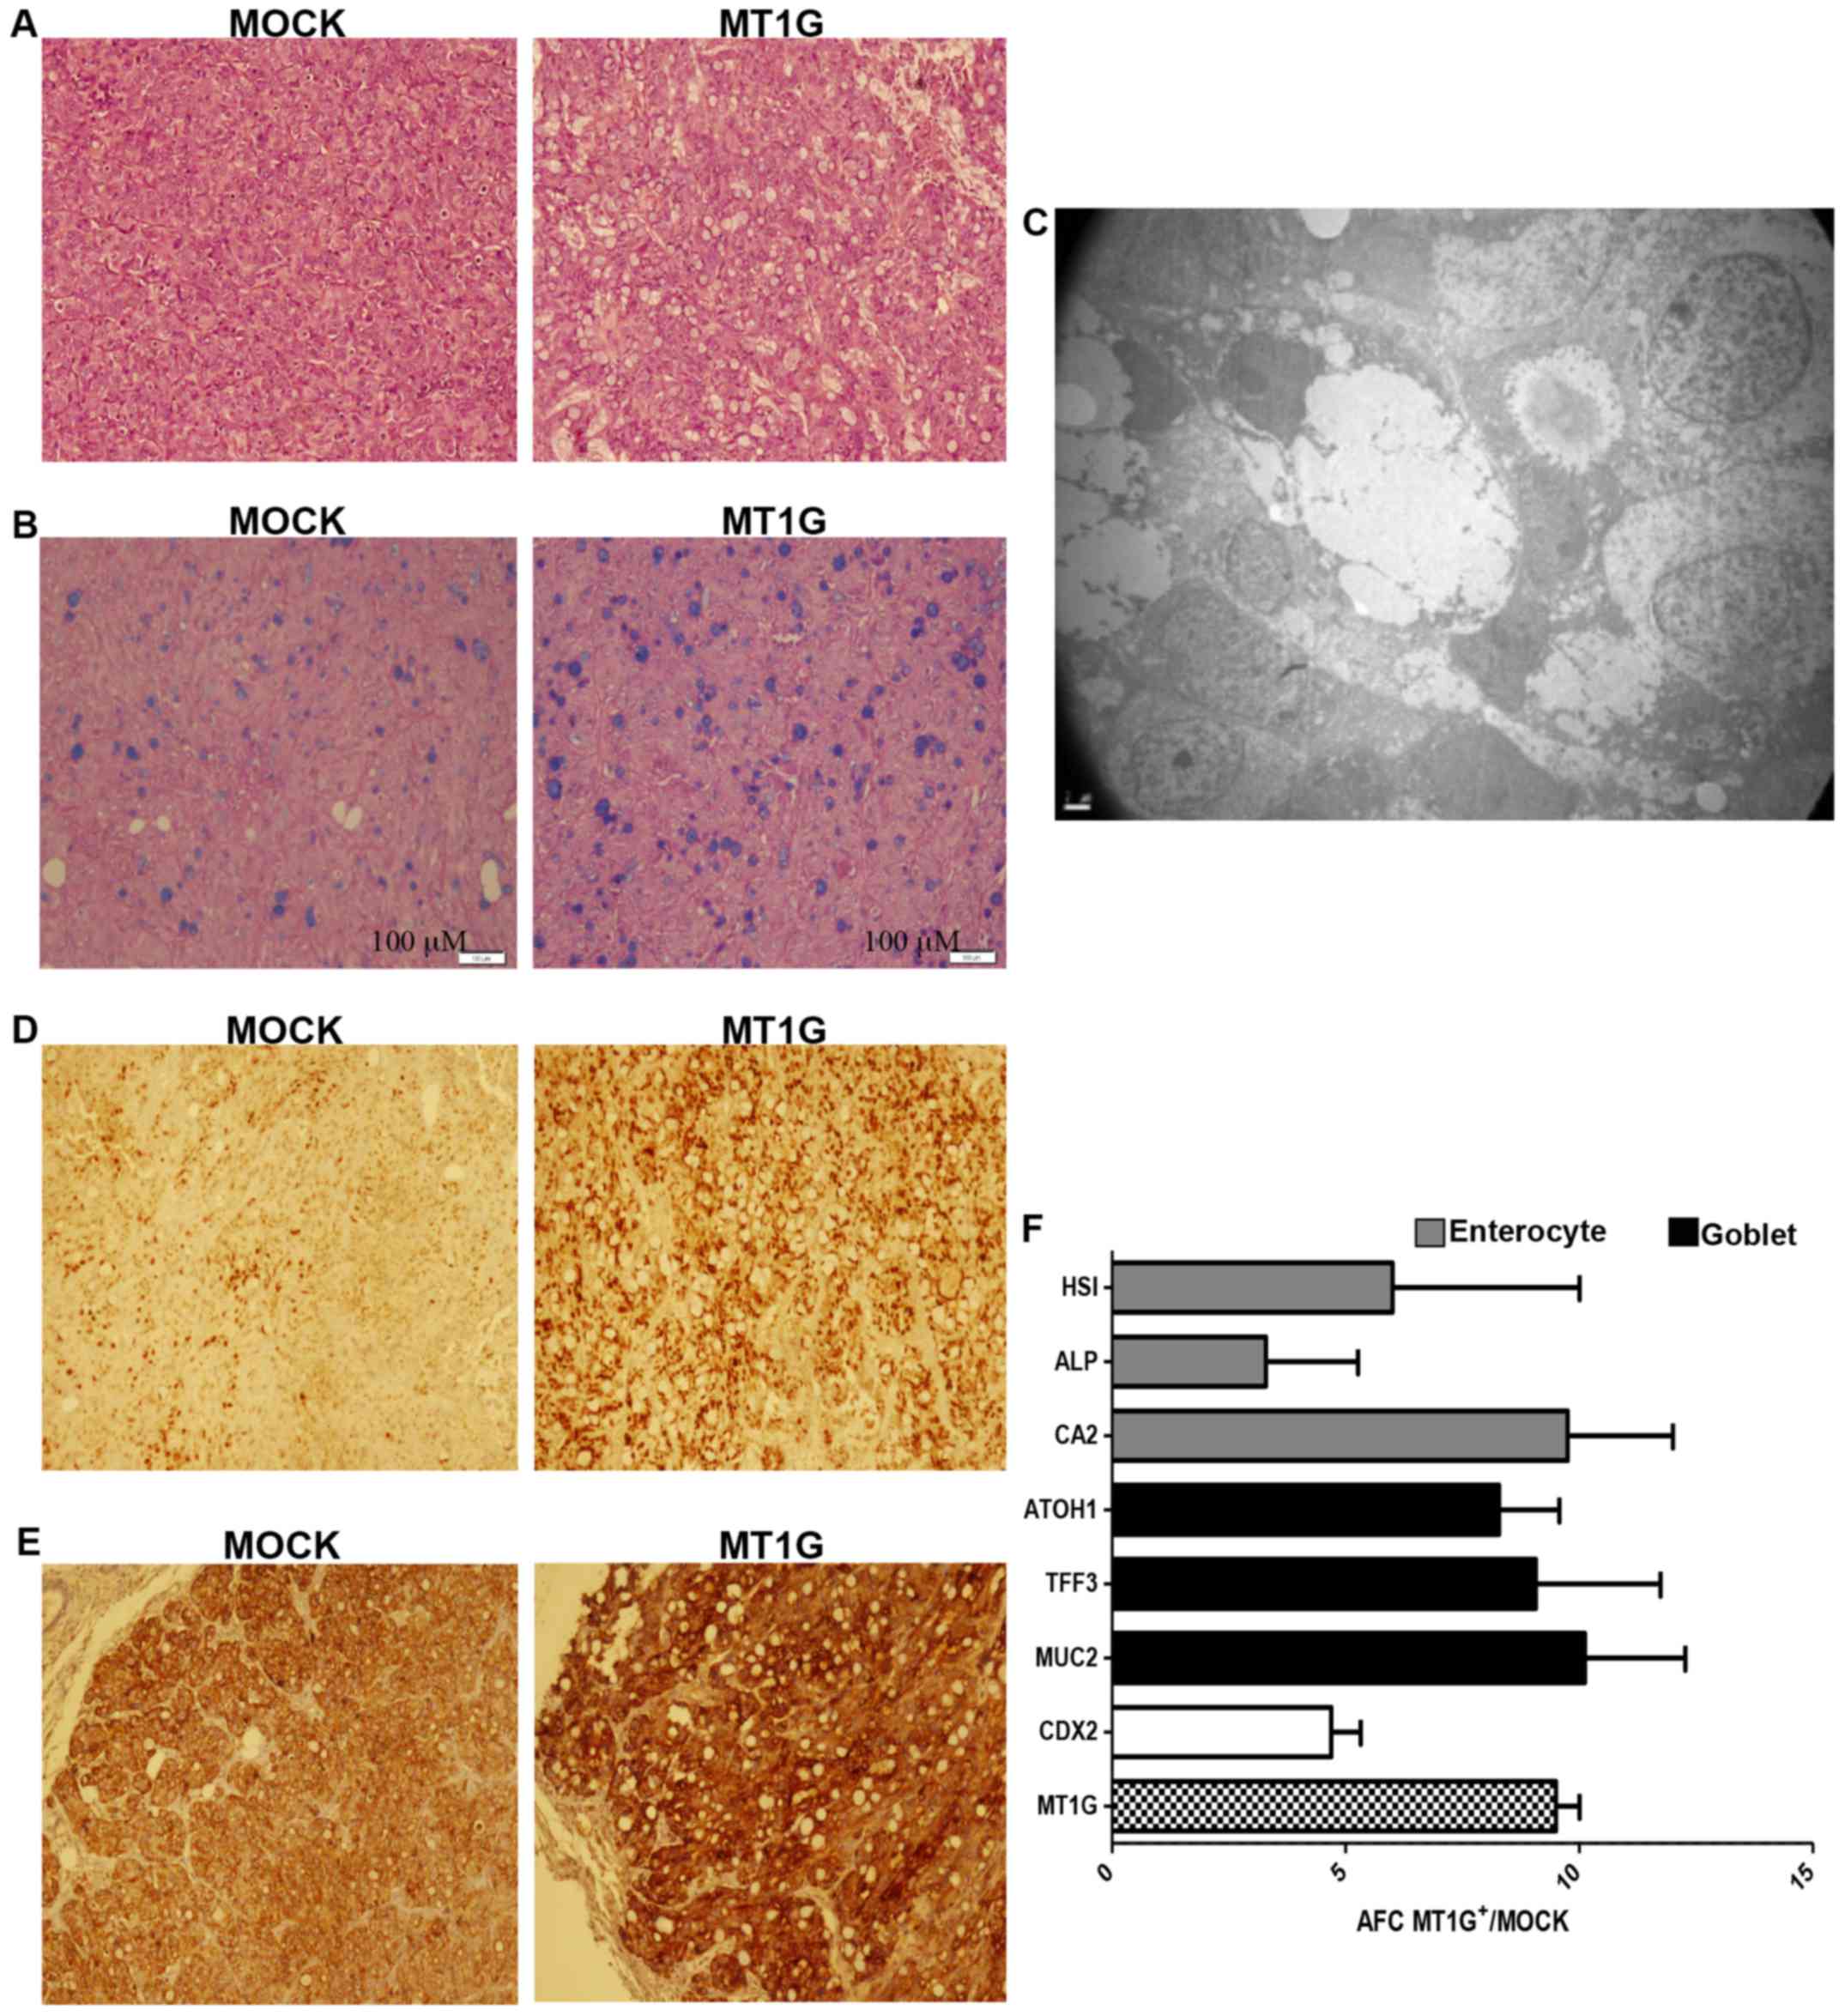
(12). However, hematoxylin and
eosin (H&E) staining (Fig. 1A)
showed that MT1G+ tumors contained a higher number of
mucin-containing, Alcian Blue-positive cells (Fig. 1B) that were confirmed to be goblet
cells by transmission electron microscopy (Fig. 1C). Nuclear expression of the
intestine-specific homeobox transcription factor CDX2 was markedly
enhanced in the MT1G+ tumors, as shown by
immunohistochemical staining on Fig.
1D, as was also the intensity of cytokeratin 20 (Fig. 1E). The latter also suggests that
commitment to the enterocyte lineage may be enhanced as well.
Indeed, both goblet-associated (TFF3, ATOH1 and
MUC2) and enterocyte-associated genes (HSI,
CA2 and ALPI) were overexpressed in the
MT1G+ tumors by qRT-PCR analysis (Fig. 1F), suggesting that MT1G+
tumors are more differentiated than MOCK controls.
Gene expression analysis of HT-29
MT1G+ tumors using cDNA microarrays
We then used cDNA microarrays to profile the mRNA
expression of MOCK and MT1G+ HT-29 xenografts, derived
from two different MT1G+ or MOCK clonal cell lines
(MT1G-1 and MT1G-2, or MOCK-1 and MOCK-2, respectively). Gene
expression profiles of the biological replicates were reproducible
and highly correlated (Pearson's correlation coefficient 0.81).
Analysis of data with Rank product analysis revealed significant
gene expression differences among the groups, with a total of 305
known genes found to be consistently upregulated or downregulated
in the MT1G+ tumors (Table
II). GO analysis indicated that several functional categories
were enriched by DAVID, and included upregulated genes associated
with cell differentiation, cell fate commitment and Notch signaling
pathway, as well as downregulated genes in the categories of
regulation of apoptosis, cell migration and cell proliferation
(Table III). Differentially
expressed genes were also analyzed for KEGG pathway enrichment and
two significantly enriched pathways were identified between
upegulated or downregulated genes: the Notch signaling pathway and
pathways in cancer, respectively.
| Table II.List of all significantly
differentially expressed genes in MT1G+ vs. MOCK HT-29
xenografts. |
Table II.
List of all significantly
differentially expressed genes in MT1G+ vs. MOCK HT-29
xenografts.
| A, Upregulated
genes |
|---|
|
|---|
| Gene reference | Gene symbol | Name | Mean | P-values (Up) | RP-values (Up) |
|---|
| NM_138444 | KCTD12 | Potassium channel
tetramerisation domain containing 12 | 2.65 | 2.81E-06 | 80.00 |
| NM_000051 | ATM | Ataxia
telangiectasia mutated | 2.52 | 4.68E-06 | 91.77 |
| NM_175698 | SSX2 | Synovial sarcoma, X
breakpoint 2 | 3.06 | 6.56E-06 | 99.19 |
| NM_031964 | KRTAP17-1 | Keratin-associated
protein 17-1 | 2.35 | 2.25E-05 | 141.15 |
| NM_003357 | SCGB1A1 | Secretoglobin,
family 1A, member 1 (uteroglobin) | 2.19 | 2.72E-05 | 155.94 |
| NM_005430 | WNT1 | Wingless-type MMTV
integration site family, member 1 | 2.40 | 2.81E-05 | 156.29 |
| NM_001031672 | CYB5RL | Cytochrome b5
reductase-like | 2.37 | 3.18E-05 | 164.29 |
| NM_000546 | TP53 | Tumor protein
p53 | 2.12 | 3.75E-05 | 168.99 |
| NM_001123065 |
| Chromosome 7 open
reading frame 65 | 2.04 | 4.59E-05 | 181.40 |
| NM_001443 | FABP1 | Fatty acid binding
protein 1, liver | 2.27 | 5.99E-05 | 197.89 |
| NM_000364 | TNNT2 | Troponin T type 2
(cardiac) | 2.01 | 8.24E-05 | 216.07 |
| NM_001201 | BMP3 | Bone morphogenetic
protein 3 | 2.17 | 1.01E-04 | 224.84 |
| NM_031310 | PLVAP | Plasmalemma
vesicle-associated protein | 2.02 | 1.22E-04 | 239.78 |
| NM_182981 | OSGIN1 | Oxidative stress
induced growth inhibitor 1 | 1.89 | 1.44E-04 | 249.22 |
| NM_139211 | HOPX | HOP homeobox | 1.88 | 1.65E-04 | 256.18 |
| NM_017774 | CDKAL1 | CDK5 regulatory
subunit-associated protein 1-like 1 | 1.86 | 2.00E-04 | 271.00 |
| NM_001077195 | ZNF436 | Zinc finger protein
436 | 1.96 | 2.62E-04 | 289.52 |
| NM_000067 | CA2 | Carbonic anhydrase
II | 1.76 | 2.82E-04 | 295.37 |
| NM_015894 | STMN3 | Stathmin-like
3 | 1.17 | 2.86E-04 | 296.25 |
| NM_014237 | ADAM18 | ADAM
metallopeptidase domain 18 | 2.19 | 2.95E-04 | 298.48 |
| NM_182705 | FAM101B | Family with
sequence similarity 101, member B | 1.81 | 4.28E-04 | 330.71 |
| NM_025191 | EDEM3 | ER degradation
enhancer, α-mannosidase-like 3 | 1.78 | 4.56E-04 | 337.06 |
| NM_020639 | RIPK4 |
Receptor-interacting serine-threonine
kinase 4 | 1.70 | 4.56E-04 | 337.43 |
| NM_004557 | NOTCH4 | Notch 4 | 1.70 | 4.77E-04 | 340.80 |
| NM_005618 | DLL1 | δ-like 1
(Drosophila) | 1.70 | 5.05E-04 | 346.21 |
| NM_004001 | FCGR2B | Fc fragment of IgG,
low affinity IIb, receptor (CD32) | 1.71 | 5.22E-04 | 349.94 |
| NM_001008225 | CNOT4 | CCR4-NOT
transcription complex, subunit 4 | 1.66 | 6.17E-04 | 367.80 |
| NM_170664 | OTOA | Οtoancorin | 1.64 | 6.23E-04 | 368.88 |
| NM_019845 | RPRM | Reprimo,
TP53-dependent G2 arrest mediator candidate | 1.39 | 6.24E-04 | 369.37 |
| NM_033409 | SLC52A3 | Chromosome 20 open
reading frame 54 | 1.65 | 6.26E-04 | 369.79 |
| NM_001010879 | ZIK1 | Zinc finger protein
interacting with K protein 1 homolog (mouse) | 1.59 | 6.68E-04 | 376.61 |
| NM_007365 | PADI2 | Peptidyl arginine
deiminase, type II | 1.98 | 6.99E-04 | 381.36 |
| NM_007314 | ABL2 | v-abl Abelson
murine leukemia viral oncogene homolog 2 | 0.99 | 7.21E-04 | 385.01 |
| NM_001080519 | BAHCC1 | BAH domain and
coiled-coil containing 1 | 1.58 | 7.93E-04 | 397.25 |
| NM_000584 | CXCL8 | Interleukin 8 | 1.68 | 9.46E-04 | 419.56 |
| NM_002649 | PIK3CG |
Phosphoinositide-3-kinase, catalytic,
γ-polypeptide | 1.74 | 1.07E-03 | 437.34 |
| NM_178311 | GGTLC1 |
γ-glutamyltransferase light chain 1 | 1.28 | 1.09E-03 | 440.27 |
| NM_001124756 | PABPC1L | Poly(A) binding
protein, cytoplasmic 1-like | 1.51 | 1.11E-03 | 442.81 |
| NM_001010926 | HES5 | Hairy and enhancer
of split 5 (Drosophila) | 1.09 | 1.15E-03 | 446.74 |
| NM_152643 | KNDC1 | Kinase
non-catalytic C-lobe domain (KIND) containing 1 | 1.85 | 1.18E-03 | 449.71 |
| NM_152279 | ZNF585B | Zinc finger protein
585B | 1.30 | 1.18E-03 | 450.06 |
| NM_003018 | SFTPC | Surfactant protein
C | 1.51 | 1.20E-03 | 452.03 |
| NM_003460 | ZP2 | Zona pellucida
glycoprotein 2 (sperm receptor) | 1.79 | 1.23E-03 | 456.86 |
| NM_022101 |
| Chromosome X open
reading frame 56 | 0.84 | 1.30E-03 | 464.79 |
| NM_001136566 | RAD21L1 | RAD21-like 1 (S.
pombe) | 0.61 | 1.31E-03 | 465.53 |
| NM_019886 | CHST7 | Carbohydrate
(N-acetylglucosamine 6-O) sulfotransferase 7 | 1.49 | 1.43E-03 | 477.78 |
| NM_002410 | MGAT5 | Mannosyl
(α-1,6-)-glycoprotein β-1,6-N-acetyl-glucosaminyltransferase | 1.37 | 1.49E-03 | 484.02 |
| NM_001130715 | PLAC8 | Placenta-specific
8 | 1.47 | 1.51E-03 | 485.05 |
| NM_012368 | OR2C1 | Olfactory receptor,
family 2, subfamily C, member 1 | 1.42 | 1.60E-03 | 493.64 |
| NM_198463 | C3ORF67 | Chromosome 3 open
reading frame 67 | 1.55 | 1.72E-03 | 503.50 |
| NM_080647 | TBX1 | T-box 1 | 1.01 | 1.74E-03 | 504.66 |
| NM_001136003 | C2CD4D | C2
calcium-dependent domain containing 4D | 1.38 | 1.83E-03 | 512.27 |
| NM_014909 | VASH1 | Vasohibin 1 | 1.38 | 1.84E-03 | 512.54 |
| NM_002318 | LOXL2 | Lysyl oxidase-like
2 | 1.44 | 1.91E-03 | 518.96 |
| NM_031457 | MS4A8 | Membrane-spanning
4-domains, subfamily A, member 8B | 1.36 | 2.17E-03 | 538.29 |
| NM_001146190 | ZNF407 | Zinc finger protein
407 | 1.35 | 2.20E-03 | 541.10 |
| NM_004375 | COX11 | COX11 cytochrome
c oxidase assembly homolog (yeast) | 1.37 | 2.36E-03 | 552.91 |
| NM_001040462 | BTNL8 | Butyrophilin-like
8 | 0.84 | 2.39E-03 | 554.54 |
| NM_001265 | CDX2 | Caudal type
homeobox 2 | 1.33 | 2.44E-03 | 558.57 |
| NM_001013661 | VSIG8 | V-set and
immunoglobulin domain containing 8 | 1.33 | 2.50E-03 | 563.31 |
| NM_019119 | PCDHB9 |
Protocadherin-β9 | 1.32 | 2.51E-03 | 564.49 |
| NM_001144875 | DOK3 | Docking protein
3 | 1.29 | 2.54E-03 | 566.33 |
| NM_003722 | TP63 | Tumor protein
p63 | 1.38 | 2.56E-03 | 569.10 |
| NM_006138 | MS4A3 | Membrane-spanning
4-domains, subfamily A, member 3 (hematopoietic cell-specific) | 1.58 | 2.73E-03 | 580.41 |
| NM_005427 | TP73 | Tumor protein
p73 | 1.37 | 2.88E-03 | 589.30 |
| NM_003106 | SOX2 | SRY (sex
determining region Y)-box 2 | 1.07 | 3.12E-03 | 604.10 |
| NM_033318 | SMDT1 | Chromosome 22 open
reading frame 32 | 0.80 | 3.14E-03 | 605.59 |
| NM_012426 | SF3B3 | Splicing factor 3b,
subunit 3, 130 kDa | 1.31 | 3.31E-03 | 615.60 |
| NM_002458 | MUC5B | Mucin 5B,
oligomeric mucus/gel-forming | 1.53 | 3.45E-03 | 623.75 |
| NM_001001411 | ZNF676 | Zinc finger protein
676 | 1.45 | 3.48E-03 | 625.90 |
| NM_000362 | TIMP3 | TIMP
metallopeptidase inhibitor 3 | 1.33 | 3.55E-03 | 629.94 |
| NM_014751 | MTSS1 | Metastasis
suppressor 1 | 1.23 | 3.62E-03 | 633.32 |
| NM_201442 | C1S | Complement
component 1, s subcomponent | 0.91 | 3.63E-03 | 633.68 |
| NM_005961 | MUC6 | Mucin 6, oligomeric
mucus/gel-forming | 1.21 | 3.92E-03 | 647.05 |
| NM_001002758 | PRY2 | PTPN13-like,
Y-linked 2 | 1.47 | 3.99E-03 | 650.48 |
| NM_001135654 | PABPC4 | Poly(A) binding
protein, cytoplasmic 4 (inducible form) | 1.31 | 4.01E-03 | 651.26 |
| NM_014030 | GIT1 | G protein-coupled
receptor kinase interacting ArfGAP 1 | 1.17 | 4.13E-03 | 657.53 |
| NM_001083537 | FAM86B1 | Family with
sequence similarity 86, member B1 | 1.29 | 4.16E-03 | 658.91 |
| NM_001645 | APOC1 | Apolipoprotein
C-I | 1.20 | 4.27E-03 | 664.10 |
| NM_003226 | TFF3 | Trefoil factor 3
(intestinal) | 1.19 | 4.29E-03 | 664.92 |
| NM_005172 | ATOH1 | Atonal homolog 1
(Drosophila) | 1.26 | 4.31E-03 | 665.93 |
| NM_003708 | RDH16 | Retinol
dehydrogenase 16 (all-trans) | 0.92 | 4.41E-03 | 670.22 |
| NM_002917 | RFNG | RFNG
O-fucosylpeptide 3-β-N-acetylglucosaminyltransferase | 1.28 | 4.56E-03 | 677.43 |
| NM_016585 | THEG | Theg homolog
(mouse) | 1.19 | 4.63E-03 | 681.11 |
| NM_007058 | CAPN11 | Calpain 11 | 1.51 | 4.73E-03 | 684.84 |
| NM_003759 | SLC4A4 | Solute carrier
family 4, sodium bicarbonate co-transporter, member 4 | 1.19 | 4.74E-03 | 685.17 |
| NM_020299 | AKR1B10 | Aldo-keto reductase
family 1, member B10 (aldose reductase) | 1.17 | 4.77E-03 | 686.57 |
| NM_032133 | MYCBPAP | MYCBP-associated
protein | 0.92 | 4.95E-03 | 693.39 |
| NM_001631 | ALPI | Alkaline
phosphatase, intestinal | 1.25 | 4.98E-03 | 695.09 |
| NM_002486 | NCBP1 | Nuclear cap binding
protein subunit 1, 80 kDa | 1.23 | 5.09E-03 | 699.73 |
| NM_001105659 | LRRIQ3 | Leucine-rich
repeats and IQ motif containing 3 | 1.18 | 5.13E-03 | 702.05 |
| NM_014276 | RBPJL | Recombination
signal binding protein for immunoglobulin-κJ region-like | 1.15 | 5.29E-03 | 708.75 |
| NM_015461 | ZNF521 | Zinc finger protein
521 | 0.91 | 5.35E-03 | 711.10 |
| NM_001105662 | | Ubiquitin specific
peptidase 17 | 1.21 | 5.63E-03 | 722.91 |
| NM_005068 | SIM1 | Single-minded
homolog 1 (Drosophila) | 1.19 | 5.73E-03 | 726.21 |
| NM_018646 | TRPV6 | Transient receptor
potential cation channel, subfamily V, member 6 | 0.64 | 6.05E-03 | 739.17 |
| NM_139026 | ADAMTS13 | ADAM
metallopeptidase with thrombospondin type 1 motif, 13 | 0.84 | 6.31E-03 | 749.50 |
| NM_152749 | ATXN7L1 | Ataxin 7-like
1 | 0.75 | 6.31E-03 | 749.64 |
| NM_019034 | RHOF | Ras homolog gene
family, member F (in filopodia) | 1.21 | 6.35E-03 | 751.22 |
| NM_017592 | MED29 | Mediator complex
subunit 29 | 0.92 | 6.38E-03 | 752.10 |
| NM_206965 | FTCD |
Formiminotransferase cyclodeaminase | 1.16 | 6.40E-03 | 752.88 |
| NM_020063 | BARHL2 | BarH-like homeobox
2 | 1.10 | 6.41E-03 | 753.43 |
| NM_016338 | IPO11 | Importin 11 | 0.74 | 6.51E-03 | 756.92 |
| NM_001109997 | KLHL33 | Kelch-like 33
(Drosophila) | 1.15 | 6.61E-03 | 761.02 |
| NM_004235 | KLF4 | Kruppel-like factor
4 (gut) | 0.96 | 6.64E-03 | 762.27 |
| NM_172365 | PPP1R36 | Protein phosphatase
1, regulatory subunit 36 | 0.93 | 6.74E-03 | 765.82 |
| NM_003665 | FCN3 | Ficolin
(collagen/fibrinogen domain containing) 3 (Hakata antigen) | 1.23 | 6.86E-03 | 770.05 |
| NM_017910 | TRMT61B | tRNA
methyltransferase 61 homolog B (S. cerevisiae) | 0.97 | 7.11E-03 | 778.71 |
| NM_031459 | SESN2 | Sestrin 2 | 0.27 | 7.16E-03 | 780.18 |
| NM_203458 | NOTCH2NL | Notch 2 N-terminal
like | 0.59 | 7.16E-03 | 780.21 |
| NM_002203 | ITGA2 | Integrin, α2
(CD49B, α2 subunit of VLA-2 receptor) | 1.20 | 7.16E-03 | 780.44 |
| NM_138337 | CLEC12A | C-type lectin
domain family 12, member A | 1.32 | 7.22E-03 | 782.42 |
| NM_020533 | MCOLN1 | Mucolipin 1 | 0.51 | 7.33E-03 | 786.12 |
| NM_022481 | ARAP3 | ArfGAP with RhoGAP
domain, ankyrin repeat and PH domain 3 | 1.11 | 7.42E-03 | 789.36 |
| NM_001105578 | SYCE2 | Synaptonemal
complex central element protein 2 | 1.13 | 7.66E-03 | 797.43 |
| NM_021969 | NR0B2 | Nuclear receptor
subfamily 0, group B, member 2 | 1.16 | 7.68E-03 | 798.17 |
| NM_015852 | ZNF117 | Zinc finger protein
117 | 1.18 | 7.69E-03 | 798.86 |
| NM_023946 | LYNX1 | Ly6/neurotoxin
1 | 1.10 | 7.89E-03 | 805.77 |
| NM_001039887 | PROSER3 | Chromosome 19 open
reading frame 55 | 1.17 | 7.94E-03 | 807.24 |
| NM_015184 | PLCL2 | Phospholipase
C-like 2 | 1.06 | 8.02E-03 | 809.76 |
| NM_004938 | DAPK1 | Death-associated
protein kinase 1 | 0.54 | 8.06E-03 | 811.54 |
| NM_004755 | RPS6KA5 | Ribosomal protein
S6 kinase, 90 kDa, polypeptide 5 | 1.04 | 8.21E-03 | 816.35 |
| NM_001007532 | STH | Saitohin | 1.17 | 8.24E-03 | 817.51 |
| NM_002613 | PDPK1 |
3-Phosphoinositide-dependent protein
kinase-1 | 1.10 | 8.34E-03 | 820.46 |
| NM_006620 | HBS1L | HBS1-like (S.
cerevisiae) | 1.04 | 8.46E-03 | 824.24 |
| NM_003382 | VIPR2 | Vasoactive
intestinal peptide receptor 2 | 0.77 | 8.55E-03 | 826.94 |
| NM_203486 | DLL3 | δ-like 3
(Drosophila) | 1.07 | 8.56E-03 | 827.15 |
| NM_018010 | IFT57 | Intraflagellar
transport 57 homolog (Chlamydomonas) | 0.92 | 8.74E-03 | 833.66 |
| NM_001135816 | CXORF56 | C1QTNF9B antisense
RNA 1 (non-protein coding) | 0.87 | 8.76E-03 | 834.30 |
| NM_033133 | CNP | 2′,3′-Cyclic
nucleotide 3 phosphodiesterase | 1.02 | 8.84E-03 | 836.32 |
| NM_005199 | CHRNG | Cholinergic
receptor, nicotinic, γ | 0.98 | 9.01E-03 | 841.20 |
| NM_182765 | HECTD2 | HECT domain
containing 2 | 0.79 | 9.12E-03 | 844.85 |
| NM_001145290 | SLC37A2 | Solute carrier
family 37 (glycerol-3- phosphate transporter), member 2 | 0.90 | 9.15E-03 | 845.70 |
| NM_001195252 | APTX | Aprataxin | 1.05 | 9.31E-03 | 850.77 |
| NM_001251964 | TP53AIP1 | Tumor protein
p53-regulated apoptosis inducing protein 1 | 1.26 | 9.35E-03 | 851.82 |
| NM_198270 | NHS | Nance-Horan
syndrome (congenital cataracts and dental anomalies) | 1.13 | 9.53E-03 | 857.71 |
| NM_000578 | SLC11A1 | Solute carrier
family 11 (proton-coupled divalent metal ion transporters), member
1 | 1.06 | 9.63E-03 | 859.97 |
| NM_002139 | RBMX | RNA binding motif
protein, X-linked | 1.06 | 9.65E-03 | 860.47 |
| NM_000435 | NOTCH3 | Notch 3 | 1.10 | 9.71E-03 | 862.14 |
| NM_033066 | MPP4 | Membrane protein,
palmitoylated 4 (MAGUK p55 subfamily member 4) | 1.12 | 9.87E-03 | 867.43 |
|
| B, Downregulated
genes |
|
| Gene reference | Gene symbol | Name | Mean | P-values
(Down) | RP-values
(Down) |
|
| AJ298317 | MUC5AC | Mucin 5AC,
oligomeric mucus/gel-forming | −2.54 | 8.43E-06 | 112.88 |
|
|
|
| AF547222 | LOC280665 | Anti-CNG α1 cation
channel translation product-like | −2.76 | 1.31E-05 | 123.92 |
| AK097187 | NQO2 | NAD(P)H
dehydrogenase, quinone 2 | −2.48 | 3.75E-05 | 169.61 |
| AK128551 | RNF216 | Ring finger protein
216 | −2.19 | 6.09E-05 | 198.31 |
| BC062748 | EFCAB10 | EF-hand calcium
binding domain 10 | −2.10 | 1.14E-04 | 233.55 |
| NM_000639 | FASLG | Fas ligand (TNF
superfamily, member 6) | −1.61 | 2.15E-04 | 274.72 |
| NM_001124 | ADM | Adrenomedullin | −1.48 | 3.43E-04 | 311.18 |
| NM_000043 | FAS | Fas (TNF receptor
superfamily, member 6) | −1.68 | 4.22E-04 | 329.27 |
| BC065002 | EXD3 | Exonuclease 3′-5′
domain containing 3 | −2.04 | 5.19E-04 | 349.20 |
| NM_004931 | CD8B | CD8b molecule | −1.24 | 6.82E-04 | 378.73 |
| NM_021635 | PBOV1 | Prostate and breast
cancer overexpressed 1 | −1.17 | 7.31E-04 | 386.63 |
| NM_000093 | COL5A1 | Collagen, type V,
α1 | −1.67 | 8.08E-04 | 398.60 |
| NM_000429 | MAT1A | Methionine
adenosyltransferase I, α | −1.67 | 8.43E-04 | 403.54 |
| NM_000033 | ABCD1 | ATP-binding
cassette, sub-family D (ALD), member 1 | −1.69 | 8.92E-04 | 411.33 |
| NM_000125 | ESR1 | Estrogen receptor
1 | −1.67 | 8.95E-04 | 411.64 |
| NM_000808 | GABRA3 | γ-Aminobutyric acid
(GABA) A receptor, α3 | −1.60 | 9.27E-04 | 415.96 |
| NM_000595 | LTA | Lymphotoxin-α (TNF
superfamily, member 1) | −1.63 | 9.95E-04 | 427.69 |
| NM_000197 | HSD17B3 | Hydroxysteroid
(17-β) dehydrogenase 3 | −1.67 | 1.04E-03 | 432.79 |
| NM_001037442 | RUFY3 | RUN and FYVE domain
containing 3 | −1.54 | 1.05E-03 | 434.60 |
| NM_000545 | HNF1A | HNF1 homeobox
A | −1.64 | 1.07E-03 | 437.31 |
| NM_001005490 | OR6C74 | Olfactory receptor,
family 6, subfamily C, member 74 | −1.59 | 1.09E-03 | 439.40 |
| NM_001031848 | SERPINB8 | Serpin peptidase
inhibitor, clade B (ovalbumin), member 8 | −1.54 | 1.15E-03 | 447.15 |
| NM_000612 | IGF2 | Insulin-like growth
factor 2 (somatomedin A) | −1.63 | 1.16E-03 | 448.01 |
| NM_000517 | HBA2 | Hemoglobin, α2 | −1.64 | 1.19E-03 | 451.63 |
| NM_001130861 | CLDN5 | Claudin 5 | −1.44 | 1.24E-03 | 458.33 |
| NM_001004688 | OR2M2 | Olfactory receptor,
family 2, subfamily M, member 2 | −1.59 | 1.24E-03 | 458.57 |
| NM_001030004 | HNF4A | Hepatocyte nuclear
factor 4, α | −1.56 | 1.26E-03 | 460.62 |
| NM_001033952 | CALCA | Calcitonin-related
polypeptide α | −1.54 | 1.26E-03 | 461.21 |
| NM_001010870 | TDRD6 | Tudor domain
containing 6 | −1.58 | 1.32E-03 | 466.23 |
| NM_001018025 | MTCP1 | Mature T cell
proliferation 1 | −1.57 | 1.41E-03 | 475.20 |
| NM_001012967 | DDX60L | DEAD
(Asp-Glu-Ala-Asp) box polypeptide 60-like | −1.57 | 1.41E-03 | 475.20 |
| NM_001085 | SERPINA3 | Serpin peptidase
inhibitor, clade A (α-1 antiproteinase, antitrypsin), member 3 | −1.49 | 1.42E-03 | 476.63 |
| NM_000633 | BCL2 | B-cell CLL/lymphoma
2 | −1.63 | 1.45E-03 | 479.53 |
| NM_001037666 | GATSL3 | GATS protein-like
3 | −1.52 | 1.52E-03 | 486.52 |
| NM_001165 | BIRC3 | Baculoviral IAP
repeat containing 3 | −1.42 | 1.58E-03 | 491.86 |
| NM_002247 | KCNMA1 | Potassium large
conductance calcium-activated channel, subfamily M, α member 1 | −1.33 | 1.94E-03 | 521.16 |
| NM_173625 | C17ORF78 | Chromosome 17 open
reading frame 78 | −1.01 | 1.95E-03 | 521.61 |
| NM_001124759 | FRG2C | FSHD region gene 2
family, member C | −1.44 | 2.00E-03 | 524.95 |
| NM_001080453 | INTS1 | Integrator complex
subunit 1 | −1.51 | 2.00E-03 | 524.88 |
| NM_004613 | TGM2 | Transglutaminase 2
(C polypeptide, protein-glutamine-γ-glutamyltransferase) | −1.24 | 2.14E-03 | 536.10 |
| NM_001044392 | MUC1 | Mucin 1, cell
surface-associated | −1.51 | 2.31E-03 | 548.26 |
| NM_001195127 | WI2-2373I1.2 | Forkhead box
L1-like | −1.39 | 2.41E-03 | 556.59 |
| NM_001243042 | HLA-C | Major
histocompatibility complex, class I, C | −1.38 | 2.43E-03 | 558.50 |
| NM_001083602 | PTCH1 | Patched 1 | −1.49 | 2.58E-03 | 570.46 |
| NM_207352 | CYP4V2 | Cytochrome P450,
family 4, subfamily V, polypeptide 2 | −0.86 | 2.71E-03 | 579.03 |
| NR_029392 | KRT16P2 | Keratin 16
pseudogene 2 | −0.54 | 2.97E-03 | 594.00 |
| NM_001172646 | PLCB4 | Phospholipase C,
β4 | −1.39 | 3.03E-03 | 598.52 |
| NM_002089 | CXCL2 | Chemokine (C-X-C
motif) ligand 2 | −1.34 | 3.39E-03 | 620.43 |
| NM_001496 | GFRA3 | GDNF family
receptor α3 | −1.38 | 3.40E-03 | 620.75 |
| NM_001668 | ARNT | Aryl hydrocarbon
receptor nuclear translocator | −1.37 | 3.42E-03 | 622.12 |
| NM_021151 | CROT | Carnitine
O-octanoyltransferase | −1.18 | 3.47E-03 | 624.70 |
| NM_001949 | E2F3 | E2F transcription
factor 3 | −1.36 | 3.53E-03 | 628.70 |
| NM_002307 | LGALS7 | Lectin,
galactoside-binding, soluble, 7 | −1.32 | 3.56E-03 | 630.07 |
| NM_001704 | BAI3 | Brain-specific
angiogenesis inhibitor 3 | −1.37 | 3.57E-03 | 630.78 |
| NM_001978 | DMTN | Erythrocyte
membrane protein band 4.9 (dematin) | −1.35 | 3.62E-03 | 633.47 |
| NM_183001 | SHC1 | SHC (Src homology 2
domain containing) transforming protein 1 | −0.90 | 3.64E-03 | 634.32 |
| NM_001185156 | IL24 | Interleukin 24 | −1.39 | 3.71E-03 | 637.18 |
| NM_004048 | B2M |
β-2-microglobulin | −1.27 | 3.73E-03 | 637.88 |
| NM_001004456 | OR1M1 | Olfactory receptor,
family 1, subfamily M, member 1 | −1.60 | 3.85E-03 | 644.36 |
| NM_002133 | HMOX1 | Heme oxygenase
(decycling) 1 | −1.33 | 3.97E-03 | 649.35 |
| NM_002457 | MUC2 | Mucin 2, oligomeric
mucus/gel-forming | −1.31 | 4.02E-03 | 651.72 |
| NM_001198 | PRDM1 | PR domain
containing 1, with ZNF domain | −1.39 | 4.05E-03 | 653.14 |
| NM_001136022 | NFATC4 | Nuclear factor of
activated T cells, cytoplasmic, calcineurin-dependent 4 | −1.43 | 4.06E-03 | 653.68 |
| NM_001454 | FOXJ1 | Horkhead box
J1 | −1.38 | 4.11E-03 | 656.34 |
| NM_002006 | FGF2 | Fibroblast growth
factor 2 (basic) | −1.35 | 4.11E-03 | 656.64 |
| NM_177996 | EPB41L1 | Erythrocyte
membrane protein band 4.1-like 1 | −0.97 | 4.19E-03 | 659.94 |
| NM_004417 | DUSP1 | Dual specificity
phosphatase 1 | −1.25 | 4.38E-03 | 669.42 |
| NM_201282 | EGFR | Epidermal growth
factor receptor | −0.88 | 4.53E-03 | 676.59 |
| NM_004416 | DTX1 | Deltex homolog 1
(Drosophila) | −1.25 | 4.68E-03 | 682.88 |
| NM_003128 | SPTBN1 | Spectrin, β,
non-erythrocytic 1 | −1.29 | 4.75E-03 | 685.70 |
| NM_001807 | CEL | Carboxyl ester
lipase (bile salt-stimulated lipase) | −1.36 | 4.94E-03 | 693.06 |
| NM_207336 | ZNF467 | Zinc finger protein
467 | −0.86 | 4.95E-03 | 693.44 |
| NM_002381 | MATN3 | Matrilin 3 | −1.32 | 5.00E-03 | 695.99 |
| NM_002317 | LOX | Lysyl oxidase | −1.32 | 5.00E-03 | 696.01 |
| NM_024766 | CAMKMT | Calmodulin-lysine
N-methyltransferase | −1.15 | 5.07E-03 | 699.15 |
| NM_003667 | LGR5 | Leucine-rich repeat
containing G protein-coupled receptor 5 | −1.29 | 5.27E-03 | 707.84 |
| NM_002535 | OAS2 |
2′-5′-Oligoadenylate synthetase 2, 69/71
kDa | −1.30 | 5.27E-03 | 708.15 |
| NM_145041 | TMEM106A | Transmembrane
protein 106A | −1.10 | 5.27E-03 | 708.30 |
| NM_003061 | SLIT1 | Slit homolog 1
(Drosophila) | −1.30 | 5.36E-03 | 711.28 |
| NM_013292 | MYLPF | Myosin light chain,
phosphorylatable, fast skeletal muscle | −1.21 | 5.40E-03 | 712.71 |
| NM_004310 | RHOH | Ras homolog gene
family, member H | −1.26 | 5.55E-03 | 719.34 |
| NM_002483 | CEACAM6 | Carcinoembryonic
antigen-related cell adhesion molecule 6 | −1.30 | 5.71E-03 | 725.32 |
| NM_005531 | IFI16 | Interferon,
γ-inducible protein 16 | −1.23 | 5.87E-03 | 732.01 |
| NM_133471 | PPP1R18 | Protein phosphatase
1, regulatory subunit 18 | −1.13 | 5.88E-03 | 732.45 |
| NM_006398 | UBD | Ubiquitin D | −1.22 | 5.89E-03 | 732.86 |
| NM_004994 | MMP9 | Matrix
metallopeptidase 9 (gelatinase B, 92 kDa gelatinase, 92 kDa type IV
collagenase) | −1.24 | 5.90E-03 | 733.00 |
| NR_003531 | MEG3 | Maternally
expressed 3 (non-protein coding) | −0.79 | 5.98E-03 | 736.40 |
| NM_012171 | TSPAN17 | Tetraspanin 17 | −1.22 | 6.10E-03 | 741.06 |
| NM_032599 | FAM71F1 | Family with
sequence similarity 71, member F1 | −1.14 | 6.13E-03 | 742.39 |
| NM_019074 | DLL4 | δ-like 4
(Drosophila) | −1.19 | 6.16E-03 | 743.53 |
| NM_002405 | MFNG | MFNG
O-fucosylpeptide 3-β-N-acetylglucosaminyltransferase | −1.31 | 6.30E-03 | 749.05 |
| NM_015000 | STK38L | Serine/threonine
kinase 38-like | −1.21 | 6.32E-03 | 750.10 |
| NM_018416 | FOXJ2 | Forkhead box
J2 | −1.20 | 6.36E-03 | 751.65 |
| NM_016135 | ETV7 | Ets variant 7 | −1.21 | 6.38E-03 | 752.29 |
| NM_015886 | PI15 | Peptidase inhibitor
15 | −1.21 | 6.39E-03 | 752.62 |
| NM_002543 | OLR1 | Oxidized low
density lipoprotein (lectin-like) receptor 1 | −1.30 | 6.40E-03 | 752.88 |
| NM_005023 | PGGT1B | Protein
geranylgeranyltransferase type I, β-subunit | −1.24 | 6.53E-03 | 757.78 |
| NM_172390 | NFATC1 | Nuclear factor of
activated T cells, cytoplasmic, calcineurin-dependent 1 | −1.02 | 6.57E-03 | 759.52 |
| NM_017766 | CASZ1 | Castor zinc finger
1 | −1.20 | 6.78E-03 | 767.06 |
| NM_144633 | KCNH8 | Potassium
voltage-gated channel, subfamily H (eag-related), member 8 | −1.12 | 6.86E-03 | 770.19 |
| NM_025125 | TMEM254 | Chromosome 10 open
reading frame 57 | −1.14 | 6.87E-03 | 770.43 |
| NM_182909 | FILIP1L | Filamin A
interacting protein 1-like | −0.92 | 6.89E-03 | 771.28 |
| NM_173503 | EFCAB3 | EF-hand calcium
binding domain 3 | −1.02 | 6.92E-03 | 772.10 |
| NM_144673 | CMTM2 | CKLF-like MARVEL
transmembrane domain containing 2 | −1.12 | 6.95E-03 | 773.54 |
| NM_021819 | LMAN1L | Lectin,
mannose-binding, 1-like | −1.17 | 6.95E-03 | 773.62 |
| NM_022804 | SNURF | SNRPN upstream
reading frame | −1.16 | 6.99E-03 | 775.02 |
| NM_021633 | KLHL12 | Kelch-like 12
(Drosophila) | −1.17 | 7.01E-03 | 775.60 |
| NM_021966 | TCL1A | T cell
leukemia/lymphoma 1A | −1.16 | 7.23E-03 | 782.50 |
| NM_032637 | SKP2 | S phase
kinase-associated protein 2 (p45) | −1.14 | 7.27E-03 | 784.16 |
| NM_022648 | TNS1 | Tensin 1 | −1.16 | 7.32E-03 | 785.88 |
| NM_004213 | SLC28A1 | Solute carrier
family 28 (sodium-coupled nucleoside transporter), member 1 | −1.27 | 7.46E-03 | 790.45 |
| NM_033088 | STRIP1 | Family with
sequence similarity 40, member A | −1.14 | 7.49E-03 | 791.43 |
| NM_022304 | HRH2 | Histamine receptor
H2 | −1.16 | 7.62E-03 | 796.01 |
| NM_021105 | PLSCR1 | Phospholipid
scramblase 1 | −1.18 | 7.65E-03 | 797.28 |
| NM_024768 | EFCC1 | Coiled-coil domain
containing 48 | −1.15 | 7.66E-03 | 797.48 |
| NM_006290 | TNFAIP3 | Tumor necrosis
factor, α-induced protein 3 | −1.22 | 7.68E-03 | 798.22 |
| NM_030639 | BHLHB9 | Basic
helix-loop-helix domain containing, class B, 9 | −1.14 | 7.69E-03 | 798.53 |
| NM_004246 | GLP2R | Glucagon-like
peptide 2 receptor | −1.26 | 7.79E-03 | 802.00 |
| NM_032873 | UBASH3B |
Ubiquitin-associated and SH3 domain
containing B | −1.14 | 7.79E-03 | 802.14 |
| NM_001963 | EGF | Epidermal growth
factor | −1.35 | 7.84E-03 | 803.92 |
| NM_052904 | KLHL32 | Kelch-like 32
(Drosophila) | −1.13 | 7.89E-03 | 805.79 |
| NM_006125 | ARHGAP6 | Rho GTPase
activating protein 6 | −1.23 | 7.90E-03 | 806.11 |
| NM_032772 | ZNF503 | Zinc finger protein
503 | −1.14 | 7.95E-03 | 807.90 |
| NM_024886 | C10orf95 | Chromosome 10 open
reading frame 95 | −1.15 | 7.99E-03 | 809.09 |
| NM_152703 | SAMD9L | Sterile α motif
domain containing 9-like | −1.09 | 8.02E-03 | 809.77 |
| NM_032752 | ZNF496 | Zinc finger protein
496 | −1.14 | 8.03E-03 | 810.31 |
| NM_138456 | BATF2 | Basic leucine
zipper transcription factor, ATF-like 2 | −1.13 | 8.04E-03 | 810.45 |
| NM_172370 | DAOA | D-amino acid
oxidase activator | −1.04 | 8.07E-03 | 811.67 |
| NM_005747 | CELA3A | Chymotrypsin-like
elastase family, member 3A | −1.23 | 8.07E-03 | 811.75 |
| NM_033101 | LGALS12 | Lectin,
galactoside-binding, soluble, 12 | −1.14 | 8.14E-03 | 813.87 |
| NM_012224 | NEK1 | NIMA (never in
mitosis gene a)- related kinase 1 | −1.21 | 8.21E-03 | 816.40 |
| NM_020436 | SALL4 | Sal-like 4
(Drosophila) | −1.19 | 8.31E-03 | 819.74 |
| NM_138980 | MAPK10 | Mitogen-activated
protein kinase 10 | −1.13 | 8.34E-03 | 820.62 |
| NM_020896 | OSBPL5 | Oxysterol binding
protein-like 5 | −1.18 | 8.41E-03 | 822.84 |
| NM_052897 | MBD6 | Methyl-CpG binding
domain protein 6 | −1.14 | 8.52E-03 | 826.04 |
| NM_207419 | C1QTNF8 | C1q and tumor
necrosis factor related protein 8 | −0.82 | 8.58E-03 | 827.94 |
| NM_005933 | KMT2A | myeloid/lymphoid or
mixed-lineage leukemia (trithorax homolog, Drosophila) | −1.23 | 8.59E-03 | 828.40 |
| NM_181712 | KANK4 | KN motif and
ankyrin repeat domains 4 | −0.96 | 8.61E-03 | 828.96 |
| NM_017777 | MKS1 | Meckel syndrome,
type 1 | −1.20 | 8.61E-03 | 829.20 |
| NM_176677 | NHLRC4 | NHL repeat
containing 4 | −0.99 | 8.67E-03 | 831.05 |
| NM_025130 | HKDC1 | Hexokinase domain
containing 1 | −1.14 | 8.71E-03 | 832.53 |
| NM_017654 | SAMD9 | Sterile α motif
domain containing 9 | −1.21 | 8.92E-03 | 838.42 |
| NM_052864 | TIFA | TRAF-interacting
protein with forkhead-associated domain | −1.14 | 8.94E-03 | 838.99 |
| NM_015569 | DNM3 | Dynamin 3 | −1.21 | 8.95E-03 | 839.17 |
| NM_139047 | | Mitogen-activated
protein kinase 8 | −1.12 | 8.99E-03 | 840.70 |
| NM_207173 | NPSR1 | Neuropeptide S
receptor 1 | −0.87 | 9.03E-03 | 841.91 |
| NM_015444 | TMEM158 | Transmembrane
protein 158 (gene/pseudogene) | −1.21 | 9.03E-03 | 841.90 |
| NM_017523 | XAF1 | XIAP-associated
factor 1 | −1.21 | 9.10E-03 | 844.23 |
| NM_006931 | SLC2A3 | Solute carrier
family 2 (facilitated glucose transporter), member 3 | −1.22 | 9.11E-03 | 844.45 |
| NM_019018 | FAM105A | Family with
sequence similarity 105, member A | −1.19 | 9.13E-03 | 845.15 |
| NM_153042 | KDM1B | Lysine (K)-specific
demethylase 1B | −1.08 | 9.18E-03 | 846.40 |
| NM_033056 | PCDH15 |
Protocadherin-related 15 | −1.14 | 9.23E-03 | 848.31 |
| NM_014157 | CCDC113 | Coiled-coil domain
containing 113 | −1.21 | 9.25E-03 | 848.53 |
| NM_144962 | PEBP4 |
Phosphatidylethanolamine-binding protein
4 | −1.12 | 9.31E-03 | 850.61 |
| NM_145862 | CHEK2 | Checkpoint kinase
2 | −1.09 | 9.36E-03 | 852.29 |
| NM_182524 | ZNF595 | Zinc finger protein
595 | −0.93 | 9.41E-03 | 853.59 |
| NM_014858 | TMCC2 | Transmembrane and
coiled-coil domain family 2 | −1.21 | 9.46E-03 | 855.35 |
| NM_144990 | SLFNL1 | Schlafen-like
1 | −1.11 | 9.47E-03 | 855.60 |
| NM_022147 | RTP4 | Receptor
(chemosensory) transporter protein 4 | −1.16 | 9.49E-03 | 856.25 |
| NM_022873 | IFI6 | Interferon,
α-inducible protein 6 | −1.16 | 9.73E-03 | 863.03 |
| NM_152685 | SLC23A1 | Solute carrier
family 23 (nucleobase transporters), member 1 | −1.09 | 9.73E-03 | 863.10 |
| NM_152278 | TCEAL7 | Transcription
elongation factor A (SII)-like 7 | −1.09 | 9.84E-03 | 866.45 |
| NM_019035 | PCDH18 | Protocadherin
18 | −1.19 | 9.95E-03 | 869.75 |
| NM_153183 | NUDT10 | Nudix (nucleoside
diphosphate linked moiety X)-type motif 10 | −1.07 | 9.99E-03 | 870.83 |
| Table III.Significant functional categories of
upregulated and downregulated genes. |
Table III.
Significant functional categories of
upregulated and downregulated genes.
| A, Upregulated
genes |
|---|
|
|---|
|
| P-value | Bonferroni | Benjamini | FDR |
|---|
| GO category |
|
|
|
|
| Cell
fate commitment | 7.2E-07 | 8.9E-04 | 8.9E-04 | 1.2E-03 |
|
Negative regulation of cell
differentiation | 2.9E-05 | 3.5E-02 | 1.2E-02 | 4.7E-02 |
|
Differentiation | 6.8E-05 | 1.7E-02 | 1.7E-02 | 8.8E-02 |
|
Developmental protein | 9.2E-05 | 2.4E-02 | 1.2E-02 | 1.2E-01 |
| Notch
signaling pathway | 1.0E-04 | 2.6E-02 | 8.7E-03 | 1.3E-01 |
|
Intestine | 2.4E-04 | 6.0E-02 | 1.5E-02 | 3.1E-01 |
| KEGG pathway |
|
|
|
|
| Notch
signaling pathway | 3.5E-05 | 2.7E-03 | 2.7E-03 | 3.7E-02 |
| B, Downregulated
genes |
| GO category |
|
|
|
|
|
Regulation of cell death | 5.9E-07 | 9.2E-04 | 4.6E-04 | 9.8E-04 |
|
Regulation of cell
proliferation | 1.8E-04 | 2.4E-01 | 1.9E-02 | 2.9E-01 |
|
Regulation of cell
migration | 2.0E-04 | 2.7E-01 | 1.9E-02 | 3.3E-01 |
| KEGG pathway |
|
|
|
|
|
Pathways in cancer | 1.9E-04 | 1.6E-02 | 1.6E-02 | 2.1E-01 |
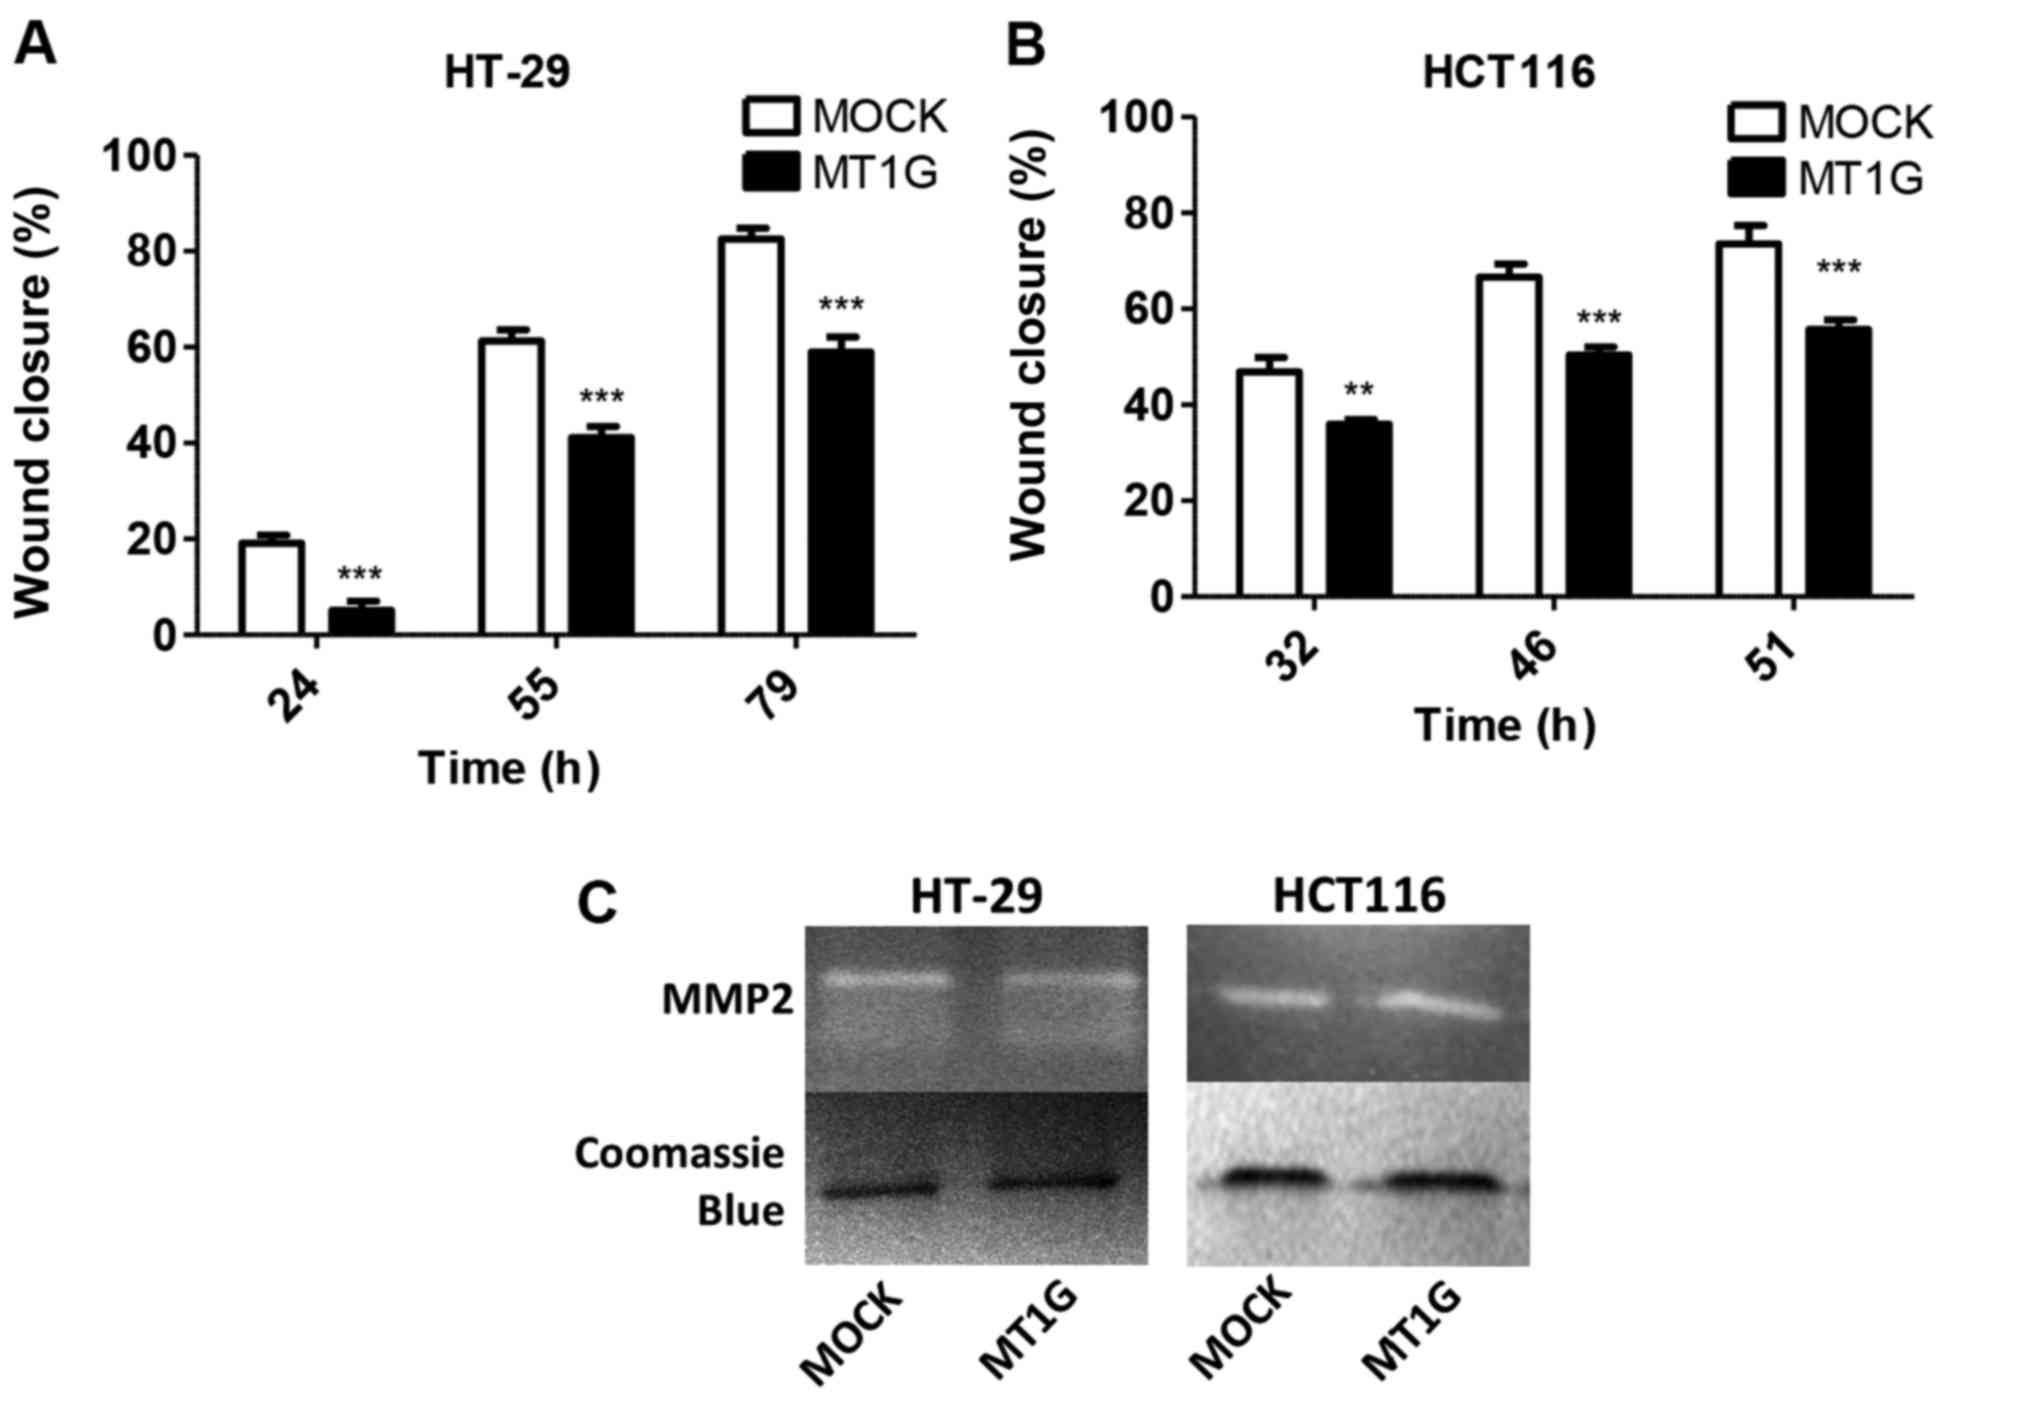
Given the finding of downregulated genes in the cell
migration category, we performed migration ‘scratch’ assays in the
HT-29 and HCT116 cell lines overexpressing MT1G, and found in both
cell lines a statistically significant reduction in migration rates
upon MT1G overexpression (Fig. 2A and
B). Gelatin zymography using conditioned media from these
cells, however, revealed no differences in MMP2 activity (Fig. 2C).
Next, in order to further investigate the
involvement of MT1G in the differentiation of HT-29 cells, we used
two different and well-known cell culture conditions to stimulate
the in vitro differentiation of these cells: sodium butyrate
(BUT) treatment (19) and
post-confluent cell growth (20).
We used TFF3 and MUC2 mRNA expression as surrogate
markers for the goblet cell lineage, and HSI and CA1
mRNAs, along with enzymatic alkaline-phosphatase activity (ALP) for
enterocytes.
Involvement of MT1G in
butyrate-mediated differentiation of HT-29 cells
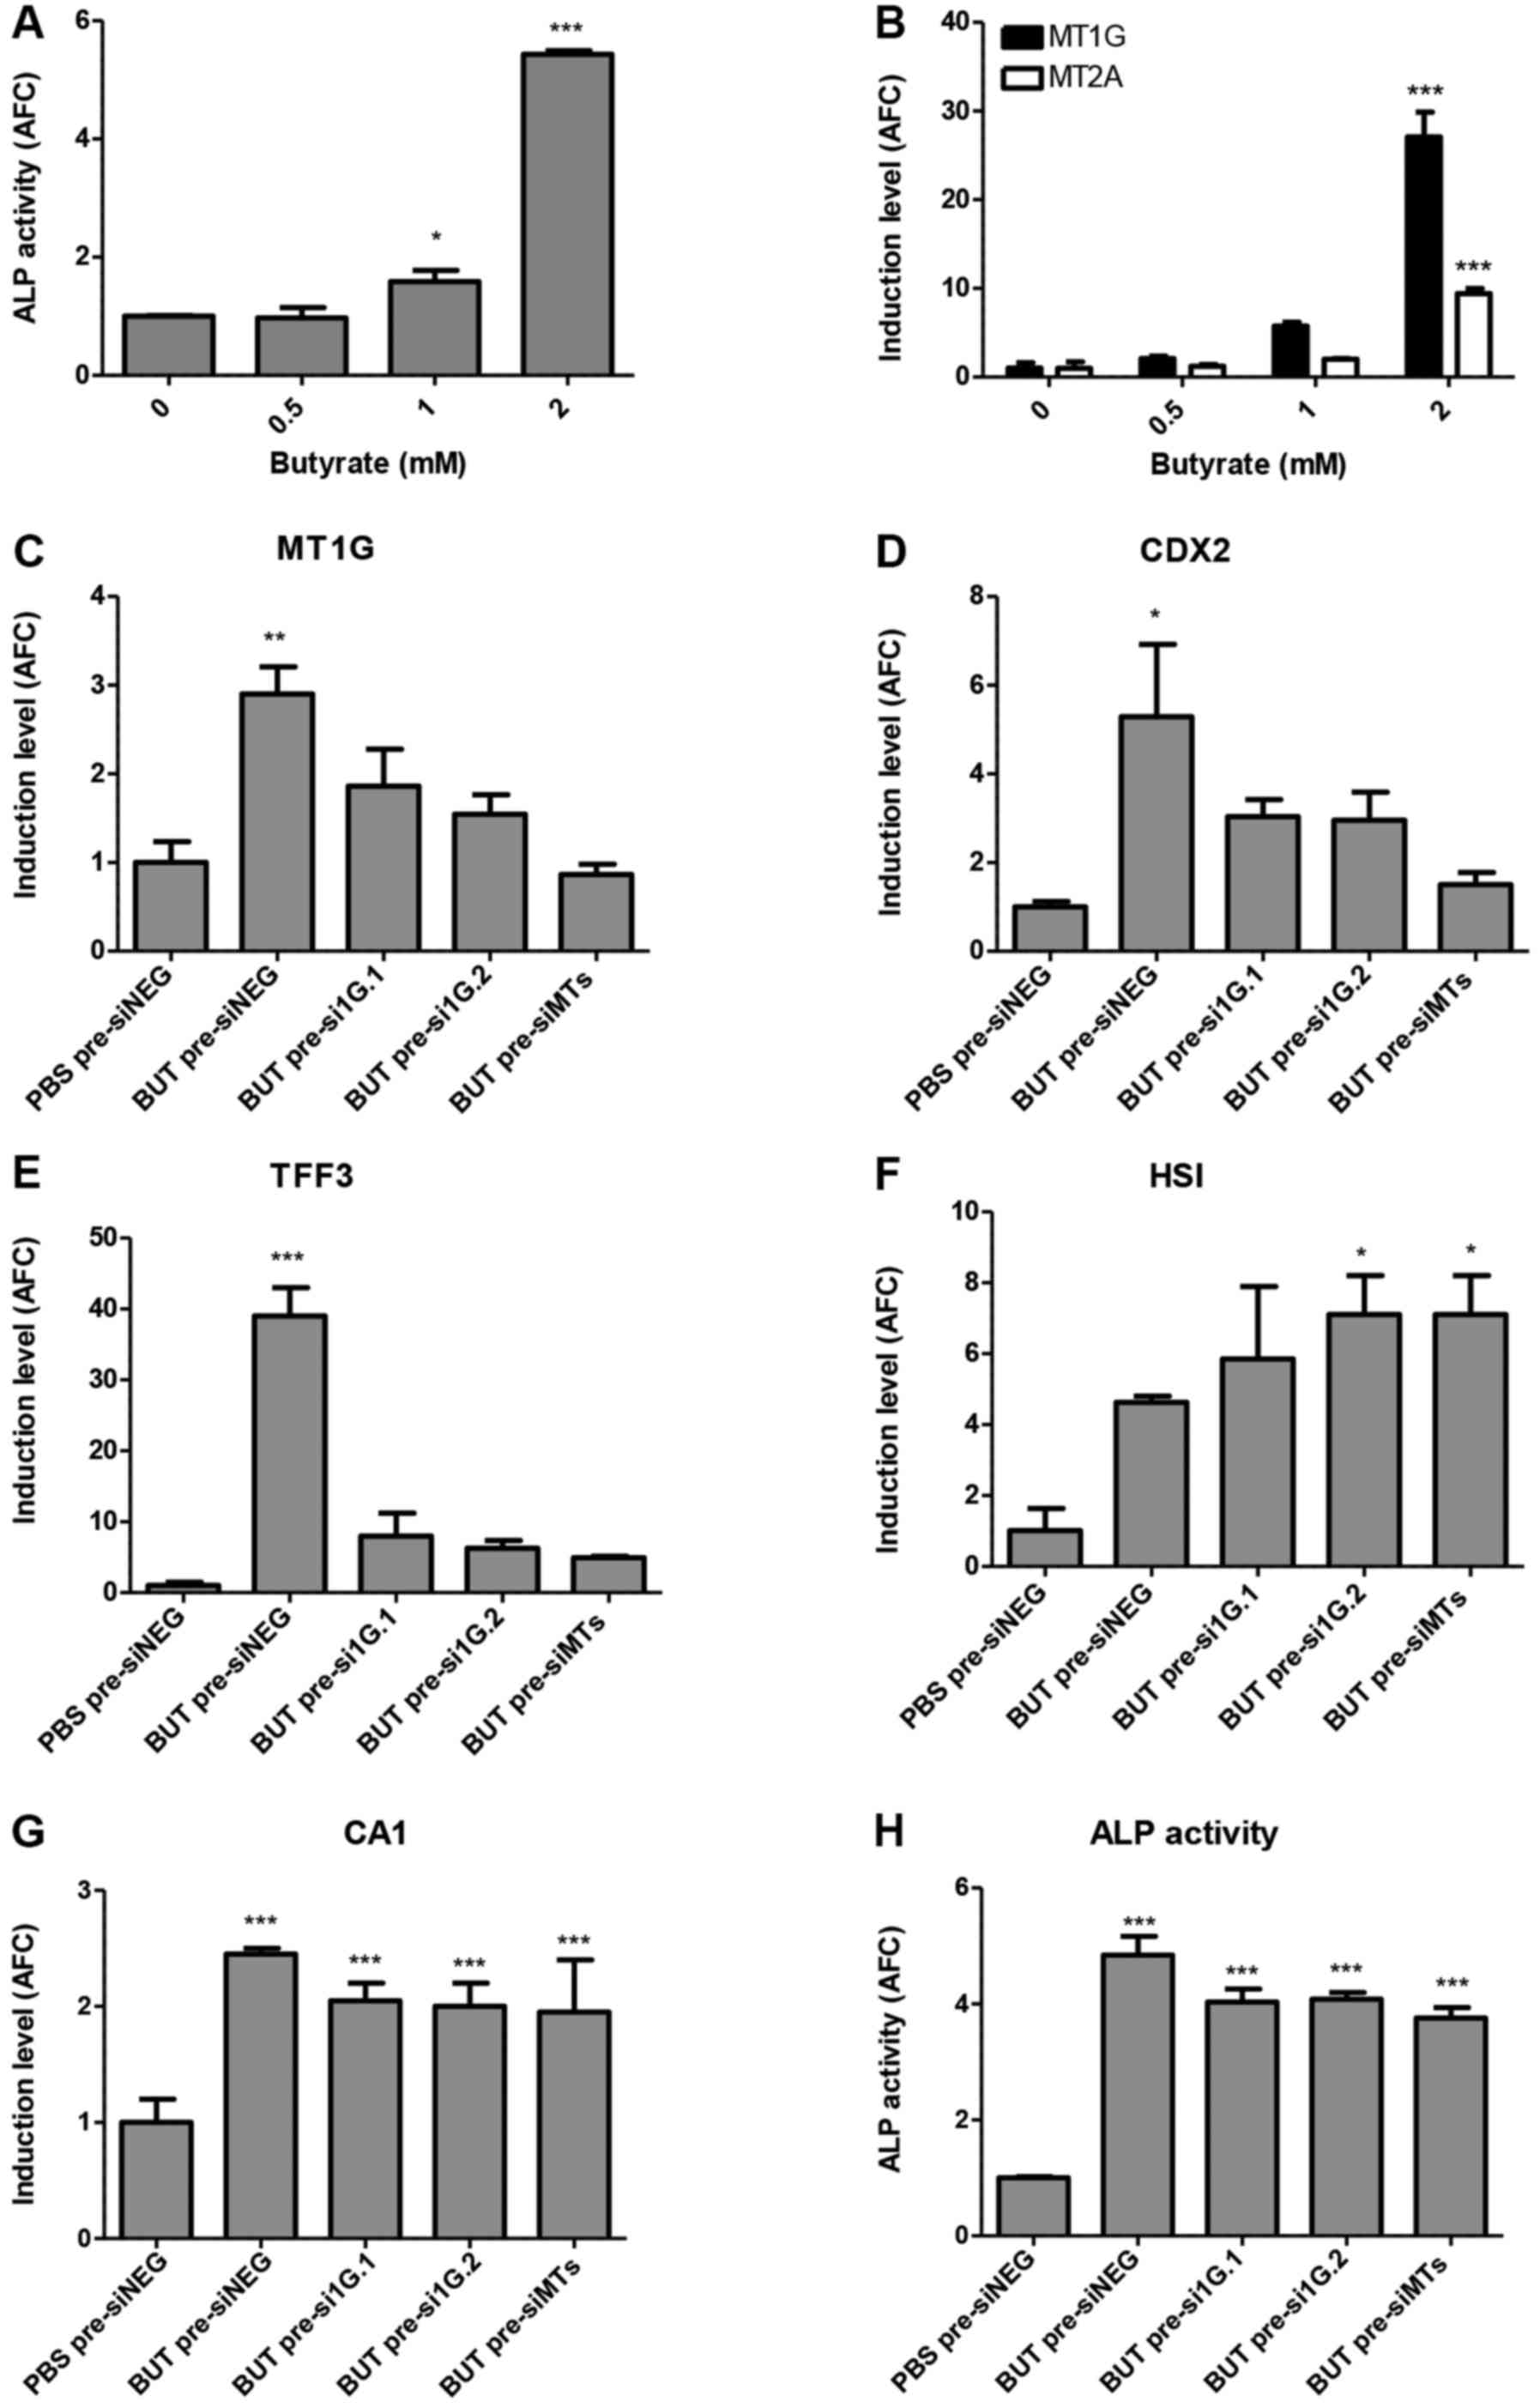
Sodium butyrate is a well-known inducer of
differentiation in CRC cell lines (21), and indeed, as shown in Fig. 3A, treatment with this agent
dose-dependently induced differentiation as assessed by ALP
activity. Concordantly, this agent also induced MT1G and
MT2A mRNA levels, in close correlation to ALP activity
(Pearson r=0.993, p=0.007 for MT1G and r=0.999, p=0.0006 for
MT2A; Fig. 3B). To determine
whether the induction of MTs has a functional role in
butyrate-induced differentiation, we used siRNAs to inhibit the
induction of only MT1G (si1G.1 and si1G.2) or of all MT1 and
MT2 isoforms (siMTs), as previously described (12). Fig.
3C shows that siRNA pre-treatment partially mitigated
MT1G induction after BUT treatment and markedly, also
diminished the induction of CDX2 (Fig. 3D), and of goblet-cell marker
TFF3 (Fig. 3E). Notably, BUT
treatment had no effect on mRNA levels of MUC2, as has been
previously reported by others (17)
(data not shown). In contrast, although the enterocyte-specific
markers HSI and CA1 were markedly upregulated at 2 mM
BUT, silencing of MTs had no effect on their induction (Fig. 3F and G), or on the cell-cycle arrest
mediator CDKN1A/p21 (data not shown), whereas ALP activity
was only slightly, but significantly reduced (Fig. 3H).
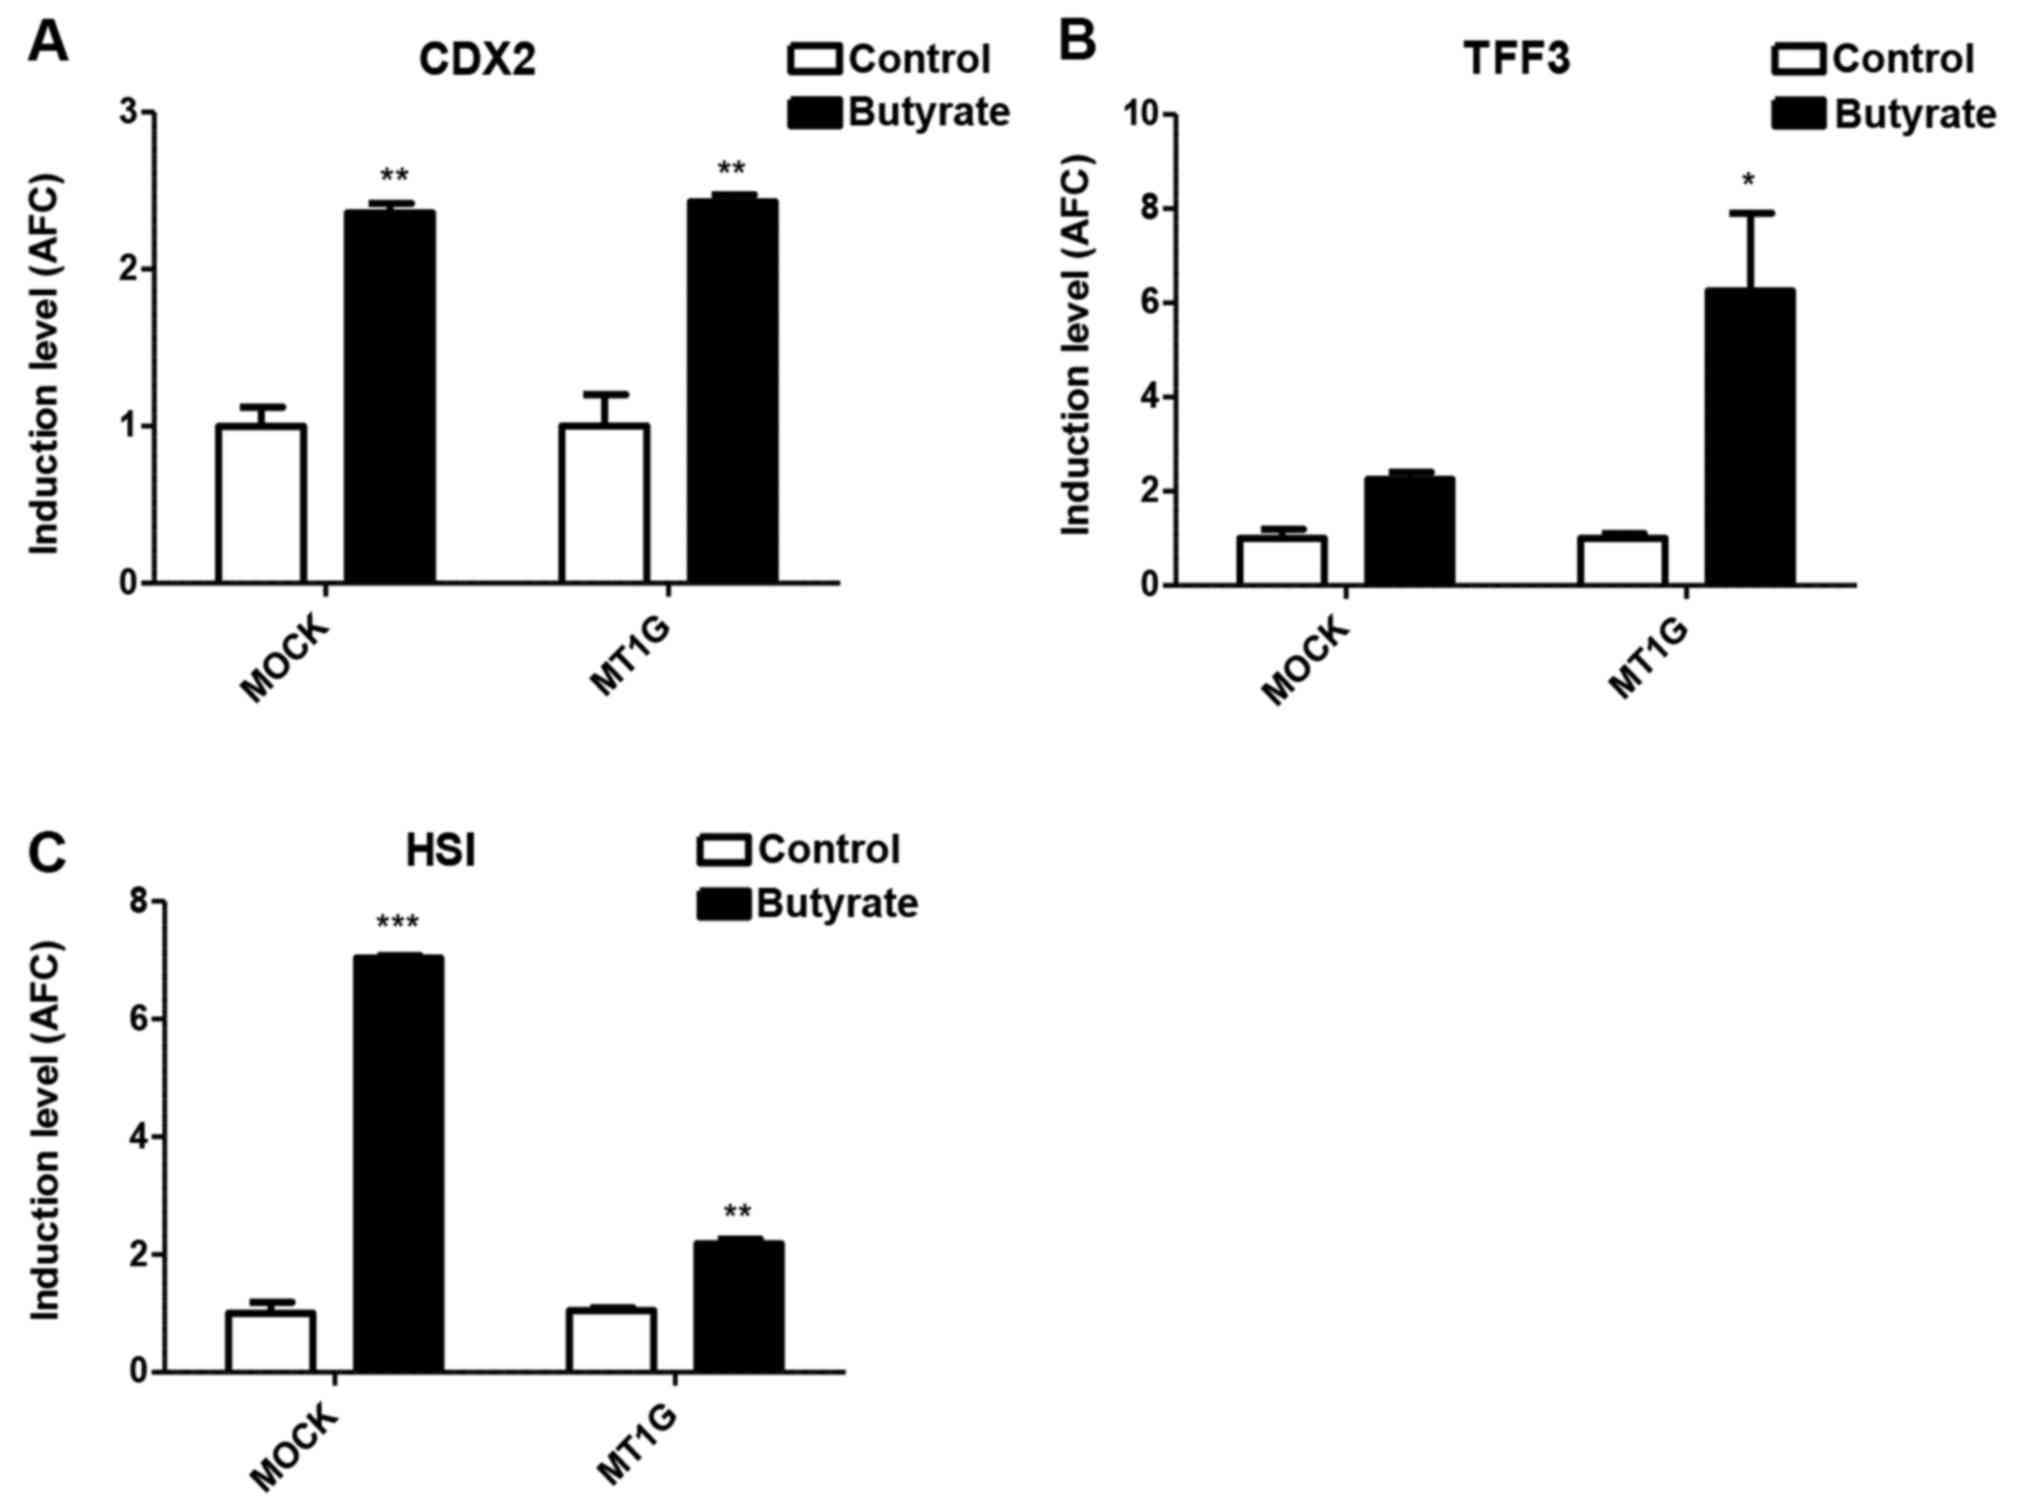
We next treated HT-29 MOCK and MT1G+
cells with butyrate. Notably, as depicted in Fig. 4A, whereas CDX2 mRNA levels
were similarly induced, MT1G overexpression markedly enhanced the
induction of TFF3 (Fig. 4B),
whereas it blunted that of HSI (Fig. 4C). Therefore, both silencing and
overexpression of MT1G support the hypothesis that this gene favors
goblet over enterocyte differentiation upon butyrate treatment of
HT-29 cells.
Involvement of MT1G in post-confluent
differentiation of HT-29 cells
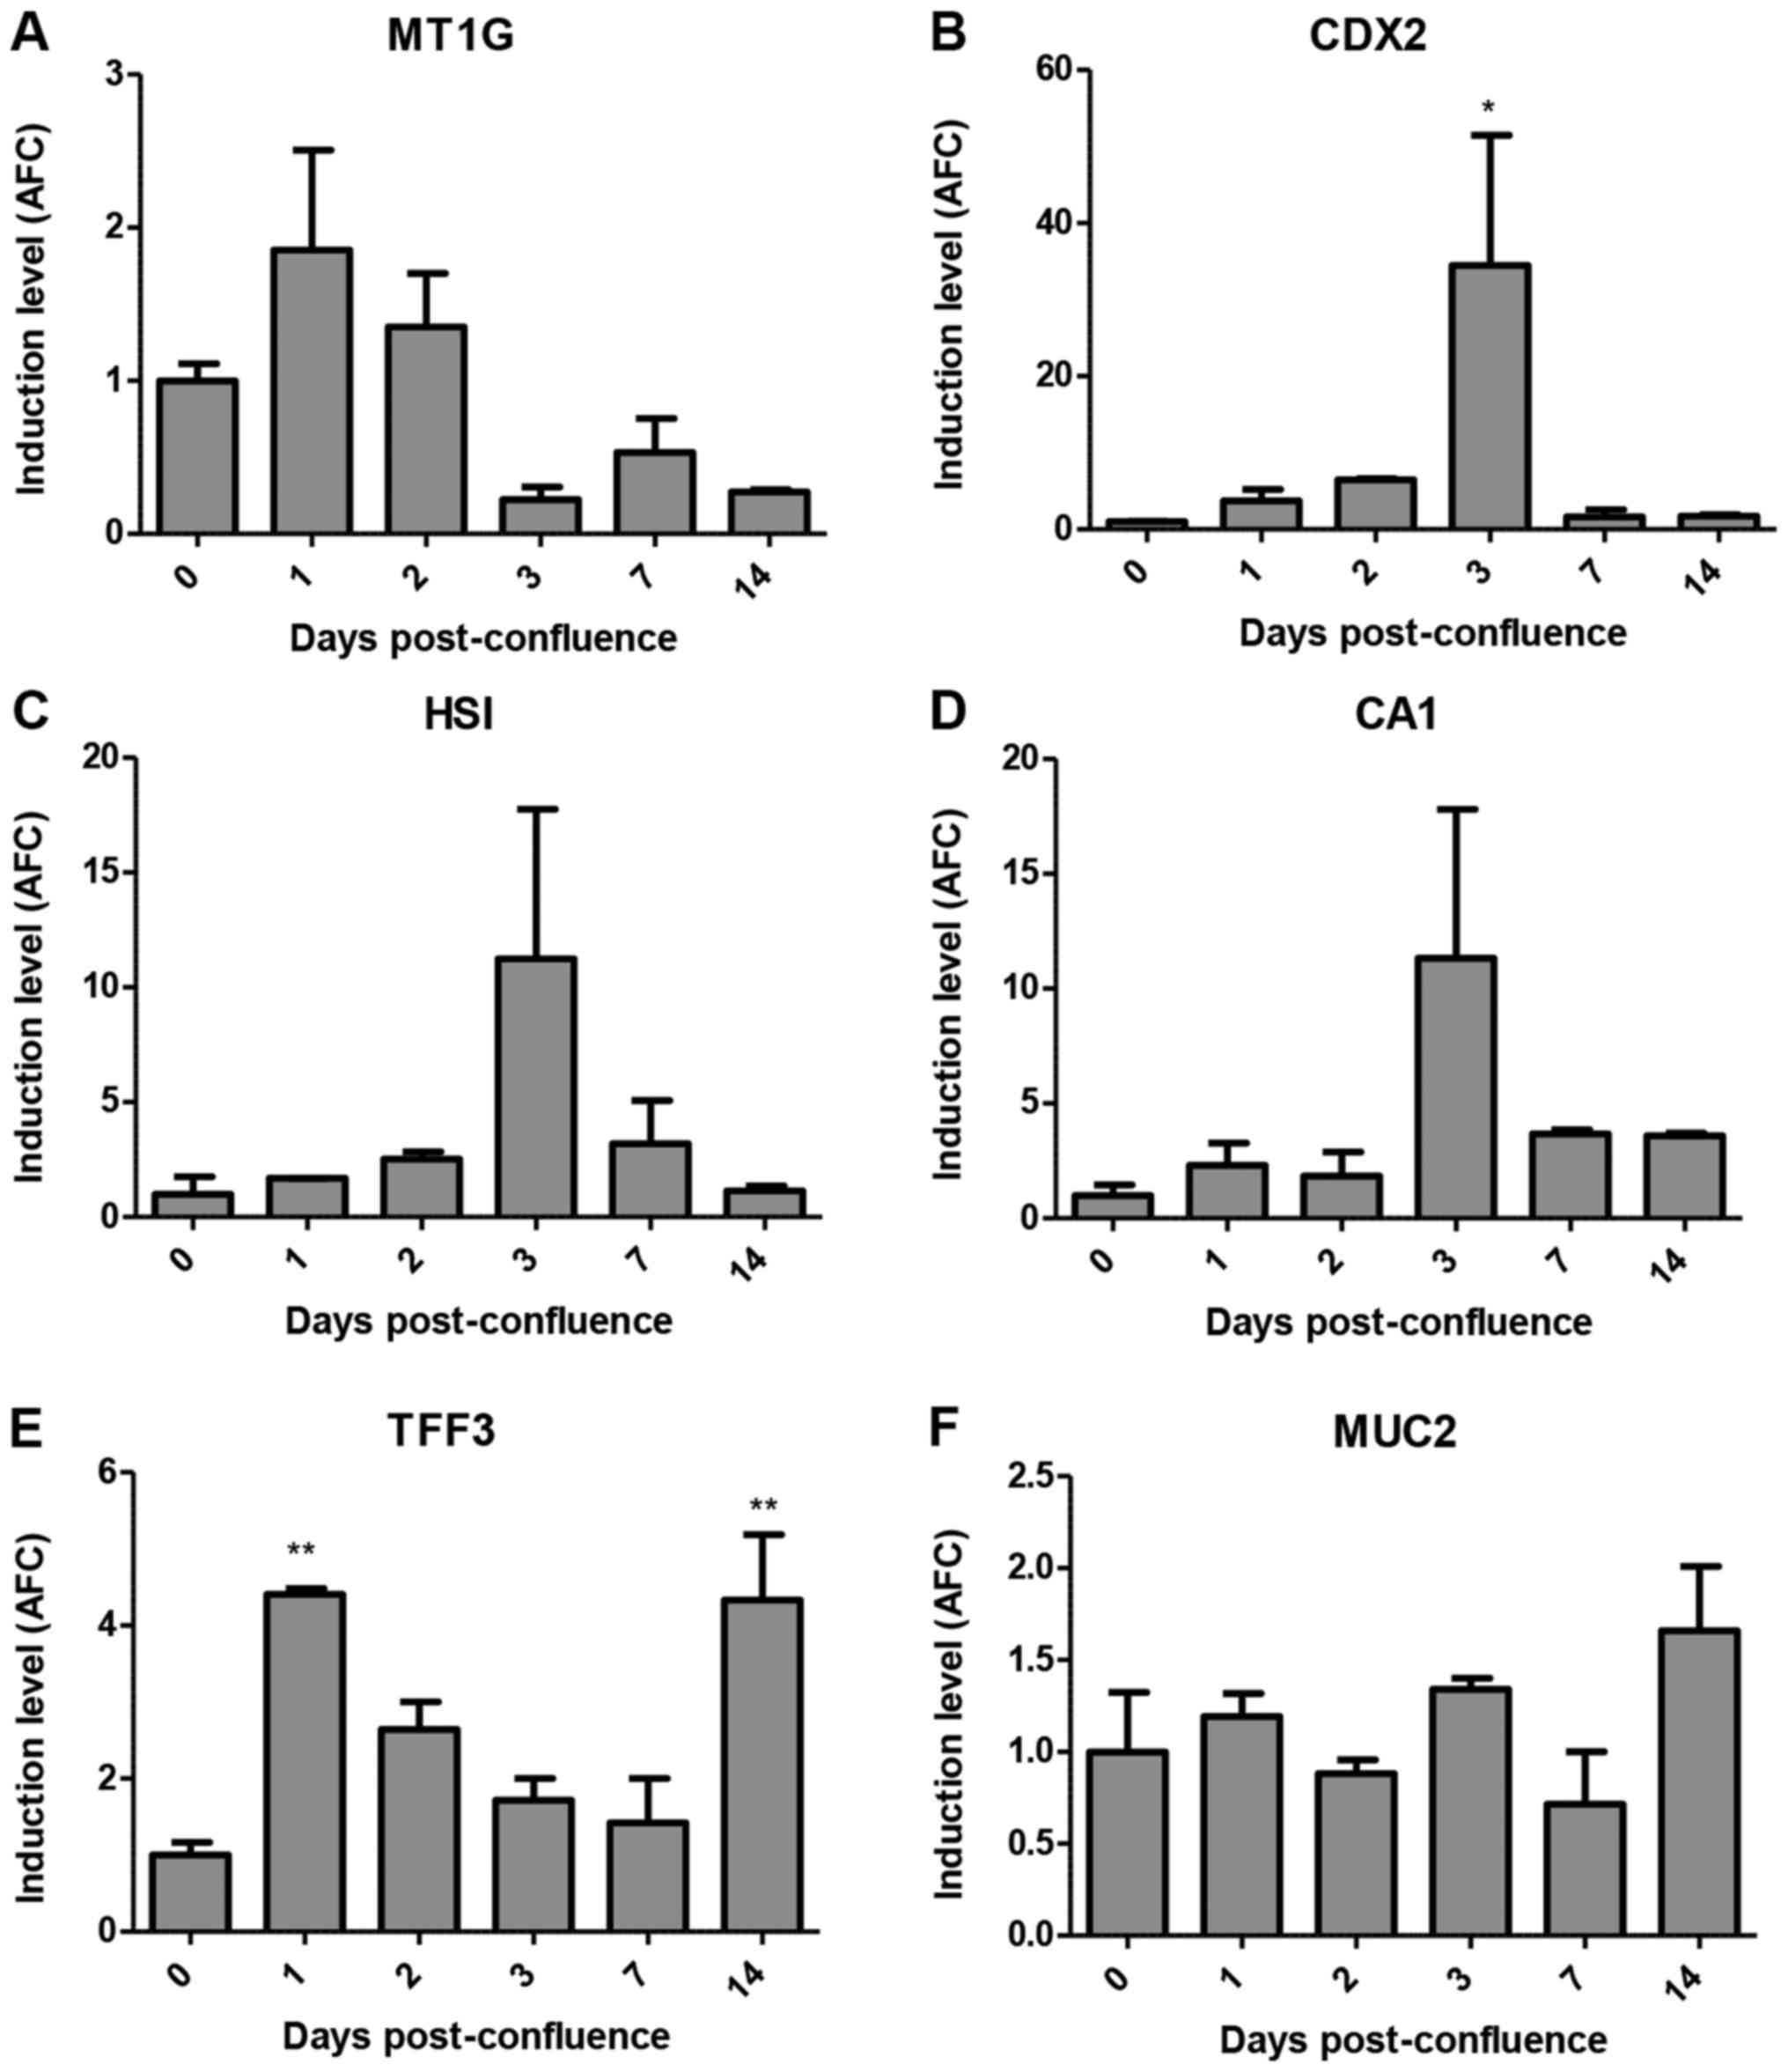
Next, we studied the expression of MT1G in the
post-confluent growth of HT-29 cells, where this cell line is known
to differentiate poorly (20). In
this setting, MT1G mRNA was transiently induced at day 1
post-confluence, after which its expression was significantly
reduced (Fig. 5A). In contrast,
CDX2 and enterocyte-specific genes HSI and CA1
were transiently induced at day 3, two days after MT1G
induction (Fig. 5B-D). Notably,
TFF3 expression mirrors MT1G expression, until day 14
when it is induced again (Fig. 5E).
These time-course analyses again favored the association of MT1G
induction with goblet over enterocyte differentiation. Notably, as
with BUT treatment, MUC2 expression was not altered in this
context (Fig. 5F). We were unable
to perform siRNA-mediated silencing of MT1G in this setting, as
cells did not survive in a totally confluent state for >1 day
after transfection.
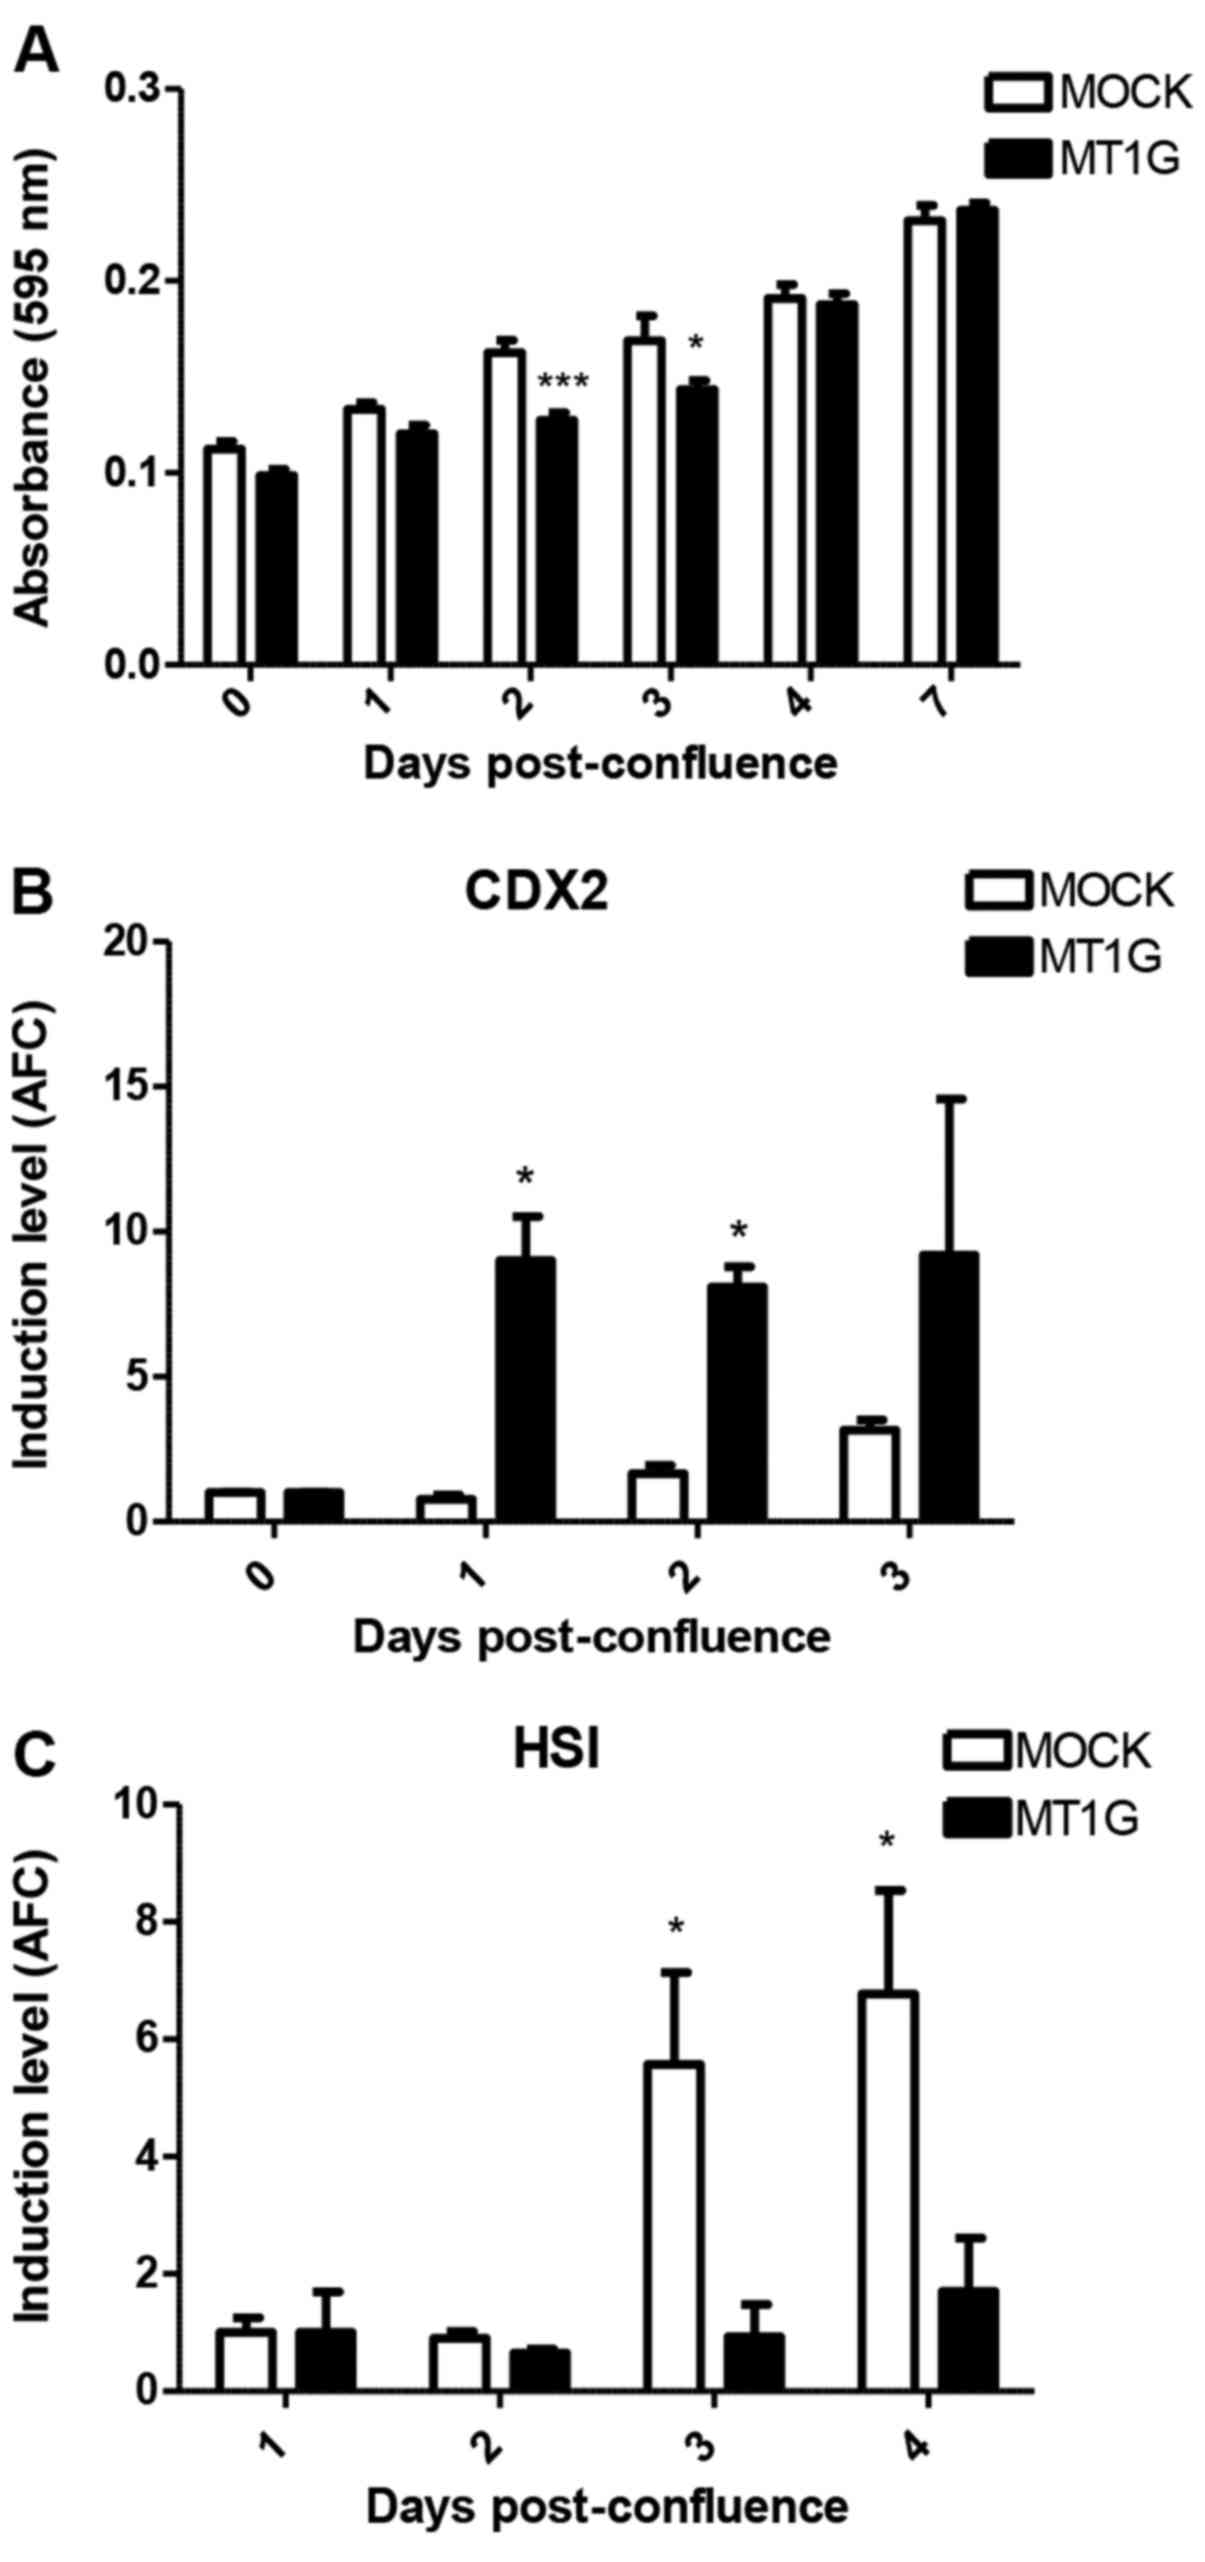
When growing HT-29 MOCK and MT1G+ cells
post-confluence, we noted no difference in the induction of ALP
activity between these two cell lines (Fig. 6A). Notably however, in the latter,
CDX2 mRNA was induced at significantly higher levels
(Fig. 6B) whereas HSI
induction was abolished (Fig. 6C).
While we noted no differences in the induction of TFF3 mRNA
(data not shown), our data also implies a role for MT1G expression
in counteracting enterocyte differentiation of HT-29 cells.
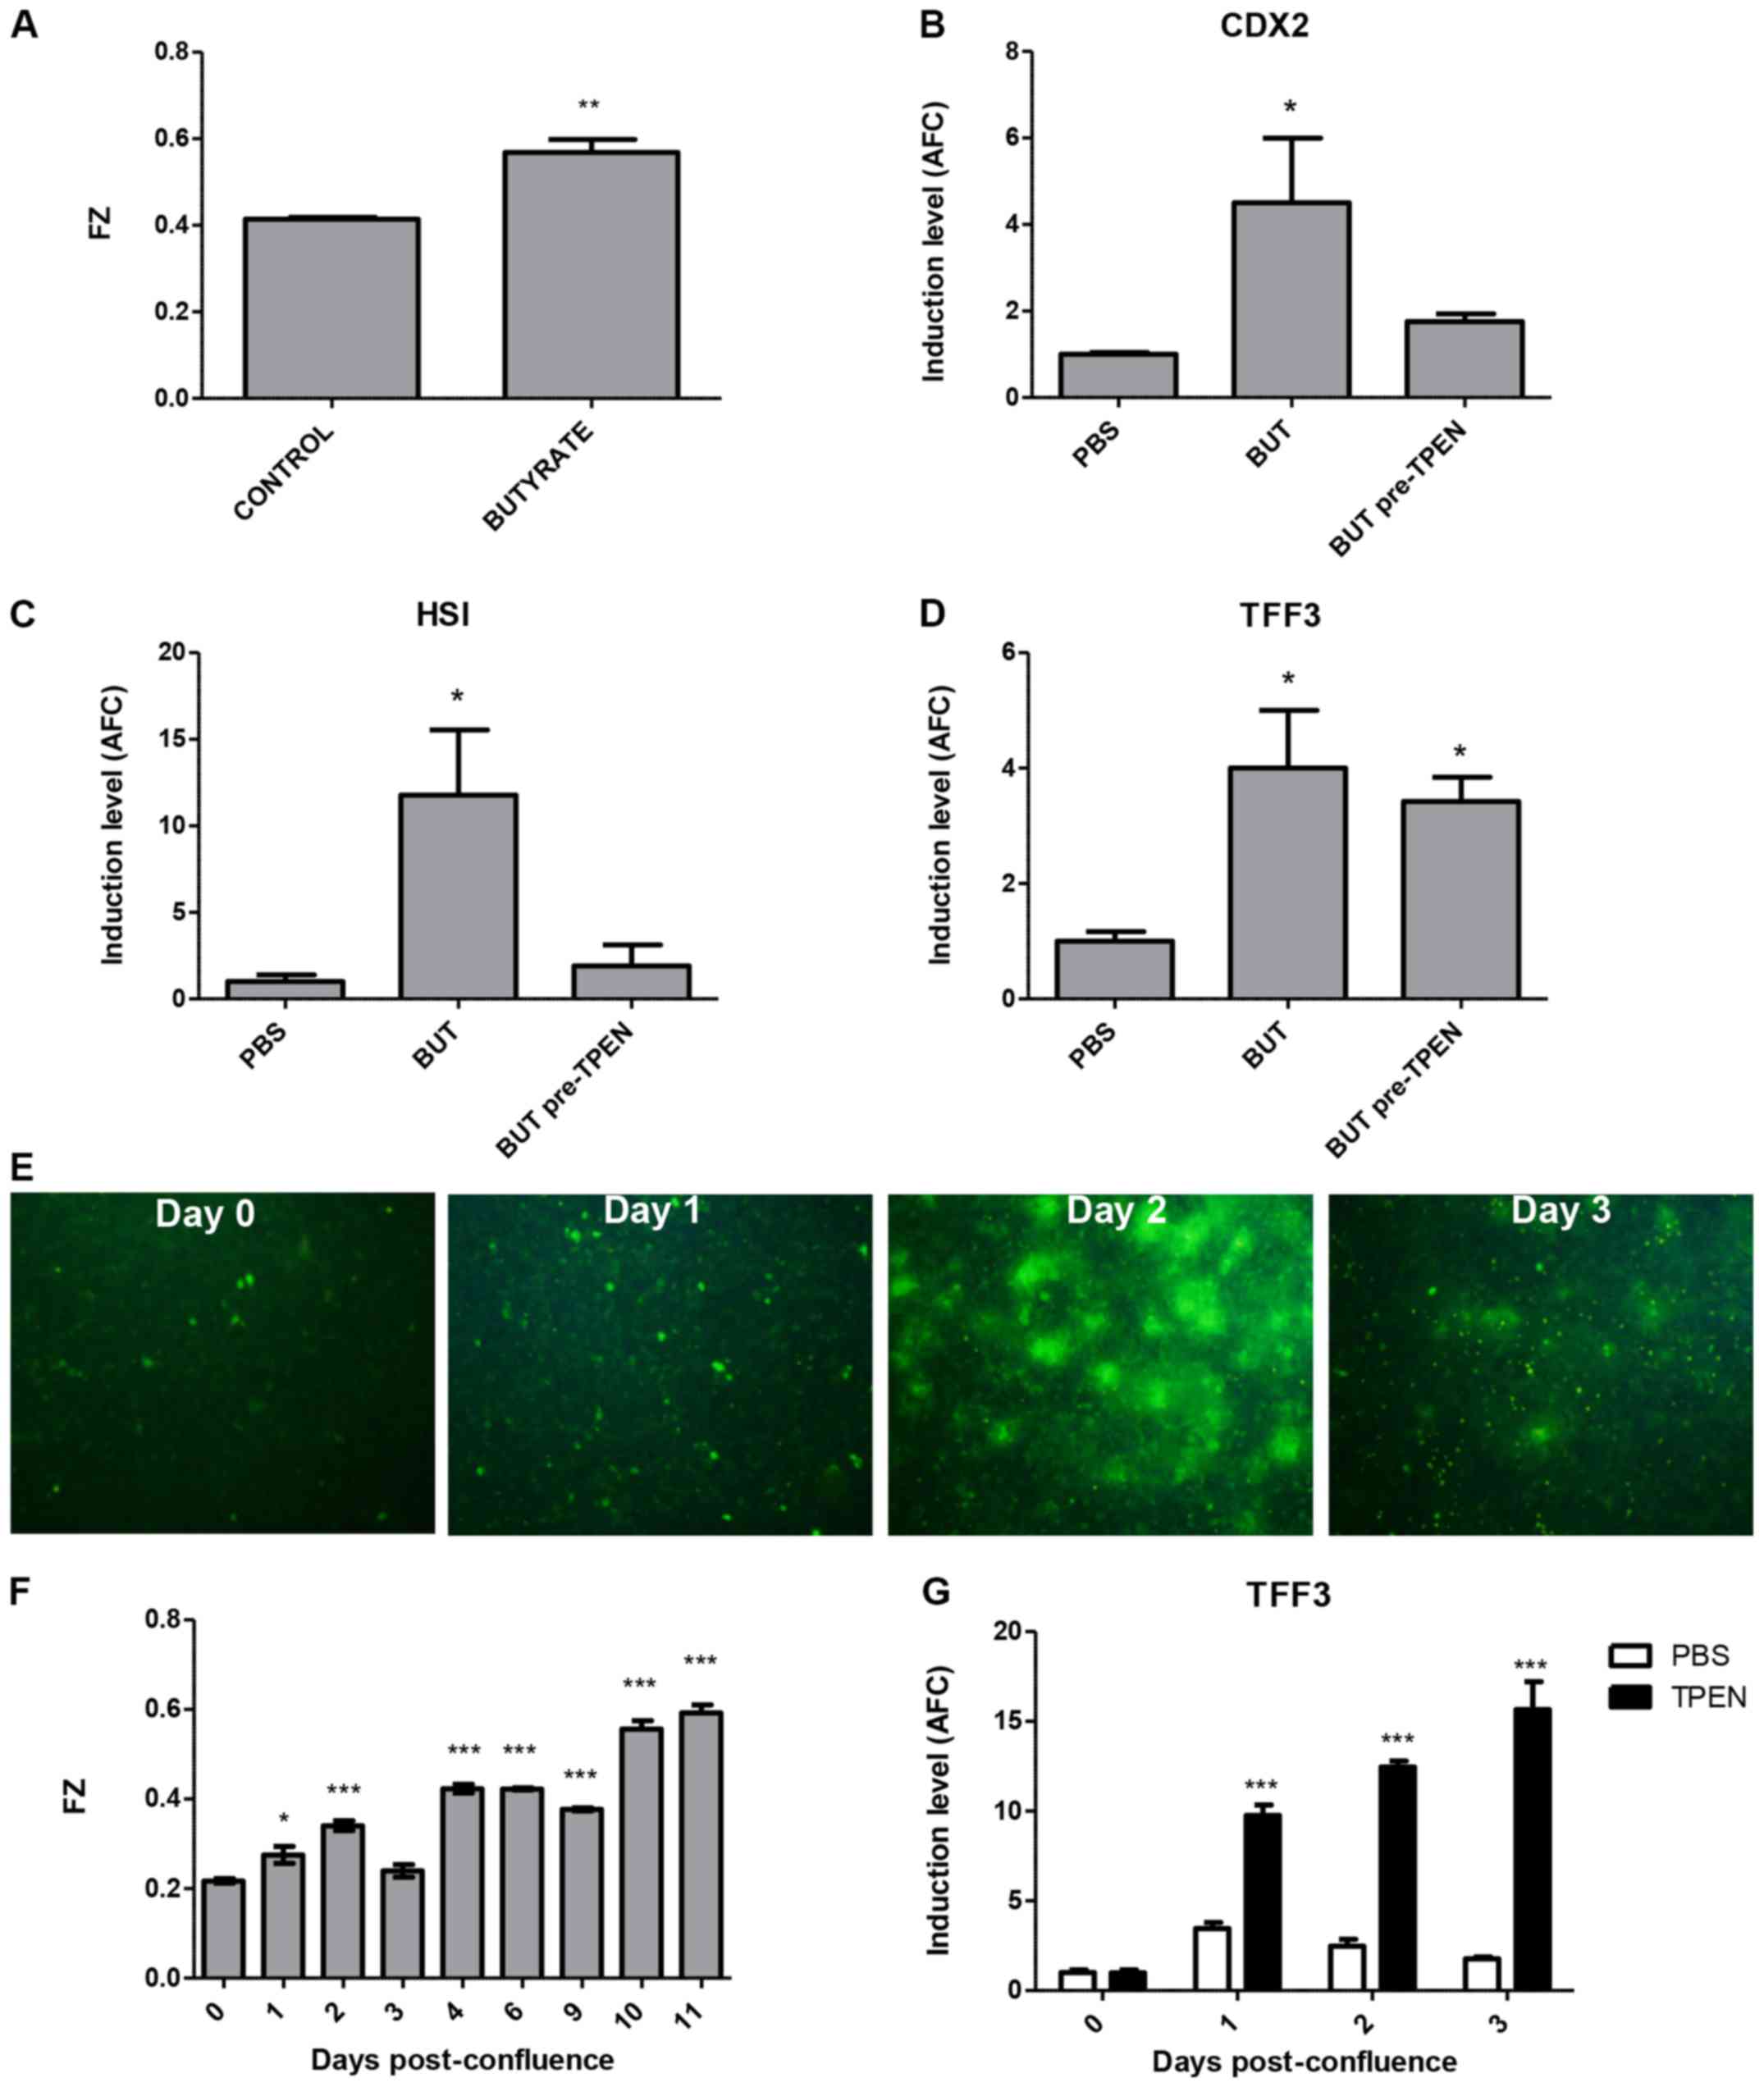
Labile zinc levels in butyrate-treated
and post-confluent HT-29 cells
Given the close relationship between MTs and zinc
biology, we analyzed the levels of intracellular labile zinc in
both models of differentiation, using the zinc-specific fluorophore
FZ. Notably, after 72 h of 2 mM BUT treatment, FZ intensity was
significantly induced in the HT-29 cells (Fig. 7A). We used TPEN treatment to chelate
intracellular labile zinc before the addition of butyrate, and
found that this abolished both CDX2 and HSI mRNA
induction (Fig. 7B and C), but had
no effect on TFF3 levels (Fig.
7D). In the post-confluence model, as shown by fluorescence
microscopy in Fig. 7E and by
fluorimetry in Fig. 7F, FZ
intensity was induced at day 2 and progressively increased
thereafter. Given that TPEN exposure for >6 h is toxic to HT-29
cells, we used daily 5-h TPEN treatments to evaluate the effect of
labile zinc on goblet and enterocyte markers. Notably, TFF3
mRNA expression was significantly induced at days 1–3
post-confluence in TPEN-treated cells (Fig. 7G), whereas there was no effect on
either CDX2 or HSI levels (not shown).
In summary, labile zinc was induced in both models
of intestinal differentiation, and its chelation by TPEN treatment
either inhibited enterocyte differentiation (butyrate model) or
induced the expression of goblet-cell markers (post-confluency
model).
Discussion
In the present study, we uncovered a new role for
MT1G in altering the differentiation properties of the HT-29 cell
line. We previously showed that induction of MTs by HDACi agents
such as trichostatin A and sodium butyrate (BUT) is at least partly
responsible for their cytostatic effects on human CRC cell lines,
and that exogenous MT1G overexpression in the colorectal HCT116
cell line resulted in growth inhibition in nude mouse xenografts
(12). Notably, whereas MT1G
overexpression did not alter the in vivo xenograft growth
rate of HT-29 cells, it markedly increased the number of goblet
cells and differentiation markers of these tumors, both of the
goblet and the enterocyte lineages. These effects were not readily
observed in 2D culture (data not shown), suggesting that additional
signals from the tumor microenvironment may be needed to fulfill
this effect. The reasons for the different observed phenotypic
consequences of MT1G overexpression in these two cell lines are
unclear, but a possible explanation may stem from the differences
in endogenous MT1G expression: HCT116 cells do not express MT1G due
to promoter hypermethylation and therefore the impact of MT1G
overexpression may be stronger than that in HT-29 cells, which
express low, but detectable mRNA levels (8).
In an effort to understand the molecular mechanisms
underlying the altered differentiation of MT1G+ tumors,
we performed mRNA expression profiling by cDNA microarrays. The
expression of several genes involved in the regulation of cell
differentiation was found to be altered, particularly in the Notch
signaling pathway, whose inhibition is well known to stimulate
goblet cell differentiation in the intestine through activation of
ATOH1 (22). Notably, markers of
different sets of intestinal stem cell markers were differentially
dysregulated in MT1G+ tumors, with upregulation of HOPX
(expressed in quiescent stem cells) and downregulation of Lgr5 (in
crypt base columnar stem cells), again suggesting altered
differentiation hierarchies (23,24).
Further studies are warranted to explore this in further
detail.
To further characterize the involvement of MT1G in
colorectal differentiation, we relied on two well-studied cell
culture conditions: sodium butyrate and post-confluent growth. We
showed that endogenous MT1G induction was required for the
induction of goblet cell markers by butyrate, and was temporally
associated with such markers in the confluency model. Moreover,
stable exogenous MT1G overexpression favored goblet and blunted
enterocyte differentiation in both models. Previous studies have
shown MTs to be upregulated in vitro upon CRC
differentiation (25), and
demonstrated a role for MTs in modulating differentiation in
different tissues, such as human salivary gland tumor cells (where
MT1F overexpression resulted in slower growing and more
differentiated tumors) (26),
leukemic (27) neurons and glial
(28), and T cells (29). However, to the best of our
knowledge, this is the first study showing a direct functional
involvement of a metallothionein isoform in CRC
differentiation.
Labile zinc ions have been recognized as secondary
messengers capable of transducing a wide variety of intracellular
signals (30,31), including differentiation (32–34).
MTs can regulate labile zinc concentrations and zinc transfer to
different cellular organelles (35), as well as respond to changes in
intracellular zinc ions (36). We
showed in the present study that labile zinc was increased during
differentiation induced both by butyrate and confluency, and that
this was required for enterocyte differentiation by butyrate,
whereas it blunted goblet marker induction in post-confluency.
While the reason behind the differences observed in both models are
unclear, the overall effects of zinc induction favor an enterocyte
over goblet differentiation. Notably, although labile zinc
increases have already been reported to occur during
butyrate-mediated differentiation of the HT-29 cell line and have
been associated to defined stages of the cell cycle (37), in the present study, we reported for
the first time a functional consequence of labile zinc induction in
this process. Previous studies in other tissues have shown that MTs
transiently translocate to the nucleus during early phases of
differentiation to release the zinc ions necessary for
zinc-dependent transcription factors to execute the differentiation
programs of adipocytes and myoblasts (38,39).
Although we previously showed that MTs in HT-29 are localized to
the cytoplasm (8), we were not able
to detect a nuclear shift in either of the differentiation models
that we used in the present study (data not shown), although this
possibility should be studied in further detail.
Taking into account our results, we hypothesize that
MT1G induction during differentiation may play a role in the
chelation and re-distribution of intracellular labile zinc, perhaps
modulating the activity of zinc-requiring transcription factors and
enzymes, and stimulating the differentiation program of colorectal
cells. In vitro, our results showed that MT1G favors a
goblet over enterocyte differentiation, although our mouse
xenografts assays suggest that in vivo the differentiation
into enterocytes is also stimulated, perhaps as a compensatory
mechanism or in a non-cell autonomous manner. The precise
mechanisms whereby this occurs and the participation of MT1G (and
other MTs) in labile zinc redistribution during differentiation
need to be studied in further detail. Moreover, tumor
classifications based on gene signatures associated with different
cell types suggest that tumors of the more differentiated ‘goblet-’
or ‘enterocyte-like’ subtypes have a better prognosis than
undifferentiated ‘stem-like’ subtype, as well as different
responses to therapeutic agents. Therefore, better understanding of
the molecular mechanisms that govern the differentiation processes
of tumor cells may be of clinical relevance.
Overall, in the present study, we unveiled a
pro-differentiation effect of MT1G on various CRC cells, thus
proposing a new mechanism whereby MT1G may act as a tumor
suppressor in this tumor type. Moreover, we established a
functional consequence of transient increases in labile zinc upon
differentiation stimuli, and support the need of further studies
relating zinc signaling and differentiation, that may ultimately
underlie tumor cell phenotypes and response to therapies.
Acknowledgements
The present study was funded by the Consejo Nacional
de Investigaciones Científicas y Técnicas (CONICET) (PIP no. 845-10
to M.B.), the Agencia Nacional de Promoción Científica y
Tecnológica (ANPCyT) (IP-PAE 2007, to J.M.), the Fundación Cáncer,
the Fundación P. Mosoteguy, the Fundación Sales, and the Fundación
María Calderón de la Barca, Buenos Aires, Argentina.
Glossary
Abbreviations
Abbreviations:
|
BUT
|
sodium butyrate
|
|
CRC
|
colorectal cancer
|
|
FZ
|
fluozin 3-AM
|
|
MMPs
|
matrix metalloproteinases
|
|
TPEN
|
N,N,N',N'-tetrakis(2-pyridylmethyl)
ethylenediamine
|
|
MTs
|
metallothioneins
|
References
|
1
|
Torre LA, Bray F, Siegel RL, Ferlay J,
Lortet-Tieulent J and Jemal A: Global cancer statistics, 2012. CA
Cancer J Clin. 65:87–108. 2015. View Article : Google Scholar : PubMed/NCBI
|
|
2
|
Dalerba P, Kalisky T, Sahoo D, Rajendran
PS, Rothenberg ME, Leyrat AA, Sim S, Okamoto J, Johnston DM, Qian
D, et al: Single-cell dissection of transcriptional heterogeneity
in human colon tumors. Nat Biotechnol. 29:1120–1127. 2011.
View Article : Google Scholar : PubMed/NCBI
|
|
3
|
Sadanandam A, Lyssiotis CA, Homicsko K,
Collisson EA, Gibb WJ, Wullschleger S, Ostos LC, Lannon WA,
Grotzinger C, Del Rio M, et al: A colorectal cancer classification
system that associates cellular phenotype and responses to therapy.
Nat Med. 19:619–625. 2013. View
Article : Google Scholar : PubMed/NCBI
|
|
4
|
Pedersen MO, Larsen A, Stoltenberg M and
Penkowa M: The role of metallothionein in oncogenesis and cancer
prognosis. Prog Histochem Cytochem. 44:29–64. 2009. View Article : Google Scholar : PubMed/NCBI
|
|
5
|
Eckschlager T, Adam V, Hrabeta J, Figova K
and Kizek R: Metallothioneins and cancer. Curr Protein Pept Sci.
10:360–375. 2009. View Article : Google Scholar : PubMed/NCBI
|
|
6
|
Dziegiel P, Pula B, Kobierzycki C,
Stasiolek M and Podhorska-Okolow M: Metallothioneins in normal and
cancer cells. Adv Anat Embryol Cell Biol. 218:1–117. 2016.
View Article : Google Scholar : PubMed/NCBI
|
|
7
|
Gumulec J, Raudenska M, Adam V, Kizek R
and Masarik M: Metallothionein - immunohistochemical cancer
biomarker: A meta-analysis. PLoS One. 9:e853462014. View Article : Google Scholar : PubMed/NCBI
|
|
8
|
Arriaga JM, Levy EM, Bravo AI, Bayo SM,
Amat M, Aris M, Hannois A, Bruno L, Roberti MP, Loria FS, et al:
Metallothionein expression in colorectal cancer: Relevance of
different isoforms for tumor progression and patient survival. Hum
Pathol. 43:197–208. 2012. View Article : Google Scholar : PubMed/NCBI
|
|
9
|
Arriaga JM, Bravo IA, Bruno L, Bayo
Morales S, Hannois A, Sanchez Loria F, Pairola F, Huertas E,
Roberti MP, Rocca YS, et al: Combined metallothioneins and p53
proteins expression as a prognostic marker in patients with Dukes
stage B and C colorectal cancer. Hum Pathol. 43:1695–1703. 2012.
View Article : Google Scholar : PubMed/NCBI
|
|
10
|
Janssen AM, van Duijn W, Oostendorp-Van De
Ruit MM, Kruidenier L, Bosman CB, Griffioen G, Lamers CB, van
Krieken JH, van De Velde CJ and Verspaget HW: Metallothionein in
human gastrointestinal cancer. J Pathol. 192:293–300. 2000.
View Article : Google Scholar : PubMed/NCBI
|
|
11
|
Bianchini M, Levy E, Zucchini C, Pinski V,
Macagno C, De Sanctis P, Valvassori L, Carinci P and Mordoh J:
Comparative study of gene expression by cDNA microarray in human
colorectal cancer tissues and normal mucosa. Int J Oncol. 29:83–94.
2006.PubMed/NCBI
|
|
12
|
Arriaga JM, Greco A, Mordoh J and
Bianchini M: Metallothionein 1G and zinc sensitize human colorectal
cancer cells to chemotherapy. Mol Cancer Ther. 13:1369–1381. 2014.
View Article : Google Scholar : PubMed/NCBI
|
|
13
|
Cleveland WS, Devlin SJ and Grosse E:
Regression by local fitting: Methods, properties, and computational
algorithm. J Econom. 37:87–114. 1988. View Article : Google Scholar
|
|
14
|
Yang YH, Dudoit S, Luu P, Lin DM, Peng V,
Ngai J and Speed TP: Normalization for cDNA microarray data: A
robust composite method addressing single and multiple slide
systematic variation. Nucleic Acids Res. 30:e152002. View Article : Google Scholar : PubMed/NCBI
|
|
15
|
Dennis G Jr, Sherman BT, Hosack DA, Yang
J, Gao W, Lane HC and Lempicki RA: DAVID: Database for Annotation,
Visualization, and Integrated Discovery. Genome Biol. 4:32003.
View Article : Google Scholar
|
|
16
|
Huang W, Sherman BT and Lempicki RA:
Systematic and integrative analysis of large gene lists using DAVID
bioinformatics resources. Nat Protoc. 4:44–57. 2009. View Article : Google Scholar : PubMed/NCBI
|
|
17
|
Velcich A, Palumbo L, Jarry A, Laboisse C,
Racevskis J and Augenlicht L: Patterns of expression of
lineage-specific markers during the in vitro-induced
differentiation of HT29 colon carcinoma cells. Cell Growth Differ.
6:749–757. 1995.PubMed/NCBI
|
|
18
|
Troeberg L and Nagase H: Zymography of
metalloproteinases. Curr Protoc Protein Sci. 21:Unit 21.15.
2004.
|
|
19
|
Augeron C and Laboisse CL: Emergence of
permanently differentiated cell clones in a human colonic cancer
cell line in culture after treatment with sodium butyrate. Cancer
Res. 44:3961–3969. 1984.PubMed/NCBI
|
|
20
|
Zweibaum A, Pinto M, Chevalier G, Dussaulx
E, Triadou N, Lacroix B, Haffen K, Brun JL and Rousset M:
Enterocytic differentiation of a subpopulation of the human colon
tumor cell line HT-29 selected for growth in sugar-free medium and
its inhibition by glucose. J Cell Physiol. 122:21–29. 1985.
View Article : Google Scholar : PubMed/NCBI
|
|
21
|
Chung YS, Song IS, Erickson RH, Sleisenger
MH and Kim YS: Effect of growth and sodium butyrate on brush border
membrane-associated hydrolases in human colorectal cancer cell
lines. Cancer Res. 45:2976–2982. 1985.PubMed/NCBI
|
|
22
|
VanDussen KL, Carulli AJ, Keeley TM, Patel
SR, Puthoff BJ, Magness ST, Tran IT, Maillard I, Siebel C, Kolterud
Å, et al: Notch signaling modulates proliferation and
differentiation of intestinal crypt base columnar stem cells.
Development. 139:488–497. 2012. View Article : Google Scholar : PubMed/NCBI
|
|
23
|
Barker N, Ridgway RA, van Es JH, van de
Wetering M, Begthel H, van den Born M, Danenberg E, Clarke AR,
Sansom OJ and Clevers H: Crypt stem cells as the cells-of-origin of
intestinal cancer. Nature. 457:608–611. 2009. View Article : Google Scholar : PubMed/NCBI
|
|
24
|
Takeda N, Jain R, LeBoeuf MR, Wang Q, Lu
MM and Epstein JA: Interconversion between intestinal stem cell
populations in distinct niches. Science. 334:1420–1424. 2011.
View Article : Google Scholar : PubMed/NCBI
|
|
25
|
Vecchini F, Pringault E, Billiar TR,
Geller DA, Hausel P and Felley-Bosco E: Decreased activity of
inducible nitric oxide synthase type 2 and modulation of the
expression of glutathione S-transferase α, bcl-2, and
metallothioneins during the differentiation of CaCo-2 cells. Cell
Growth Differ. 8:261–268. 1997.PubMed/NCBI
|
|
26
|
Hecht D, Jung D, Prabhu VV, Munson PJ,
Hoffman MP and Kleinman HK: Metallothionein promotes
laminin-1-induced acinar differentiation in vitro and reduces tumor
growth in vivo. Cancer Res. 62:5370–5374. 2002.PubMed/NCBI
|
|
27
|
Bagheri Maghdooni P, Govaerts I and De Ley
M: Role of metallothionein in differentiation of leukemia cells.
Mol Biol Rep. 38:3017–3022. 2011. View Article : Google Scholar : PubMed/NCBI
|
|
28
|
Nishikawa M, Mori H and Hara M: Reduced
zinc cytotoxicity following differentiation of neural
stem/progenitor cells into neurons and glial cells is associated
with upregulation of metallothioneins. Environ Toxicol Pharmacol.
39:1170–1176. 2015. View Article : Google Scholar : PubMed/NCBI
|
|
29
|
Wu C, Pot C, Apetoh L, Thalhamer T, Zhu B,
Murugaiyan G, Xiao S, Lee Y, Rangachari M, Yosef N, et al:
Metallothioneins negatively regulate IL-27-induced type 1
regulatory T cell differentiation. Proc Natl Acad Sci USA.
110:7802–7807. 2013. View Article : Google Scholar : PubMed/NCBI
|
|
30
|
Murakami M and Hirano T: Intracellular
zinc homeostasis and zinc signaling. Cancer Sci. 99:1515–1522.
2008. View Article : Google Scholar : PubMed/NCBI
|
|
31
|
Yamasaki S, Sakata-Sogawa K, Hasegawa A,
Suzuki T, Kabu K, Sato E, Kurosaki T, Yamashita S, Tokunaga M,
Nishida K, et al: Zinc is a novel intracellular second messenger. J
Cell Biol. 177:637–645. 2007. View Article : Google Scholar : PubMed/NCBI
|
|
32
|
Beyersmann D and Haase H: Functions of
zinc in signaling, proliferation and differentiation of mammalian
cells. Biometals. 14:331–341. 2001. View Article : Google Scholar : PubMed/NCBI
|
|
33
|
Dubben S, Hönscheid A, Winkler K, Rink L
and Haase H: Cellular zinc homeostasis is a regulator in monocyte
differentiation of HL-60 cells by 1 alpha,25-dihydroxyvitamin D3. J
Leukoc Biol. 87:833–844. 2010. View Article : Google Scholar : PubMed/NCBI
|
|
34
|
Wolford JL, Chishti Y, Jin Q, Ward J, Chen
L, Vogt S and Finney L: Loss of pluripotency in human embryonic
stem cells directly correlates with an increase in nuclear zinc.
PLoS One. 5:e123082010. View Article : Google Scholar : PubMed/NCBI
|
|
35
|
Maret W: Metals on the move: Zinc ions in
cellular regulation and in the coordination dynamics of zinc
proteins. Biometals. 24:411–418. 2011. View Article : Google Scholar : PubMed/NCBI
|
|
36
|
Kindermann B, Döring F, Pfaffl M and
Daniel H: Identification of genes responsive to intracellular zinc
depletion in the human colon adenocarcinoma cell line HT-29. J
Nutr. 134:57–62. 2004.PubMed/NCBI
|
|
37
|
Krezel A and Maret W: Zinc-buffering
capacity of a eukaryotic cell at physiological pZn. J Biol Inorg
Chem. 11:1049–1062. 2006. View Article : Google Scholar : PubMed/NCBI
|
|
38
|
Schmidt C and Beyersmann D: Transient
peaks in zinc and metallothionein levels during differentiation of
3T3L1 cells. Arch Biochem Biophys. 364:91–98. 1999. View Article : Google Scholar : PubMed/NCBI
|
|
39
|
Apostolova MD, Ivanova IA and Cherian MG:
Metallothionein and apoptosis during differentiation of myoblasts
to myotubes: Protection against free radical toxicity. Toxicol Appl
Pharmacol. 159:175–184. 1999. View Article : Google Scholar : PubMed/NCBI
|