Introduction
Colorectal cancer (CRC) is the third most common
cancer worldwide. Although the mortality rate of CRC has been
decreasing, owing largely to early clinical detection and improved
management in developed countries, it is still the fourth most
common cause of cancer-related deaths (1). Tumor recurrence and chemo-resistance
are the main causes of these poor outcomes, and hence,
identification of new therapeutic targets has become essential.
Epithelial-mesenchymal transition (EMT) is a unique
process in which cells lose epithelial features and gain
mesenchymal properties (2). During
EMT, the epithelial cells lose cell-to-cell contact and cell
polarity, thereby acquiring increased motility and invasiveness
(3). The process of EMT is
associated with the downregulation of epithelial markers and
aberrant upregulation of mesenchymal markers (4). E-cadherin is the most significant
mediator of cell-to-cell adhesion in epithelial tissue, and loss of
E-cadherin in epithelial cells is a critical step in EMT (5,6).
Furthermore, snail is a transcriptional repressor of E-cadherin
that silences its gene expression (7) and β-catenin binds to E-cadherin in the
cell membrane (6). During EMT,
downregulation of E-cadherin is associated with the release of
β-catenin, which is consequently translocated to the nucleus where
it activates the WNT signaling pathway (6). Additionally, cells that have undergone
EMT often express mesenchymal proteins such as vimentin (8).
Many studies have reported that EMT is associated
with cancer progression, metastatic spread and therapeutic
resistance (9–12). Although EMT processes have been
documented in many in vitro cancer cell models, the
significance of EMT during cancer progression and its relevance in
human cancer tissues remains controversial (13). While EMT has been studied in human
CRC, the clinical significance of EMT in CRC has not been clearly
elucidated (5,6,14–18).
In addition, some studies have reported that EMT occurs at the
invasive front of human cancer tissue (16,19).
However, the differences in EMT-related protein expression patterns
among different tumor areas (tumor center vs. invasive front) and
their clinicopathologic significance have not been evaluated in
CRC.
Although mesenchymal traits appear to enable the
dissemination of cancer cells from the primary tumor site, they
need to acquire self-renewal capability to successfully establish
heterogeneous metastases, a feature similar to that exhibited by
stem cells (3). Cancer stem cells
(CSCs) display stemness features, which include self-renewal,
unlimited proliferative potential and multipotency, and might be
responsible for tumor initiation and development, as well as local
relapses and metastasis (20).
Several markers for CSCs have been investigated in
CRC, with CD44 and CD133 being the most frequently researched and
believed to be the main colorectal CSC markers (21,22).
CD44, a cell adhesion molecule, is known to be involved in cell
growth, differentiation and survival (22), whereas CD133 is a transmembrane and
cell surface protein that is known to be associated with
recurrence-free survival and chemo-resistance in CRC (22). However, some controversies still
exist over the relationship between expression of CD44 and CD133
and their associations with clinicopathological factors and
prognosis of CRC (21).
In the present study, the expression status of EMT-
and CSC-related proteins in different tumor areas (tumor center vs.
invasive front) and their clinicopathological significance were
assessed in 286 primary CRC tissues using immunohistochemistry.
Moreover, the effect of their combined expression patterns on
clinical and pathological features and patient outcomes were
analyzed.
Materials and methods
Patient and tissue samples
The CRC tissue samples were retrieved from the
archives maintained at the Department of Pathology at Chonbuk
National University from 2006 to 2007. A total of 286 eligible
patients who had undergone surgical resection with lymph node
dissection were identified, according to the following criteria:
availability of hematoxylin and eosin-stained glass slides and
paraffin blocks for construction of a tissue microarray, and no
preoperative chemotherapy or radiotherapy. The CRC specimens and
patients medical records were reviewed to obtain clinical and
pathologic data, including age, sex, tumor size, depth of invasion,
tumor differentiation by the World Health Organization
classification (23), presence of
lymphovascular invasion, presence of perineural invasion, presence
of lymph node metastasis, pTNM stage according to the American
Joint Committee on Cancer (AJCC) 7th edition (24), postoperative recurrence or tumor
metastasis, and postoperative chemotherapy or radiation therapy
data. Sixty-seven patients received adjuvant chemotherapy, five
patients received both adjuvant chemotherapy and radiation therapy,
and 219 patients received no adjuvant treatment.
The patients were aged between 30 and 88 years
(mean, 63.4 years) at the time of surgical resection, and included
174 men and 112 women. The follow-up period was determined from the
date of initial surgery to the date of the last follow-up or
mortality. Follow-up information, including patient outcome and the
time interval between the date of surgical resection and death,
tumor recurrence, or metastasis, was collected. The follow-up
period ranged from 0.7 to 100 months (median, 53.0 months).
The present study obtained institutional review
board approval from the Chonbuk National University Hospital (IRB
number, CUH 2015-09-023). Each patient provided written informed
consent. All experiments were performed in accordance with the
relevant guidelines and regulations.
Tissue microarray and
immunohistochemical staining
Tissue microarrays were constructed for
immunohistochemical staining. The original hematoxylin and
eosin-stained slides were reviewed, and representative tumor center
(the most representative solid area composed of intact tumor cells
in the middle of the tumor) and invasive front (the deepest tumor
area with the highest tumor budding) areas were marked for tissue
microarray creation. Four cylinders of 2 mm (two from the tumor
center, one from the cancer invasion front, and one from the
adjacent non-tumor mucosa) were obtained from all individual
cases.
Immunohistochemical staining was performed on
4-µm-thick sections of tissue microarray blocks from the 286
included surgically resected samples. The tissue sections were
deparaffinized and rehydrated following the standard procedure.
Heat-induced antigen retrieval was performed in a microwave oven
for 20 min, and the sections were incubated for 30 min along with
primary antibodies. The primary antibodies used were against
E-cadherin (clone 36B5, 1:50 dilution; Novocastra Laboratories
Ltd., Newcastle, UK), β-catenin (clone 14/β-catenin, 1:200
dilution; BD Biosciences, San Jose, CA, USA), vimentin (clone V9,
1:100 dilution; Novocastra Laboratories), snail (clone snail1 +
snail2, 1:100 dilution; Abcam, Cambridge, UK), CD44 (clone DF1485,
1:100 dilution; Dako, Glostrup, Denmark) and CD133 (clone AC133,
1:50 dilution; Miltenyi Biotec, Inc., Auburn, CA, USA). All
immunohistochemical staining was performed by a polymer intense
detection system using the BondMax Automatic stainer (Leica
Microsystems, Inc., Bannockburn, IL, USA) in accordance with the
manufacturer's instructions.
Evaluation of
immunohistochemistry
For E-cadherin, β-catenin and CD44, only the
membranous staining was evaluated (4,25).
Vimentin was considered a cytoplasmic protein (4), while snail was evaluated for either
cytoplasmic or nuclear staining (5). CD133 staining was considered to
indicate either the apical portion of the tumor cells or the shed
cellular debris in the tumor glands (21,25,26).
All samples were semi-quantitatively scored by evaluation of the
proportion of positive tumor cells over the total number of tumor
cells (percentage of positive tumor cells per tissue microarray
punch, 5% intervals, range, 0–100%). From each case, the average
score of two tissue microarray tumor center cores was used for the
analysis. Subsequently, using receiver-operating characteristic
(ROC) curve analysis, appropriate cut-off scores for each marker
were obtained. Positive staining in the percentages of cells above
or below the cut-off scores were classified as ‘overexpression’ or
‘loss of expression’, respectively.
Statistical analysis
Comparisons between individual or combinations of
EMT- and CSC-related markers and clinicopathologic characteristics
were assessed using the χ2 test. The Kaplan-Meier method
with the log-rank test was used for univariate analysis of the
effects of individual and combined EMT- and CSC-related markers for
predicting patient disease-free survival (DFS) and overall survival
(OS). To determine the combination effects of the EMT- and
CSC-related markers on the clinicopathologic characteristics and
predicting patient outcome, 66 combinations were evaluated using
the χ2 test and Kaplan-Meier method with the log-rank
test. Multivariate analysis was performed using a Cox proportional
hazards model to determine hazard ratios. For all analyses,
P<0.05 were considered to indicate statistical significance.
Statistical analysis was performed with SPSS software (SPSS
Standard version 21.0; SPSS, Inc., Chicago, IL, USA).
Results
Associations between each protein
expression, clinicopathologic characteristics and patient
outcome
E-cadherin
E-cadherin was strongly expressed in the membrane of
non-neoplastic colorectal epithelial cells. CRC cells showed
diffuse membranous staining or loss of membrane expression
(Fig. 1). The optimal cut-off
score, based on ROC curve analysis, was determined as ≥95%. Among
the analyzed cases, diffuse membranous staining in >95% of tumor
cells was observed in the tumor center in 115 (40.2%) cases and in
the invasive front in 78 (27.3%) cases. Conversely, loss of
membranous E-cadherin expression (<95% staining, as defined by
ROC curve analysis) was observed in the tumor center in 171 (59.8%)
cases and in the invasive front in 208 (72.7%) cases. Loss of
E-cadherin expression in the tumor center significantly correlated
with old age (≥60 years, P=0.038), female sex (P=0.026), large
tumor size (≥4 cm, P=0.012), poor differentiation (P<0.001),
deeper invasion depth (P=0.048), presence of lymphovascular
invasion (P=0.009), presence of perineural invasion (P=0.013),
presence of lymph node metastasis (P<0.001) and advanced tumor
stage (P<0.001) (Table I). Loss
of E-cadherin expression in the invasive front significantly
associated with large tumor size (≥4 cm, P=0.011), poor
differentiation (P=0.001), deeper invasion depth (P=0.001),
presence of lymphovascular invasion (P<0.001), presence of
perineural invasion (P=0.003), presence of lymph node metastasis
(P<0.001), advanced tumor stage (P=0.001), and post-operative
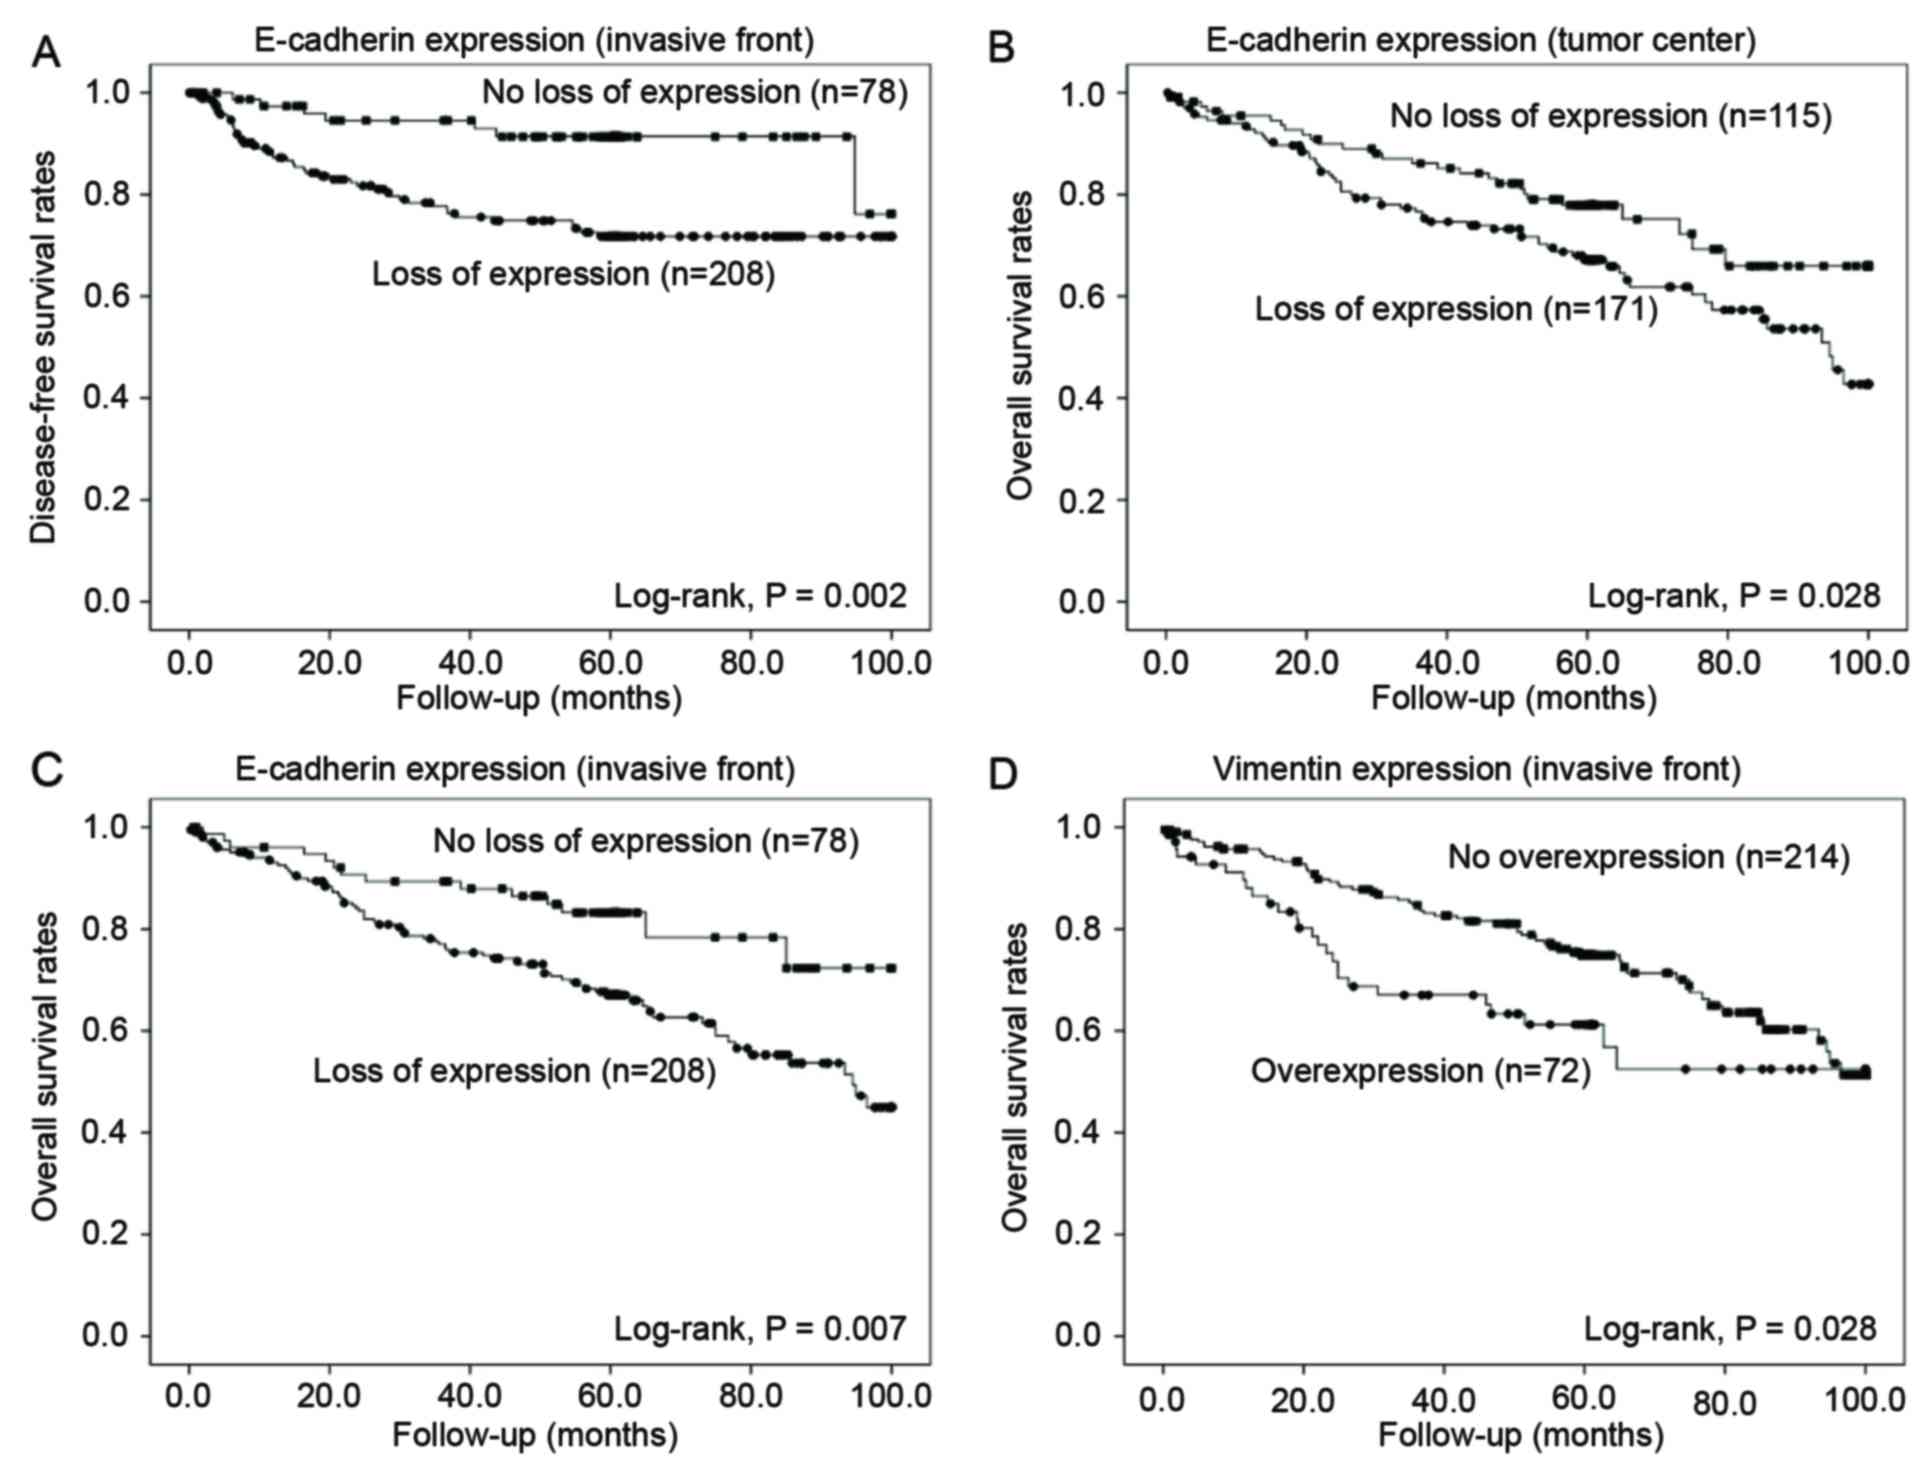
recurrence or metastasis (P=0.004) (Table II). The result of the Kaplan-Meier
univariate analysis showed that a loss of E-cadherin expression in
the tumor center significantly associated with poor OS (P=0.028),
but not DFS (P=0.482) (Fig. 2). In
the invasive front, loss of E-cadherin expression related with both
shorter DFS (P=0.002) and OS (P=0.007) (Fig. 2).
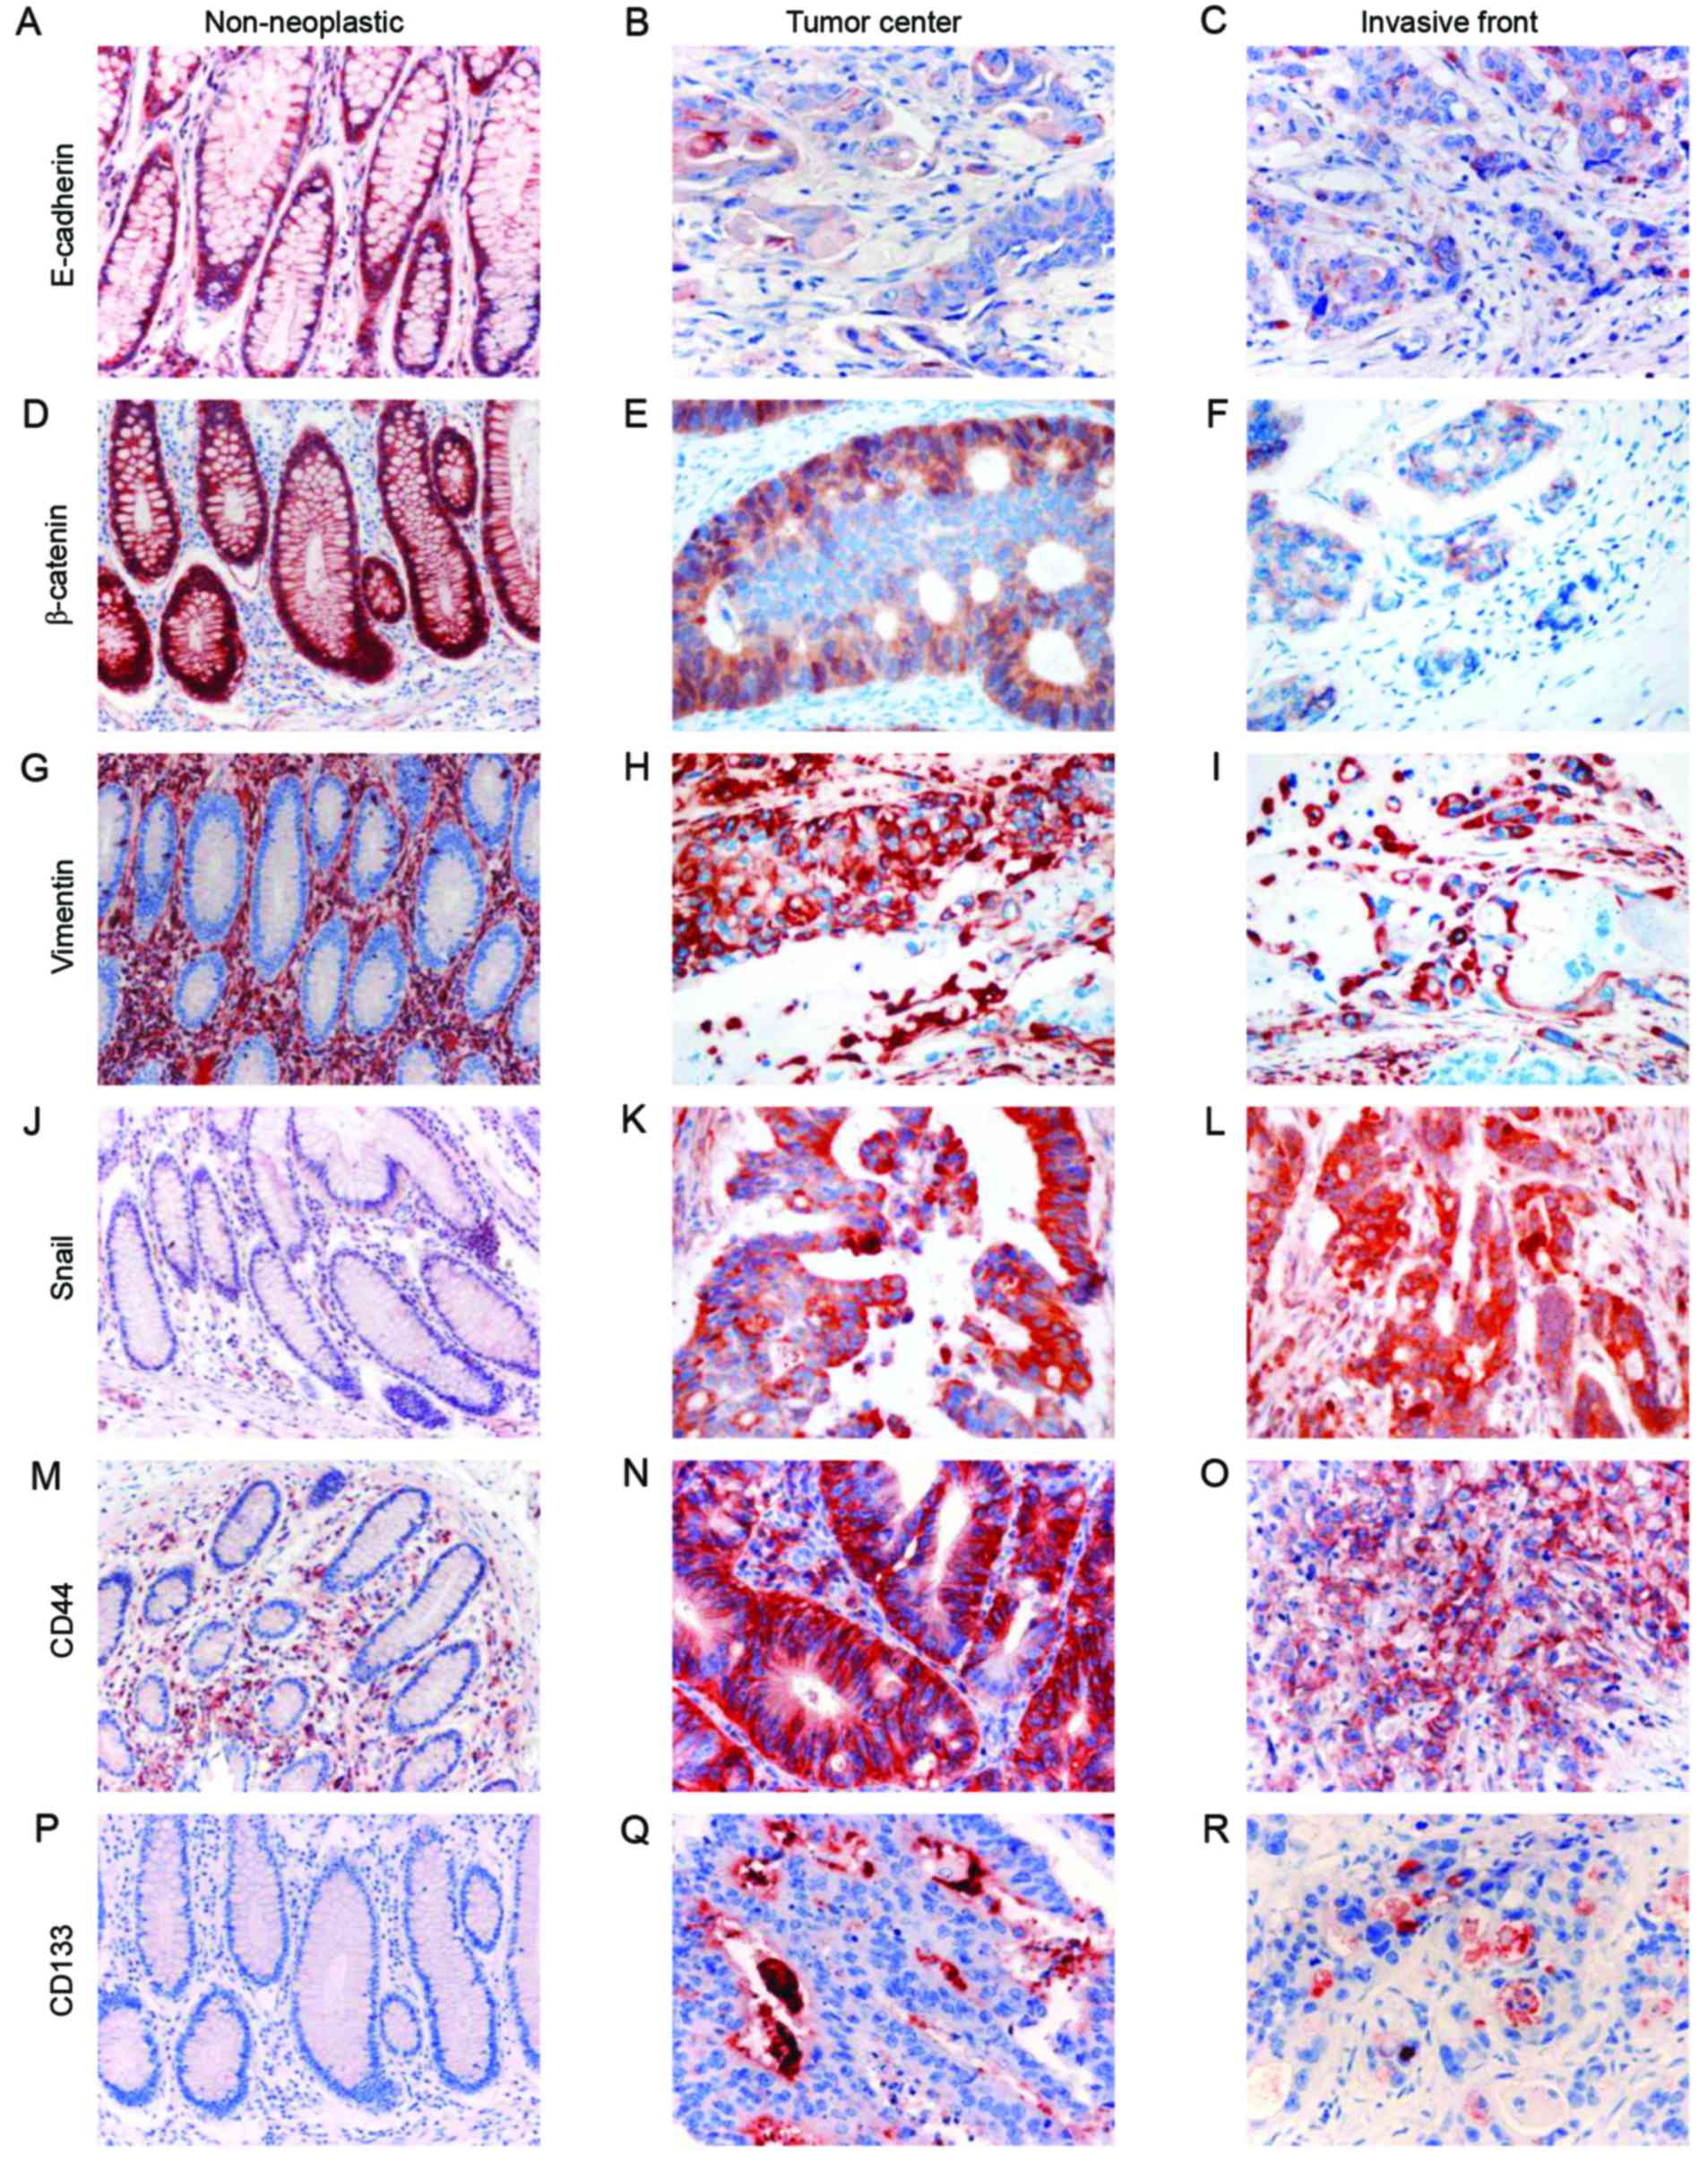 | Figure 1.Immunohistochemical analysis of the
expression of epithelial-mesenchymal transition (EMT)-related and
cancer stem cell (CSC)-related proteins (first column: original
magnification, ×200; second and third columns: original
magnification, ×400). The first, second and third columns show
non-neoplastic mucosa, the tumor center, and the invasive front,
respectively. (A-C) E-cadherin, (D-F) β-catenin, (G-I) vimentin,
(J-L) snail, (M-O) CD44 and (P-R) CD133. |
 | Table I.Clinicopathological characteristics
and correlation with the epithelial-mesenchymal transition
(EMT)-related protein expression status in the tumor center. |
Table I.
Clinicopathological characteristics
and correlation with the epithelial-mesenchymal transition
(EMT)-related protein expression status in the tumor center.
|
| Loss of
expression | Overexpression |
|---|
|
|
|
|
|---|
| Characteristics
(n) | E-cadherin (n=171)
(%) | P-value | β-catenin (n=102)
(%) | P-value | Vimentin (n=40)
(%) | P-value | Snail (n=149)
(%) | P-value |
|---|
| Age (years) |
|
0.038 |
|
0.391 |
|
0.137 |
| 0.177 |
| <60
(99) | 51 (51.5) |
| 32 (32.3) |
| 18 (18.2) |
| 57 (57.6) |
|
| ≥60
(187) | 120 (64.2) |
| 70 (37.4) |
| 22 (11.8) |
| 92 (49.2) |
|
| Sex |
| 0.026 |
| 0.623 |
| 0.010 |
| 0.932 |
| Female
(112) | 76 (67.9) |
| 38 (33.9) |
| 23 (20.5) |
| 58 (51.8) |
|
| Male
(174) | 95 (54.6) |
| 64 (36.8) |
| 17 (9.8) |
| 91 (52.3) |
|
| Size (cm) |
| 0.012 |
| 0.974 |
| 0.255 |
| 0.590 |
| <4
(109) | 55 (50.5) |
| 39 (35.8) |
| 12 (11.0) |
| 59 (54.1) |
|
| ≥4
(177) | 116 (65.5) |
| 63 (35.6) |
| 28 (15.8) |
| 90 (50.8) |
|
| Histologic
grade |
| <0.001 |
| <0.001 |
| <0.001 |
| 0.653 |
| Low
(249) | 138 (55.4) |
| 76 (30.5) |
| 23 (9.2) |
| 131 (52.6) |
|
| High
(37) | 33 (89.2) |
| 26 (70.3) |
| 17 (45.9) |
| 18 (48.6) |
|
| Depth of invasion
(pT category) |
| 0.048 |
| 0.592 |
| 0.038 |
| 0.044 |
| T1 or
T2 (65) | 32 (49.2) |
| 25 (38.5) |
| 4 (6.2) |
| 41 (63.1) |
|
| T3 or
T4 (221) | 139 (62.9) |
| 77 (34.8) |
| 36 (16.3) |
| 108 (48.9) |
|
| Lymphovascular
invasion |
| 0.009 |
| 0.007 |
| 0.036 |
| 0.227 |
| Absent
(165) | 88 (53.3) |
| 48 (29.1) |
| 17 (10.3) |
| 91 (55.2) |
|
| Present
(121) | 83 (68.6) |
| 54 (44.6) |
| 23 (19.0) |
| 58 (47.9) |
|
| Perineural
invasion |
| 0.013 |
| 0.509 |
| <0.001 |
| 0.685 |
| Absent
(214) | 119 (55.6) |
| 74 (34.6) |
| 20 (9.3) |
| 110 (51.4) |
|
| Present
(72) | 52 (82.2) |
| 28 (38.9) |
| 20 (27.8) |
| 39 (54.2) |
|
| Lymph node
metastasis |
| <0.001 |
| 0.012 |
| 0.004 |
| 0.385 |
| Absent
(160) | 81 (50.6) |
| 47 (29.4) |
| 14 (8.8) |
| 87 (54.4) |
|
|
Present (126) | 90 (71.4) |
| 55 (43.7) |
| 26 (20.6) |
| 62 (49.2) |
|
| pTNM stage |
| <0.001 |
| 0.034 |
| 0.004 |
| 0.136 |
| I and
II (153) | 76 (49.7) |
| 46 (30.1) |
| 13 (8.5) |
| 86 (56.2) |
|
| III and
IV (133) | 95 (71.4) |
| 56 (42.1) |
| 27 (20.3) |
| 63 (47.4) |
|
| Recurrence or
metastasis after surgery |
| 0.684 |
| 0.505 |
| 0.486 |
| 0.672 |
| Absent
(233) | 138 (59.2) |
| 81 (34.8) |
| 31 (13.3) |
| 120 (51.5) |
|
| Present
(53) | 33 (62.3) |
| 21 (39.6) |
| 9 (17.0) |
| 29 (54.7) |
|
| Recurrence or
metastasis after adjuvant chemotherapy |
| 0.812 |
| 0.409 |
| 0.543 |
| 0.217 |
| Absent
(46) | 32 (69.6) |
| 17 (37.0) |
| 10 (21.7) |
| 21 (45.7) |
|
| Present
(21) | 14 (66.7) |
| 10 (47.6) |
| 6 (28.6) |
| 13 (61.9) |
|
| Table II.Clinicopathologic characteristics and
correlation with the epithelial-mesenchymal transition
(EMT)-related protein expression status in the invasive front. |
Table II.
Clinicopathologic characteristics and
correlation with the epithelial-mesenchymal transition
(EMT)-related protein expression status in the invasive front.
|
| Loss of
expression | Overexpression |
|---|
|
|
|
|
|---|
| Characteristics
(n) | E-cadherin (n=208)
(%) | P-value | β-catenin (n=123)
(%) | P-value | Vimentin (n=72)
(%) | P-value | Snail (n=182)
(%) | P-value |
|---|
| Age (years) |
|
0.094 |
|
0.692 |
|
0.146 |
| 0.196 |
| <60
(99) | 66 (66.7) |
| 41 (41.4) |
| 30 (30.3) |
| 68 (68.7) |
|
| ≥60
(187) | 142 (75.9) |
| 82 (43.9) |
| 42 (22.5) |
| 114 (61.0) |
|
| Sex |
| 0.335 |
| 0.308 |
| 0.105 |
| 0.749 |
| Female
(112) | 85 (75.9) |
| 44 (39.3) |
| 34 (30.4) |
| 70 (62.5) |
|
| Male
(174) | 123 (70.7) |
| 79 (45.4) |
| 38 (21.8) |
| 112 (64.4) |
|
| Size (cm) |
| 0.011 |
| 0.148 |
| 0.018 |
| 0.154 |
| <4
(109) | 70 (64.2) |
| 41 (37.6) |
| 19 (17.4) |
| 75 (68.8) |
|
| ≥4
(177) | 138 (78.0) |
| 82 (46.3) |
| 53 (29.9) |
| 107 (60.5) |
|
| Histologic
grade |
| 0.001 |
| 0.004 |
| <0.001 |
| 0.868 |
| Low
(249) | 173 (69.5) |
| 99 (39.8) |
| 49 (19.7) |
| 158 (63.5) |
|
| High
(37) | 35 (94.6) |
| 24 (64.9) |
| 23 (62.2) |
| 24 (64.9) |
|
| Depth of invasion
(pT category) |
| 0.001 |
| 0.400 |
| 0.039 |
| 0.052 |
| T1 or
T2 (65) | 37 (56.9) |
| 25 (38.5) |
| 10 (15.4) |
| 48 (73.8) |
|
| T3 or T4 (221) | 171 (77.4) |
| 98 (44.3) |
| 62 (28.1) |
| 134 (60.6) |
|
| Lymphovascular
invasion |
| <0.001 |
| <0.001 |
| 0.004 |
| 0.455 |
| Absent
(165) | 106 (64.2) |
| 56 (33.9) |
| 31 (18.8) |
| 102 (61.8) |
|
| Present
(121) | 102 (84.3) |
| 67 (55.4) |
| 41 (33.9) |
| 80 (66.1) |
|
| Perineural
invasion |
| 0.003 |
| 0.006 |
| 0.005 |
| 0.817 |
| Absent
(214) | 146 (68.2) |
| 82 (38.3) |
| 45 (21.0) |
| 137 (64.0) |
|
| Present
(72) | 62 (86.1) |
| 41 (56.9) |
| 27 (37.5) |
| 45 (62.5) |
|
| Lymph node
metastasis |
| <0.001 |
| <0.001 |
| 0.011 |
| 0.839 |
| Absent
(160) | 103 (64.4) |
| 54 (33.8) |
| 31 (19.4) |
| 101 (63.1) |
|
| Present
(126) | 105 (83.3) |
| 69 (54.8) |
| 41 (32.5) |
| 81 (64.3) |
|
| pTNM stage |
| 0.001 |
| 0.001 |
| 0.009 |
| 0.516 |
| I and
II (153) | 99 (64.7) |
| 52 (34.0) |
| 29 (19.0) |
| 100 (65.4) |
|
| III and
IV (133) | 109 (82.0) |
| 71 (53.4) |
| 43 (32.3) |
| 82 (61.7) |
|
| Recurrence or
metastasis after surgery |
| 0.004 |
| 0.110 |
| 0.818 |
| 0.095 |
| Absent
(233) | 161 (69.1) |
| 95 (40.8) |
| 58 (24.9) |
| 143 (61.4) |
|
| Present
(53) | 47 (88.7) |
| 28 (52.8) |
| 14 (26.4) |
| 39 (73.6) |
|
| Recurrence or
metastasis after adjuvant chemotherapy |
| 0.088 |
| 0.457 |
| 0.929 |
| 0.123 |
| Absent
(46) | 33 (71.7) |
| 24 (52.2) |
| 17 (37.0) |
| 26 (56.5) |
|
| Present
(21) | 19 (90.5) |
| 13 (61.9) |
| 8 (38.1) |
| 16 (76.2) |
|
β-catenin
β-catenin was strongly expressed in the membrane of
non-neoplastic colorectal epithelial cells. CRC cells showed
diffuse membranous expression or loss of membrane expression with
aberrant cytoplasmic or nuclear expression (Fig. 1). The optimal cut-off score was
determined as 95%. In the tumor center, 184 (64.3%) cases showed
diffuse membranous staining and 102 (35.7%) cases showed loss of
membrane expression (<95% staining, as defined by ROC curve
analysis). In the invasive front, 163 (57.0%) cases showed diffuse
membranous expression and 123 (43.0%) showed loss of membrane
expression. Loss of β-catenin expression in the tumor center
significantly correlated with poor differentiation (P<0.001),
presence of lymphovascular invasion (P=0.007), presence of lymph
node metastasis (P=0.012), and advanced tumor stage (P=0.034)
(Table I). Loss of β-catenin
expression in the invasive front significantly associated with poor
differentiation (P=0.004), presence of lymphovascular invasion
(P<0.001), presence of perineural invasion (P=0.006), presence
of lymph node metastasis (P<0.001) and advanced tumor stage
(P=0.001) (Table II). Loss of
membranous β-catenin expression in the tumor center did not
associate with DFS or OS (P=0.393 and P=0.087, respectively). In
the invasive front, loss of β-catenin expression tended to
associate with shorter DFS and OS (P=0.068 and P=0.060,
respectively).
Vimentin
Vimentin was not expressed in non-neoplastic
colorectal epithelial cells. In the CRC tissues, vimentin was
overexpressed in the cytoplasm of the cancer cells (Fig. 1). The optimal cut-off score was
determined as 5%, based on ROC curve analysis. In the tumor center,
40 (14.0%) cases showed overexpression of cytoplasmic vimentin. In
the invasive front, 72 (25.2%) cases showed vimentin
overexpression. Overexpression of vimentin in the tumor center
significantly related with female sex (P=0.010), poor
differentiation (P<0.001), deeper invasion depth (P=0.038),
presence of lymphovascular invasion (P=0.036), presence of
perineural invasion (P<0.001), presence of lymph node metastasis
(P=0.004) and advanced tumor stage (P=0.004) (Table I). In the invasive front,
overexpression of vimentin significantly correlated with large
tumor size (≥4 cm, P=0.018), poor differentiation (P<0.001),
deeper invasion depth (P=0.039), presence of lymphovascular
invasion (P=0.004), presence of perineural invasion (P=0.005),
presence of lymph node metastasis (P=0.011) and advanced tumor
stage (P=0.009) (Table II).
Overexpression of vimentin in the tumor center was not associated
with DFS or OS (P=0.389 and P=0.313, respectively), whereas in the
invasive front, overexpression of vimentin significantly correlated
with poor OS (P=0.028) but not DFS (P=0.359) (Fig. 2).
Snail
Snail was not expressed in non-neoplastic colorectal
epithelial cells. In the CRC cells, snail loss or overexpression
was observed in the cytoplasm and/or nucleus (Fig. 1). The optimal cut-off score was
determined as 5%, based on ROC curve analysis. Loss of snail
expression in the tumor center was observed in 137 (47.9%) cases,
and in the invasive front in 104 (31.3%) cases. Snail
overexpression in the tumor center was identified in 149 (52.1%)
cases and in the invasive front in 182 (68.7%) cases. Snail
overexpression tended to associate with superficial invasion depth
both in the tumor center and in the invasive front (P=0.044 and
P=0.052, respectively) (Tables I
and II). Neither loss of
expression nor overexpression of snail in the tumor center or in
the invasive front was significantly associated with survival
time.
CD44
CD44 was not expressed in non-neoplastic colorectal
epithelial cells, whereas membranous expression was seen in the CRC
cells (Fig. 1). Of the analyzed
tumors, 119 (58.4%) cases showed loss of CD44 and 167 (58.4%)
showed overexpression in the tumor center. In the invasive front,
189 (66.1%) cases showed loss of expression and 97 (33.9%) cases
showed overexpression. The optimal cut-off score was determined as
5%, based on ROC curve analysis. Loss of CD44 expression in the
tumor center significantly correlated with male sex (P=0.009),
deeper invasion depth (P=0.002), presence of perineural invasion
(P=0.012), presence of lymph node metastasis (P=0.005) and advanced
tumor stage (P=0.002) (Table
III). In the invasive front, loss of CD44 expression
significantly associated with deeper invasion depth (P=0.001),
presence of lymph node metastasis (P<0.001) and advanced tumor
stage (P<0.001) (Table IV). No
association between loss of CD44 expression and DFS or OS was noted
in either the tumor center or invasive front.
| Table III.Clinicopathological characteristics
and correlation with the cancer stem cell (CSC)-related protein
expression status in the tumor center. |
Table III.
Clinicopathological characteristics
and correlation with the cancer stem cell (CSC)-related protein
expression status in the tumor center.
|
| Loss of
expression | Overexpression |
|---|
|
|
|
|
|---|
| Characteristics
(n) | CD44 (n=119)
(%) | P-value | CD133 (n=93)
(%) | P-value |
|---|
| Age (years) |
| 0.649 |
| 0.752 |
| <60
(99) | 43 (43.4) |
| 31 (31.3) |
|
| ≥60
(187) | 76 (40.6) |
| 62 (33.2) |
|
| Sex |
| 0.009 |
| 0.914 |
| Female
(112) | 36 (32.1) |
| 36 (32.1) |
|
| Male
(174) | 83 (47.7) |
| 57 (32.8) |
|
| Size (cm) |
| 0.117 |
| 0.026 |
| <4
(109) | 39 (35.8) |
| 44 (40.4) |
|
| ≥4
(177) | 80 (45.2) |
| 49 (27.7) |
|
| Histologic
grade |
| 0.392 |
| 0.716 |
| Low
(249) | 106 (42.6) |
| 80 (32.1) |
|
| High
(37) | 13 (35.1) |
| 13 (35.1) |
|
| Depth of invasion
(pT category) |
| 0.002 |
| 0.245 |
| T1 or
T2 (65) | 16 (24.6) |
| 25 (38.5) |
|
| T3 or
T4 (221) | 103 (46.6) |
| 68 (30.8) |
|
| Lymphovascular
invasion |
| 0.519 |
| 0.492 |
| Absent
(165) | 66 (40.0) |
| 51 (30.9) |
|
| Present
(121) | 53 (43.8) |
| 42 (34.7) |
|
| Perineural
invasion |
| 0.012 |
| 0.321 |
| Absent
(214) | 80 (37.4) |
| 73 (34.1) |
|
| Present
(72) | 39 (54.2) |
| 20 (27.8) |
|
| Lymph node
metastasis |
| 0.005 |
| 0.805 |
| Absent
(160) | 55 (34.4) |
| 53 (33.1) |
|
| Present
(126) | 64 (50.8) |
| 40 (31.7) |
|
| pTNM stage |
| 0.002 |
| 0.569 |
| I and
II (153) | 51 (33.3) |
| 52 (34.0) |
|
| III and
IV (133) | 68 (51.1) |
| 41 (30.8) |
|
| Recurrence or
metastasis after surgery |
| 0.363 |
| 0.369 |
| Absent
(233) | 94 (40.3) |
| 73 (31.3) |
|
| Present
(53) | 25 (47.2) |
| 20 (37.7) |
|
| Recurrence or
metastasis after adjuvant chemotherapy |
| 0.987 |
| 0.220 |
| Absent
(46) | 24 (52.2) |
| 9 (19.6) |
|
| Present
(21) | 11 (52.4) |
| 7 (33.3) |
|
| Table IV.Clinicopathological characteristics
and correlation with the cancer stem cell (CSC)-related protein
expression status in the invasive front. |
Table IV.
Clinicopathological characteristics
and correlation with the cancer stem cell (CSC)-related protein
expression status in the invasive front.
|
| Loss of
expression | Overexpression |
|---|
|
|
|
|
|---|
| Characteristics
(n) | CD44 (n=189)
(%) | P-value | CD133 (n=133)
(%) | P-value |
|---|
| Age (years) |
| 0.709 |
| 0.933 |
| <60
(99) | 64 (64.6) |
| 20 (20.2) |
|
| ≥60
(187) | 125 (66.8) |
| 37 (19.8) |
|
| Sex |
| 0.124 |
| 0.611 |
| Female
(112) | 68 (60.7) |
| 24 (21.4) |
|
| Male
(174) | 121 (69.5) |
| 33 (19.0) |
|
| Size (cm) |
| 0.436 |
| 0.318 |
| <4
(109) | 69 (63.3) |
| 25 (22.9) |
|
| ≥4
(177) | 120 (67.8) |
| 32 (18.1) |
|
| Histologic
grade |
| 0.199 |
| 0.544 |
| Low
(249) | 168 (67.5) |
| 51 (20.5) |
|
| High
(37) | 21 (56.8) |
| 6 (16.2) |
|
| Depth of invasion
(pT category) |
| 0.001 |
| 0.712 |
| T1 or
T2 (65) | 32 (49.2) |
| 14 (21.5) |
|
| T3 or
T4 (221) | 157 (71.0) |
| 43 (19.5) |
|
| Lymphovascular
invasion |
| 0.307 |
| 0.738 |
| Absent
(165) | 105 (63.6) |
| 34 (20.6) |
|
| Present
(121) | 84 (69.4) |
| 23 (19.0) |
|
| Perineural
invasion |
| 0.325 |
| 0.253 |
| Absent
(214) | 138 (64.5) |
| 46 (21.5) |
|
| Present
(72) | 51 (70.8) |
| 11 (15.3) |
|
| Lymph node
metastasis |
| <0.001 |
| 0.068 |
|
Absent (160) | 91 (56.9) |
| 38 (23.8) |
|
|
Present (126) | 98 (77.8) |
| 19 (15.1) |
|
| pTNM stage |
| <0.001 |
| 0.102 |
| I and
II (153) | 86 (56.2) |
| 36 (23.5) |
|
| III and
IV (133) | 103 (77.4) |
| 21 (15.8) |
|
| Recurrence or
metastasis after surgery |
| 0.525 |
| 0.552 |
| Absent
(233) | 152 (65.2) |
| 48 (20.6) |
|
| Present
(53) | 37 (69.8) |
| 9 (17.0) |
|
| Recurrence or
metastasis after adjuvant chemotherapy |
| 0.953 |
| 0.689 |
| Absent
(46) | 31 (67.4) |
| 5 (10.9) |
|
| Present
(21) | 14 (66.7) |
| 3 (14.3) |
|
CD133
CD133 was not expressed in non-neoplastic colorectal
epithelial cells. In the CRC cells, CD133 loss or overexpression
was seen in either the apical portion of the tumor cells or the
shed cellular debris in the tumor glands (Fig. 1). Loss of CD133 expression in the
tumor center was observed in 195 (67.5%) cases and in the invasive
front in 229 (80.1%) cases. Overexpression of CD133 in the tumor
center was observed in 93 (32.5%) cases and in the invasive front
in 57 (19.9%) cases. The optimal cut-off score, based on ROC curve
analysis, was determined as 5%. In the tumor center, overexpression
of CD133 significantly correlated with small tumor size (<4 cm,
P=0.026). No other clinicopathologic features related with CD133
overexpression, both in the tumor center and in the invasive front
(Tables III and IV). Furthermore, neither in the tumor
center nor in the invasive front did loss of expression or
overexpression of CD133 significantly associate with DFS or OS.
Multi-marker combinations for predicting patient
outcome
Based on the correlation between the cumulative
altered expression of the EMT- and CSC-related proteins and the
tumor behavior of CRC, we performed univariate survival analyses on
a total of 66 combinations of the expression of 6 markers. To
determine the most accurate combination for predicting patient
prognosis, 5 markers (E-cadherin, β-catenin, vimentin, snail and
CD133) and the possible combinations thereof that had the lowest
P-values in the univariate survival analysis using the Kaplan-Meier
method were selected. For statistical analysis, the cases were
classified into 2 groups according to the number of cases with
altered protein expression. A total of 254 cases (88.8%) in the
tumor center and 243 cases (85.0%) in the invasive front were
designated as having a ‘low number of altered protein expression’,
that is, altered expressions of no more than 3 proteins. Thirty-two
cases (11.2%) in the tumor center and 43 cases (15.0%) in the
invasive front were designated as having a ‘high number of altered
protein expression’, classified as altered expression of 4 or 5
proteins. In the tumor center, a high number of altered protein
expression significantly correlated with poor differentiation
(P=0.007), presence of perineural invasion (P=0.010) and presence
of lymph node metastasis (P=0.026). In the invasive front, a high
number of altered protein expression significantly associated with
poor differentiation (P=0.007), presence of lymphovascular invasion
(P=0.001), presence of perineural invasion (P=0.006), presence of
lymph node metastasis (P<0.001), advanced tumor stage
(P<0.001) and post-operative recurrence or metastasis (P=0.032)
(Table V).
| Table V.Clinicopathological correlation
between low- and high- expression according to the number of
altered protein expression, E-cadherin, β-catenin, vimentin, snail
and CD133 altered expression in the tumor center and invasive
front. |
Table V.
Clinicopathological correlation
between low- and high- expression according to the number of
altered protein expression, E-cadherin, β-catenin, vimentin, snail
and CD133 altered expression in the tumor center and invasive
front.
|
| Tumor center | Invasive front |
|---|
|
|
|
|
|---|
| Characteristics
(n) | Low (N=254)
(%) | High (N=32)
(%) | P-value | Low (N=243)
(%) | High (N=43)
(%) | P-value |
|---|
| Age (years) |
|
| 0.413 |
|
| 0.698 |
| <60
(99) | 90 (35.4) | 9 (28.1) |
| 83 (34.2) | 16 (37.2) |
|
| ≥60
(187) | 164 (64.6) | 23 (71.9) |
| 160 (65.8) | 27 (62.8) |
|
| Sex |
|
| 0.838 |
|
| 0.957 |
| Female
(112) | 100 (39.4) | 12 (37.5) |
| 95 (39.1) | 17 (39.5) |
|
| Male
(174) | 154 (60.6) | 20 (62.5) |
| 148 (60.9) | 26 (60.5) |
|
| Size (cm) |
|
| 0.940 |
|
| 0.248 |
| <4
(109) | 97 (38.2) | 12 (37.5) |
| 96 (39.5) | 13 (30.2) |
|
| ≥4
(177) | 157 (61.8) | 20 (62.5) |
| 147 (60.5) | 30 (69.8) |
|
| Histologic
grade |
|
| 0.007 |
|
| 0.007 |
|
Low (249) | 226 (89.0) | 23 (71.9) |
| 217 (89.3) | 32 (74.4) |
|
| High
(37) | 28 (11.0) | 9 (28.1) |
| 26 (10.7) | 11 (25.6) |
|
| Depth of invasion
(pT category) |
|
| 0.745 |
|
| 0.274 |
| T1 or
T2 (65) | 57 (22.4) | 8 (25.0) |
| 58 (23.9) | 7 (16.3) |
|
| T3 or
T4 (221) | 197 (77.6) | 24 (75.0) |
| 185 (76.1) | 36 (83.7) |
|
| Lymphovascular
invasion |
|
| 0.350 |
|
| 0.001 |
| Absent
(165) | 149 (58.7) | 16 (50.0) |
| 150 (61.7) | 15 (34.9) |
|
| Present
(121) | 105 (41.3) | 16 (50.0) |
| 93 (38.3) | 28 (65.1) |
|
| Perineural
invasion |
|
| 0.010 |
|
| 0.006 |
| Absent
(214) | 196 (77.2) | 18 (56.3) |
| 189 (77.8) | 25 (58.1) |
|
| Present
(72) | 58 (22.8) | 14 (43.8) |
| 54 (22.2) | 18 (41.9) |
|
| Lymph node
metastasis |
|
| 0.026 |
|
| <0.001 |
| Absent
(160) | 148 (58.3) | 12 (37.5) |
| 148 (60.9) | 12 (27.9) |
|
| Present
(126) | 106 (41.7) | 20 (62.5) |
| 95 (39.1) | 31 (72.1) |
|
| pTNM stage |
|
| 0.054 |
|
| <0.001 |
| I and
II (153) | 141 (55.5) | 12 (37.5) |
| 141 (58.0) | 12 (27.9) |
|
| III and
IV (133) | 113 (44.5) | 20 (62.5) |
| 102 (42.0) | 31 (72.1) |
|
| Recurrence or
metastasis after surgery |
|
| 0.605 |
|
| 0.032 |
| Absent
(233) | 208 (81.9) | 25 (78.1) |
| 203 (83.5) | 30 (69.8) |
|
| Present
(53) | 46 (18.1) | 7 (21.9) |
| 40 (16.5) | 13 (30.2) |
|
| Recurrence or
metastasis after adjuvant chemotherapy |
|
| 0.522 |
|
| 0.312 |
| Absent
(46) | 40 (70.2) | 6 (60.0) |
| 36 (72.0) | 10 (58.8) |
|
| Present
(21) | 17 (29.8) | 4 (40.0) |
| 14 (28.0) | 7 (41.2) |
|
The Kaplan-Meier univariate survival analysis
indicated that the mean DFS and OS were significantly shortened in
patients with a high number of altered protein expression in the
invasive front compared to in those with a low number of altered
protein expressions (DFS, 66.2 vs. 84.6 months, P=0.003; OS, 60.8
vs. 77.9 months, P=0.005) (Fig. 3).
In the tumor center, no significant difference was found according
to the number of altered protein expression. Despite this adverse
effect observed in the univariate analysis, the prognostic value of
a high number of altered protein expression did not remain as an
independent prognostic indicator in the multivariate analysis.
Discussion
The multi-marker combination analysis of the altered
protein expression of E-cadherin, β-catenin, vimentin, snail and
CD133 in the invasive front showed more significant correlation
with DFS (P=0.003) and OS (P=0.005) than the single protein data.
These results are similar to those reported in a previous study on
EMT- and CSC-related proteins in gastric cancer (4). Notably, in that study, a combination
of 4 proteins (β-catenin, vimentin, snail and CD133), although each
was not individually correlated with DFS, significantly correlated
with DFS (P=0.005) and OS (P=0.007). Thus, concurrent alterations
of EMT- and CSC-related markers may have a greater effect on the
biological behavior of CRC than the alteration of a single EMT- or
CSC-related protein. Further evaluation for optimal selection of
protein combinations is needed for accurate prediction of patient
outcomes and for aiding in the clinicopathological diagnosis; based
on our results, a combination of E-cadherin, β-catenin, vimentin,
snail and CD133 seems to be a possible candidate.
To determine the role of EMT in CRC progression and
patient survival, the altered expression status of 4 EMT-related
markers, their association with clinicopathological characteristics
and patient outcomes were analyzed. Some studies have demonstrated
that altered EMT-related protein expression was more frequently
observed in the invasive front and that EMT occurs at the invasive
front (16,19). Ye et al (27) further demonstrated that expression
of EMT markers is often observed among carcinoma cells that are
closely opposed to stromal cells, and a variety of stromal
cell-derived signals synergize with one another to induce and
maintain EMT in primary tumors. In the present study, altered
expression of all EMT-related proteins was more frequently observed
in the invasive front than in the tumor center. In addition, the
altered expression of all EMT-related proteins, except snail,
significantly associated with unfavorable clinicopathological
factors in both the tumor center and the invasive front. According
to previous studies, altered expression of EMT-related markers
associates with tumor size, differentiation, growth patterns,
metastasis and poor prognosis (17,18,28).
In this study, loss of E-cadherin expression in the invasive front
significantly associated with poor OS (P=0.007) and showed a better
P-value compared with in the tumor center (P=0.028). In addition to
correlating with OS, loss of E-cadherin expression in the invasive
front significantly associated with shorter DFS (P=0.002), whereas
this was not observed for its expression in the tumor center.
Similarly, overexpression of vimentin in the invasive front, but
not in the tumor center, also significantly correlated with OS
(P=0.028). These findings support the model that EMT may occur in
the invasive front and associates with poor prognosis. Thus,
identification of altered expression of EMT-related proteins,
especially in the invasive front, is important to predict the
aggressive nature of the tumor and the prognosis of the
patient.
Despite CD44 and CD133 being the most extensively
researched colorectal CSC markers (29,30),
some controversies still exist over the relationship between CD44
and CD133 expression and their associations with
clinicopathological factors and patient outcome (26,31–34).
Recently, Zhou et al (35)
reported that CD44high/CD133high colon cancer
cells harbor CSC properties that may be related to the tumor growth
of colon cancer. However, in the present study, loss of CD44
expression significantly correlated with aggressive tumor
characteristics while altered expression of CD133 did not relate
with any tumor characteristics or with the patient survival time.
Similar to the results in the present study, Lugli et al
(25) demonstrated that loss of
CD44 expression was linked to more advanced T classification, lymph
node involvement, presence of vascular invasion, and an
infiltrating tumor border, whereas neither overexpression nor loss
of CD133 significantly associated with tumor progression or the
survival time. The discrepancies among the previous studies and
present study might be explained by differences in the selected
tumor tissue (whole tumor, representative tumor center, or invasive
front), as CSC-related proteins, especially CD44, show
heterogeneous expression throughout the tumor (25). In addition, it might be also
explained by the use of different methodologies and different
antibodies, and/or by the differences in the number of cases
investigated.
In conclusion, the present study found that altered
expressions of EMT-related proteins, as single markers,
significantly correlated with several unfavorable
clinicopathological factors and poor patient survival, especially
in the invasive front area. For the CSC-related proteins, loss of
CD44 expression was associated with unfavorable clinicopathological
factors, whereas altered expression of CD133 did not. However,
combined expressions of altered EMT- and CSC-related proteins
strongly associated with unfavorable clinicopathological factors
and poor patient outcomes. Besides serving as potential biomarkers
for aggressive tumor behavior and tumor recurrence or metastasis,
cancer cells expressing combined EMT- and CSC-related proteins may
represent possible candidates for molecular targeted treatments for
CRC in the future. Further studies are needed to elucidate the
relationships and molecular pathways between EMT and CSCs in
CRC.
Acknowledgements
The present study was supported by the National
Research Foundation of Korea (NRF) grant funded by the Korean
Government (MSIP) (no. 2008-0062279). Tissue samples were provided
by the Chonbuk National University Hospital, a member of the
National Biobank of Korea, which is supported by the Ministry of
Health, Welfare and Family Affairs.
References
|
1
|
Fitzmaurice C, Dicker D, Pain A, Hamavid
H, Moradi-Lakeh M, MacIntyre MF, Allen C, Hansen G, Woodbrook R,
Wolfe C, et al: Global Burden of Disease Cancer Collaboration: The
global burden of cancer 2013. JAMA Oncol. 1:505–527. 2015.
View Article : Google Scholar : PubMed/NCBI
|
|
2
|
Thiery JP and Sleeman JP: Complex networks
orchestrate epithelial-mesenchymal transitions. Nat Rev Mol Cell
Biol. 7:131–142. 2006. View
Article : Google Scholar : PubMed/NCBI
|
|
3
|
Hollier BG, Evans K and Mani SA: The
epithelial-to-mesenchymal transition and cancer stem cells: A
coalition against cancer therapies. J Mammary Gland Biol Neoplasia.
14:29–43. 2009. View Article : Google Scholar : PubMed/NCBI
|
|
4
|
Ryu HS, Park DJ, Kim HH, Kim WH and Lee
HS: Combination of epithelial-mesenchymal transition and cancer
stem cell-like phenotypes has independent prognostic value in
gastric cancer. Hum Pathol. 43:520–528. 2012. View Article : Google Scholar : PubMed/NCBI
|
|
5
|
Bezdekova M, Brychtova S, Sedlakova E,
Langova K, Brychta T and Belej K: Analysis of Snail-1, E-cadherin
and claudin-1 expression in colorectal adenomas and carcinomas. Int
J Mol Sci. 13:1632–1643. 2012. View Article : Google Scholar : PubMed/NCBI
|
|
6
|
Mitselou A, Galani V, Skoufi U, Arvanitis
DL, Lampri E and Ioachim E: Syndecan-1, epithelial-mesenchymal
transition markers (E-cadherin/beta-catenin) and
neoangiogenesis-related proteins (PCAM-1 and Endoglin) in
colorectal cancer. Anticancer Res. 36:2271–2280. 2016.PubMed/NCBI
|
|
7
|
Batlle E, Sancho E, Francí C, Domínguez D,
Monfar M, Baulida J and De García Herreros A: The transcription
factor snail is a repressor of E-cadherin gene expression in
epithelial tumour cells. Nat Cell Biol. 2:84–89. 2000. View Article : Google Scholar : PubMed/NCBI
|
|
8
|
Geiger TR and Peeper DS: Metastasis
mechanisms. Biochim Biophys Acta. 1796:293–308. 2009.PubMed/NCBI
|
|
9
|
Findlay VJ, Wang C, Watson DK and Camp ER:
Epithelial-to-mesenchymal transition and the cancer stem cell
phenotype: Insights from cancer biology with therapeutic
implications for colorectal cancer. Cancer Gene Ther. 21:181–187.
2014. View Article : Google Scholar : PubMed/NCBI
|
|
10
|
Kajiyama H, Shibata K, Terauchi M,
Yamashita M, Ino K, Nawa A and Kikkawa F: Chemoresistance to
paclitaxel induces epithelial-mesenchymal transition and enhances
metastatic potential for epithelial ovarian carcinoma cells. Int J
Oncol. 31:277–283. 2007.PubMed/NCBI
|
|
11
|
Yang AD, Fan F, Camp ER, van Buren G, Liu
W, Somcio R, Gray MJ, Cheng H, Hoff PM and Ellis LM: Chronic
oxaliplatin resistance induces epithelial-to-mesenchymal transition
in colorectal cancer cell lines. Clin Cancer Res. 12:4147–4153.
2006. View Article : Google Scholar : PubMed/NCBI
|
|
12
|
Mitra A, Mishra L and Li S: EMT, CTCs and
CSCs in tumor relapse and drug-resistance. Oncotarget.
6:10697–10711. 2015. View Article : Google Scholar : PubMed/NCBI
|
|
13
|
Thiery JP, Acloque H, Huang RY and Nieto
MA: Epithelial-mesenchymal transitions in development and disease.
Cell. 139:871–890. 2009. View Article : Google Scholar : PubMed/NCBI
|
|
14
|
Shioiri M, Shida T, Koda K, Oda K, Seike
K, Nishimura M, Takano S and Miyazaki M: Slug expression is an
independent prognostic parameter for poor survival in colorectal
carcinoma patients. Br J Cancer. 94:1816–1822. 2006. View Article : Google Scholar : PubMed/NCBI
|
|
15
|
Kroepil F, Fluegen G, Vallböhmer D, Baldus
SE, Dizdar L, Raffel AM, Hafner D, Stoecklein NH and Knoefel WT:
Snail1 expression in colorectal cancer and its correlation with
clinical and pathological parameters. BMC Cancer. 13:1452013.
View Article : Google Scholar : PubMed/NCBI
|
|
16
|
Brabletz T, Jung A, Reu S, Porzner M,
Hlubek F, Kunz-Schughart LA, Knuechel R and Kirchner T: Variable
beta-catenin expression in colorectal cancers indicates tumor
progression driven by the tumor environment. Proc Natl Acad Sci
USA. 98:10356–10361. 2001. View Article : Google Scholar : PubMed/NCBI
|
|
17
|
Ngan CY, Yamamoto H, Seshimo I, Ezumi K,
Terayama M, Hemmi H, Takemasa I, Ikeda M, Sekimoto M and Monden M:
A multivariate analysis of adhesion molecules expression in
assessment of colorectal cancer. J Surg Oncol. 95:652–662. 2007.
View Article : Google Scholar : PubMed/NCBI
|
|
18
|
Gagliardi G, Kandemir O, Liu D, Guida M,
Benvestito S, Ruers TG, Benjamin IS, Northover JM, Stamp GW, Talbot
IC, et al: Changes in E-cadherin immunoreactivity in the
adenoma-carcinoma sequence of the large bowel. Virchows Arch.
426:149–154. 1995. View Article : Google Scholar : PubMed/NCBI
|
|
19
|
Rosivatz E, Becker I, Bamba M, Schott C,
Diebold J, Mayr D, Höfler H and Becker KF: Neoexpression of
N-cadherin in E-cadherin positive colon cancers. Int J Cancer.
111:711–719. 2004. View Article : Google Scholar : PubMed/NCBI
|
|
20
|
Fanali C, Lucchetti D, Farina M, Corbi M,
Cufino V, Cittadini A and Sgambato A: Cancer stem cells in
colorectal cancer from pathogenesis to therapy: Controversies and
perspectives. World J Gastroenterol. 20:923–942. 2014. View Article : Google Scholar : PubMed/NCBI
|
|
21
|
Hong I, Hong SW, Chang YG, Lee WY, Lee B,
Kang YK, Kim YS, Paik IW and Lee H: Expression of the cancer stem
cell markers CD44 and CD133 in colorectal cancer: An
immunohistochemical staining analysis. Ann Coloproctol. 31:84–91.
2015. View Article : Google Scholar : PubMed/NCBI
|
|
22
|
Cherciu I, Bărbălan A, Pirici D,
Mărgăritescu C and Săftoiu A: Stem cells, colorectal cancer and
cancer stem cell markers correlations. Curr Health Sci J.
40:153–161. 2014.PubMed/NCBI
|
|
23
|
Hamilton SR, Bosman FT and Boffetta P:
Carcinoma of the colon and rectumWHO Classification of Tumours of
the Digestive System. 4th. Bosman FT, Carneiro F, Hruban RH and
Theise ND: IARC Press; Lyon: pp. 132–146. 2010
|
|
24
|
Edge SB, Byrd DR, Compton CC, Fritz AG,
Greene FL and Trotti A: AJCC Cancer Staging manual. 7th. Springer;
New York, NY: pp. 237–246. 2010
|
|
25
|
Lugli A, Iezzi G, Hostettler I, Muraro MG,
Mele V, Tornillo L, Carafa V, Spagnoli G, Terracciano L and Zlobec
I: Prognostic impact of the expression of putative cancer stem cell
markers CD133, CD166, CD44s, EpCAM, and ALDH1 in colorectal cancer.
Br J Cancer. 103:382–390. 2010. View Article : Google Scholar : PubMed/NCBI
|
|
26
|
Horst D, Kriegl L, Engel J, Kirchner T and
Jung A: CD133 expression is an independent prognostic marker for
low survival in colorectal cancer. Br J Cancer. 99:1285–1289. 2008.
View Article : Google Scholar : PubMed/NCBI
|
|
27
|
Ye X and Weinberg RA:
Epithelial-mesenchymal plasticity: A central regulator of cancer
progression. Trends Cell Biol. 25:675–686. 2015. View Article : Google Scholar : PubMed/NCBI
|
|
28
|
Fan F, Samuel S, Evans KW, Lu J, Xia L,
Zhou Y, Sceusi E, Tozzi F, Ye XC, Mani SA, et al: Overexpression of
snail induces epithelial-mesenchymal transition and a cancer stem
cell-like phenotype in human colorectal cancer cells. Cancer Med.
1:5–16. 2012. View
Article : Google Scholar : PubMed/NCBI
|
|
29
|
Dalerba P, Dylla SJ, Park IK, Liu R, Wang
X, Cho RW, Hoey T, Gurney A, Huang EH, Simeone DM, et al:
Phenotypic characterization of human colorectal cancer stem cells.
Proc Natl Acad Sci USA. 104:10158–10163. 2007. View Article : Google Scholar : PubMed/NCBI
|
|
30
|
Ricci-Vitiani L, Lombardi DG, Pilozzi E,
Biffoni M, Todaro M, Peschle C and De Maria R: Identification and
expansion of human colon-cancer-initiating cells. Nature.
445:111–115. 2007. View Article : Google Scholar : PubMed/NCBI
|
|
31
|
Horst D, Scheel SK, Liebmann S, Neumann J,
Maatz S, Kirchner T and Jung A: The cancer stem cell marker CD133
has high prognostic impact but unknown functional relevance for the
metastasis of human colon cancer. J Pathol. 219:427–434. 2009.
View Article : Google Scholar : PubMed/NCBI
|
|
32
|
Choi D, Lee HW, Hur KY, Kim JJ, Park GS,
Jang SH, Song YS, Jang KS and Paik SS: Cancer stem cell markers
CD133 and CD24 correlate with invasiveness and differentiation in
colorectal adenocarcinoma. World J Gastroenterol. 15:2258–2264.
2009. View Article : Google Scholar : PubMed/NCBI
|
|
33
|
Huh JW, Kim HR, Kim YJ, Lee JH, Park YS,
Cho SH and Joo JK: Expression of standard CD44 in human colorectal
carcinoma: Association with prognosis. Pathol Int. 59:241–246.
2009. View Article : Google Scholar : PubMed/NCBI
|
|
34
|
Zavrides HN, Zizi-Sermpetzoglou A,
Panousopoulos D, Athanasas G, Elemenoglou I and Peros G: Prognostic
evaluation of CD44 expression in correlation with bcl-2 and p53 in
colorectal cancer. Folia Histochem Cytobiol. 43:31–36.
2005.PubMed/NCBI
|
|
35
|
Zhou JY, Chen M, Ma L, Wang X, Chen YG and
Liu SL: Role of CD44high/CD133high HCT-116
cells in the tumorigenesis of colon cancer. Oncotarget.
7:7657–7666. 2016. View Article : Google Scholar : PubMed/NCBI
|