Introduction
Melanoma is the most lethal form of skin cancer and
represents more than 75% of skin cancer-related deaths (1). Metastatic melanoma (MM) is poorly
responsive to treatment based on conventional chemotherapy,
resulting in a 5-year survival rate of only 15% (2). Molecular alterations associated with
sun exposure (3) or DNA methylation
(4) have been identified as linked
to melanoma development. In particular, gene mutations in the
RAS/RAF/MEK/ERK or mitogen-activated protein kinase (MAPK) pathway
have been detected (5) and have
provided new targets for therapy.
Therapy targeting the mitogen-activated protein
kinase (MAPK) pathway, with small molecules that inhibit the signal
transmission between BRAF and MEK, have been effective in the
clinical outcomes of the disease. Selective inhibitors of
oncogenically activated BRAF, vemurafenib and dabrafenib, have
demonstrated major tumor responses in ~50% of patients (6).
Vemurafenib achieved more than a two-third decrease
in the risk for both death and disease progression as compared with
dacarbazine. However, the majority of patients exhibit drug
resistance after 6–8 months due to several resistance mechanisms
(7). Although these mechanisms are
only partially understood, MAPK reactivation seems to be primarily
responsible for acquired resistance, via B-RAF copy number gains,
aberrant B-RAF splicing, mutations in N-RAS or MEK1/2 and
upregulation of receptor tyrosine kinases (8–11).
MM treatment with a combination of B-RAF and MEK
inhibitors (dabrafenib plus trametinib, and vemurafenib plus
cobimetinib, respectively) have been used as a strategy to overcome
drug resistance development (12).
Approximately half of melanoma patients treated with a combination
of dabrafenib/trametinib exhibit drug resistance at 11–12 months
(median progression-free survival, 11 months; median duration of
response, 12.9 months) (13),
although resistance remains a hurdle to achieve better patient
outcomes.
Recently, we demonstrated that the B-RAF/MEK/AurkA
inhibitor triple-combination treatment was more effective for
inhibiting melanoma cell growth, using a 3D-human melanoma model
(14). However, single or combined
treatment was effective only on polygonal-shaped melanoma cells
present at the epidermal/dermal junction site, while spindle-shaped
melanoma cells, detected in the dermal stratum, continued to be
alive and to proliferate.
In the present study, we characterized the phenotype
of melanoma cells resistant to dabrafenib. To this end, we selected
in vitro melanoma cells resistant to dabrafenib [B-RAF
inhibitor (B-RAFi)] from 3 different dabrafenib-sensitive melanoma
cell lines (A375, 397 and 624.38) and we performed a comparative
phenotype study between dabrafenib-resistant and -sensitive
melanoma cells, under drug selective pressure, since the resistance
to B-RAFV600E inhibition in melanoma is reversible and
adaptive (15).
Materials and methods
Cell culture and reagents
A375, 624.38 and 397 melanoma cell lines, kindly
provided by Dr F. M. Marincola and Dr M. Bettinotti (NIH, Bethesda,
MD, USA), were used. All cell lines were cultured in RPMI-1640
medium, supplemented with 3 mM L-glutamine (both from
Invitrogen-Gibco, Paisley, UK), 2% penicillin/streptomycin and 10%
fetal bovine serum (FBS). The cell cultures were incubated at 37°C
in a humidified 5% CO2 atmosphere. Dabrafenib and
trametinib were purchased from Selleck (Munich, Germany).
Colony formation assay
A375 (50 cells/cm2), 624.38 (50
cells/cm2) and 397 (250 cells/cm2) melanoma
cells were plated in 24-multi-wells, previously coated with 1%
gelatin, with complete medium containing dabrafenib (30 nM) or not
containing the drug. The medium was replenished every 2 days. After
7 days, the cells were fixed in 4% paraformaldehyde (PFA) and
stained with 0.15% crystal violet. Plates were imaged by scanner
and colonies were imaged on a Leica DMI6000 inverted microscope
(Leica, Mannheim, Germany). The observed number of colonies was
determined from 5 independent areas using ImageJ software
(http://rsbweb.nih.gov/ij/).
Selection and expansion of melanoma
cell lines resistant to B-RAF inhibitors
Dabrafenib-resistant melanoma cells were selected by
growing all 3 melanoma cell lines in medium containing increased
concentrations of dabrafenib for 4 weeks. A375 and 397 melanoma
cell lines resistant to 30 nM dabrafenib were selected, while for
the 624.38 cell line melanoma cells resistant to 100 nM dabrafenib
were selected.
CyQUANT assay
Cells (1,500/well) were seeded in triplicate in
96-well plates. After 24 h, the cells were treated with different
drug concentrations. The monitoring of the number of cells
following 6 days of drug treatment was performed using CyQUANT cell
proliferation assay kit, according to the manufacturer's procedure
(Invitrogen, Paisley, UK). Dose-response data were analyzed by
GraphPad Prism version 5.00 for Windows (GraphPad Software) to
determine the IC50 values.
Cell cycle analysis
Cells were harvested in phosphate-buffered saline
(PBS) containing 2 mM EDTA, washed once with PBS and fixed in
ethanol at 96°C. After washing in PBS, 1×10⁶ cells were
incubated with 5 µg/ml propidium iodide (PI) (Sigma Chemical Co.,
St. Louis, MO, USA) plus 25 µl RNase (1 mg/ml), overnight at 4°C in
the dark. Stained nuclei were analyzed using FACSAria II
(Becton-Dickinson, Franklin Lakes, NJ, USA). Data were analyzed
using a ModFit III (Verity, Topsham, ME, USA) cell cycle analysis
programme.
Next generation sequencing (NGS) on
the Ion Torrent™ platform
Genomic DNA was isolated from melanoma cell lines by
standard methods and quantified using the Qubit®
fluorometer (Life Technologies, Gent, Belgium). For library
construction, DNA (10 ng) was amplified using the Ion Torrent
AmpliSeq Hotspot V2/CHPv2 Cancer Panel (Life
Technologies-ThermoFisher Scientific, Waltham, MA, USA). An
amplicon library was generated for sequencing ~2,800 mutations in
the 50 most common oncogenes and tumor-suppressor genes. The
amplicons were digested and amplified using the Ion AmpliSeq™
Library kit 2.0 (Life Technologies), according to the
manufacturer's instructions. Finally, the template was loaded on an
Ion 316™ chip and sequenced on a PGM™ sequencer with the Ion PGM™
sequencing 200 kit v2 (Life Technologies), according to the
manufacturer's protocols. Only mutations reported in the Human Gene
Mutation Database (HGMD) at: http://www.hgmd.cf.ac.uk/ac/index.php and in the
Catalogue Of Somatic Mutations In Cancer (COSMIC) at: http://www.sanger.ac.uk/genetics/CGP/cosmic/ were
taken into account; silent or intronic mutations were not
considered. All significant gene mutations identified on the Ion
AmpliSeq Cancer Hotspot Panel were confirmed by Sanger sequencing
of gene-specific amplicons (primer pairs provided on request).
Briefly, polymerase chain reaction (PCR) was performed on 20 ng of
genomic DNA in a Veriti® 96-Well Fast Thermal Cycler
(Life Technologies-ThermoFisher Scientific). All PCR-amplified
products were directly sequenced using an automated
fluorescence-cycle sequencer (ABI3130; Life
Technologies-ThermoFisher Scientific). Sequencing analysis was
conducted in duplicate and in both directions (forward and reverse)
for all evaluated samples.
Morphology and phenotypic analysis of
melanoma cells
Cells were grown at 80% confluence, fixed in 4% PFA
and stained with 0,15% crystal violet. Cell images were captured
using an inverted microscope (Leica, DMI6000). Cells were stained
following incubation for 30 min at +4°C with the following
antibodies (5 µl/ml): mouse anti-human CD90 PE-Cy5, mesenchymal
marker (BD Biosciences, Franklin Lakes, NJ, USA), human E-cadherin
(CD324) APC, human CD133/2 (293C3)-PE (both from Miltenyi Biotec,
GmbH, Bergisch Gladbach, Germany), mouse anti-human CD20 FITC and
mouse anti-human CD44 FITC (both from BD Biosciences). After being
washed with PBS, the samples were analyzed by FACS. The fold-change
of the mean fluorescence intensity (MFI) values was used to show
the differences in surface marker expression between drug-sensitive
and -resistant melanoma cells. It was calculated from 3 independent
experiments.
TGF-β1 treatment
In order to induce EMT, all 3 melanoma cell lines
(A375, 624.38 and 397) were treated with 2 ng/ml TGF-β1 (Abcam,
Milan, Italy) for 48 h and used for further investigations.
Quantitative real-time polymerase
chain reaction (qRT-PCR) analysis
Total RNA (300 ng) from the melanoma cell lines was
converted to cDNA using M-MLV reverse transcriptase (Invitrogen,
Life Technologies, Monza, MB, Italy). Primers used for E-cadherin
were: forward, 5′-ACCACCTCCACAGCCACCGT-3′ and reverse,
5′-GTCCAGTTGGCACTCGCCCC-3′; β-actin was used as an internal control
(forward 5′-TTCTACAATGAGCTGCGTGTG-3′ and reverse
5′-GGGGTGTTGAAGGTCTCAAA-3′). Experiments were performed in
triplicate. qRT-PCR was carried out on an ABI PRISM 7900HT sequence
detection system), using PowerUp SYBR-Green Master Mix (both from
Applied Biosystems, Life Technologies, Grand Island, CA, USA).
Wound healing assay
Cells were seeded to confluency in 6-well plates,
and a wound was made in the center of the cell monolayer using a
sterile 200-µl pipette tip. The monolayer was rinsed 3 times with
PBS and placed in RPMI-1640 medium. Phase contrast images were
captured after 24 h and a digital image of the scar was captured at
a magnification of ×10 (Leica, DMI6000). All experiments were
performed in triplicates.
Immunofluorescence assay
Cells were grown in RPMI on glass coverslips (22×22
mm) and after 24 h, fixed in 4% PFA and permeabilized in PBS
containing 0.1% of Triton X-100. After blocking with BSA 5% in PBS
for 20 min at RT, cells were incubated with the following primary
antibodies: vimentin (ab8069; 1:150; Abcam) and Oct4 (Oct4 C-10
antibody; 1:500; Santa Cruz Biotechnology, Inc., TX, USA) at 4°C
overnight. After extensive washing, fluorescent secondary
antibodies goat anti-rabbit (ab96885; Abcam), goat anti-mouse FITC
(ImmunoReagents, Inc., Raleigh, NC, USA), diluted 1/500 in PBS were
added for 90 min at +4°C. The cells were then counterstained with
4,6-diamidino-2-phenylindole (DAPI) (1:100 in PBS) for 7 min at
+4°C, to stain the nuclei. The coverslips were washed again and
mounted on slides using fluorescence mounting medium (Dako
Diagnostics, Mississauga, ON, USA). Fluorescent images were
captured using a Nikon upright microscope. The same
immunofluorescence protocol was used for 3D human tissues (14), which were successively stained with
hematoxylin and eosin (H&E). Briefly, 3D human tissues from a
differentiated and full-thickness skin reconstruction model of A375
melanoma cells were purchased from MatTek (Ashland, MA, USA). The
3D tissues were fed through the basolateral (bottom) surface, and
incubated in duplicate with serum-free medium containing 0.2%
dimethyl sulfoxide (DMSO) as a control or dabrafenib plus
trametinib. The medium was replenished every other day, and the 3D
tissues were collected on days 0, 9 and 12 from the beginning of
treatment and fixed with 4% PFA. Tissues were paraffin-embedded,
serial-sectioned, deparaffinized in xylene and rehydrated through
graded decreasing concentrations of alcohol and used for
immunofluorescence studies and H&E staining.
Protein extracts
Cells were lysed in lysis buffer [1% Nonidet P-40,
150 mmol/l NaCl, 10 mmol/l Tris (pH 7.4), 1 mmol/l EDTA, 1 mmol/l
EGTA (pH 8.0), 0.2 mmol/l sodium orthovanadate, 1X inhibitor
cocktail) (Sigma-Aldrich, St. Louis, MO, USA) for 30 min at 4°C
with constant agitation. Insoluble material was removed by
centrifugation (16,000 × g at 4°C) for 15 min and the total protein
concentration was determined in the supernatant by Bradford
assay.
Western blot analysis
Western blotting was performed according to standard
procedures. Rabbit monoclonal antibodies against Snail (diluted
1:1,000), rabbit polyclonal against Twist1 (diluted 1:1,000), and
β-actin (diluted 1:1,000) were used. All the antibodies were
purchased from Cell Signaling Technology (Danvers, MA, USA).
Detection was achieved by HRP-conjugated anti-rabbit (1:10,000;
Cell Signaling Technology) antibodies. Immune complexes were
visualized by an enhanced chemiluminescence system (ECL Advance™;
Amersham Pharmacia Biotech, Piscataway, NJ, USA). β-actin was used
as a loading control. The image analysis was performed using ImageJ
software (http://rsbweb.nih.gov/ij/).
Statistical analysis
Values are displayed as the mean ± SEM of
measurements of at least 3 independently performed experiments to
avoid possible variation of cell cultures. Student's t-test was
employed, and P<0.05 was considered to be statistically
significant.
Results
Genesis of melanoma cells resistant to
B-RAF inhibition
In order to characterize the phenotype of melanoma
cells resistant to B-RAFV600E inhibition, we generated
melanoma cells resistant to dabrafenib (a B-RAFi) using 3 melanoma
cell lines, A375, 397 and 624.38, all carrying a
B-RAFV600E mutation and sensitive to dabrafenib.
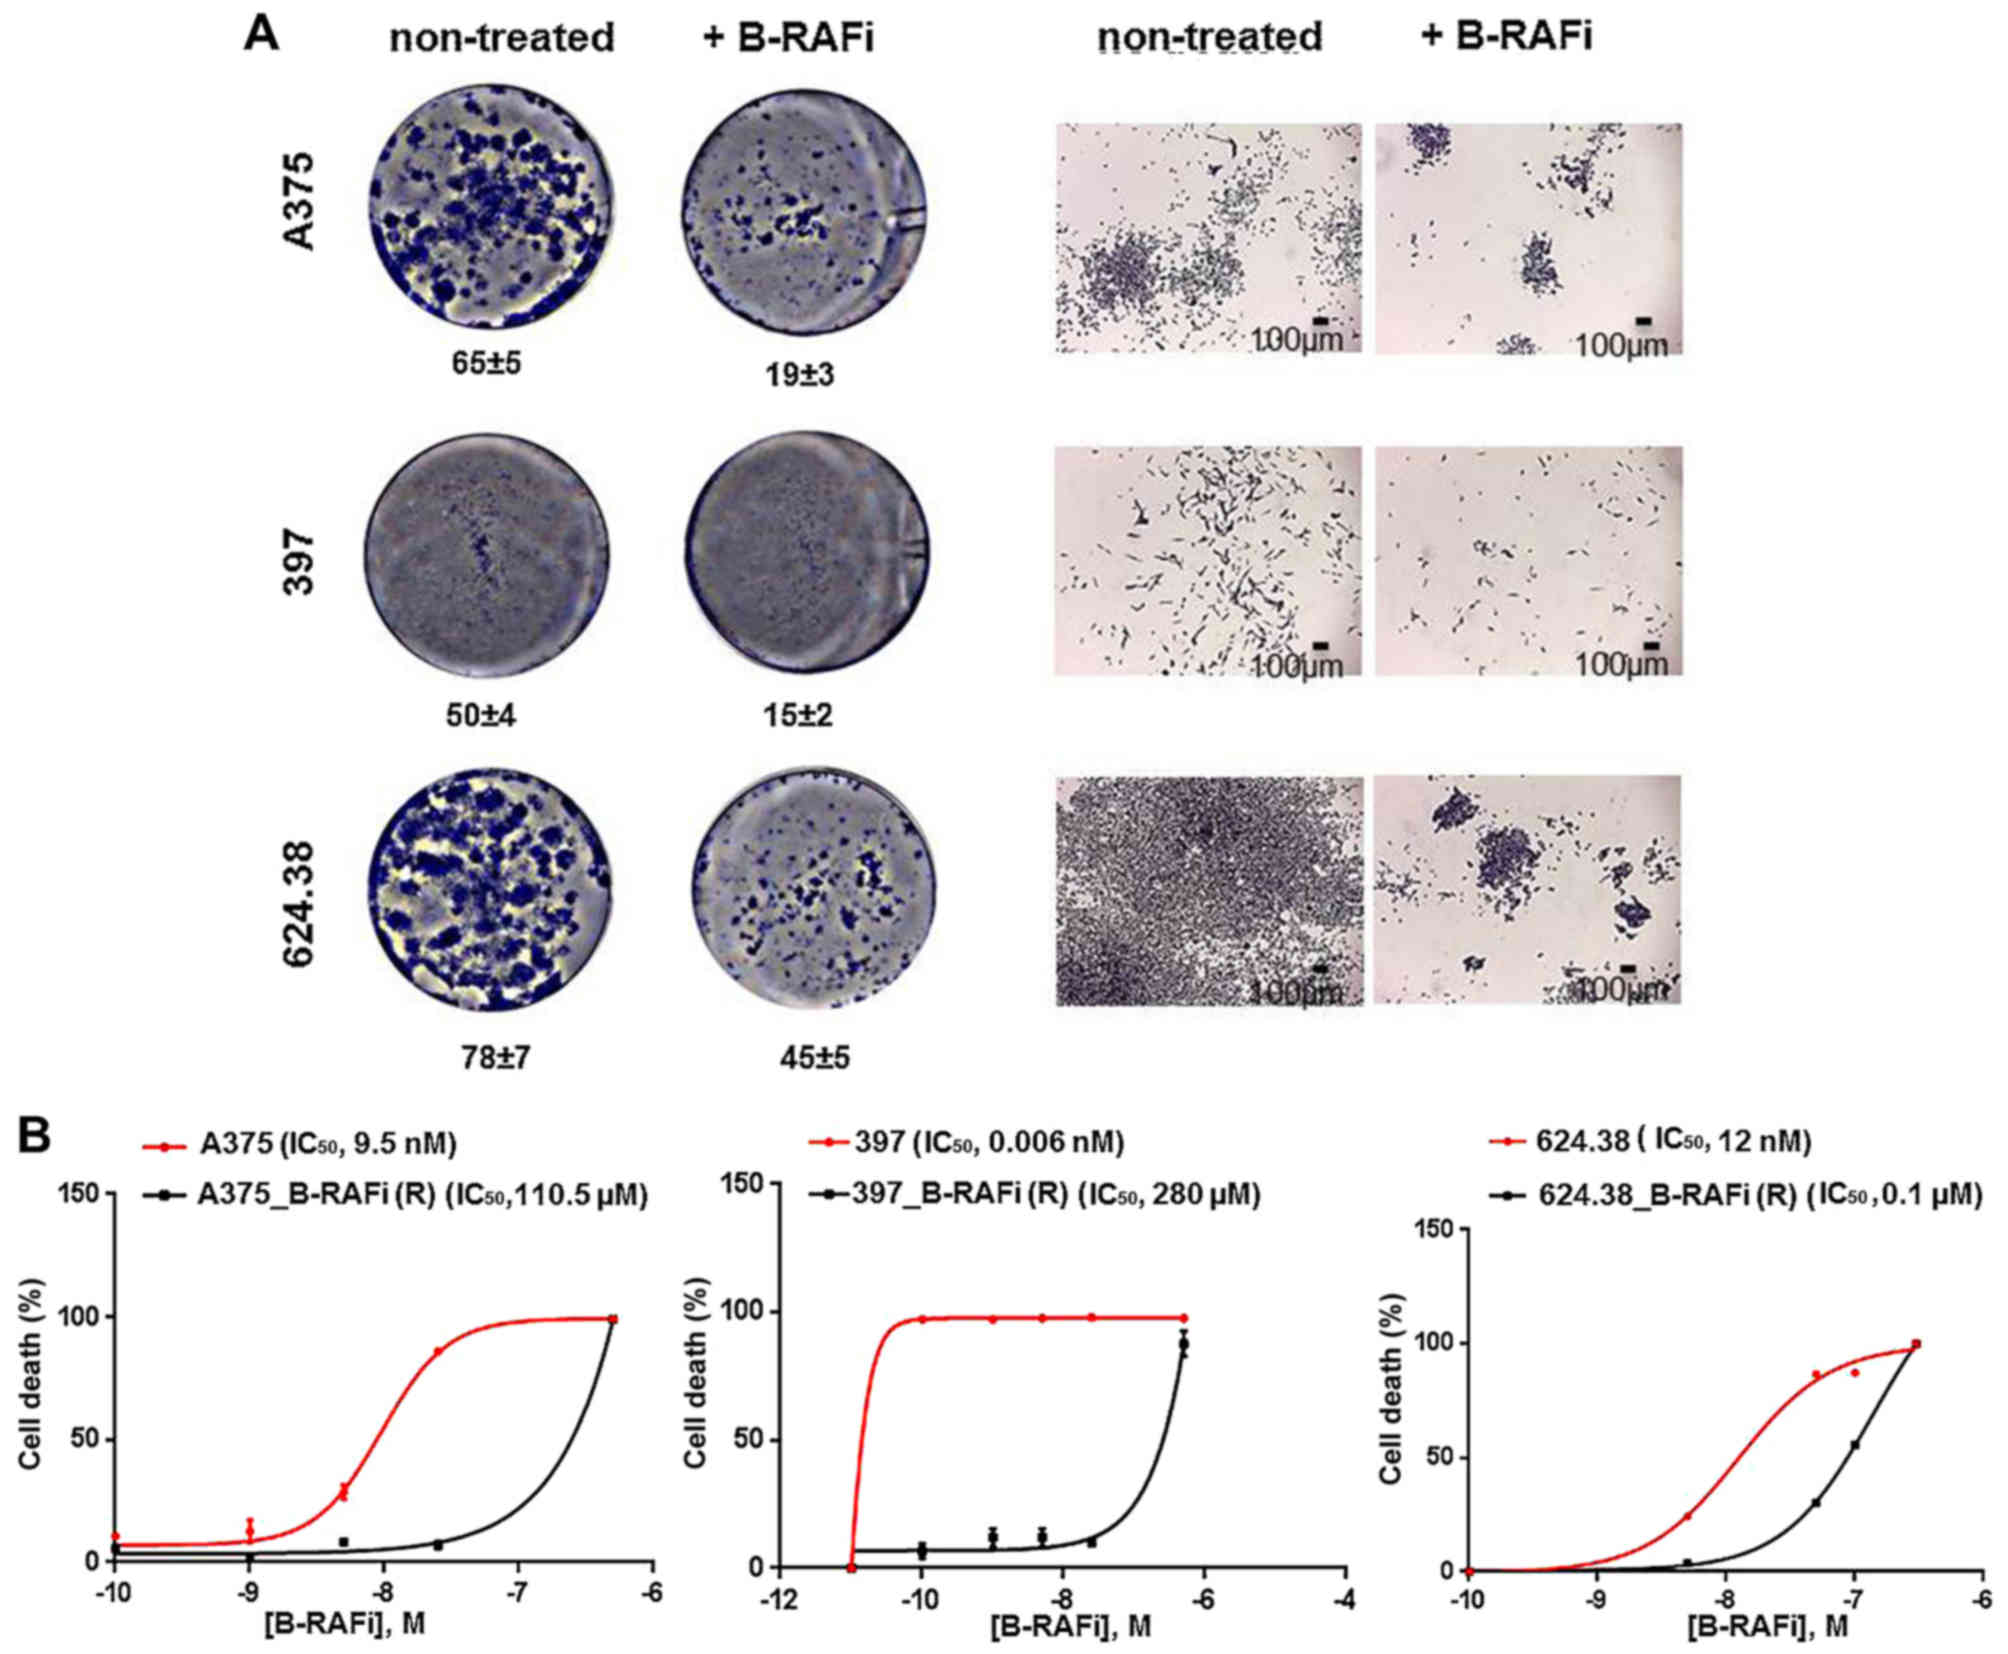
As shown in Fig. 1A,
cells plated at a low density in the presence of 30 nM dabrafenib
were able to form only a few sizeable colonies, after 7 days,
comparable to the ones observed in the untreated cells, as
expected.
We selected and expanded the few cells able to
proliferate and form colonies under drug treatment, by growing them
in medium containing increasing concentrations of dabrafenib, as
described in Materials and methods. The resulting
dabrafenib-resistant melanoma cells are indicated as A375_B-RAFi
(R), 397_B-RAFi (R) and 624.38_B-RAFi (R). Since the resistance to
B-RAFV600E inhibition in melanoma is reversible and
adaptive (15), the resistant cells
were characterized, after their expansion, under drug selective
pressure.
In order to confirm that A375_B-RAFi (R), 397_B-RAFi
(R) and 624.38_B-RAFi (R) cells were resistant to dabrafenib
treatment, the IC50 value was assessed, using the
survival colorimetric assay. The A375 and the derived
dabrafenib-resistant melanoma cells, A375_B-RAFi (R), were treated
at increasing concentrations of B-RAFi (0, 0.1, 1, 5, 25 and 100
nM) for 6 days. Dose-response analysis revealed that
dabrafenib-resistant cells showed an IC50 value of 110.5
µM compared to the 9.5 nM value determined for the
dabrafenib-sensitive A375 counterparts (Fig. 1B). Similarly, a dabrafenib
IC50 value of 280 µM was determined for the 397_B-RAFi
(R) cells, while a 0.006 nM value was assessed for the 397
drug-sensitive cells (Fig. 1B).
Finally, 624.38 and 624.38_B-RAFi (R) cells were treated at
increasing concentrations of B-RAFi (0, 5, 25, 50, 100 and 500 nM)
for 6 days. A dabrafenib IC50 value of 0.1 µM was
determined for the 624.38_B-RAFi (R) cells, while a 12 nM value was
assessed for the 624.38 drug-sensitive cells (Fig. 1B).
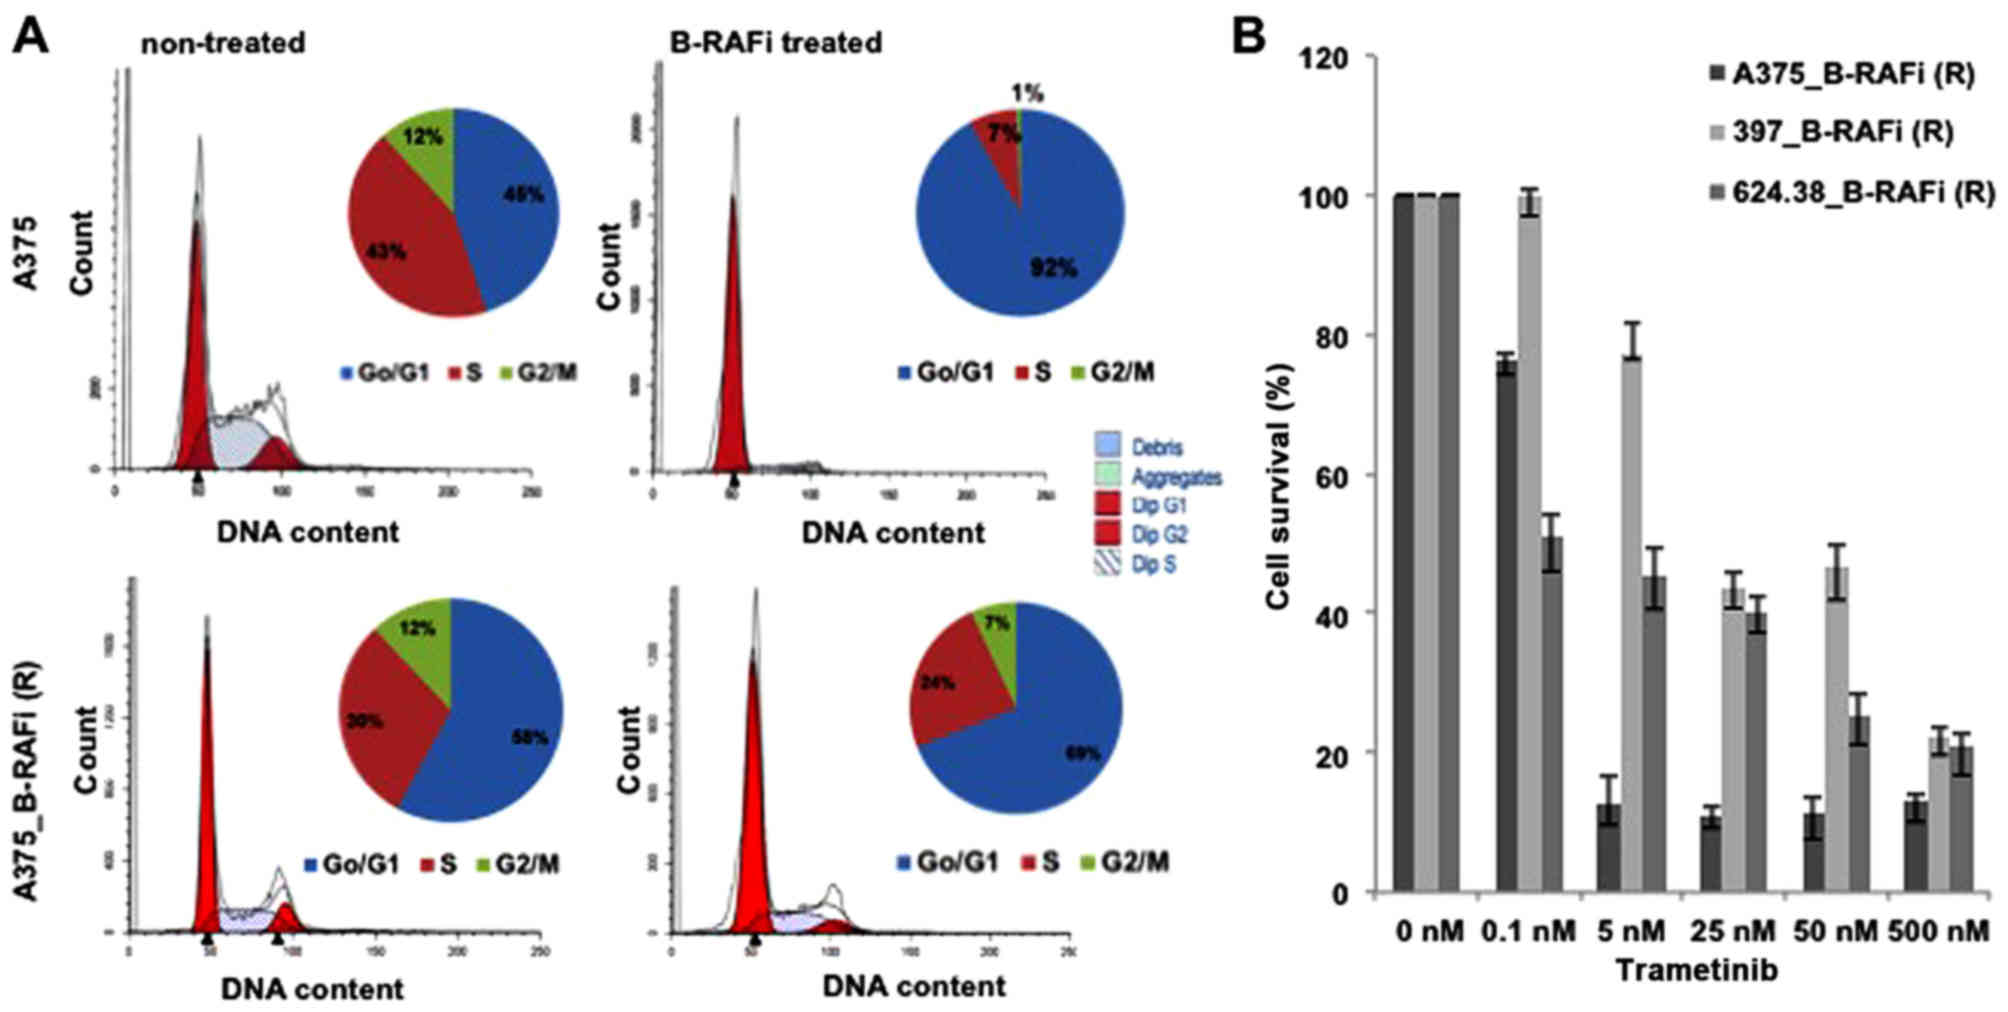
The effect on dabrafenib on the cell cycle profile
was also examined by FACS analysis. Cell cycle profiles with PI
revealed a marked difference between sensitive and resistant
melanoma cells to dabrafenib. A significant accumulation of cells
in the G0/G1 phase (91.9 vs. 45.1%, dabrafenib-treated vs.
untreated, respectively) with a concomitant decrease in the number
of cells in the G2/M phase (0.69 vs. 11.8%, dabrafenib-treated vs.
untreated, respectively) was detected in the A375 cells when
treated with the B-RAF inhibitor. Conversely, no significant G0/G1
arrest in response to dabrafenib in the A375_B-RAFi (R) cells was
observed (Fig. 2A). Similarly, an
accumulation of cells in the G0/G1 phase with a decreased number of
cells in the G2/M phase was observed for both 397 and 624.38
melanoma cells, when treated with the B-RAFi, while no significant
cell cycle profile difference was detected for the resistant 397_
B-RAFi (R) and 624.38_B-RAFi (R) melanoma cell lines, upon B-RAF
inhibition (data not shown).
Finally, in order to ascertain whether the
resistance to dabrafenib in these melanoma cells was associated
with the reactivation of the MAPK signaling pathway (16), we assessed whether the treatment of
these cells with MEK inhibitors compromised the viability of
dabrafenib-resistant cells. As shown in Fig. 2B, these cells were sensitive to
trametinib, a MEK inhibitor, supporting the association of
resistance to dabrafenib with the reactivation of MAPK
signaling.
Mutation analysis of melanoma cell
lines
To assess the occurrence of discrepancies in
mutation patterns during the development of the resistance status,
dabrafenib-sensitive and -resistant melanoma cell lines were
analyzed using the high throughput Ion Torrent sequencing
technology, as described in Materials and methods. For the
mutational screening the Ion AmpliSeq Cancer Hotspot Panel v2,
containing >200 primer pairs producing short (average of ~150
bp) amplicons which target hotspot regions of 50 main oncogenes and
tumor-suppressor genes involved in tumorigenesis (Table I) was used.
 | Table I.Gene mutations identified on the Ion
AmpliSeq Cancer Hotspot Panel and confirmed by Sanger sequencing of
gene-specific amplicons. |
Table I.
Gene mutations identified on the Ion
AmpliSeq Cancer Hotspot Panel and confirmed by Sanger sequencing of
gene-specific amplicons.
| ABL1 | EGFR | GNAS | KRAS | PTPN11 |
| AKT1 | ERBB2 | GNAQ | MET | RB1 |
| ALK | ERBB4 | HNF1A | MLH1 | RET |
| APC | EZH2 | HRAS | MPL | SMAD4 |
| ATM | FBXW7 | IDH1 | NOTCH1 | SMARCB1 |
| BRAF | FGFR1 | JAK2 | NPM1 | SMO |
| CDH1 | FGFR2 | JAK3 | NRAS | SRC |
| CDKN2A | FGFR3 | IDH2 | PDGFRA | STK11 |
| CSF1R | FLT3 | KDR | PIK3CA | TP53 |
| CTNNB1 | GNA11 | KIT | PTEN | VHL |
All variants detected by NGS were confirmed through
PCR-based Sanger sequencing. As shown in Table II, no difference in mutation
patterns was observed between the sensitive and resistant cell
lines, strongly suggesting that development of resistance was
independent of the acquisition of genetic alterations in the 50
most common oncogenes and tumor-suppressor genes examined (Table I). Moreover, mutations in the
CDKN2A and TP53 genes represented the main sequence
variants associated with the BRAFV600E mutation in our
cell line series (Table II),
further confirming the role of such crucial genes in controlling
cell proliferation and survival in melanoma genesis.
| Table II.Mutations in the melanoma cell
lines. |
Table II.
Mutations in the melanoma cell
lines.
| Gene | Location | Function | Codon | Exon | Protein | Coding |
|---|
| A375 and
A375_B-RAFi (R) |
|
|
|
|
|
|
|
BRAF | Exonic | Missense | GAG | 15 | p.Val600Glu | c.1799T>A |
|
CDKN2A | Exonic | Non-sense | TAG | 2 | p.Glu61Ter | c.181G>T |
|
CDKN2A | Exonic | Non-sense | TAG | 2 | p.Glu69Ter | c.205G>T |
|
TP53 | Exonic | Missense | CGC | 4 | p.Pro72Arg | c.215C>G |
| 397 and 397_B-RAFi
(R) |
|
|
|
|
|
|
|
BRAF | Exonic | Missense | GAG | 15 | p.Val600Glu | c.1799T>A |
|
CDKN2A | Exonic | Homozygous
deletion | 307 bp | 2 | p.?
(loss) |
c.151_457del307 |
|
CTNNB1 | Exonic | Missense | TAT | 3 | p.Ser45Tyr | c.134C>A |
|
KDR | Exonic | Missense | CAT | 11 | p.Gln472His | c.1416A>T |
|
NOTCH1 | Exonic | Non-frameshift
deletion | GTG | 26 | p.Val1578del |
c.4732_4734delGTG |
|
TP53 | Exonic | Missense | CGC | 4 | p.Pro72Arg | c.215C>G |
| 624.38 and
624.38_B-RAFi (R) |
|
|
|
|
|
|
|
BRAF | Exonic | Missense | GAG | 15 | p.Val600Glu | c.1799T>A |
|
KDR | Exonic | Missense | CAT | 11 | p.Gln472His | c.1416A>T |
|
SMARCB1 | Exonic | Missense | AAA | 2 | p.Thr72Lys | c.215C>A |
|
TP53 | Exonic | Missense | CGC | 4 | p.Pro72Arg | c.215C>G |
|
TP53 | Exonic | Missense | TGG | 8 | p.Cys275Trp | c.825T>G |
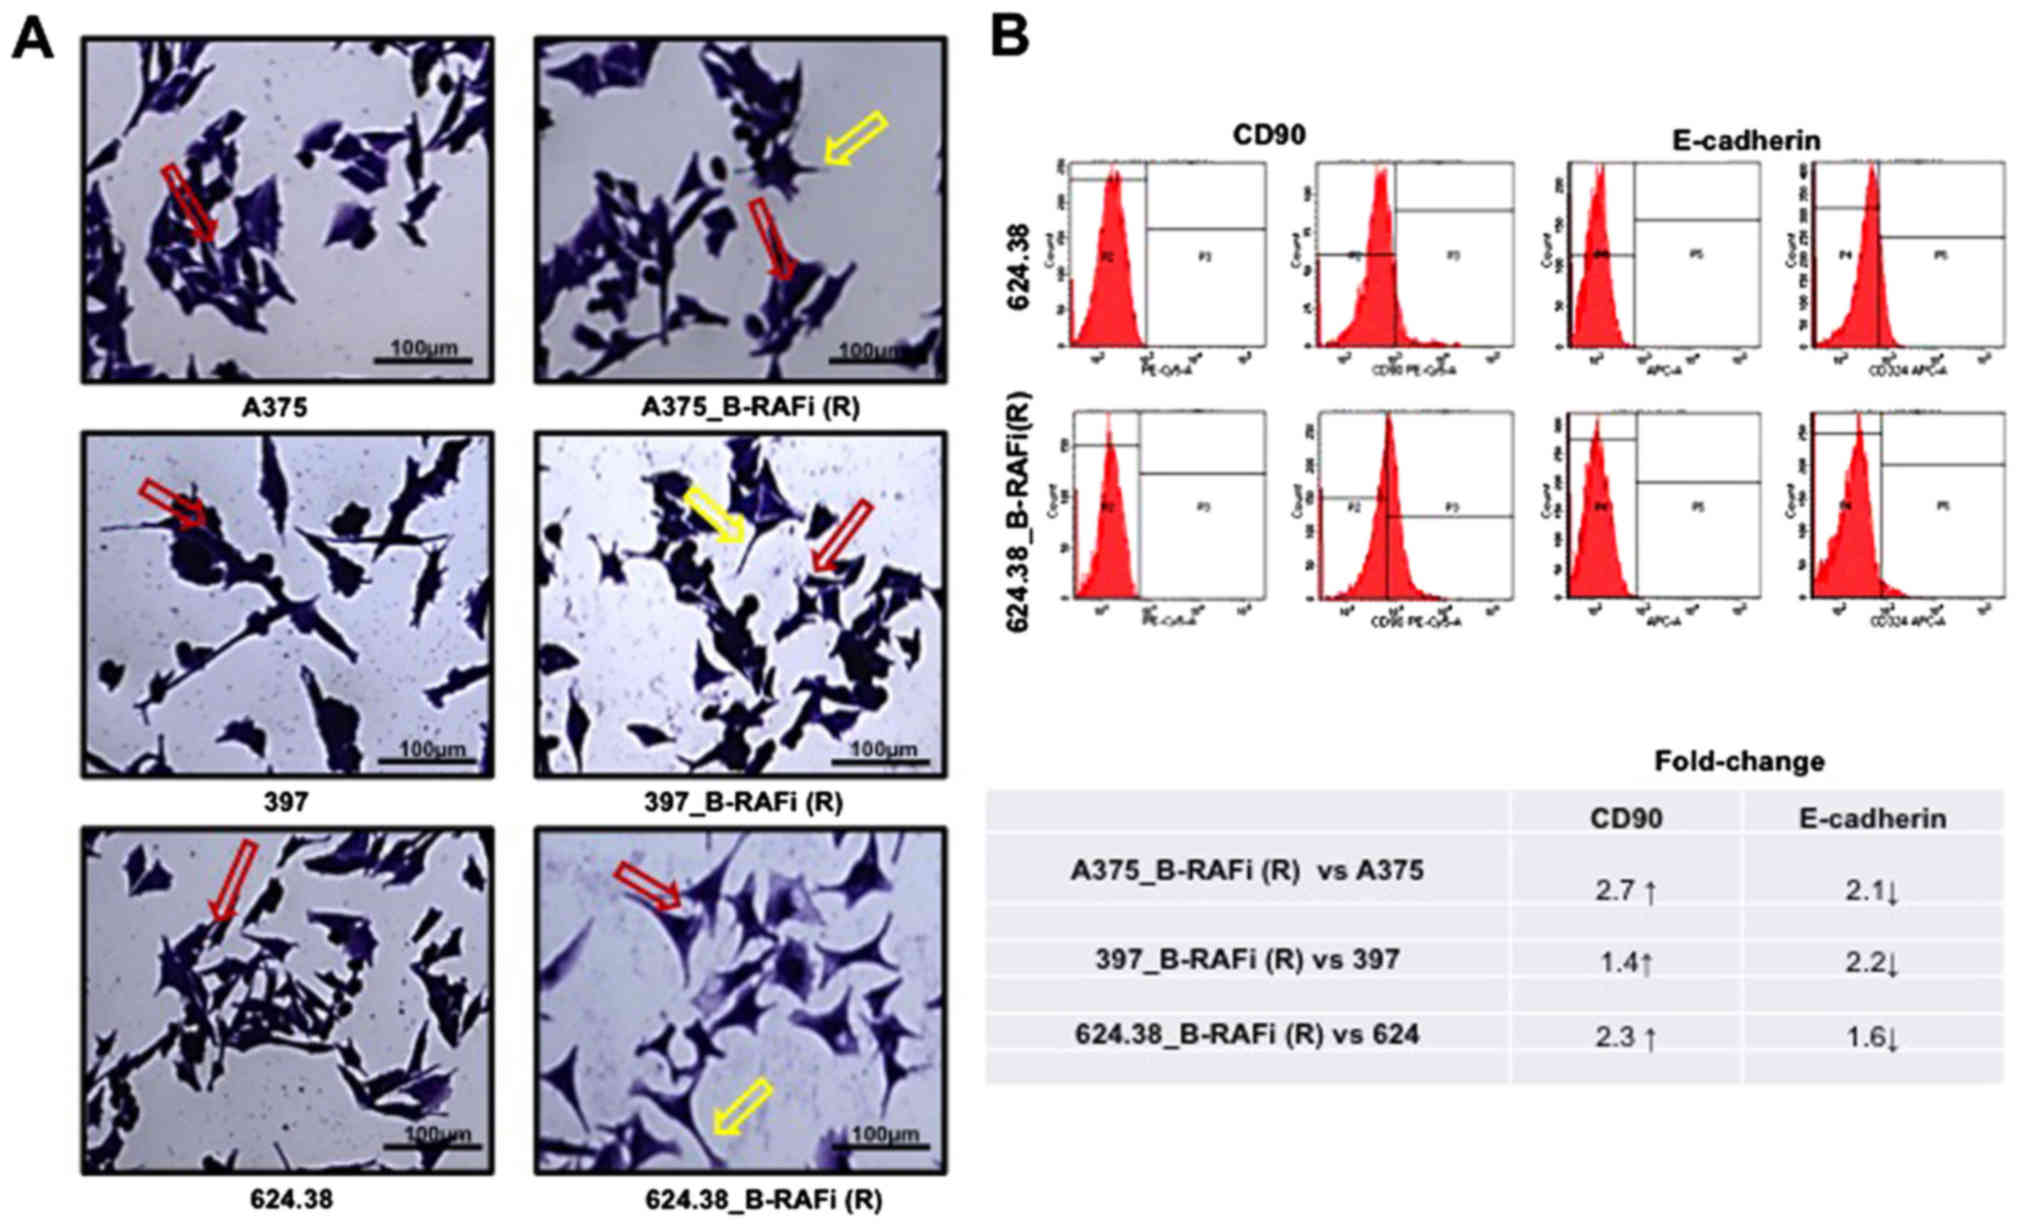
Morphology and phenotype of melanoma
cells resistant to B-RAF inhibitor
In order to characterize the dabrafenib-resistant
melanoma cells, their morphology and phenotype were examined. All
cells were grown at 70–80% confluence, stained with crystal violet
and imaged using a light microscope, as described in Materials and
methods.
All dabrafenib-resistant cells showed a
morphological change compared to the A375, 397 and 624.38 cells,
respectively (Fig. 3A). A bigger
difference in the inter-cellular space was found between
624.38_B-RAFi (R) and 624.38 cells, while it was not highly evident
between the other examined cell lines. These data revealed that
melanoma resistance to dabrafenib was also associated with cell
morphological changes.
Since it has been reported that EMT-like cancer
cells exhibit the ability to survive chemotherapy and radiation
therapy (17,18), we examined the expression of
mesenchymal CD90 (19) and
E-cadherin epithelial markers in the dabrafenib-resistant melanoma
cells, and compared the obtained values with the ones determined
for the dabrafenib-sensitive cells, by flow cytometry, as described
in Materials and methods.
The expression level of E-cadherin was decreased in
the A375_B-RAFi (R) and 397_B-RAFi (R) dabrafenib-resistant
melanoma cells compared to the A375 and 397 dabrafenib-sensitive
counterparts by ~2.1- and 2.2-fold, respectively, while it was
slightly decreased in the 624.38_B-RAFi (R) cells compared to the
624.38 cells by ~1.6-fold. On the contrary, the CD90 marker
expression level was increased by ~2.7- 1.4- and 2.3-fold in the
A375_B-RAFi (R) vs. A375, 397_B-RAFi (R) vs. 397, and 624.38_B-RAFi
(R) vs. 624.38 cells, respectively (Fig. 3B).
We conclude that melanoma cells, under dabrafenib
exposure, exhibited morphological changes with a more emphasized
mesenchymal phenotype.
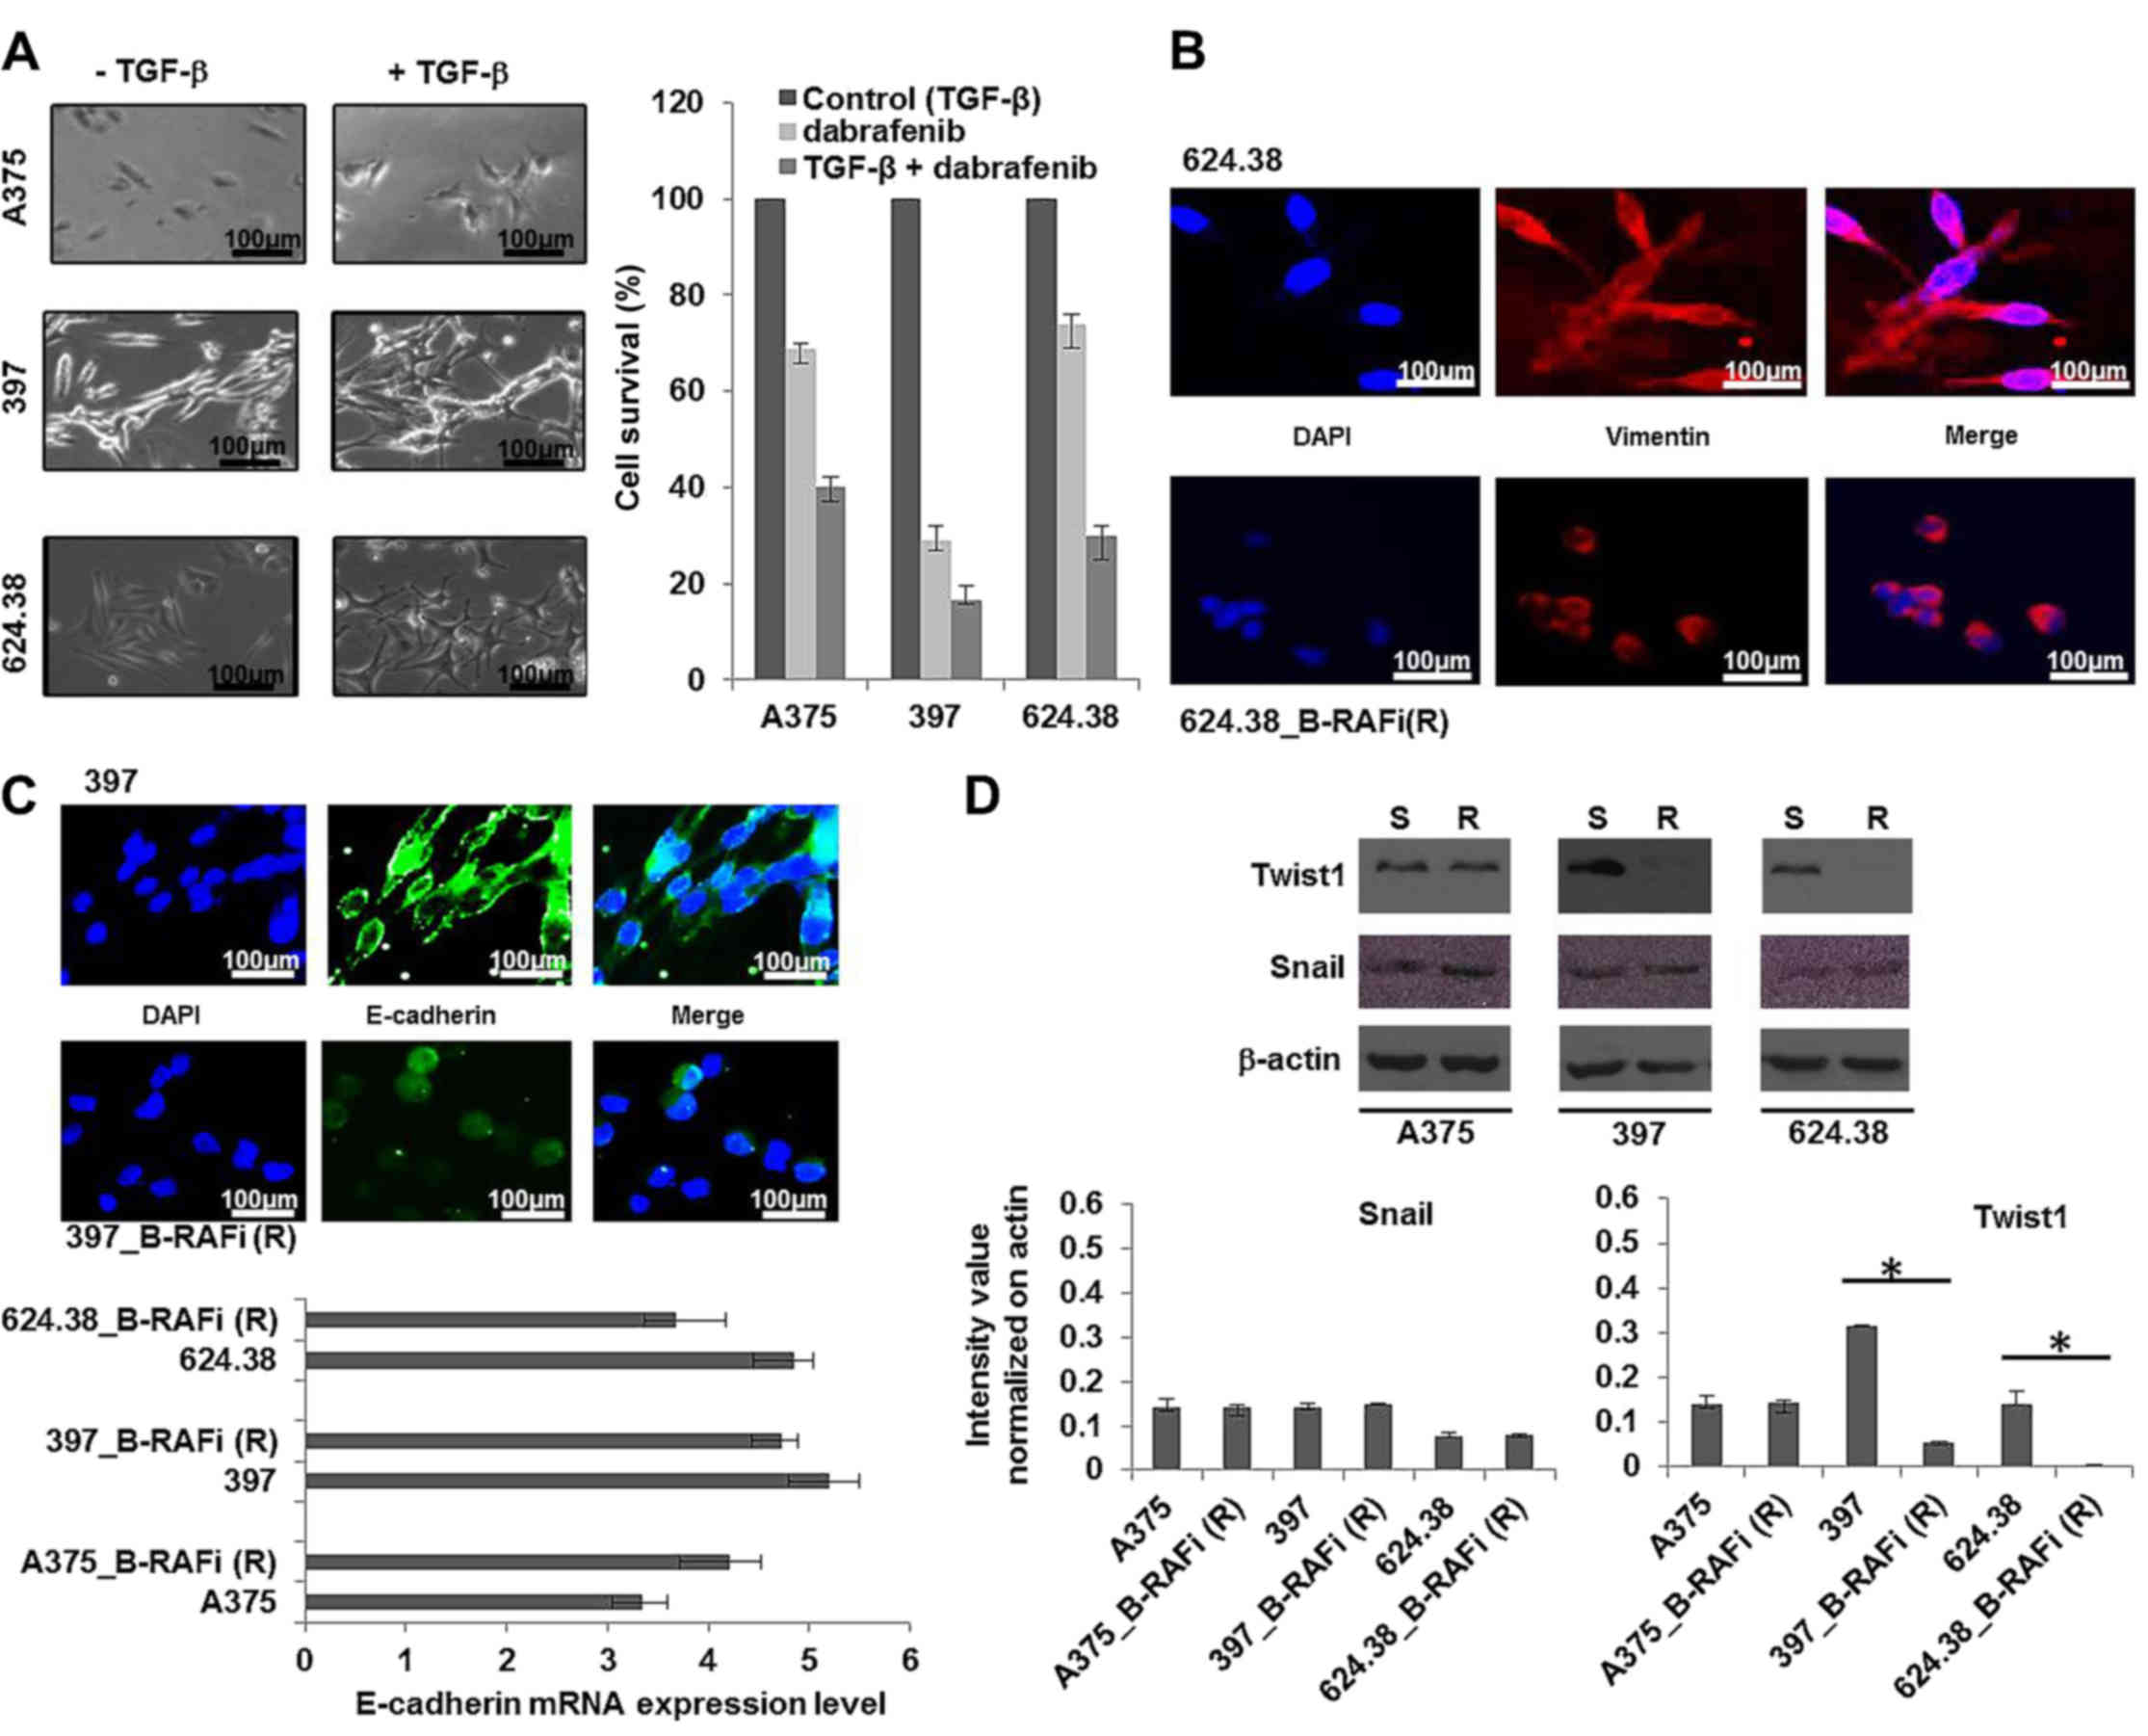
Epithelial-to-mesenchymal-like
phenotypic transition in melanoma cells resistant to
dabrafenib
Although melanoma cells originate from melanocytes,
not epithelial cells but neuroendocrine cells originating from the
neural crest, their ability to switch phenotype from proliferative
to more invasive states, in a process similar to classical
epithelial-mesenchymal transition (EMT), has been reported
(20–22). In order to investigate whether the
EMT was associated with the resistance to dabrafenib, EMT was
induced in dabrafenib-sensitive melanoma cells by stimulation with
TGF-β1 (23), as described in
Materials and methods, and then the cells were treated with
dabrafenib (5 nM).
As shown in Fig. 4A
after treatment with TGF-β1 for 48 h the cells underwent EMT and
they were more sensitive to dabrafenib compared to the
non-TGF-β1-induced melanoma cells, suggesting that the observed
drug resistance was not linked to the ‘classical’ TGF-β1-induced
EMT.
In order to shed more light on the phenotypic
features of dabrafenib-resistant melanoma cells, we examined the
network reorganization of vimentin filaments by immunofluorescence.
We found that vimentin was mainly detected in the cytoplasm of the
dabrafenib-sensitive melanoma cells, while it was observed in the
peri-nuclear region in the dabrafenib-resistant cells (Fig. 4B), as expected in EMT.
Since downregulation of E-cadherin is regarded as a
bona fide classical EMT inducer, we examined the E-cadherin
transcriptional level in the dabrafenib-sensitive and -resistant
melanoma cells, by RT-PCR, as described in Materials and methods.
We observed that the E-cadherin level was unvaried between the
dabrafenib-resistant and -sensitive cells, suggesting that EMT was
not associated with the resistance to dabrafenib. However, a change
in the E-cadherin protein distribution was observed between
dabrafenib-resistant and -sensitive melanoma cells. In particular,
E-cadherin was translocated from the membrane into the cytoplasm
and nuclei of all drug-resistant cells (Fig. 4C), as expected in EMT.
Furthermore, all 3 melanoma cell lines resistant to
dabrafenib exhibited unvaried expression levels of Snail, while
Twist expression decreased in the 397_B-RAFi (R) vs. 397, and
624.38_B-RAFi (R) vs. 624.38 cells and was unvaried in the
A375_B-RAFi (R) vs. A375 cells (Fig.
4D).
Collectively, these data revealed that melanoma
cells, under drug exposure, underwent an
epithelial-to-mesenchymal-like phenotypic transition, which was not
a result of the activation of the TGF-β1-induced EMT pathway.
Cell motility of melanoma cells
resistant to the B-RAF inhibitor
Since cells undergoing EMT gain motility (24), we also investigated the cell
motility of both dabrafenib-sensitive and -resistant melanoma
cells, by wound healing assay, as described in Materials and
methods.
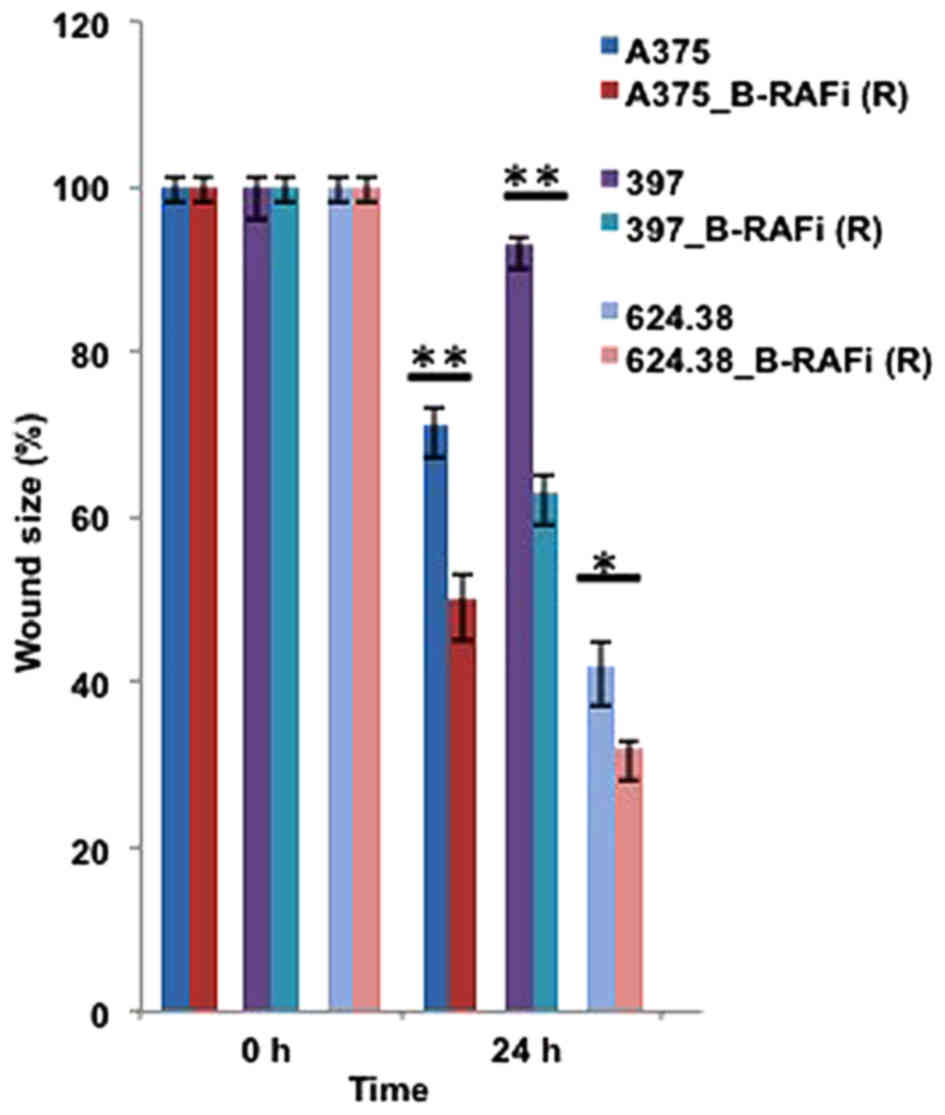
As shown in Fig. 5,
wound size analyses performed at 24 h revealed enhanced motility in
the dabrafenib-resistant melanoma cells compared to their sensitive
counterparts, further supporting an epithelial-to-mesenchymal-like
phenotypic transition of melanoma cells under drug exposure.
Stem cell-like features of melanoma
cells resistant to the B-RAF inhibitor alone or combined with
trametinib
It has been reported that EMT can produce a breast
cancer stem cell (BCSC) phenotype in breast cancer, which explains
the disease progression and relapse (25). In the present study, we investigated
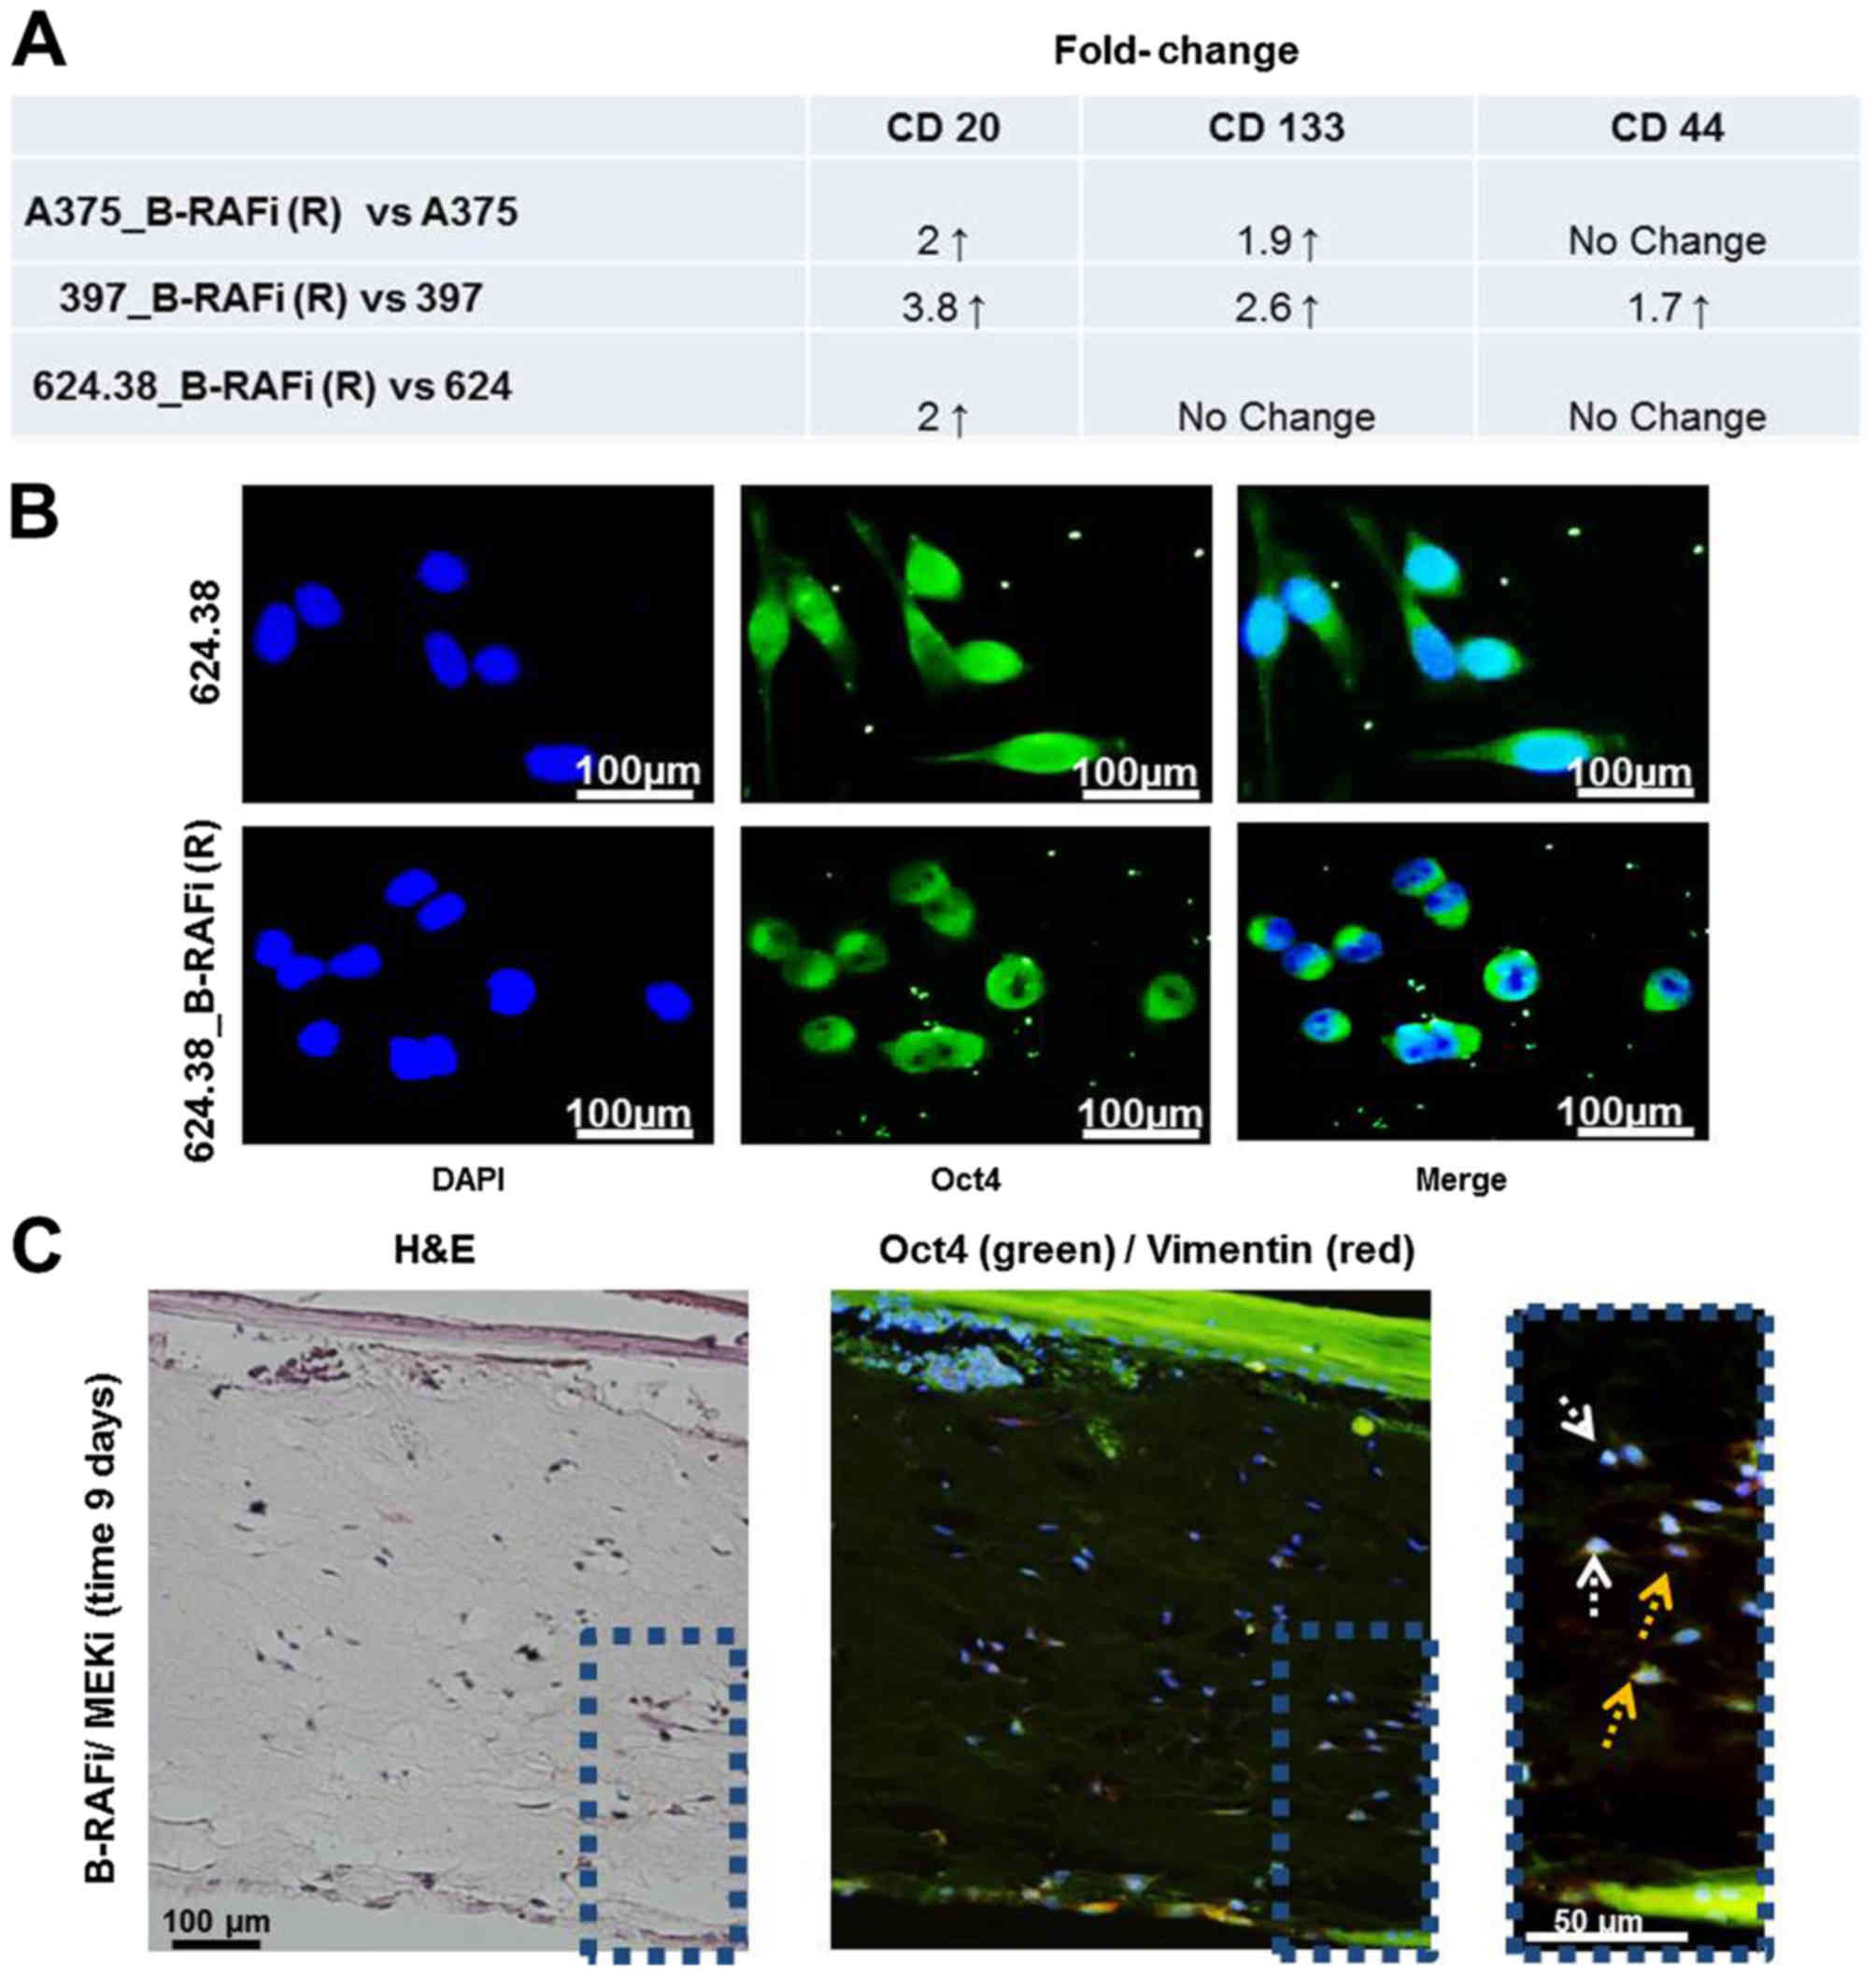
the expression of various cancer stem cell-like markers, such as
CD20, CD133 and CD44 by FACS analysis and Oct4 expression in all
melanoma cell lines by immunofluorescence.
We found ~2-fold increase in the expression level of
CD20 in the A375_B-RAFi (R) and 624.38_B-RAFi (R) vs. the A375 and
624.38 cells, respectively, while it was more pronounced in the
397_B-RAFi (R) vs. the 397 cells with an increase in ~3.8-fold
(Fig. 6A). CD133 marker expression
was increased in the A375_B-RAFi (R) and 397_B-RAFi (R) vs. the
A375 and 397 cells, respectively, while it was unmodified in the
624.38_B-RAFi (R) vs. 624.38 cells. Finally, the expression level
of CD44 was upregulated only in the 397_B-RAFi (R) vs. 397 cells,
while it was unaltered in all the remaining cells (Fig. 6A).
Furthermore, we examined Oct4 expression by
immunofluorescence, as described in Materials and methods. Oct4 is
one among the regulatory core transcription factors involved in the
maintenance of stemness in mesenchymal stem cells (26) as well as a factor induced by EMT
(27). Oct4 protein was mainly
detected at the cytoplasmic level in the melanoma cells sensitive
to B-RAF inhibition, while it was located at the peri-nuclear site
and in the nucleus of all 3 dabrafenib-resistant melanoma cell
lines (Fig. 6B), suggesting Oct4
activation in all the resistant cancer cells (28,29).
Vimentin and Oct4 localization in a
3-dimensional skin reconstruction model of A375 melanoma cells
In a 3-dimensional (3D) skin reconstruction model of
A375 melanoma cells, we previously observed individual
proliferating melanoma cells infiltrating the dermis under
BRAFi/MEKi drug treatment (14),
where MEKi used was trametinib drug. Vimentin and Oct4 expression
was also analyzed in these 3D tissues by immunofluorescence. We
observed that the melanoma cells infiltrating the dermis expressed
vimentin and Oct4 in the peri-nuclear sites. Oct4 was also detected
in the nuclei. These findings support the mesenchymal and stem-like
phenotype of these cells (Fig.
6C).
Discussion
The advancement of knowledge in melanoma biology has
led to the development of so-called ‘targeted therapeutics’, such
as dabrafenib and trametinib which target B-RAFV600E and
the MEK protein, respectively. However, development of drug
resistance due to the activation of alternative growth-controlling
pathways remains a critical issue for melanoma treatment with such
compounds, although emerging concepts of computational modeling are
making strides in predicting the response to therapy (30,31).
In the present study, we observed that 3 different
melanoma cell lines, all derived from MM patients and carrying the
B-RAFV600E mutation, contained a few cells able to
proliferate upon treatment with dabrafenib (B-RAFi), suggesting the
existence of melanoma cells able to escape the drug effect and
responsible for melanoma progression. We found that all
dabrafenib-resistant cells had reactivated MAPK signaling, and
exhibited a more elongated shape with increased pseudopodia
formation and inter-cellular space as compared to the
drug-sensitive counterparts. Notably, these morphological changes
were accompanied by an increased expression of CD90, a mesenchymal
marker (19), decreased expression
of E-cadherin, an epithelial marker, suggesting the mesenchymal
features of the dabrafenib-resistant melanoma cells. This finding
was further supported by the detection of vimentin at peri-nuclear
sites in the resistant cells, while it was observed in the
cytoplasm of melanoma cells sensitive to the drugs. Furthermore,
all dabrafenib-resistant melanoma cells showed higher cell motility
than the dabrafenib-sensitive ones, suggesting an
epithelial-to-mesenchymal phenotypic transition of these cells.
However, downregulation of E-cadherin, which is regarded as a
bona fide classical EMT inducer, was not detected (25), suggesting that melanoma cells
undergo an epithelial-to-mesenchymal-like transition or a
pathological EMT. This finding was further supported from the
observation that TGF-β1-induced EMT was not linked to dabrafenib
resistance.
Moreover, sequence analysis by Ion Torrent
technology indicated a lack of discrepancies in mutational patterns
of main cancer genes between the drug-sensitive and drug-resistant
melanoma cells, indicating that the genetic alterations in the
examined oncogenes and tumor-suppressor genes were not involved in
the phenotypic changes observed in the drug-resistant cells.
In the past decade, the developmental EMT process
has been recognized to play pivotal and complex roles in promoting
cancer invasion and metastasis as well as inducing drug resistance
(26,32,33).
It has been reported that genes involved in the activation of EMT,
such as Wnt, Oct4, EGF and Nanog, are expressed in cells exhibiting
stem cell properties and that EMT plays a critical role in the
cancer stem cell (CSC) generation in breast cancer (26,34).
We investigated the expression of Oct4, CD20, CD133 and CD44 stem
cell markers in our series. Oct4 is a regulatory core transcription
factor, involved in the maintenance of stemness in mesenchymal stem
cells (26). CD20 has been
associated with melanoma CSCs, while discordant data have been
reported regarding CD133 as a melanoma cancer stem cell marker and
CD44 has not been found to be associated with melanoma stem cells
(35). We found different stem-cell
marker traits between dabrafenib-resistant and -sensitive cells,
which could reflect the context or microenvironment from which the
cells were derived (32). Notably,
the expression of Oct4 was observed in the peri-nuclear sites and
in the nuclei of the resistant cells, while it was detected in the
cytoplasm of the melanoma cells sensitive to drugs.
We conclude that melanoma resistance to dabrafenib
was associated with MAPK signaling reactivation accompanied by an
epithelial-to-mesenchymal-like phenotypic transition as well as
with the acquirement of stem-like phenotypic features, which may
help to explain the ability of the cells to continue to proliferate
under drug conditions.
These data support the concept of pathological EMT
as well as the concept linking the EMT process and the generation
of CSCs. Understanding the molecular signaling associated with this
EMT-like or pathological EMT has become critical for providing
effective target drugs, toward successful therapeutic strategies in
melanoma. Therefore, a more detailed molecular characterization of
this cell-subset may be crucial to modulate such cellular programs
for therapeutic purposes.
Acknowledgements
The authors would like to thank the technical
support provided by the Integrated Microscopy facility at IGB and
Dr Antonio Simeone for providing the Oct4 antibody. The present
study was supported by a grant from Medical Research in Italy
(RBNE08HM7T-003) to E.J.P. and Regione Autonoma Sardegna to G.Pa.
Special thanks to Fondazione Melanoma Onlus for providing financial
support.
Glossary
Abbreviations
Abbreviations:
|
MAPK
|
mitogen activated protein kinases
|
|
B-RAFi
|
B-RAF inhibitors
|
|
MEKi
|
MEK inhibitors
|
|
PI
|
propidium iodide
|
|
EMT
|
epithelial-to-mesenchymal
transition
|
|
MM
|
metastatic melanoma
|
References
|
1
|
Carvajal RD, Marghoob AA, Kaushal A,
Kehrer JD, Ko C and Brady MS: Melanoma and other skin cancers.
Cancer Network. Home of the Journal Oncology. 1:1–23. 2014.
|
|
2
|
Tarver T: Cancer facts and figures 2012.
American Cancer Society (ACS). J Consumer Health Internet.
16:366–367. 2012. View Article : Google Scholar
|
|
3
|
Candido S, Rapisarda V, Marconi A,
Malaponte G, Bevelacqua V, Gangemi P, Scalisi A, McCubrey JA,
Maestro R, Spandidos DA, et al: Analysis of the
B-RafV600E mutation in cutaneous melanoma patients with
occupational sun exposure. Oncol Rep. 31:1079–1082. 2014.PubMed/NCBI
|
|
4
|
Falzone L, Salemi R, Travali S, Scalisi A,
McCubrey JA, Candido S and Libra M: MMP-9 overexpression is
associated with intragenic hypermethylation of MMP9 gene in
melanoma. Aging. 8:933–944. 2016. View Article : Google Scholar : PubMed/NCBI
|
|
5
|
Bernardo-Faura M, Massen S, Falk CS, Brady
NR and Eils R: Data-derived modeling characterizes plasticity of
MAPK signaling in melanoma. PLOS Comput Biol. 10:e10037952014.
View Article : Google Scholar : PubMed/NCBI
|
|
6
|
Ascierto PA, Grimaldi AM, Anderson AC,
Bifulco C, Cochran A, Garbe C, Eggermont AM, Faries M, Ferrone S,
Gershenwald JE, et al: Future perspectives in melanoma research:
Meeting report from the ‘Melanoma Bridge’, Napoli, December 5th-8th
2013. J Transl Med. 12:2772014. View Article : Google Scholar : PubMed/NCBI
|
|
7
|
Das Thakur M, Salangsang F, Landman AS,
Sellers WR, Pryer NK, Levesque MP, Dummer R, McMahon M and Stuart
DD: Modelling vemurafenib resistance in melanoma reveals a strategy
to forestall drug resistance. Nature. 494:251–255. 2013. View Article : Google Scholar : PubMed/NCBI
|
|
8
|
Nazarian R, Shi H, Wang Q, Kong X, Koya
RC, Lee H, Chen Z, Lee MK, Attar N, Sazegar H, et al: Melanomas
acquire resistance to B-RAF(V600E) inhibition by RTK or N-RAS
upregulation. Nature. 468:973–977. 2010. View Article : Google Scholar : PubMed/NCBI
|
|
9
|
Shi H, Moriceau G, Kong X, Lee MK, Lee H,
Koya RC, Ng C, Chodon T, Scolyer RA, Dahlman KB, et al: Melanoma
whole-exome sequencing identifies (V600E)B-RAF
amplification-mediated acquired B-RAF inhibitor resistance. Nat
Commun. 3:7242012. View Article : Google Scholar : PubMed/NCBI
|
|
10
|
Shi H, Hugo W, Kong X, Hong A, Koya RC,
Moriceau G, Chodon T, Guo R, Johnson DB, Dahlman KB, et al:
Acquired resistance and clonal evolution in melanoma during BRAF
inhibitor therapy. Cancer Discov. 4:80–93. 2014. View Article : Google Scholar : PubMed/NCBI
|
|
11
|
Rizos H, Menzies AM, Pupo GM, Carlino MS,
Fung C, Hyman J, Haydu LE, Mijatov B, Becker TM, Boyd SC, et al:
BRAF inhibitor resistance mechanisms in metastatic melanoma:
Spectrum and clinical impact. Clin Cancer Res. 20:1965–1977. 2014.
View Article : Google Scholar : PubMed/NCBI
|
|
12
|
Van Allen EM, Wagle N, Sucker A, Treacy
DJ, Johannessen CM, Goetz EM, Place CS, Taylor-Weiner A, Whittaker
S, Kryukov GV, et al: Dermatologic Cooperative Oncology Group of
Germany (DeCOG): The genetic landscape of clinical resistance to
RAF inhibition in metastatic melanoma. Cancer Discov. 4:94–109.
2014. View Article : Google Scholar : PubMed/NCBI
|
|
13
|
Ascierto PA, Marincola FM and Atkins MB:
What's new in melanoma? Combination! J Transl Med. 13:2132015.
View Article : Google Scholar : PubMed/NCBI
|
|
14
|
Caputo E, Miceli R, Motti ML, Taté R,
Fratangelo F, Botti G, Mozzillo N, Carriero MV, Cavalcanti E,
Palmieri G, et al: AurkA inhibitors enhance the effects of B-RAF
and MEK inhibitors in melanoma treatment. J Transl Med. 12:2162014.
View Article : Google Scholar : PubMed/NCBI
|
|
15
|
Sun C, Wang L, Huang S, Heynen GJ,
Prahallad A, Robert C, Haanen J, Blank C, Wesseling J, Willems SM,
et al: Reversible and adaptive resistance to BRAF(V600E) inhibition
in melanoma. Nature. 508:118–122. 2014. View Article : Google Scholar : PubMed/NCBI
|
|
16
|
Sanchez-Laorden B, Viros A, Girotti MR,
Pedersen M, Saturno G, Zambon A, Niculescu-Duvaz D, Turajlic S,
Hayes A, Gore M, et al: BRAF inhibitors induce metastasis in RAS
mutant or inhibitor-resistant melanoma cells by reactivating MEK
and ERK signaling. Sci Signal. 7:ra302014. View Article : Google Scholar : PubMed/NCBI
|
|
17
|
Jung JW, Hwang SY, Hwang JS, Oh ES, Park S
and Han IO: Ionising radiation induces changes associated with
epithelial-mesenchymal transdifferentiation and increased cell
motility of A549 lung epithelial cells. Eur J Cancer. 43:1214–1224.
2007. View Article : Google Scholar : PubMed/NCBI
|
|
18
|
Yang AD, Fan F, Camp ER, van Buren G, Liu
W, Somcio R, Gray MJ, Cheng H, Hoff PM and Ellis LM: Chronic
oxaliplatin resistance induces epithelial-to-mesenchymal transition
in colorectal cancer cell lines. Clin Cancer Res. 12:4147–4153.
2006. View Article : Google Scholar : PubMed/NCBI
|
|
19
|
Dominici M, Le Blanc K, Mueller I,
Slaper-Cortenbach I, Marini F, Krause D, Deans R, Keating A,
Prockop Dj and Horwitz E: Minimal criteria for defining multipotent
mesenchymal stromal cells. The International Society for Cellular
Therapy position statement. Cytotherapy. 8:315–317. 2006.
View Article : Google Scholar : PubMed/NCBI
|
|
20
|
Hoek KS, Eichhoff OM, Schlegel NC,
Döbbeling U, Kobert N, Schaerer L, Hemmi S and Dummer R: In vivo
switching of human melanoma cells between proliferative and
invasive states. Cancer Res. 68:650–656. 2008. View Article : Google Scholar : PubMed/NCBI
|
|
21
|
Wehbe M, Soudja SM, Mas A, Chasson L,
Guinamard R, de Tenbossche CP, Verdeil G, Van den Eynde B and
Schmitt-Verhulst AM: Epithelial-mesenchymal-transition-like and
TGFβ pathways associated with autochthonous inflammatory melanoma
development in mice. PLoS One. 7:e494192012. View Article : Google Scholar : PubMed/NCBI
|
|
22
|
Jayachandran A, Anaka M, Prithviraj P,
Hudson C, McKeown SJ, Lo PH, Vella LJ, Goding CR, Cebon J and
Behren A: Thrombospondin 1 promotes an aggressive phenotype through
epithelial-to-mesenchymal transition in human melanoma. Oncotarget.
5:5782–5797. 2014. View Article : Google Scholar : PubMed/NCBI
|
|
23
|
Nawshad A, Lagamba D, Polad A and Hay ED:
Transforming growth factor-beta signaling during
epithelial-mesenchymal transformation: Implications for
embryogenesis and tumor metastasis. Cells Tissues Organs.
179:11–23. 2005. View Article : Google Scholar : PubMed/NCBI
|
|
24
|
Gavert N and Ben-Ze'ev A:
Epithelial-mesenchymal transition and the invasive potential of
tumors. Trends Mol Med. 14:199–209. 2008. View Article : Google Scholar : PubMed/NCBI
|
|
25
|
Nieto MA: The ins and outs of the
epithelial to mesenchymal transition in health and disease. Annu
Rev Cell Dev Biol. 27:347–376. 2011. View Article : Google Scholar : PubMed/NCBI
|
|
26
|
Santisteban M, Reiman JM, Asiedu MK,
Behrens MD, Nassar A, Kalli KR, Haluska P, Ingle JN, Hartmann LC,
Manjili MH, et al: Immune-induced epithelial to mesenchymal
transition in vivo generates breast cancer stem cells. Cancer Res.
69:2887–2895. 2009. View Article : Google Scholar : PubMed/NCBI
|
|
27
|
Zimmerer RM, Korn P, Demougin P, Kampmann
A, Kokemüller H, Eckardt AM, Gellrich NC and Tavassol F: Functional
features of cancer stem cells in melanoma cell lines. Cancer Cell
Int. 13:782013. View Article : Google Scholar : PubMed/NCBI
|
|
28
|
Kashyap V, Rezende NC, Scotland KB,
Shaffer SM, Persson JL, Gudas LJ and Mongan NP: Regulation of stem
cell pluripotency and differentiation involves a mutual regulatory
circuit of the NANOG, OCT4, and SOX2 pluripotency transcription
factors with polycomb repressive complexes and stem cell microRNAs.
Stem Cells Dev. 18:1093–1108. 2009. View Article : Google Scholar : PubMed/NCBI
|
|
29
|
Wen KM, Zhang GH, Li J, Chen ZQ, Cheng YL,
Su X and Zeng QL: OCT4B1 promotes cell growth, migration and
invasion suppressing sensitivity to οxaliplatin in colon cancer.
Oncol Rep. 34:2943–2952. 2015. View Article : Google Scholar : PubMed/NCBI
|
|
30
|
Pennisi M, Russo G, Di Salvatore V,
Candido S, Libra M and Pappalardo F: Computational modeling in
melanoma for novel drug discovery. Expert Opin Drug Discov.
11:609–621. 2016. View Article : Google Scholar : PubMed/NCBI
|
|
31
|
Pappalardo F, Russo G, Candido S, Pennisi
M, Cavalieri S, Motta S, McCubrey JA, Nicoletti F and Libra M:
Computational modeling of PI3K/AKT and MAPK signaling pathways in
melanoma cancer. PLoS One. 11:e01521042016. View Article : Google Scholar : PubMed/NCBI
|
|
32
|
Bissell MJ and Labarge MA: Context, tissue
plasticity, and cancer: Are tumor stem cells also regulated by the
microenvironment? Cancer Cell. 7:17–23. 2005. View Article : Google Scholar : PubMed/NCBI
|
|
33
|
Yin X, Zhang BH, Zheng SS, Gao DM, Qiu SJ,
Wu WZ and Ren ZG: Coexpression of gene Oct4 and Nanog initiates
stem cell characteristics in hepatocellular carcinoma and promotes
epithelial-mesenchymal transition through activation of Stat3/Snail
signaling. J Hematol Oncol. 8:232015. View Article : Google Scholar : PubMed/NCBI
|
|
34
|
Mani SA, Guo W, Liao MJ, Eaton EN, Ayyanan
A, Zhou AY, Brooks M, Reinhard F, Zhang CC, Shipitsin M, et al: The
epithelial-mesenchymal transition generates cells with properties
of stem cells. Cell. 133:704–715. 2008. View Article : Google Scholar : PubMed/NCBI
|
|
35
|
Medema JP: Cancer stem cells: The
challenges ahead. Nat Cell Biol. 15:338–344. 2013. View Article : Google Scholar : PubMed/NCBI
|