Introduction
Cancer is a set of diseases characterized by
limitless replication and activation of metastasis. Colorectal
cancer (CRC) is the second and third most common malignancy in
females and males, respectively (1). The major cause of death in patients
with CRC is the development of metastasis. Despite considerable
advances in the detection and treatment of colorectal cancer,
majority of patients are diagnosed at advanced stages when
treatment is difficult and most of these patients will die within 5
years. Further investigation of CRC tumorigenesis at a molecular
level is required to develop effective agents or therapeutic
approaches, particularly for recurrent and metastatic patients.
miRNAs are endogenous, small noncoding RNAs of 18–22
nucleotides long, and have emerged as important regulators of gene
expression at post-transcriptional level (2). Deregulation of miRs is associated with
several diseases including cancer. Accumulating studies have
demonstrated that miRNAs play a vital role in diverse cellular
processes implicated in cancer progression (3), such as cell migration (4), invasion (5), proliferation (6), apoptosis (7), and cell cycle regulation (8). These cellular processes have been
shown to involve miR-29 which supports their role as effective
regulators of tumorigenesis and cancer progression (9,10).
Tumor-associated miRs can function either as tumor
suppressors or oncogenes depending on their target mRNAs (11,12).
Downregulation of miR-29a-3p has been reported in various types of
cancers including gastric cancer (13), glioma (14), oral squamous cell carcinoma
(15), cervical squamous cell
carcinoma (16), hepatocellular
carcinoma (17) and non-small cell
lung cancer (18,19) suggesting that miR-29 may potentially
serve as a tumor suppressor.
By contrast, miR-29 overexpression has been reported
in acute myeloid leukemia (20), B
cell chronic lymphocytic leukemia (21), breast cancer (22) and colorectal cancer (3,23,24).
Plasma miR-29a can also be applied to the early detection of CRC
metastasis (25) implying that they
may potentially act as oncogenes. A previous study revealed that
miR-29a-3p level was higher in both serum and tissue of CRC
patients with liver metastases than that in patients without
metastasis, indicating that miR-29a-3p might be involved in CRC
progression (7). Kuo et al
found that miR-29a can be used as a predictor of the early
recurrence (26) and a risk marker
for recurrence in stage II colon cancer (27). Thus, miR-29 can serve as a useful
diagnostic and prognostic marker (28) and their tumor suppressive or
oncogenic role is dependent on the cell type and tumor
microenvironment.
Since miR-29a-3p expression is elevated in
metastatic colorectal cancer, we hypothesized that inhibiting the
expression of miR-29a-3p will block migration and invasion of
colorectal cancer cells.
Materials and methods
Cell culture and transfection
All five colorectal cancer cell lines, SW620, SW480,
HCT116, HT-29 and Caco2, were obtained from the American Type
Culture Collection (Manassas, VA, USA) and maintained in complete
RPMI-1640 medium supplemented with 10% fetal bovine serum (FBS),
penicillin (100 U/ml), streptomycin (100 µg/ml), and 2 g/l sodium
bicarbonate (Gibco, Invitrogen Corp., Carlsbad, CA, USA) at 37°C in
humidified air with 5% CO2.
miR-29a-3p inhibitor, miRNA inhibitor negative
control (NC) oligos, miR-29a-3p mimic, miRNA mimic negative control
(NC) oligos, were purchased from Exiqon (Vedbaek, Denmark). HCT116
and SW620 at a density of 5.3×10⁴ and 1.3×10⁵
cells/ml, respectively, were transfected with Lipofectamine 2000
(Invitrogen), and SW480 cells at a density of 1.1×10⁴
cells/ml were transfected with HiPerFect (Qiagen, Hilden, Germany)
in 24-well plates according to the manufacturer's instructions.
This was followed by MTT assay.
Patient samples
Archived paraffin-embedded CRC tissues and matched
normal adjacent tissues were from 28 histologically confirmed CRC
patients who underwent surgery in Kuala Lumpur Hospital between
2010 and 2011. Medical ethics was approved by the National Medical
Research and Ethics Committee (NMRR-12-435-11565), and each patient
provided consent to use their paraffin-embedded tissues. The tumors
were staged according to the TNM staging system. All cases were
reviewed and confirmed by two experienced pathologists. The
clinical and pathological characteristics of patients are shown in
Table I. Due to time and financial
constraints, experiments were conducted with a small cohort
containing 28 samples. Sections of 4-µm thickness were cut and
mounted on glass slides followed by deparaffinization and
macrodissection under a microscope. The tumor area and normal
adjacent colonic mucosae were scrapped off with a pipette tip and
collected in 1.5 ml microcentrifuge tubes.
 | Table I.Clinical and pathological
characteristics of patients included in this study. |
Table I.
Clinical and pathological
characteristics of patients included in this study.
| Clinicopathological
parameters | No. of patients
(n=28) |
|---|
| Sex |
|
|
Male | 18 |
|
Female | 10 |
| Age at diagnosis
(years) |
|
|
≤60 | 5 |
|
>60 | 23 |
| Race |
|
|
Chinese | 16 |
|
Malay | 10 |
|
Indian | 2 |
| Stage at
diagnosis |
|
| I | 10 |
| II | 9 |
|
III | 9 |
| Tumor site |
|
|
Left | 15 |
|
Right | 5 |
|
Rectum | 8 |
RT-qPCR for miRNA detection
For assessment of miR-29a-3p expression in CRC
tissues and colorectal cancer cell lines, total RNA including miRNA
was purified using miRNeasy FFPE kit (Qiagen) and miRNeasy Micro
kit (Qiagen) according to the manufacturer's instructions,
respectively. U6 snRNA was employed as the endogenous reference
gene for relative quantification of miRNA using RT-qPCR. Reverse
transcription was conducted using the Universal cDNA synthesis kit
(Exiqon) according to the manufacturer's instructions.
miR-29a-3p (cat. no. 204698) and U6 (cat. no.
203907) primers were purchased from Exiqon. As Locked Nucleic Acids
Technology is covered by the patents owned by Exiqon, the sequences
of the primers were not provided by the manufacturer. PCR was
performed with a Mastercycler EP realplex 4 (Eppendorf, Germany)
using SYBR® Green Master Mix Universal RT kit (Exiqon).
PCR parameters were set as follows: polymerase activation at 95°C
for 10 min, 40 amplification cycles of denaturation at 95°C for 10
sec, annealing and extension at 60°C for 1 min. Melting curve
analysis was used to assess amplification specificity. Each sample
was run in triplicate and each experiment was repeated for three
times. Standard curve method was used to calculate the relative
expression of miRNA (17).
MTT assay
To determine the effect of miR-29a-3p inhibitor on
cell growth, MTT assay was used to assess cell viability following
cell transfection with miR-29a-3p inhibitor. Cells were plated in
96-well plates in triplicates. After incubating the plate at 37°C
for 24 h, miRNA inhibitors were introduced into the cells via
transfection. MTT reagent (9 µl) at a concentration of 5 mg/ml was
pipetted into each well after 96 h followed by incubation in cell
culture incubator for 4 h. The culture medium was then removed and
100 µl DMSO was added into each well to dissolve intracellular
formazan. The absorbance of each well was measured at 570 nm
utilizing a spectrophotometric microtiter plate reader (Dynex
Technologies, Inc., Chantilly, VA, USA). Negative control was
regarded as calibrator and the absorbance was defined as 100%.
Relative viability of experimental cells was calculated by dividing
the absorbance of experimental cells by that of negative control.
Three independent experiments were performed for each
treatment.
Transwell assay for cell migration and
invasion
Transwell assay system was used to assess cell
migration and cell invasion in the present study. Transwell
migration assay is always performed with commercially available
plastic inserts compatible with multiwell plates. The bottom of
plastic insert is made up of microporous membrane allowing
migratory cells to reach the other side of the membrane. To
determine cell invasion, a gel containing similar components with
basement membrane is formed on the microporous membrane. The only
difference between migration assay and invasion assay is the
presence of the basement membrane-like gel. Matrigel™ was added on
the microporous membrane. Unbound Matrigel was aspirated and the
plate was placed in an incubator at 37°C for 30 min to allow
gelling. The membrane was coated twice with Matrigel. SW480-7 cells
transfected with 10 nM miRNA inhibitor or miRNA mimic for 48 h were
detached with trypsin (0.25%). Cells (1.0×10⁵)
resuspended in 200 µl serum-free medium were pipetted into upper
chamber, and 700 µl medium with 10% FBS was added into lower
chamber. After 72 h of incubation at 37°C, the insert was soaked in
ice-cold 95% ethanol for 10 min to fix the cells. The invaded cells
and non-invaded cells were stained by propidium iodide (PI) and 4′,
6-diamidino-2-phenylindole (DAPI), respectively. Cell counting of
invaded and non-invaded cells was done using the Image-Pro Plus 6.0
software. The invasive capacity was represented by relative
invasion that was determined using the formula: number of invaded
cells stained by PI/number of non-invaded cells stained by DAPI.
Three independent experiments were conducted to verify the
reproducibility. The invasive capacity of a treated sample was
normalized to that of corresponding control. One-sample t-test was
used to test the differences of normalized invasive capacities of
three independent experiments with the hypothetical value (set to
1).
RT2 Profiler PCR array
SW480-7 cells were transfected with miR-29a-3p
inhibitor or miRNA negative control oligos 48 h before the PCR
array. Total RNA purification was conducted with GeneJET RNA
Purification kit (cat. no. K0731; Thermo Scientific, USA). The
integrity of extracted RNA was tested by agarose gel
electrophoresis. Purity and quantity of RNA were determined using a
Nandrop 1000 spectrophoto-meter, and only RNA samples with A260:
A280 absorbance values between 1.8 and 2.1 were used in subsequent
experiments. Reverse transcription (RT) was performed with
RT2 First Strand kit (cat. no. 330401; Qiagen) according
to the manufacturer's protocol. Cytoskeleton Regulators
RT2 Profiler PCR array plate (cat. no. PAHS-088ZA;
Qiagen) was used to perform real-time quantitative PCR. Twenty-five
microliters of PCR components mix was added to each well of the
96-well RT2 Profiler PCR array plate. Then, the plate
was placed in the real-time cycler (Eppendorf, Wesseling-Berzdorf,
Germany), and the PCR cycling program was set as follows:
polymerase activation at 95°C for 10 min, 40 amplification cycles
of denaturation at 95°C for 15 sec, annealing and extension at 60°C
for 1 min.
RT-qPCR for mRNA confirmation
Total RNA purification was conducted with GeneJET
RNA Purification kit (Thermo Scientific). cDNA was synthesized by
ReverAid Reverse transcriptase at 42° for 60 min. Real-time PCR was
performed with SYBR Select Master Mix (cat. no. 4472908, Life
Technologies, CA, USA). Glyceraldehyde-3-phosphate dehydrogenase
(GAPDH) was set as reference gene and the primer sequences are
shown in Table II. Real-time PCR
was conducted with a 10-µl total volume, containing 1 µl of cDNA
template, 5 µl 2X SYBR® Select Master Mix, 0.25 µl
forward/reverse primer, and 3.5µl of RNase-free water. PCR was
performed on a Mastercycler EP realplex 4 (Eppendorf, Germany). The
thermal cycler was programmed as follows: initial denaturation at
95°C for 2 min, 40 cycles consisting of 95°C for 15 sec, 60°C for
15 sec, 72°C for 1.5 min, and extension at 72°C for 10 min.
Standard curve method was used to calculate the relative expression
of mRNA.
| Table II.Sequences of primers used in qPCR
analysis. |
Table II.
Sequences of primers used in qPCR
analysis.
| Gene | Primer |
|---|
| CDC42BPA | F:
5′-GCTGGTGGAGACATACGGAA-3′ |
|
| R:
5′-ACCAAGTCGATGTTCTCTGCT-3′ |
| PHLDB2 | F:
5′-CCAGGGAACGGGAAATGGAA-3′ |
|
| R:
5′-GGTAGCGTGTCAAAGGACGA-3′ |
| IQGAP2 | F:
5′-GCACACACTCACTCCTGTTG-3′ |
|
| R:
5′-GTCAACTGCTCCTTCCCCAA-3′ |
| SSH1 | F:
5′-AAGAGACCACAGACCTCCTCG-3′ |
|
| R:
5′-GCGACTCACGCCCATTTTG-3′ |
| PAK1 | F:
5′-GCATAGTGAGTGTGGGCGAT-3′ |
|
| R:
5′-CCCACGAGGTAACTGTCCAA-3′ |
| GAPDH | F:
5′-AATCCCATCACCATCTTCCA-3′ |
|
| R:
5′-TGGACTCCACGACGTACTCA-3′ |
Western blot analysis
Total proteins were harvested from SW480-7 cells 72
h post-transfection with 300 µl of 1X sodium dodecyl sulfate (SDS)
lysis buffer. Approximately 20 µg of protein samples were loaded on
and electrophoresed in polyacrylamide gel electrophoresis (PAGE) in
running buffer at 120 V. The proteins in the gel were
electrotransferred to a polyvinylidene fluoride (PVDF) membrane
(Pierce, Thermo Fisher Scientific) in transfer buffer at 100 V.
After 2 h of transfer, the membrane was incubated in a blocking
buffer (Tris-buffered saline containing 5% bovine serum albumin) at
room temperature for 1 h with agitation. After blocking, the
membrane was incubated with the corresponding primary antibody
diluent (1:2,000) overnight at 4°C. Then, the membrane was
incubated with the species specific horseradish peroxidase
conjugated secondary antibody (1:10,000 dilution; Cell Signaling
Technology, USA) for 1 h at room temperature. The membrane was
incubated with chemiluminescent substrate for 5 min. After that,
the membrane was visualized and the images were captured using a
camera in the FluorChem™ 5500 imaging system (Alpha Innotech Corp.,
San Leandro, CA, USA). Densitometric analysis was performed to
evaluate band intensities using Image J software (National
Institutes of Health, Bethesda, MD, USA). The values of targeted
band density were normalized to those of α-tubulin obtained from
the same membrane. Three independent experiments were
conducted.
Statistical analysis
Data obtained from the Cytoskeleton Regulators
RT2 Profiler PCR array was analyzed by PCR Array Data
Analysis Web Portal (www.SABiosciences.com/pcrarraydataanalysis.php.) using
the ΔΔCt method.
Data obtained in the RT-qPCR, viability, migration,
invasion, and western blot assays was analyzed using one-sample
t-test by GraphPad InStat version 3.05 for windows (GraphPad
Software, Inc., San Diego, CA, USA). Moreover, paired t-test was
used to statistically matched tissues, and one-way analysis was
used to compare means of three stages in CRC tissues. Quantitative
results were expressed as the mean ± standard deviation. A
two-sided P-value <0.05 was set as the criteria for statistical
significance.
Results
The expression of miR-29a-3p in the
five colorectal cancer cell lines
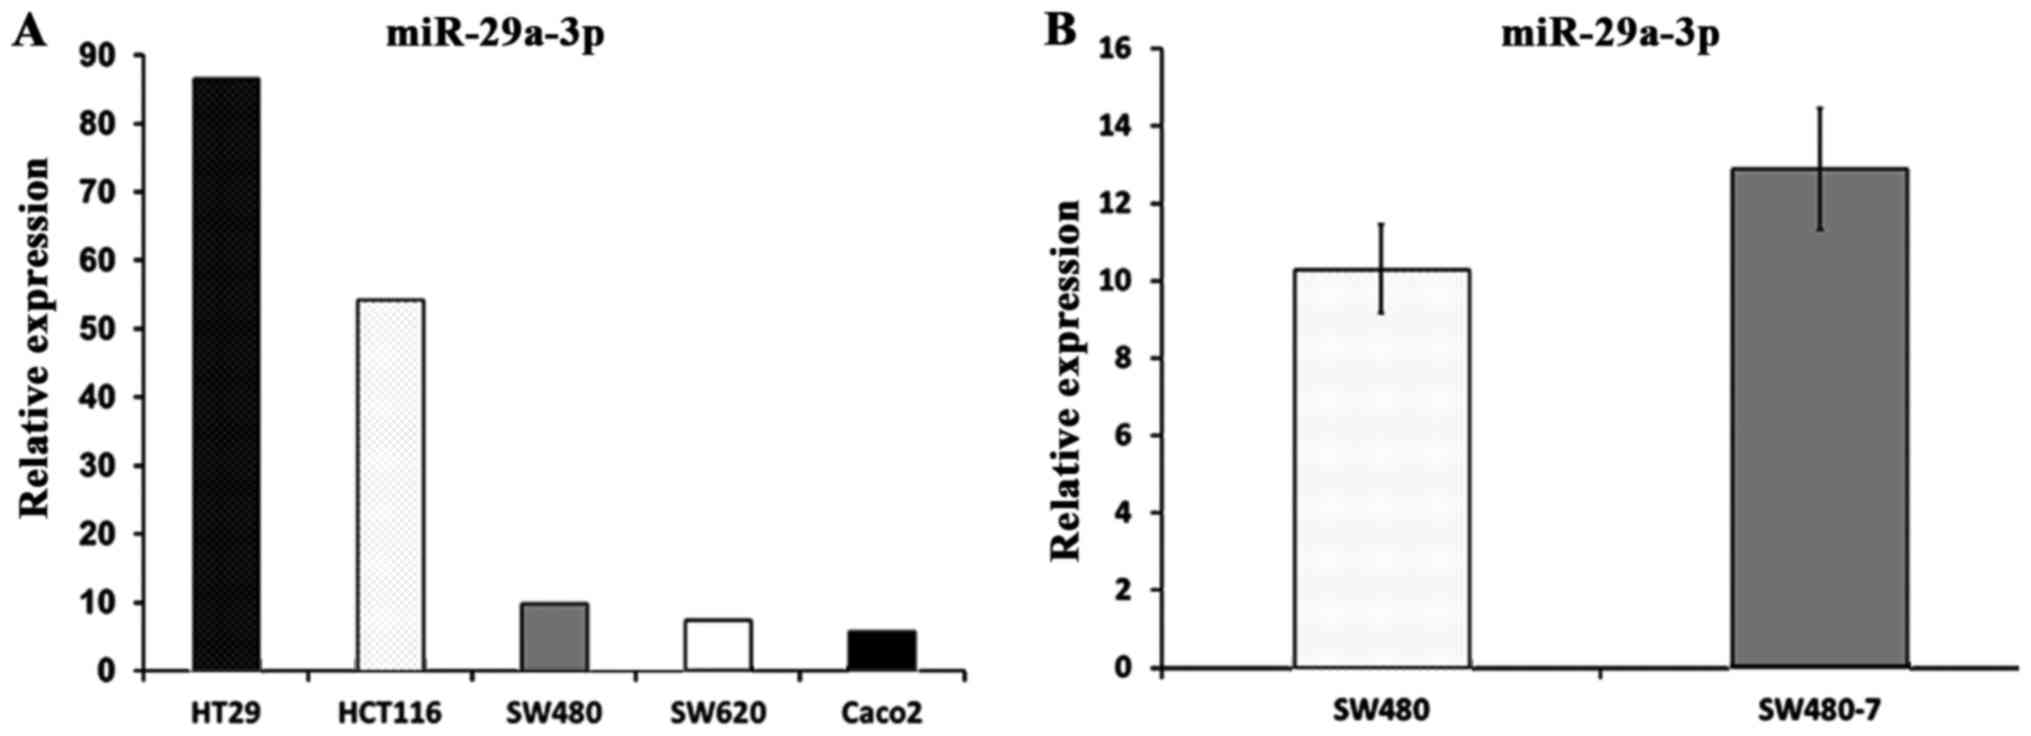
Multiple previous studies have shown that miR-29a-3p
was overexpressed in CRC tissue (3,18,19).
In the present study, miR-29a-3p was detected in five human
colorectal cancer cell lines, namely HCT116, Caco2, HT29, SW480 and
SW620. The result of RT-qPCR showed that miR-29a-3p was detectable
in all the five colorectal cancer cell lines (Fig. 1A).
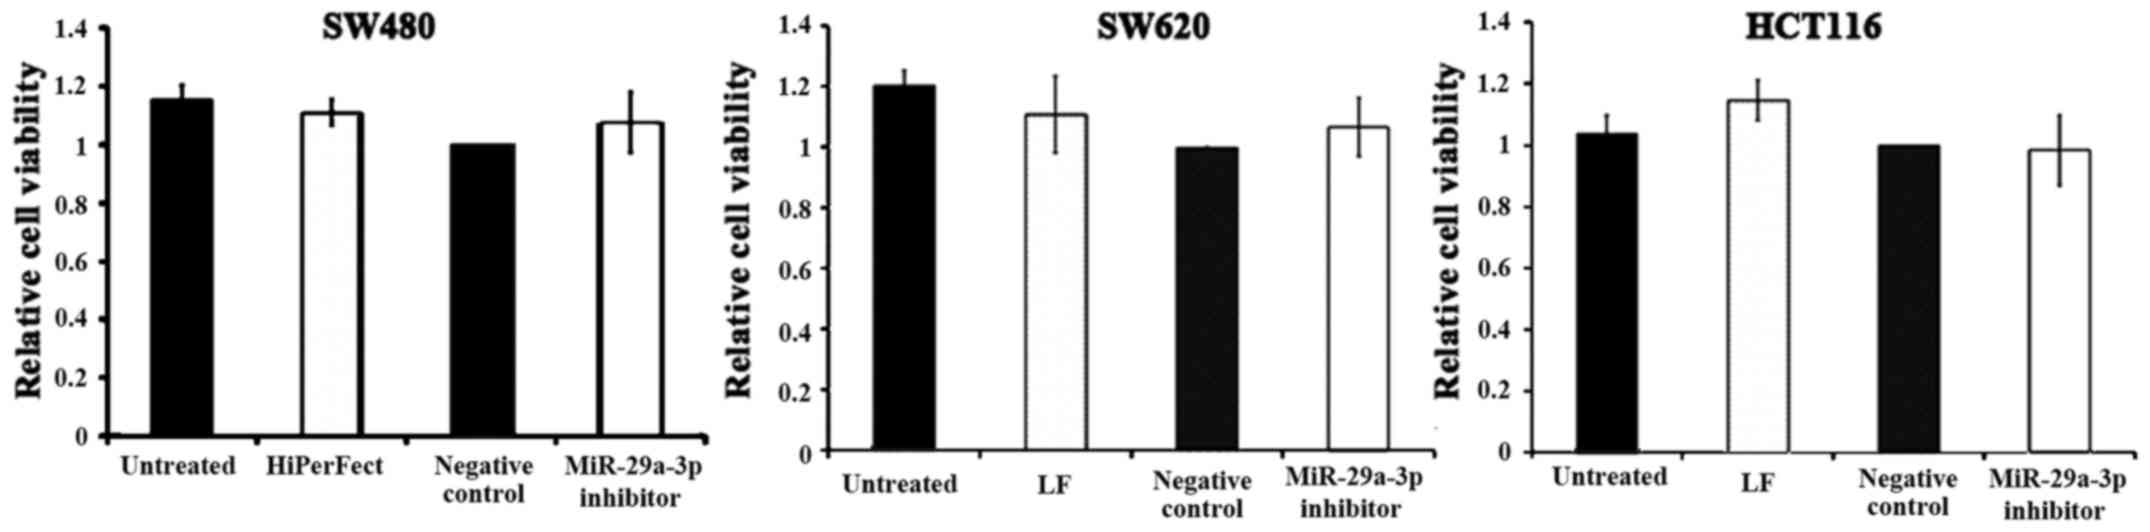
Effects of miR-29a-3p inhibitor on
viability of HCT116, SW480 and SW620
Transfection optimization indicated that three out
of the five cell lines, SW480, SW620 and HCT116, were transfected
successfully. Cell death siRNA acted as positive control in
transfection optimization as cells which are successfully
transfected will be killed. It was found that majority of SW480,
SW620 and HCT116 cells were killed after transfection with cell
death siRNA but no death was observed with HT29 and Caco2 (data not
shown). Since miR-29a-3p was overexpressed in CRC, loss-of-function
study using miR-29a-3p inhibitor was performed to determine the
effect of miR-29a-3p inhibitor on viability of SW480, SW620 and
HCT116. Cells were transfected with miR-29a-3p inhibitor or
inhibitor control, and MTT assay was performed to detect cell
viability after 96 h. The average value of cell viability was
divided by that of the corresponding negative control (inhibitor
control) which was set as 1. The data displayed in Fig. 2 show the means ± SD obtained from 3
independent experiments. Statistical analysis was performed using
one-sample t-test. The result demonstrated that miR-29a-3p
inhibition had no significant effect on cell viability in the three
cell lines (P>0.05).
Selection of invasive population of
colorectal cancer cells in vitro
Since miR-29a-3p is overexpressed in CRC tissue
according to the previous studies, it is implicated as an oncogene.
To test the possible inhibitory effect of miR-29a-3p inhibitors on
cell motility, invasive cells are required to perform invasion and
migration assay. In order to evaluate the intrinsic invasive
capability of the three CRC cell lines (HCT116, SW480 and SW620),
Transwell invasion assay was performed without any treatment.
Unfortunately, the invasive propensities of the three CRC cell
lines were very poor and none of them achieved adequate invasion
for the following quantification. For SW620 and HCT116, almost no
cell could pass through the insert, whilst a few invaded SW480
cells were observed at the bottom of the insert. Therefore, an
invasive subpopulation called SW480-7 was derived from SW480 cell
line in vitro using the Transwell Matrigel invasion assay
mentioned above. Cells that invaded to the bottom of the membrane
were detached with 0.25% trypsin and cultured in a new cell culture
flask filled with RPMI-1640 medium. An invasive subpopulation of
SW480 called SW480-7 was established via 7 sequential passages
through Matrigel-coated insert.
miR-29a-3p expression in SW480-7
cells
The invasive subpopulation, SW480-7, was established
from the original SW480 cell line. To determine if the miR-29a-3p
expression was altered in SW480-7 cells, real-time PCR was
performed to assess miR-29a-3p in SW480 and SW480-7 cells (Fig. 1B). Unpaired t-test was employed to
perform statistical analysis, and the results indicated that no
significant difference was observed in miR-29a-3p expression
between SW480 and SW480-7 cells (10.3±1.14 vs 12.9±1.57;
P=0.081).
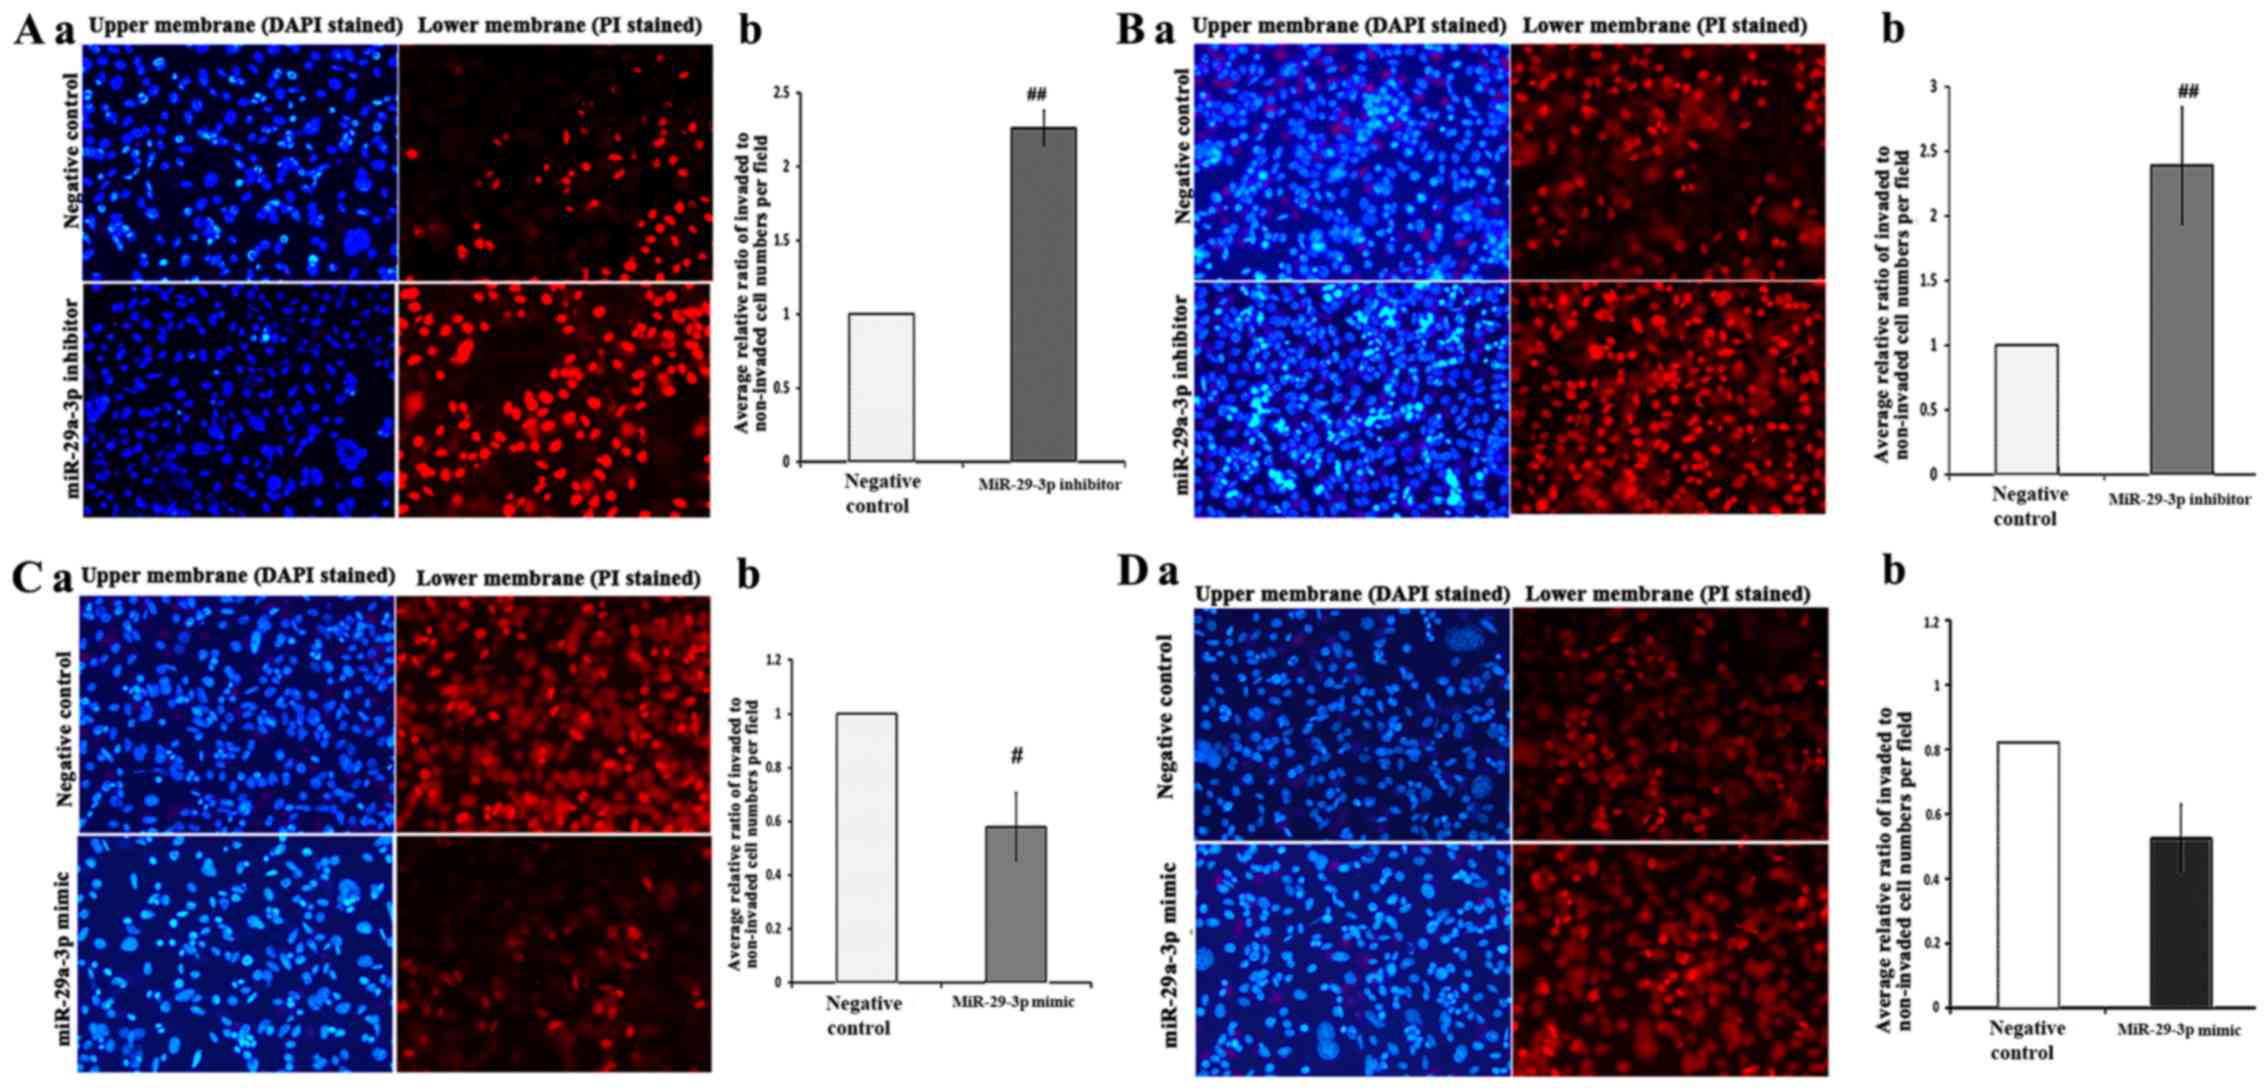
Effects of miR-29a-3p on migration and
invasion of SW480-7 cells
To further determine the effect of miR-29a-3p on
cell motility, invasion assay and migration assay was carried out
using Transwell assay. miR-29a-3p mimic and inhibitor were employed
to perform gain-of-function and loss-of-function, respectively.
First, SW480-7 cells were transfected with
miR-29a-3p inhibitor or negative control followed by cell invasion
assay. The invasive capacity of the negative control group was used
as the calibrator and set to 1. Unexpectedly, the result showed
there was a significant stimulation of cell invasion by the
miR-29a-3p inhibitor (2.3±0.12, Fig.
3A). The subsequent cell migration assay showed that the
miR-29a-3p inhibitor promoted cell migration (2.4±0.45, Fig. 3B). Gain-of-function analyses using
miR-29a-3p mimic were performed to further confirm the biological
function of miR-29a-3p on cell migration and invasion. miR-29a-3p
mimic or negative control was introduced into SW480-7 cells
followed by Transwell cell invasion assay and migration assay. The
results of gain-of-function study indicated that miR-29a-3p
overexpression in SW480-7 cells suppressed cell invasion
(0.58±0.12) and migration (0.64±0.13) significantly supports the
observation of loss-of-function study (Fig. 3C and D).
Cytoskeleton Regulators RT2
Profiler PCR array
To elucidate the underlying mechanism of alteration
in migration caused by miR-29a-3p inhibition in vitro,
Cytoskeleton Regulators RT2 Profiler PCR array was
performed 48 h after transfection. The dynamic reorganization of
cell cytoskeleton is an essential requirement of cell motility
process. The expression of 84 cytoskeletal regulatory genes was
analysed and multiple altered genes due to miR-29a-3p inhibition
was revealed (Table III). Two
filter conditions were applied to select target genes for further
study. One is fold change and the other is cycle threshold (Ct)
value. The Ct value is inversely proportional to the amount of the
gene detected in the sample, which means the higher the Ct level
the lesser the amount of target gene. The genes regulated by a
certain miRNA are divided into two general categories: direct
targets and indirect targets. miRNA can suppress gene expression of
direct targets through binding to the complementary sequence at 3′
UTR, and the other genes at downstream are indirect targets. Three
widely used databases, TargetScan (http://www.targetscan.org/), miRBD (http://mirdb.org/miRDB/) and DIANA (http://diana.imis.athena-innovation.gr/DianaTools/),
were employed to identify the potential direct target genes of
miR-29a-3p in the 84-gene panel (Fig.
4). Five genes, namely CDC42, CDC42BPA, BAIAP2, MAPRE1 and
TIAM1, were predicted as possible direct targets of miR-29a-3p by
at least 2 databases, and the other seventy-nine genes were
potential indirect targets. Since the interaction between a
microRNA and the corresponding mRNAs has not been elucidated, all
the predicted direct targets need to be verified experimentally.
RT2 Profiler PCR array revealed that three out of the 5
genes were upregulated in SW480-7 cells transfected with miR-29a-3p
inhibitor. These three mRNAs were CDC42BPA (2.33-fold), BAIAP2
(1.79-fold) and TIAM1 (1.77-fold). Since CDC42BPA was the gene with
the largest-fold change of gene expression, it was selected as the
representative predicted direct target for siRNA studies.
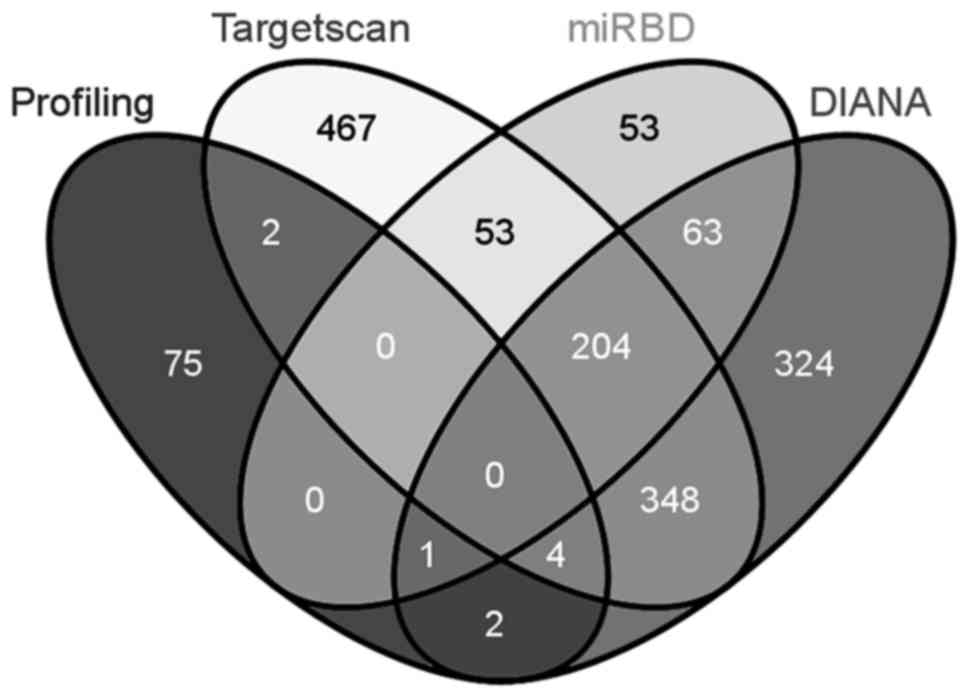 | Figure 4.Intersection analysis of 84-gene
panel included in PCR array with potential direct targets of
miR-29a-3p predicted by three widely used databases (TargetScan,
miRBD and DIANA). Total numbers of genes for Profiling, TargetScan,
miRBD, and DIANA were 84, 1078, 374, and 946, respectively. In the
Venn diagram, the numbers inside intersections denote common genes
of the corresponding sections, whereas the numbers outside
intersections denote unique genes. |
| Table III.Differentially expressed genes
mediated by miR-29a-3p inhibitor. |
Table III.
Differentially expressed genes
mediated by miR-29a-3p inhibitor.
| Symbol | Full name | Fold
regulation | Ct value |
|---|
| ARHGAP6 | Rho GTPase
activating protein 6 | −2.6208 | 32.83 |
| ARHGDIB | Rho GDP
dissociation inhibitor (GDI) β | −2.3784 | 28.48 |
| AURKC | Aurora kinase
C | −12.9063 | 34.38 |
| CALD1 | Caldesmon 1 | 2.2501 | 20.71 |
| CASK |
Calcium/calmodulin-dependent serine
protein kinase (MAGUK family) | −2.8284 | 24.43 |
| CCNA1 | Cyclin A1 | 4.1125 | 29.95 |
| CDC42BPA | CDC42 binding
protein kinase α (DMPK-like) | 2.3295 | 20.4 |
| CDC42EP2 | CDC42 effector
protein (Rho GTPase binding) 2 | 2.6208 | 22.85 |
| CDK5R1 | Cyclin-dependent
kinase 5, regulatory subunit 1 (p35) | 2.2501 | 24.89 |
| CLIP1 | CAP-GLY domain
containing linker protein 1 | 2.042 | 17.4 |
| CRK | V-crk sarcoma virus
CT10 oncogene homolog (avian) | 2.1735 | 20.23 |
| CTTN | Cortactin | 2.3457 | 22.58 |
| EZR | Ezrin | 2.6027 | 19.04 |
| IQGAP2 | IQ motif containing
GTPase activating protein 2 | 10.9283 | 20.07 |
| MAPT |
Microtubule-associated protein τ | −2.2658 | 25.88 |
| MID1 | Midline 1
(Opitz/BBB syndrome) | 2.1585 | 21.53 |
| MSN | Moesin | −2.114 | 21.72 |
| PAK1 | P21 protein
(Cdc42/Rac)-activated kinase 1 | −4.1989 | 25.41 |
| PHLDB2 | Pleckstrin
homology-like domain, family B, member 2 | 3.9177 | 20.7 |
| SSH1 | Slingshot homolog 1
(Drosophila) | 3.8906 | 23.61 |
| SSH2 | Slingshot homolog 2
(Drosophila) | 2.5315 | 24.39 |
| WAS | Wiskott-Aldrich
syndrome (eczema-thrombocytopenia) | −3.5308 | 29.99 |
| B2M |
β-2-microglobulin | 2.114 | 18.83 |
For the indirect targets of miR-29a-3p, the cut-off
value for fold changes and the Ct value were set to 3.5 and 29,
respectively. As a result, four genes, IQGAP2, PHLDB2, SSH1 and
PAK1, fulfilled the inclusion criteria. Taken together,
RT2 Profiler PCR array revealed that 5 genes, CDC42BPA,
IQGAP2, PHLDB2, SSH1 and PAK1, were differentially expressed due to
miR-29a-3p inhibition.
Confirmation of PCR array data at mRNA
level
To further validate the accuracy and reproducibility
of data from RT2 Profiler PCR array, qRT-PCR was
repeated in three independent experiments to investigate the five
selected genes (CDC42BPA, IQGAP2, PHLDB2, SSH1 and PAK1) and the
results are summarized in Fig. 5A and
B. Statistical analysis was done using one-sample t-test. The
corresponding expression levels of control groups were used as
calibrators which were set as one, and relative mRNA expression of
each gene was compared to control group. In SW480-7 cells
transfected with miR-29a-3p inhibitor, mRNA expression levels of
CDC42BPA, IQGAP2, PHLDB2 and SSH1 were increased to 3.3-, 10.1-,
4.4- and 5.0-fold, respectively, while the expression of PAK1 was
reduced to 0.32-fold significantly (Fig. 5A). Fig.
5B shows the effects of the miR-29a-3p mimic on the expression
of CDC42BPA, IQGAP2, PHLDB2, SSH1 and PAK1 mRNAs in SW480-7 cells.
In this study, miR-29a-3p mimic could reverse the role of
miR-29a-3p inhibitor, decreased the expression of CDC42BPA
(0.37-fold), IQGAP2 (0.58-fold), PHLDB2 (0.62-fold) and SSH1
(0.38-fold) mRNAs, and increased PAK1 (2.63) mRNA. The results of
qRT-PCR in Fig. 5A and B were
consistent with result from RT2 Profiler PCR array.
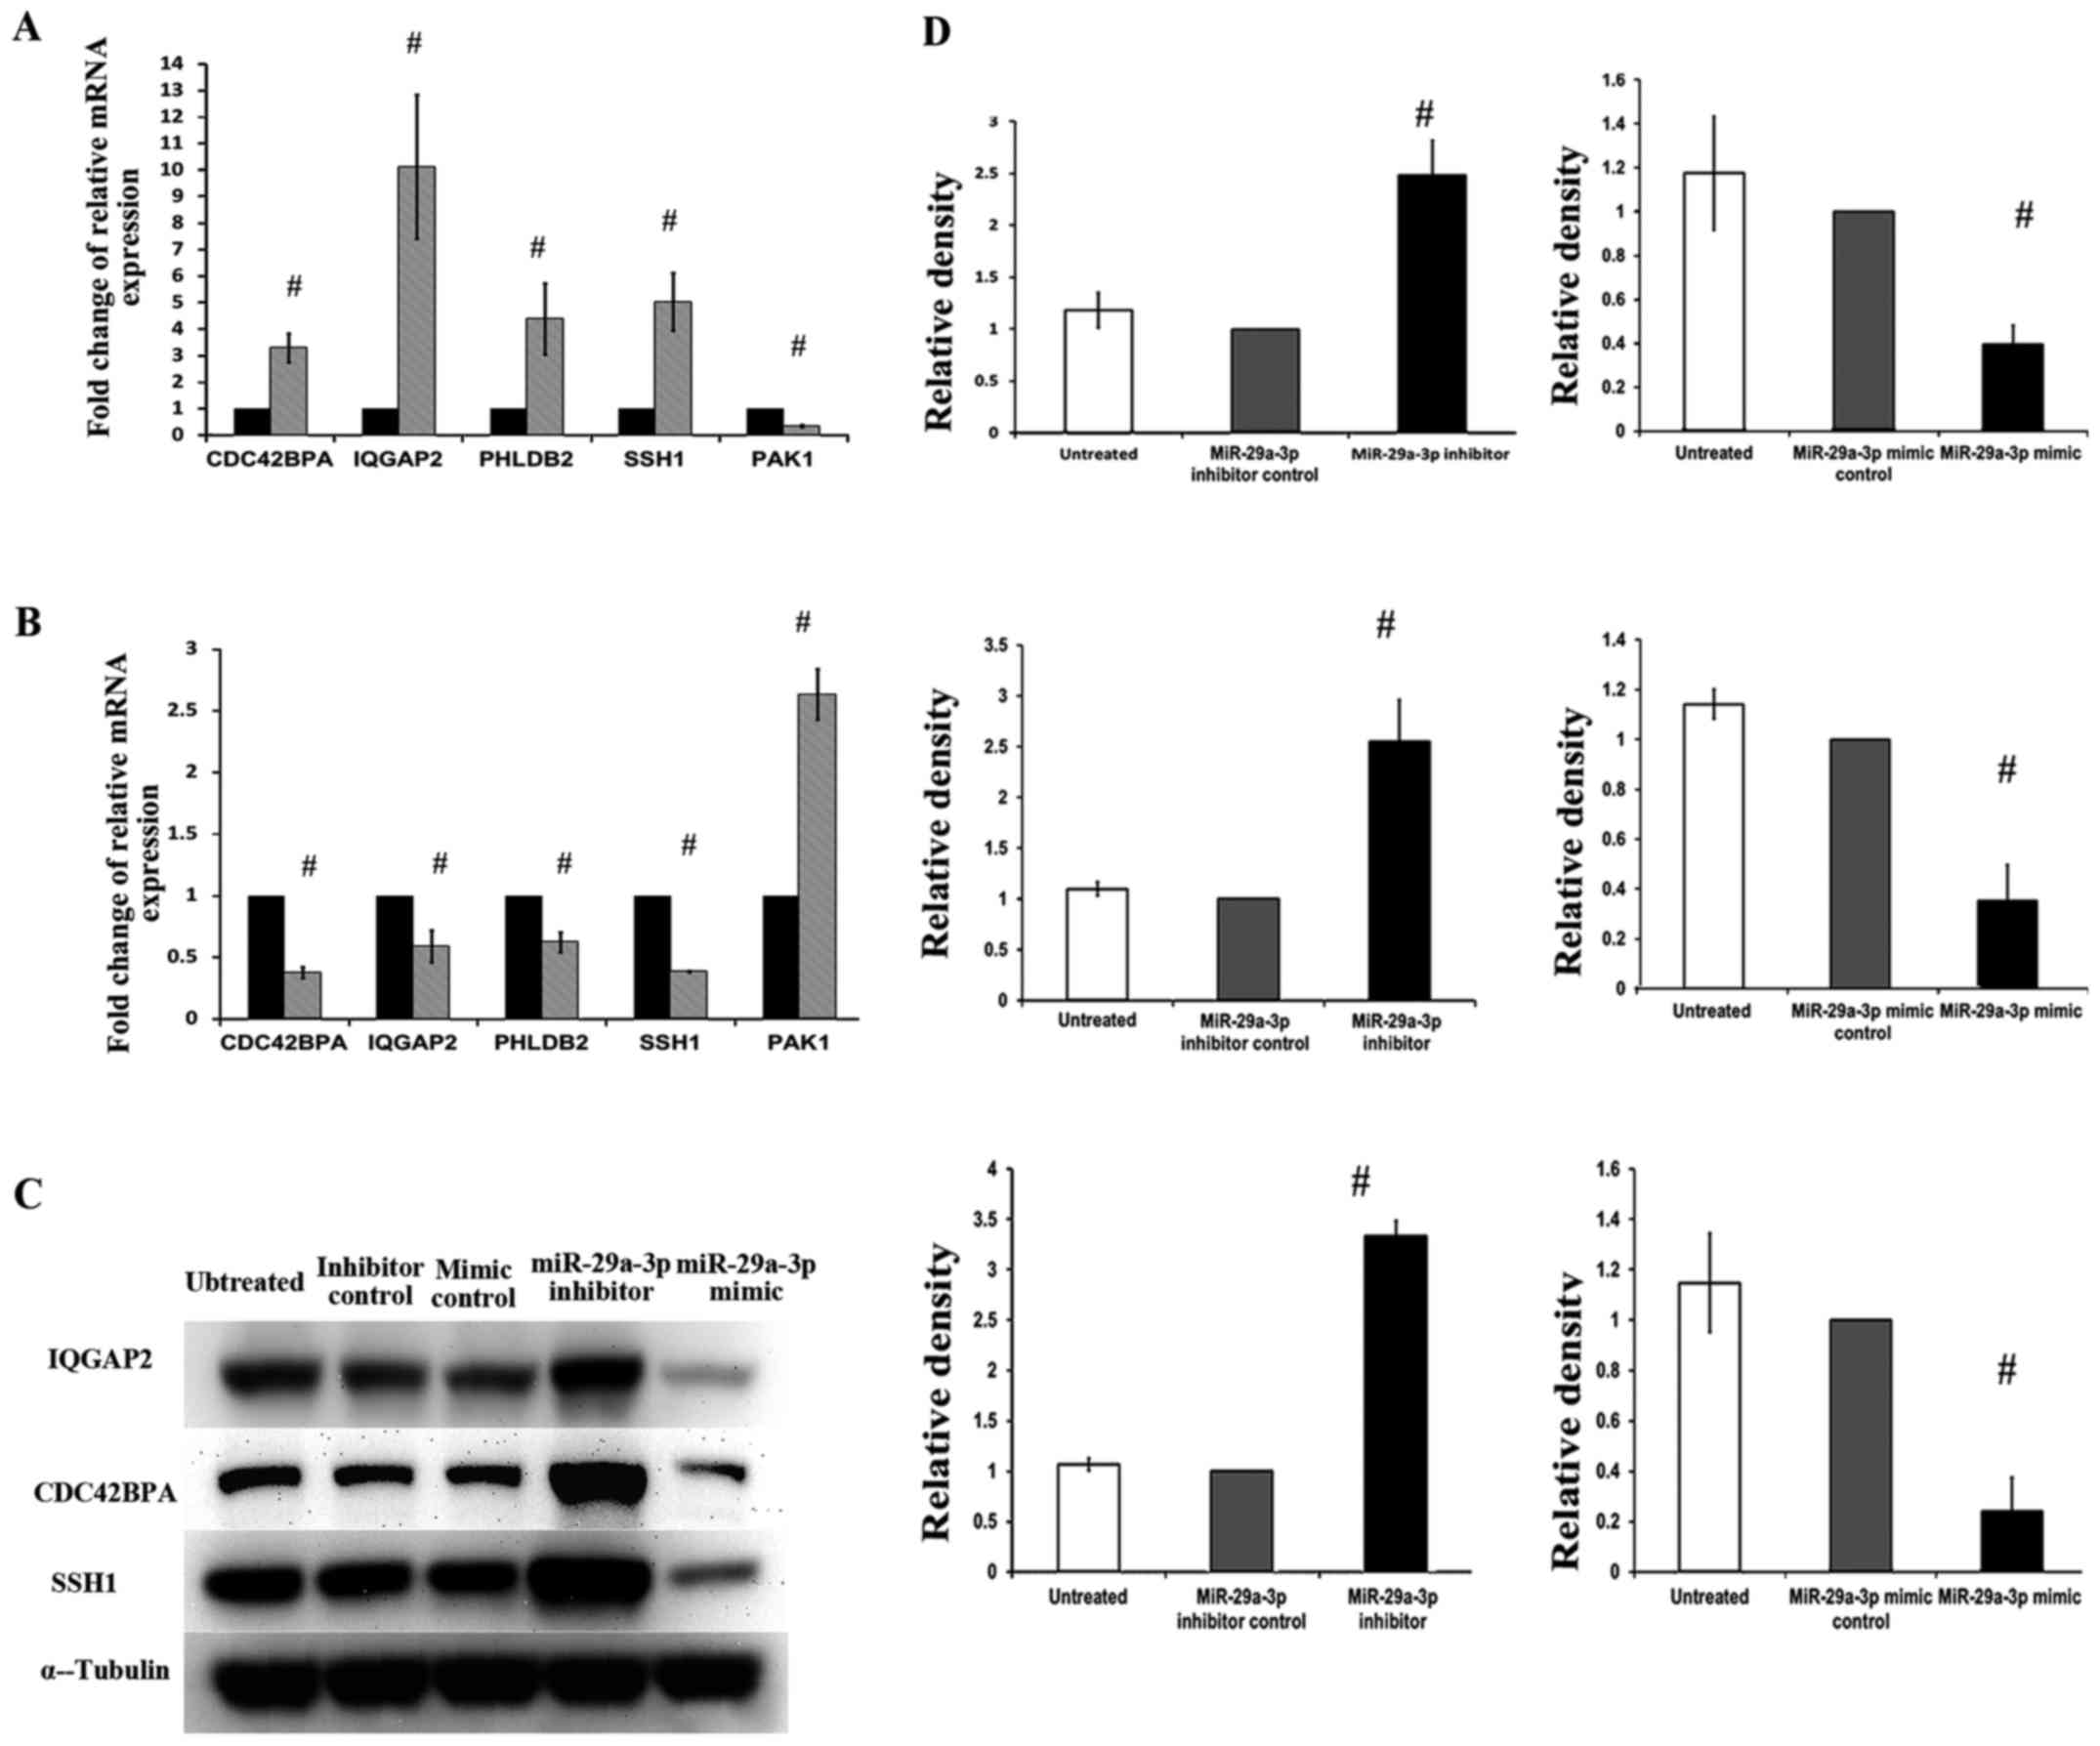 | Figure 5.The effects of miR-29a-3p on mRNA and
protein expression of several selected genes (CDC42BPA, IQGAP2,
PHLDB2, SSH1 and PAK1) in SW480-7 cells. Effect of miR-29a-3p
inhibitor and miR-29a-3p mimic on CDC42BPA, IQGAP2, PHLDB2, SSH1
and PAK1 mRNA expression was shown in (A) and (B), respectively.
(C) Western blot analysis using specific antibodies against the
corresponding cytoskeleton regulatory proteins was carried out and
the immunoreactive bands are as shown. (D) Densitometric analysis
using ImageJ was conducted to quantify the band intensities and the
intensity values of α-tubulin were used to normalize those of
target proteins. Data represent means ± SD from three independent
experiments, and statistical analysis was done using one-sample
t-test. The corresponding expression levels of control groups were
used as calibrators (set to 1), and the statistical values compared
to control group were displayed on the bar, respectively. CDC42BPA,
CDC42 binding protein kinase α (DMPK-like); IQGAP2, IQ motif
containing GTPase activating protein 2; PHLDB2, pleckstrin
homology-like domain, family B, member 2; SSH1, slingshot homolog
1; PAK1, P21 protein (Cdc42/Rac)-activated kinase 1. |
Measurement of alterations of protein
expression by western blotting
The protein level is influenced by several factors
apart from mRNA abundance. Thus, besides validating PCR array data
at the mRNA level, it is also important to determine the protein
levels. Three out of the five genes, CDC42BPA, IQGAP2 and SSH1 were
selected for protein expression analysis due to the following
reasons: i) CDC42BPA is the only potential direct target of
miR-29a-3p. ii) IQGAP2 is the gene showed the largest-fold change
and lowest Ct value (highest mRNA abundance). iii) Both
polymerization and depolymerization of actin need to be activated
to promote cell invasion and migration. SSH1 is the only gene
related to depolymerization.
Cells were collected at 72 h after miR-29a-3p
inhibitor and miR-29a-3p mimic transfection and the protein levels
were assessed by western blot analysis (Fig. 5C). Statistical analysis was done
using one-sample t-test and the corresponding P-values were shown
in the bar charts (Fig. 5D). The
western blot analysis results were consistent with the mRNA
results. Transfection of miR-29a-3p inhibitor increased protein
expression of CDC42BPA, IQGAP2, and SSH1, while miR-29a-3p mimic
reduced protein expression of these three genes.
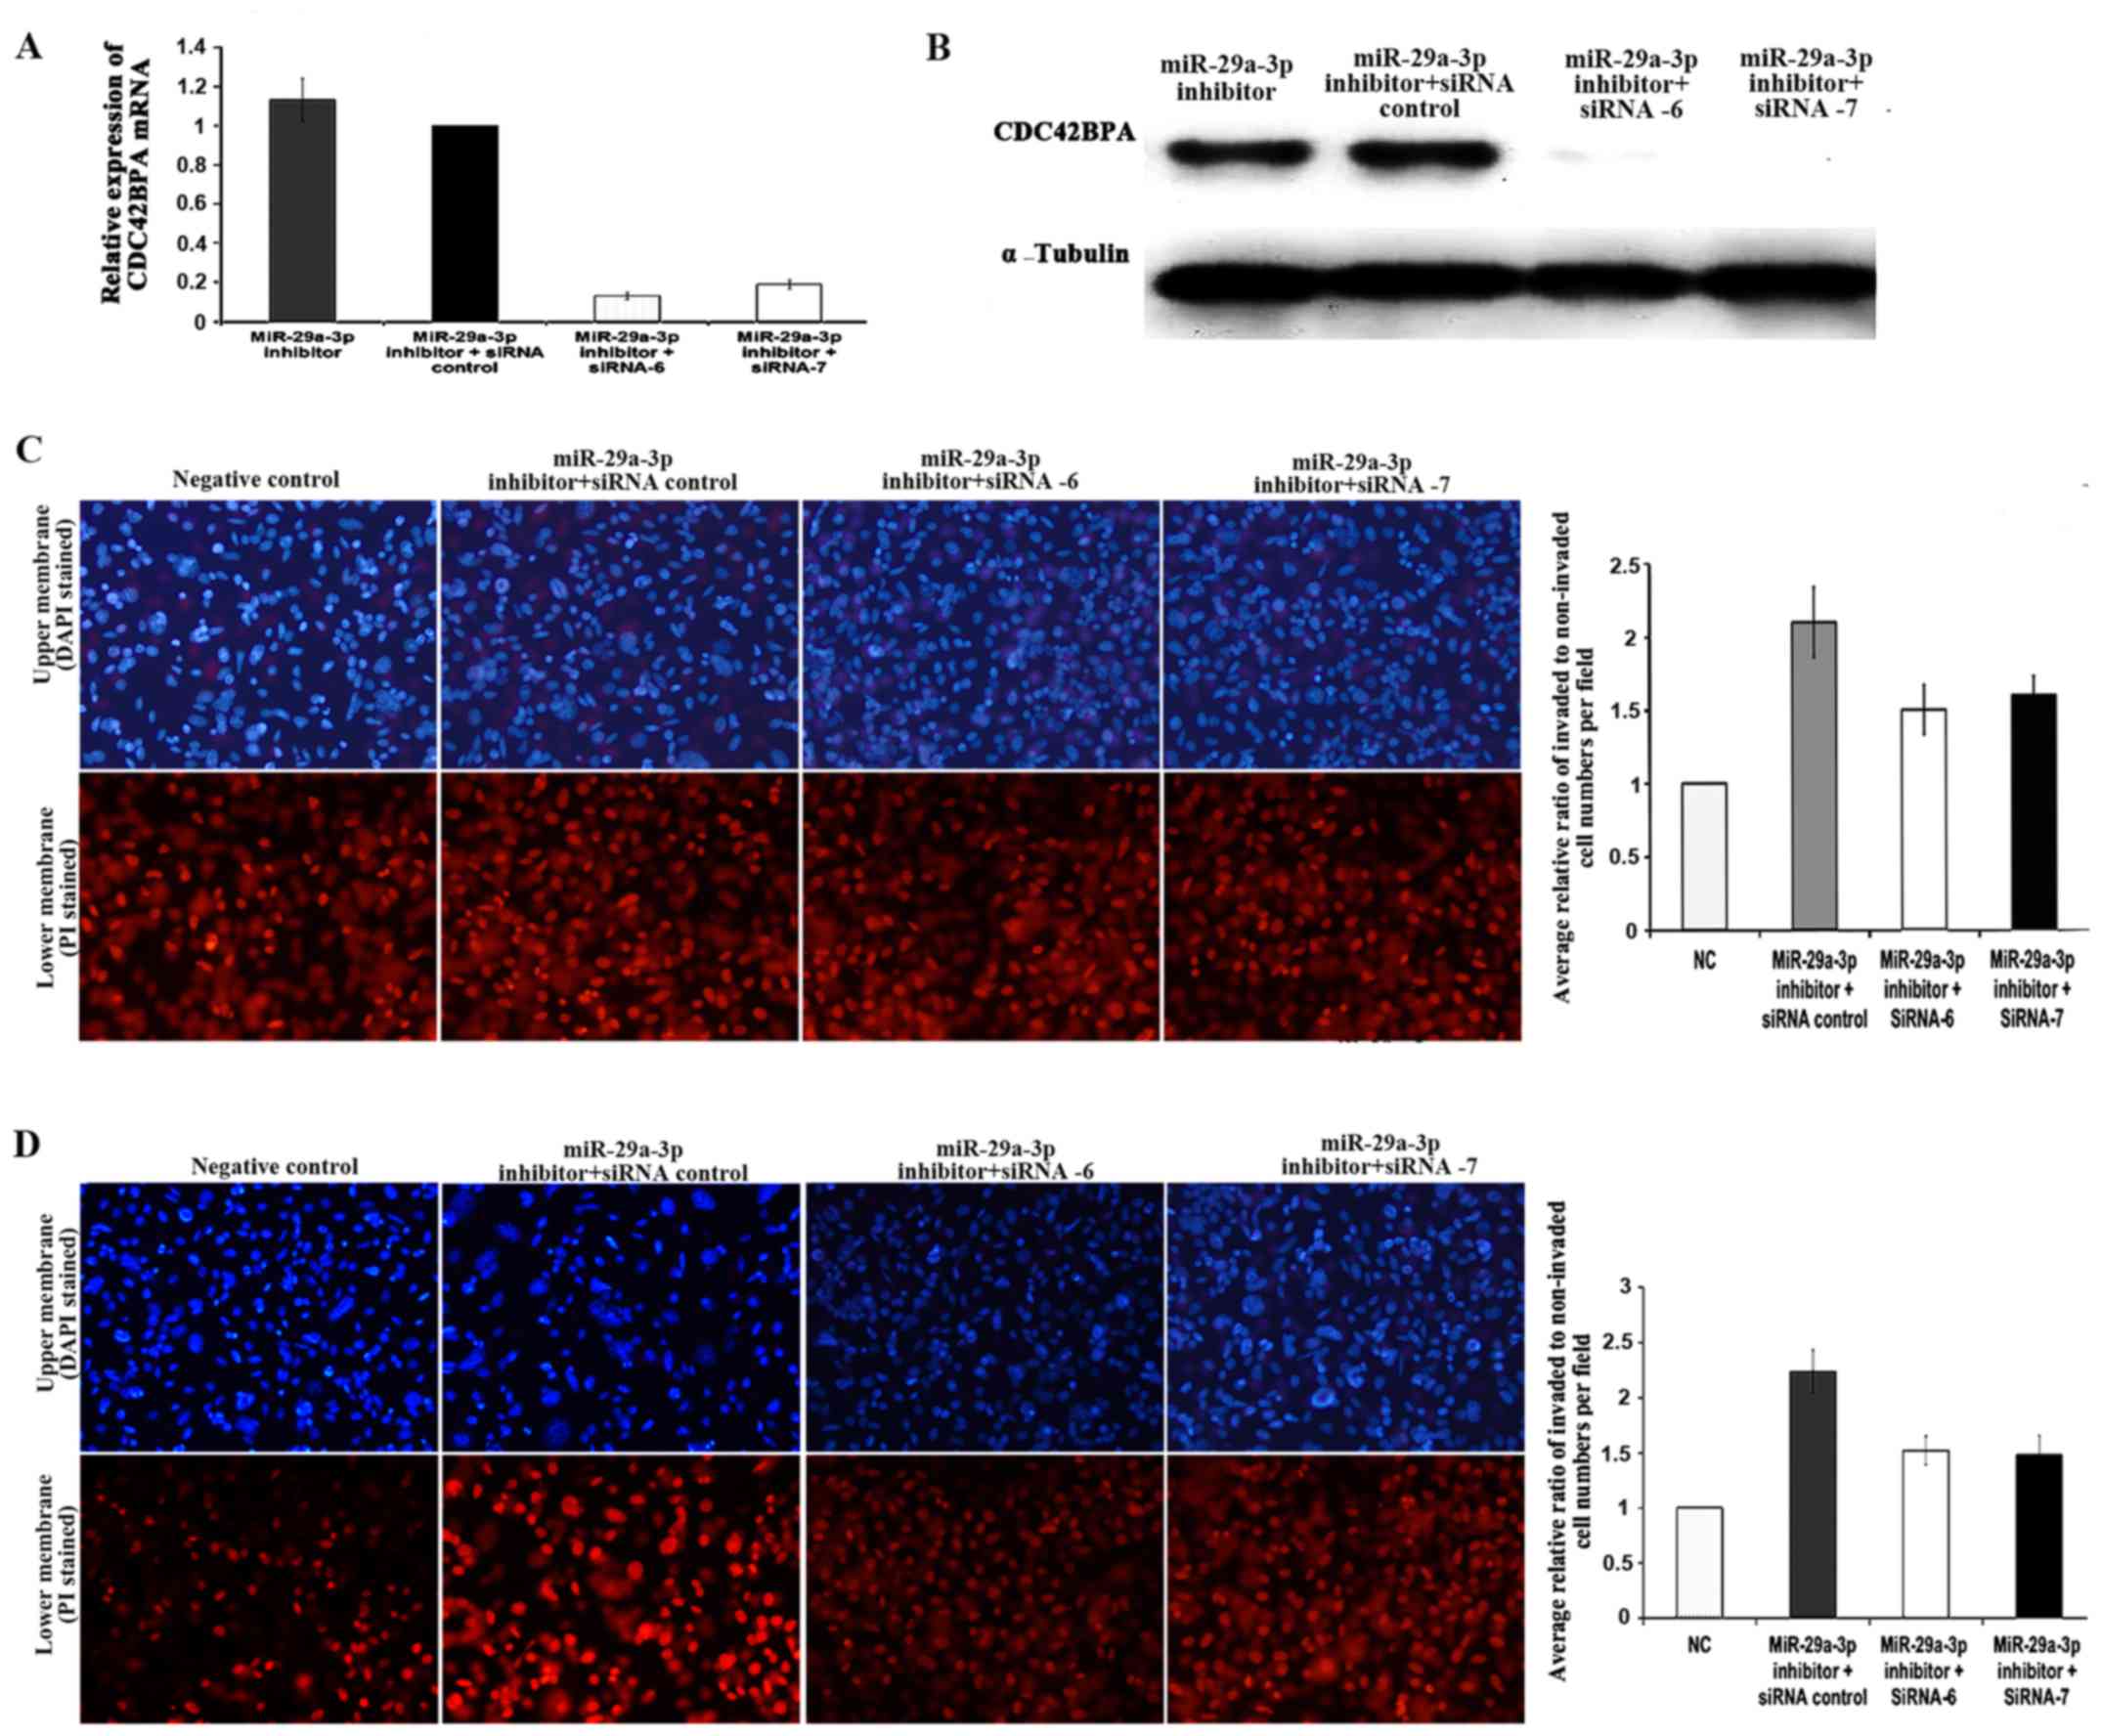
Effects of CDC42BPA on miR-29a-3p
inhibitor-induced stimulation of cell migration and invasion
Small interfering RNA (siRNA) is a type of synthetic
non-coding RNA (21–23 nucleotides) that inhibits gene expression by
binding to a specific mRNA molecule (20). In recent years, siRNAs have been
used to investigate single gene function. In the present study, two
CDC42BPA-specific siRNAs, siRNA-6 and siRNA-7, were used to silence
CDC42BPA. There were four groups: miR-29a-3p inhibitor group (group
A) was transfected with miR-29a-3p inhibitor only; miR-29a-3p
inhibitor + siRNA control group (group B) was cotransfected with
miR-29a-3p inhibitor and siRNA control; miR-29a-3p inhibitor +
siRNA-6 group (group C) was cotransfected with miR-29a-3p inhibitor
and siRNA −6; miR-29a-3p inhibitor +siRNA-7 group (group D) was
cotransfected with miR-29a-3p inhibitor and siRNA-7. RT-qPCR and
western blot analyses were carried out to verify CDC42BPA silencing
at mRNA level and protein level, respectively. The silencing of
CDC42BPA mRNA expression induced by siRNA-6 and siRNA-7 was
summarized in Fig. 6A. Statistical
analysis was done using one-sample t-test. The CDC42BPA expression
level of group B was used as calibrator which was set as 1, and
relative mRNA expression of other groups was compared to control
group. As a result, mRNA expression levels of CDC42BPA were reduced
significantly by siRNA-6 (P=0.0001) and siRNA-7 (P=0.0003). Both
siRNA-6 and siRNA-7 were observed to induce silencing with greater
than 80% efficiency. In accordance with the mRNA expression
results, the western blot analysis results indicated that either
siRNA-6 or siRNA-7 suppressed the protein expression of CDC42BPA
(Fig. 6B).
To demonstrate the functional relevance of CDC42BPA
in miR-29a-3p inhibitor-induced stimulation of cell invasion and
migration, siRNA-6 and siRNA-7, were employed to silence CDC42BPA
followed by cell invasion and migration assay. The results of cell
invasion assay showed that cell invasion in siRNA control group was
2.11-fold higher than that of NC group, while siRNA-6 group and
siRNA-7 group exhibited 1.49- and 1.61-fold higher cell invasion,
respectively (Fig. 6C). The cell
invasion capability of siRNA control group (p=0.0137), siRNA-6
group (p=0.0338) and siRNA-7 group (p=0.0131) were higher than that
of NC group. However, the cell invasion capability of siRNA-6 group
(P<0.05) and siRNA-7 group (P<0.05) was lower than that of
siRNA control group. The results of migration assay indicated that
cell migration of siRNA control group was 2.24-fold higher than
that of NC group, while siRNA-6 group and siRNA-7 group exhibited
1.52- and 1.48-fold higher cell migration, respectively (Fig. 6D). The cell migration capability of
siRNA control group, siRNA-6 group and siRNA-7 group were higher
than that of NC group. However, the cell migration capability of
siRNA-6 group and siRNA-7 group was lower than that of siRNA
control group. Taken together, all the results suggested that
CDC42BPA knockdown partially rescued the miR-29a-3p
inhibitor-induced stimulation of cell invasion and migration in
SW480-7 cells.
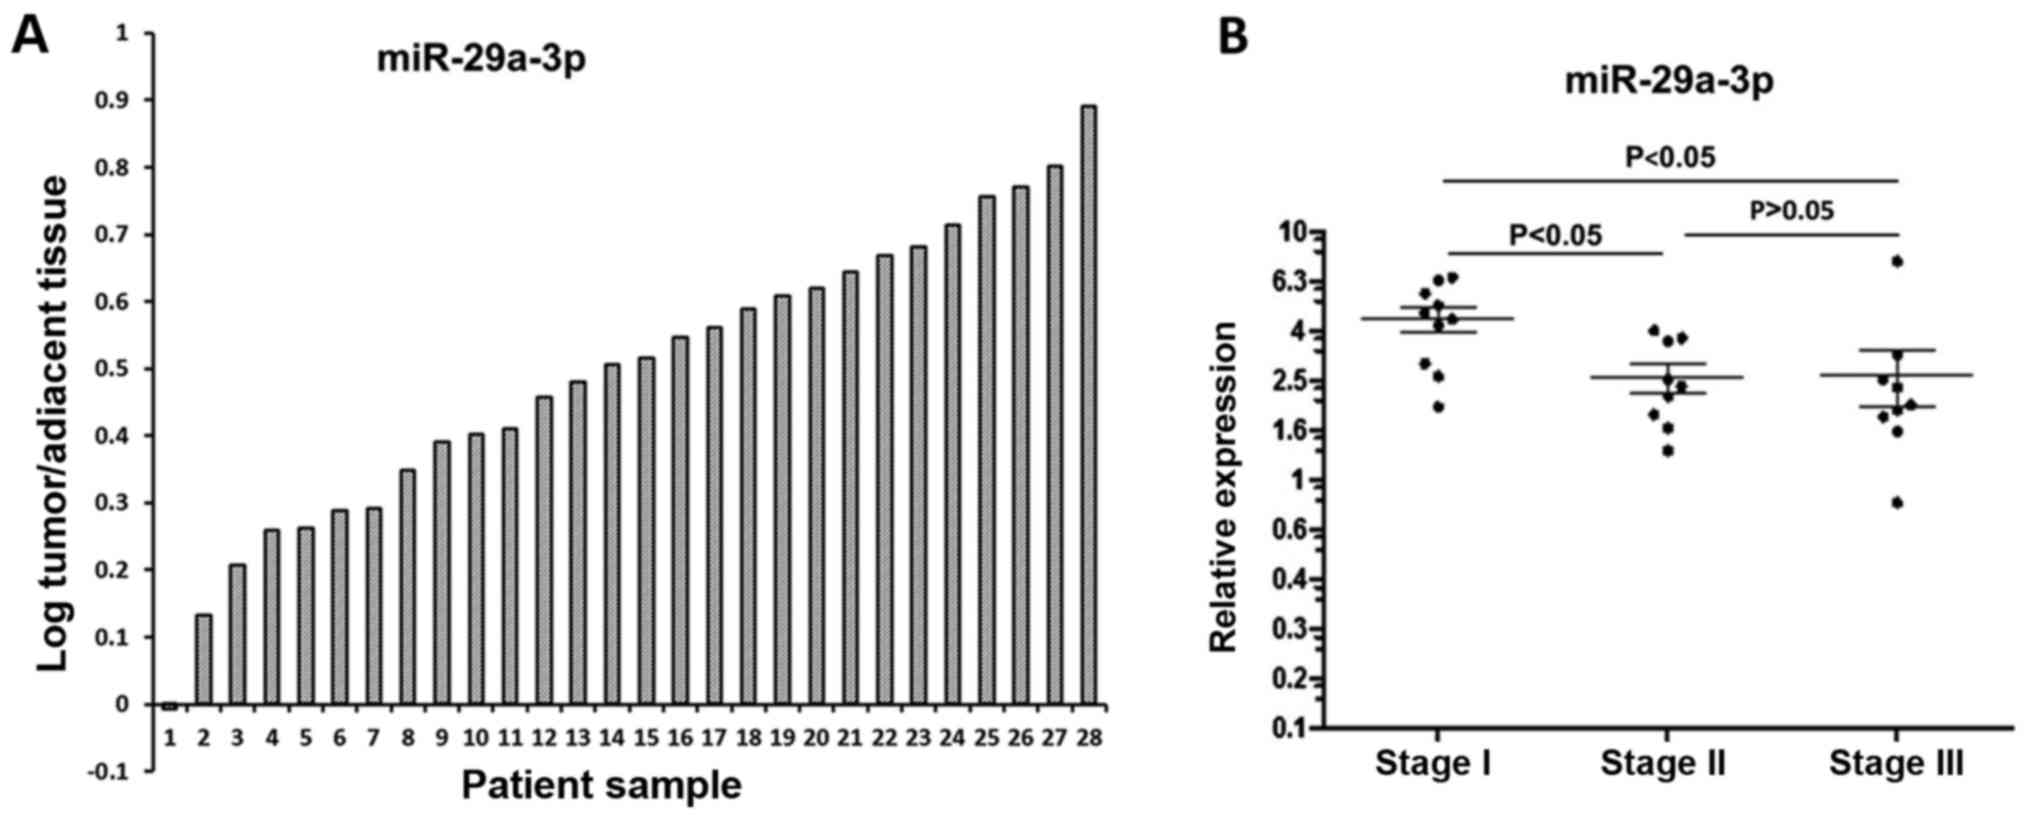
miR-29a-3p expression in colorectal
cancer tissues and matched normal adjacent tissues
The expression of miR-29a-3p was assessed in 28
human colorectal cancer tissues and matched normal adjacent tissues
(Fig. 7A). Of the 28 pairs of
matched tissues, 27 pairs showed elevated expression of miR-29a-3p
in tumor tissue. Statistical analysis was done using paired t-test.
The paired comparison of miR-29a-3p expression between tumor
tissues and normal adjacent tissues from the same patients showed a
significant increase of miR-29a-3p expression in colorectal cancer
tissues (2.803±1.852 vs 1.121±0.557; P=0.0115).
miR-29a-3p expression in colorectal
cancer tissues of various stages miR-29a-3p was detected in
twenty-eight human CRC tissues
According to TNM staging system, these colorectal
cancer samples can be divided into three subgroups: stage I
consisting of 10 samples, stage II consisting of 9 samples, and
stage III consisting of 9 samples. The expression pattern of
miR-29a-3p in various stages is shown in Fig. 7B. One-way analysis of variance was
used to compare means of three stages indicating that the highest
level was found in stage I (P<0.05 vs stage II; P<0.05 vs
stage III), while there was no significant difference between stage
II and stage III (P>0.05). Furthermore, correlation between
miRNA expression and colorectal cancer staging was analyzed using
Spearman rank correlation test. The result indicated that there was
negative correlation between miR-29a-3p expression and colorectal
cancer staging (P=0.0032). However, the data need to be interpreted
with caution due to the small sample size.
Discussion
Currently, the most widely used approaches to
investigate the biological functions of miRNAs in cancer are
phenotypic assays following loss-of-function and gain-of-function
experiments. Loss-of-function experiments are always performed in
conjunction with gain-of-function experiments to provide abundant
evidence to establish the function of studied miRNAs.
Loss-of-function experiments using miRNA inhibitor are best
performed in cells that express the endogenous miRNAs at relatively
high levels so that the alteration of target genes in response to
miRNA inhibition can be obviously detected. Similarly, as miRNA
mimics downregulate direct targets, gain-of-function experiments
using miRNA mimics should be conducted in cells with low endogenous
miRNAs and corresponding high target gene expression. The results
of the present study showed that miR-29a-3p was detectable in all
the five colorectal cancer cell lines, and SW480 was the cell line
with moderate expression level of miR-29a-3p.
MTT assay was performed as a preliminary
investigation to evaluate the effect of miR-29a-3p on the three
cell growth-associated phenotypes. The results showed that neither
miR-29a-3p inhibitor nor mimic had an effect on cell viability of
the three colorectal cancer cell lines. Our result is in accordance
with a previous study conducted by Tang et al which showed
that miR-29a-3p has no influence on cell cycle regulation and cell
proliferation in HCT116 cells (25). Several relevant studies also have
been found regarding the effects of miR-29b-3p on cell viability of
other kinds of cancers, including gastric cancer and oral squamous
cell carcinoma. Lower levels of miR-29a-3p were detected in gastric
cancer samples compared with normal adjacent tissue. A further
functional study indicated that miR-29a-3p inhibits cell growth of
gastric cancer in vitro (29). miR-29a-3p inhibitor or mimic was
transfected into two oral squamous cell carcinoma, SCC-25 and SCC-9
cells, and the following MTT assay indicated that both mimic and
inhibitor have no effect on the cell growth of the two cell lines
within 96 h after transfection (15). The latter study is consistent with
our data with the three colorectal cancer cell lines.
Abnormal cell growth and metastasis are regarded as
the two major characteristics of cancer (30). Since miR-29a-3p had no effects on
cell viability of the three selected colorectal cancer cell lines,
further studies were carried out to investigate the effects of
miR-29a-3p on cell invasion and migration which play an essential
role in cancer metastasis. Relatively high invasive cell lines are
required to show suppression of cell invasion due to miR-29a-3p
inhibition. Unfortunately, the invasive properties of the three CRC
cell lines were very poor and none of the three CRC cell lines
achieved adequate invasion for quantification experiments. For
SW620 and HCT116, almost no cells passed through the insert, whilst
for SW480, a few cells invaded and were observed at the bottom of
the insert. An invasive subpopulation called SW480-7 was then
derived in vitro by subjecting SW480 parental cells to 7
sequential passages through Matrigel-coated 8.0-µm pore
polycarbonate membrane. This is a common method to gain an invasive
subpopulation from established cancer cell lines by using Transwell
inserts in vitro (31,32).
It is unclear why HCT116 used in the present study was not
invasive. This differed from that by Tang et al (25). The difference may be due to the late
passage of HCT116 used in this study.
Since published data have shown that miR-29a-3p is
overexpressed in CRC tissue compared to normal adjacent tissue,
knockdown of miR-29a-3p was hypothesized to inhibit cell invasion
and migration. Unexpectedly, the results indicated that miR-29a-3p
inhibition in SW480-7 cells stimulated cell invasion and migration.
This could be attributed to alterations in the expression of some
targets due to loss of miR-29a-3p expression resulting in increased
cell migration and invasion. In order to elucidate the underlying
mechanism contributing to cell migration and invasion, Cytoskeleton
Regulators PCR array analysis was performed to identify the genes
implicated in increased cell motility in miR-29a-3p-inhibitor
transfected cells. Although majority of the published functional
studies of miRs are focused on direct target determination, both
direct targets and indirect targets are essential to exert full
functional effects of miRs (33).
Therefore, the present study was designed to elucidate the
downstream changes in mRNAs by miRNA-29a-3p inhibitor or mimic
instead of identifying individual direct target which is usually
carried out using the luciferase assay. In the present study, only
the genes associated with cell migration and invasion were of
interest and this was assessed by using the Cytoskeleton Regulator
RT2 Profiler PCR array where expression levels of 84
cell cytoskeleton-associated mRNAs can be measured in response to
the miR-29a-3p inhibitor. The dynamic reorganization of the cell
cytoskeleton is an essential requirement for cell motility. Both
polymerization and depolymerization of cell cytoskeleton are
required to be maintained at a relatively high level to ensure a
high speed of directional cell movement. Highest-fold change was
observed with CDC42BPA and it was selected for siRNA experiments.
The expression levels of four other mRNAs, IQGAP2, PHLDB2, SSH1 and
PAK1 were most significantly altered in response to miR-29a-3p
inhibition. The three widely used databases, TargetScan, miRBD and
DIANA were used to predict the target genes of miR-29a-3p amongst
the 84 mRNAs in the PCR array and identified CDC42BPA as the
predicted target. This is consistent with a recent report showing
CDC42BPA as a direct target gene of miR-29a in a luciferase assay
(34). To further validate the
accuracy and reproducibility of data from PCR array, another two
independent experiments were performed to confirm the increased
expression of CDC42BPA, IQGAP2, PHLDB2 and SSH1 mRNAs, and reduced
expression of PAK1 mRNA by RT-qPCR. The results from the
RT2 Profiler PCR array were consistent with the RT-qPCR
data. As off-target effect is an unavoidable phenomenon in RNA
interference experiments, a commonly used strategy to exclude
possible off-target effects is to reverse the effect of miR-29a-3p
inhibitor by increasing intracellular miR-29a-3p levels with the
miR-29a-3p mimic. The miR-29a-3p mimic downregulated the expression
of CDC42BPA, IQGAP2, PHLDB2 and SSH1 mRNAs and upregulated PAK1
mRNA expression. In conclusion, miR-29a-3p mimic can reverse the
effect of miR-29a-3p inhibitor on expression of these five mRNAs
which provides supporting evidence for the role of miR-29a-3p as a
regulator of these five genes.
Besides mRNA abundance, protein levels are
influenced by other factors such as mRNA stability and RNA-protein
interactions (35). To confirm that
alterations of CDC42BPA, IQGAP2 and SSH1 mRNA by miR-29a-3p also
lead to changes in protein levels, western blotting was performed.
Of these mRNAs, SSH1 is the only one involved in actin
depolymerization, CDC42BPA is the only potential direct target of
miR-29a-3p as predicted by TargetScan and DIANA and IQGAP2 showed
the largest-fold change and highest mRNA abundance. Both western
blot analysis and RT-qPCR results show increased levels CDC42BPA,
IQGAP2, and SSH1 in miR-29a-3p inhibitor-transfected cells, while
miR-29a-3p mimic reduced the level of these mRNAs and proteins. In
most cases, a specific microRNA tends to decrease the target
proteins to a moderate degree. A report by Selbach et al
showed that changes in synthesis of protein in response to
endogenous miRNA knockdown or miRNA transfection at a genome-wide
scale were moderate and most changes were <4-fold (36). In the present study, the changes in
protein expression were in the range of 2.4- to 4.2-fold which is
in agreement with Selbach et al (36). Although CDC42BPA, SSH1 and IQGAP2
protein levels were increased by miR-29a-3p inhibitor, their
functional relevance in increasing cell migration and invasion
currently remains unclear. Actin dynamics, assembly of focal
adhesions and contractility are three major factors that impact
cell motility. SSH1 is shown to increase actin filaments
disassembly through activating cofilin (37). It is demonstrated that IQGAP2
interacts with both active GTP-bound CDC42 and inactive GDP-bound
CDC42 (38). CDC42BPA, a
serine/threonine-protein kinase is an important downstream effector
of CDC42 and plays a role in the regulation of cytoskeleton
reorganization and cell migration. It enhances cell motility
through promoting contractile force generation and stress fibre
formation (39). In addition,
CDC42BPA enhances the connection between cell cytoskeleton to
plasma membrane (40). Since
CDC42BPA is highly correlated to cell motility, it is selected for
further functional studies.
Both CDC42BPC siRNAs (siRNA-6 or siRNA-7) could
knockdown CDC42BPA expression at both mRNA level and protein level
resulting in partial reduction of miR-29a-3p inhibitor-induced
stimulation of cell migration and invasion. This supports the role
of CDC42BPA in reducing miR-29a-3p-induced cell migration and
invasion but CDC42BPA silencing did not completely abolish the
effects of miR-29a-3p inhibitor. Thus, this suggests that
miR-29a-3p may also simultaneously modulate other genes to suppress
cell migration and invasion. To the best of our knowledge, this is
the first report showing that miR-29a-3p partially suppresses cell
migration and invasion in colorectal cancer cells through targeting
CDC42BPA. In contrast, a previous study reported that miR-29a-3p
promoted invasion and metastasis of another colorectal cancer cell
line, LoVo through targeting Kruppel-like factor 4 (KLF4) which is
a tumor suppressor gene (25).
Hence, depending on the cell line and miR-29 target, invasion and
migration can be up- or downregulated.
Since miR-29a-3p level was higher in both serum and
tissue of CRC patients with liver metastases than that in patients
without metastasis, this suggests that miR-29a-3p is likely to act
as an oncogene (7). Thus, we
expected that the miR-29a-3p inhibitor would inhibit SW480-7 cell
migration and invasion. Instead, we found that the inhibitor of
miR-29a-3p enhanced SW480-7 cell migration and invasion whilst the
mimic had the opposite effect. This appeared to contradict the
oncogenic role of miR-29a-3p. However, similar findings have been
reported with miR-145. As with miR-29a, higher expression of
miR-145 was detected in CRC tissues in metastatic cases in
comparison to those without metastasis suggesting that it was an
oncogene (41). In vitro
studies support the oncogenic role of miR-145, whereby, cell
proliferation was promoted in SW620 cell line and migration and
cell invasion was stimulated in HCT8 when miR-145 was overexpressed
(41). Unexpectedly, miR-145 acted
as a tumor suppressor in SW480 cell line when expression of miR-145
was enforced (42) and this is
similar to our observation with the miR-29a-3p mimic. The studies
by Akao et al (43) and
Arndt et al (44) also
demonstrated that miR-145 can exhibit opposite roles in different
cell lines suggesting that the biological function of microRNAs
depend on the cellular context. Arndt et al (44) suggested that the absence of
oncogenic target genes and presence of unknown anti-proliferative
targets may contribute to the oncogenic function of miR-145 in
SW620 cells. Likewise, the presence of some unknown pro-migratory
targets or absence of some anti-migratory targets, may be a
possible explanation for the promotion of cell migration and
invasion by miR-29a-3p inhibitor in SW480-7 cells. It should also
be noted that miR-145 has also been found to be downregulated in
CRC tissues compared with normal adjacent tissues (23,43,44).
The expression pattern of miR-145 in different subtypes of CRC
tissue may be an explanation for the seemingly contradictory
results on miR-145.
Our present study revealed that miR-29a-3p was
detected in CRC tissues from three stages (stage I, stage II and
stage III) and their corresponding normal adjacent tissues. In
accordance with previous studies (3,23,24),
the present study showed that miR-29a-3p is overexpressed in CRC
tissues as compared to the matched normal adjacent tissues. On
further analysis, we found that miR-29a-3p expression in stage II
and III is relatively lower than that of stage I. This observation
is consistent with a previous clinical study showing the presence
of miR-29a-3p in stage II CRC samples and high miR-29a expression
was associated with longer disease-free survival (27). SW480, the cell line used in the
present study, is a colorectal cancer cell line derived from a
patient with stage II colorectal cancer (https://www.atcc.org/Products/All/CCL-228.aspx#generalinformation).
At stage II, CRC has spread through the serosa to nearby organs
displaying higher migration and invasion capacity compared to stage
I CRC. Our data imply that the decrease in miR-29a-3p due to
introduction of miR-29a-3p inhibitor may be responsible for the
increased migration and invasion capacity of SW480-7. To the best
of our knowledge, this is the first report showing miR-29a-3p
expression pattern in three different stages in CRC. However, this
result need to be interpreted with caution since the sample size of
CRC tissue was small and further verification with increased sample
size is required.
In conclusion, we found that miR-29a-3p was
expressed in five colorectal cancer cell lines and is overexpressed
in primary CRC tissues as compared to matched normal adjacent
tissue. miR-29a-3p inhibitor had no effect on viability of
colorectal cancer cell lines but stimulated cell migration and
invasion of SW480-7 cells. In contrast, miR-29a-3p mimic decreased
cell migration and invasion. The increased migration and invasion
observed is likely due to increased expression of
cytoskeleton-associated elements such as CDC42BPA, IQGAP2, PHLDB2,
and SSH1. Silencing of CDC42BPA, a predicted direct target of
miR-29a-3p, partially inhibited cell migration and invasion. These
findings indicated that miR-29a-3p can potentially be useful for
miRNA-based treatment of CRC patients.
Acknowledgements
The authors wish to thank the financial support of
the Putra university under grant number GP-IPS/2014/943395 and the
Malaysian Ministry of Science, Technology and Innovation under
grant no. 02-01-04-SF1312. We would also like to express our
appreciation to Samuel Leon Juan Khoo for helpful discussion on
experimental techniques.
References
|
1
|
Torre LA, Bray F, Siegel RL, Ferlay J,
Lortet-Tieulent J and Jemal A: Global cancer statistics, 2012. CA
Cancer J Clin. 65:87–108. 2015. View Article : Google Scholar : PubMed/NCBI
|
|
2
|
Wightman B, Ha I and Ruvkun G:
Posttranscriptional regulation of the heterochronic gene lin-14 by
lin-4 mediates temporal pattern formation in C. elegans.
Cell. 75:855–862. 1993. View Article : Google Scholar : PubMed/NCBI
|
|
3
|
Motoyama K, Inoue H, Takatsuno Y, Tanaka
F, Mimori K, Uetake H, Sugihara K and Mori M: Over- and
under-expressed microRNAs in human colorectal cancer. Int J Oncol.
34:1069–1075. 2009.PubMed/NCBI
|
|
4
|
Du Y, Wang L, Wu H, Zhang Y, Wang K and Wu
D: MicroRNA-141 inhibits migration of gastric cancer by targeting
zinc finger E-box-binding homeobox 2. Mol Med Rep. 12:3416–3422.
2015. View Article : Google Scholar : PubMed/NCBI
|
|
5
|
Kato M, Goto Y, Matsushita R, Kurozumi A,
Fukumoto I, Nishikawa R, Sakamoto S, Enokida H, Nakagawa M,
Ichikawa T, et al: MicroRNA-26a/b directly regulate La-related
protein 1 and inhibit cancer cell invasion in prostate cancer. Int
J Oncol. 47:710–718. 2015. View Article : Google Scholar : PubMed/NCBI
|
|
6
|
Kawano M, Tanaka K, Itonaga I, Ikeda S,
Iwasaki T and Tsumura H: microRNA-93 promotes cell proliferation
via targeting of PTEN in osteosarcoma cells. J Exp Clin Cancer Res.
34:762015. View Article : Google Scholar : PubMed/NCBI
|
|
7
|
Wang L-G and Gu J: Serum microRNA-29a is a
promising novel marker for early detection of colorectal liver
metastasis. Cancer Epidemiol. 36:e61–e67. 2012. View Article : Google Scholar : PubMed/NCBI
|
|
8
|
Shukla K, Sharma AK, Ward A, Will R,
Hielscher T, Balwierz A, Breunig C, Münstermann E, König R,
Keklikoglou I, et al: MicroRNA-30c-2-3p negatively regulates NF-κB
signaling and cell cycle progression through downregulation of
TRADD and CCNE1 in breast cancer. Mol Oncol. 9:1106–1119. 2015.
View Article : Google Scholar : PubMed/NCBI
|
|
9
|
Wang Y, Zhang X, Li H, Yu J and Ren X: The
role of miRNA-29 family in cancer. Eur J Cell Biol. 92:123–128.
2013. View Article : Google Scholar : PubMed/NCBI
|
|
10
|
Jiang H, Zhang G, Wu JH and Jiang CP:
Diverse roles of miR-29 in cancer (review). Oncol Rep.
31:1509–1516. 2014. View Article : Google Scholar : PubMed/NCBI
|
|
11
|
Wang D, Qiu C, Zhang H, Wang J, Cui Q and
Yin Y: Human microRNA oncogenes and tumor suppressors show
significantly different biological patterns: From functions to
targets. PLoS One. 5:e130672010. View Article : Google Scholar : PubMed/NCBI
|
|
12
|
Esquela-Kerscher A and Slack FJ: Oncomirs
- microRNAs with a role in cancer. Nat Rev Cancer. 6:259–269. 2006.
View Article : Google Scholar : PubMed/NCBI
|
|
13
|
Zhao Z, Wang L, Song W, Cui H, Chen G,
Qiao F, Hu J, Zhou R and Fan H: Reduced miR-29a-3p expression is
linked to the cell proliferation and cell migration in gastric
cancer. World J Surg Oncol. 13:1012015. View Article : Google Scholar : PubMed/NCBI
|
|
14
|
Zhao D, Jiang X, Yao C, Zhang L, Liu H,
Xia H and Wang Y: Heat shock protein 47 regulated by miR-29a to
enhance glioma tumor growth and invasion. J Neurooncol. 118:39–47.
2014. View Article : Google Scholar : PubMed/NCBI
|
|
15
|
Lu L, Xue X, Lan J, Gao Y, Xiong Z, Zhang
H, Jiang W, Song W and Zhi Q: MicroRNA-29a upregulates MMP2 in oral
squamous cell carcinoma to promote cancer invasion and
anti-apoptosis. Biomed Pharmacother. 68:13–19. 2014. View Article : Google Scholar : PubMed/NCBI
|
|
16
|
Yamamoto N, Kinoshita T, Nohata N, Yoshino
H, Itesako T, Fujimura L, Mitsuhashi A, Usui H, Enokida H, Nakagawa
M, et al: Tumor-suppressive microRNA-29a inhibits cancer cell
migration and invasion via targeting HSP47 in cervical squamous
cell carcinoma. Int J Oncol. 43:1855–1863. 2013. View Article : Google Scholar : PubMed/NCBI
|
|
17
|
Zhu XC, Dong QZ, Zhang XF, Deng B, Jia HL,
Ye QH, Qin LX and Wu XZ: microRNA-29a suppresses cell proliferation
by targeting SPARC in hepatocellular carcinoma. Int J Mol Med.
30:1321–1326. 2012. View Article : Google Scholar : PubMed/NCBI
|
|
18
|
Volinia S, Calin GA, Liu CG, Ambs S,
Cimmino A, Petrocca F, Visone R, Iorio M, Roldo C, Ferracin M, et
al: A microRNA expression signature of human solid tumors defines
cancer gene targets. Proc Natl Acad Sci USA. 103:2257–2261. 2006.
View Article : Google Scholar : PubMed/NCBI
|
|
19
|
Yanaihara N, Caplen N, Bowman E, Seike M,
Kumamoto K, Yi M, Stephens RM, Okamoto A, Yokota J, Tanaka T, et
al: Unique microRNA molecular profiles in lung cancer diagnosis and
prognosis. Cancer Cell. 9:189–198. 2006. View Article : Google Scholar : PubMed/NCBI
|
|
20
|
Han YC, Park CY, Bhagat G, Zhang J, Wang
Y, Fan JB, Liu M, Zou Y, Weissman IL and Gu H: microRNA-29a induces
aberrant self-renewal capacity in hematopoietic progenitors, biased
myeloid development, and acute myeloid leukemia. J Exp Med.
207:475–489. 2010. View Article : Google Scholar : PubMed/NCBI
|
|
21
|
Santanam U, Zanesi N, Efanov A, Costinean
S, Palamarchuk A, Hagan JP, Volinia S, Alder H, Rassenti L, Kipps
T, et al: Chronic lymphocytic leukemia modeled in mouse by targeted
miR-29 expression. Proc Natl Acad Sci USA. 107:12210–12215. 2010.
View Article : Google Scholar : PubMed/NCBI
|
|
22
|
Wu Q, Wang C, Lu Z, Guo L and Ge Q:
Analysis of serum genome-wide microRNAs for breast cancer
detection. Clin Chim Acta. 413:1058–1065. 2012. View Article : Google Scholar : PubMed/NCBI
|
|
23
|
Bandrés E1, Cubedo E, Agirre X, Malumbres
R, Zárate R, Ramirez N, Abajo A, Navarro A, Moreno I, Monzó M, et
al: Identification by Real-time PCR of 13 mature microRNAs
differentially expressed in colorectal cancer and non-tumoral
tissues. Mol Cancer. 5:292006. View Article : Google Scholar : PubMed/NCBI
|
|
24
|
Kara M, Yumrutas O, Ozcan O, Celik OI,
Bozgeyik E, Bozgeyik I and Tasdemir S: Differential expressions of
cancer-associated genes and their regulatory miRNAs in colorectal
carcinoma. Gene. 567:81–86. 2015. View Article : Google Scholar : PubMed/NCBI
|
|
25
|
Tang W, Zhu Y, Gao J, Fu J, Liu C, Liu Y,
Song C, Zhu S, Leng Y, Wang G, et al: MicroRNA-29a promotes
colorectal cancer metastasis by regulating matrix metalloproteinase
2 and E-cadherin via KLF4. Br J Cancer. 110:450–458. 2014.
View Article : Google Scholar : PubMed/NCBI
|
|
26
|
Kuo TY, Hsi E, Yang IP, Tsai PC, Wang JY
and Juo SH: Computational analysis of mRNA expression profiles
identifies microRNA-29a/c as predictor of colorectal cancer early
recurrence. PLoS One. 7:e315872012. View Article : Google Scholar : PubMed/NCBI
|
|
27
|
Weissmann-Brenner A, Kushnir M, Yanai
Lithwick G, Aharonov R, Gibori H, Purim O, Kundel Y, Morgenstern S,
Halperin M, Niv Y, et al: Tumor microRNA-29a expression and the
risk of recurrence in stage II colon cancer. Int J Oncol.
40:2097–2103. 2012.PubMed/NCBI
|
|
28
|
Yi R, Li Y, Wang FL, Miao G, Qi RM and
Zhao YY: MicroRNAs as diagnostic and prognostic biomarkers in
colorectal cancer. World J Gastrointest Oncol. 8:330–340. 2016.
View Article : Google Scholar : PubMed/NCBI
|
|
29
|
Chen L, Xiao H, Wang ZH, Huang Y, Liu ZP,
Ren H and Song H: miR-29a suppresses growth and invasion of gastric
cancer cells in vitro by targeting VEGF-A. BMB Rep. 47:39–44. 2014.
View Article : Google Scholar : PubMed/NCBI
|
|
30
|
Goubran HA, Kotb RR, Stakiw J, Emara ME
and Burnouf T: Regulation of tumor growth and metastasis: The role
of tumor microenvironment. Cancer Growth Metastasis. 7:9–18. 2014.
View Article : Google Scholar : PubMed/NCBI
|
|
31
|
Chu YW, Yang PC, Yang SC, Shyu YC, Hendrix
MJ, Wu R and Wu CW: Selection of invasive and metastatic
subpopulations from a human lung adenocarcinoma cell line. Am J
Respir Cell Mol Biol. 17:353–360. 1997. View Article : Google Scholar : PubMed/NCBI
|
|
32
|
Smith JJ, Deane NG, Wu F, Merchant NB,
Zhang B, Jiang A, Lu P, Johnson JC, Schmidt C, Bailey CE, et al:
Experimentally derived metastasis gene expression profile predicts
recurrence and death in patients with colon cancer.
Gastroenterology. 138:958–968. 2010. View Article : Google Scholar : PubMed/NCBI
|
|
33
|
Alshalalfa M and Alhajj R: Using
context-specific effect of miRNAs to identify functional
associations between miRNAs and gene signatures. BMC
Bioinformatics. 14 Suppl 12:S12013. View Article : Google Scholar : PubMed/NCBI
|
|
34
|
Li S, Shen L, Sun L, Xu J, Jin P, Chen L
and Ma F: Small RNA-Seq analysis reveals microRNA-regulation of the
Imd pathway during Escherichia coli infection in Drosophila.
Dev Comp Immunol. 70:80–87. 2017. View Article : Google Scholar : PubMed/NCBI
|
|
35
|
Blencowe B, Brenner S, Hughes T and Morris
Q: Post-transcriptional gene regulation: RNA-protein interactions,
RNA processing, mRNA stability and localization. Pac Symp
Biocomput. 14:545–548. 2009.
|
|
36
|
Selbach M, Schwanhäusser B, Thierfelder N,
Fang Z, Khanin R and Rajewsky N: Widespread changes in protein
synthesis induced by microRNAs. Nature. 455:58–63. 2008. View Article : Google Scholar : PubMed/NCBI
|
|
37
|
Ohta Y, Kousaka K, Nagata-Ohashi K, Ohashi
K, Muramoto A, Shima Y, Niwa R, Uemura T and Mizuno K: Differential
activities, subcellular distribution and tissue expression patterns
of three members of Slingshot family phosphatases that
dephosphorylate cofilin. Genes Cells. 8:811–824. 2003. View Article : Google Scholar : PubMed/NCBI
|
|
38
|
Brill S, Li S, Lyman CW, Church DM,
Wasmuth JJ, Weissbach L, Bernards A and Snijders AJ: The Ras
GTPase-activating-protein-related human protein IQGAP2 harbors a
potential actin binding domain and interacts with calmodulin and
Rho family GTPases. Mol Cell Biol. 16:4869–4878. 1996. View Article : Google Scholar : PubMed/NCBI
|
|
39
|
Leung T, Chen XQ, Tan I, Manser E and Lim
L: Myotonic dystrophy kinase-related Cdc42-binding kinase acts as a
Cdc42 effector in promoting cytoskeletal reorganization. Mol Cell
Biol. 18:130–140. 1998. View Article : Google Scholar : PubMed/NCBI
|
|
40
|
Nakamura N, Oshiro N, Fukata Y, Amano M,
Fukata M, Kuroda S, Matsuura Y, Leung T, Lim L and Kaibuchi K:
Phosphorylation of ERM proteins at filopodia induced by Cdc42.
Genes Cells. 5:571–581. 2000. View Article : Google Scholar : PubMed/NCBI
|
|
41
|
Kamatani A, Nakagawa Y, Akao Y, Maruyama
N, Nagasaka M, Shibata T, Tahara T and Hirata I: Downregulation of
anti-oncomirs miR-143/145 cluster occurs before APC gene aberration
in the development of colorectal tumors. Med Mol Morphol.
46:166–171. 2013. View Article : Google Scholar : PubMed/NCBI
|
|
42
|
Slaby O, Svoboda M, Fabian P, Smerdova T,
Knoflickova D, Bednarikova M, Nenutil R and Vyzula R: Altered
expression of miR-21, miR-31, miR-143 and miR-145 is related to
clinicopathologic features of colorectal cancer. Oncology.
72:397–402. 2007. View Article : Google Scholar : PubMed/NCBI
|
|
43
|
Akao Y, Nakagawa Y and Naoe T: MicroRNAs
143 and 145 are possible common onco-microRNAs in human cancers.
Oncol Rep. 16:845–850. 2006.PubMed/NCBI
|
|
44
|
Arndt GM1, Dossey L, Cullen LM, Lai A,
Druker R, Eisbacher M, Zhang C, Tran N, Fan H, Retzlaff K, et al:
Characterization of global microRNA expression reveals oncogenic
potential of miR-145 in metastatic colorectal cancer. BMC Cancer.
9:3742009. View Article : Google Scholar : PubMed/NCBI
|