Introduction
Worldwide, gastric cancer is the fourth most common
malignant tumor, accounting for ~8% of new cancer cases (1). It is the third leading cause of
cancer-related mortality, and the gastric cancer incidence in China
accounts for nearly half of all worldwide cases (2).
Currently, surgical resection is possibly the only
modality for a cure. However, since 70–90% of gastric cancer
patients are first diagnosed at an advanced stage, surgical
excision alone could not achieve a cure. Adjuvant chemotherapy has
been adopted as the standard treatment for advanced cancer for
disease-free survival and overall survival (3–6). The
MAGIC trial revealed that the 5-year survival rate of patients
receiving adjuvant chemotherapy was significantly higher than those
undergoing resection only (36 vs. 23%) (7).
The chemotherapeutic drugs 5-fluorouracil (5-FU),
cisplatin and paclitaxel are widely used anticancer agents.
However, chemotherapeutic drug resistance is a major cause of
treatment failure in patients with cancer. Previous studies
suggested a variety of resistance mechanisms in cancer cells
underlying the resistance to chemotherapeutic drugs. The
methylation of MLH1 promoter (8),
the overexpression of Bcl-2 (9),
Bcl-xL (9,10) and Mcl-1 (11), and the increased activity of
deoxyuridine triphosphatase (DUT) have been found to be associated
with drug resistance to 5-FU. AKT (12), c-ABL (13) and P53 signaling (14), as well as the proteins are related
to drug resistance to cisplatin. To identify the drug sensitivity
of gastric cancer patients in a chemotherapy regimen, and to choose
a personalized treatment plan for them are currently essential for
physicians.
The Protein Pathway Array (PPA) technology is a
proteomic method that can globally characterize proteins and
identify changes in protein expression (15). In the present study, the PPA method
was used to identify differentially expressed proteins which
contributed to chemotherapy resistance and were involved in
signaling pathways in patients with gastric cancer. In addition,
the independent risk factors among proteins were screened by
multivariable logistic regression analysis. Moreover, the
prediction model for chemotherapy resistance was built based on the
risk factors and risk coefficient. The present study may help
clinicians to develop an individualized course of treatment for
patients with gastric cancer.
Materials and methods
Patients and samples
From February 2008 to July 2010, a total of 140
patients with clinical stage III gastric cancer (7th AJCC)
undergoing D2 radical gastrectomy and postoperative chemotherapy at
the First Hospital of Jilin University were enrolled in the present
study. All patients were given a written informed consent document
before treatment. All patients were followed up for at least 2
years: in the first year, the patients were followed-up for disease
status, physical examination, serum tumor marker and abdominal
ultrasonography every 3 months, and a routine CT scan of the
abdomen every 6 months; in the second year, disease status,
physical examination, serum tumor marker and abdominal
ultrasonography every 6 months, and a routine CT scan of the
abdomen each year. Disease-free survival in patients was the period
after curative treatment when no disease could be detected.
All tumor samples were resected from freshly
biopsied tumor specimens: ~3 × 3 × 5 mm3 of tumor
tissues were obtained to avoid necrotic tumor tissues and the
surrounding tissues, and the tumor tissues were frozen in liquid
nitrogen for 24 h, and stored at −80°C. The other specimens were
fixed in neutral-buffered formalin, embedded in paraffin, and
confirmed histologically by two pathologists for tumor location,
tumor size, depth of invasion, degree of lymph node metastasis and
histological type.
Total protein extraction
The 3 × 3 × 5 mm3 frozen tissues were
ground and homogenized. Then, the protein concentration was
quantified by the bicinchoninic acid (BCA) method (Pierce,
Rockford, IL, USA) and the solution was adjusted to ~1 µg/µl.
SDS-PAGE for protein separation
SDS-PAGE 10% gels were prepared. The protein
solution was heat denatured at 95°C for 5 min. Approximately 300 µl
of protein solution with a commercial protein ladder [8 µl;
BenchMark™; Invitrogen, Carlsbad, CA, USA)] were subjected to
SDS-PAGE using 100 V for 30 min by the stacking gel and 130 V by
the separating gel. The proteins on the gel were transferred to a
nitrocellulose membrane for 2 h at 100 V. The membranes were
stained with Ponceau S to confirm successful transfer.
Antibodies used in PPA analysis
A total of 286 antibodies were used to assess the
protein expression involved in multiple pathways including cell
proliferation and apoptosis, cell invasion and metastasis, cell
cycle, cell metabolism, cell resistance and angiogenesis.
Phosphorylation-specific antibodies were obtained
from Cell Signaling Technology, except for p-protein kinase Cα
(Ser657) which was obtained from Upstate Biotech (Lake Placid, NY,
USA), and p-Met (Tyr1234), p-c-Jun kinase (G-7) and p-focal
adhesion kinase (Tyr397) which were obtained from Santa Cruz
Biotechnology (Santa Cruz, CA, USA). The
non-phosphorylation-specific antibodies including Stat1,
HER2/ErbB2, β-catenin, p44/42 mitogen-activated protein kinase
[MAPK; extracellular signal-regulated kinase (Erk)1/2], Akt,
Notch4, eIF4B, NF-κB p50, cAMP responsive element binding, estrogen
receptor α, Bcl-xL, RIP, aurora A/AIK, matrix metalloproteinase-9
and Snail were purchased from Cell Signaling Technology. X-linked
inhibitor of apoptosis and glutamine synthetase were obtained from
BD Biosciences (San Jose, CA, USA). Transforming growth factor
(TGF)-β was purchased from R&D Systems (Minneapolis, MN, USA).
Hsp90 was obtained from ENZO Life Sciences (Farmingdale, NY, USA).
Hypoxia-inducible factor-2α was obtained from Novus Biologicals
(Littleton, CO, USA). Cytokeratin 18 was purchased from Dako
Corporation (Carpinteria, CA, USA) and FAH from ProteinTech Group
(Chicago, IL, USA). Keratin 10 was obtained from Covance Research
Products (Berkeley, CA). G protein of vesicular stomatitis virus
was purchased from Abcam Corporation (Cambridge, MA, USA). All
other antibodies were obtained from Santa Cruz Biotechnology.
PPA analysis
The nitrocellulose membranes were placed in blocking
solution [3% bovine serum albumin (BSA)] for 1 h, and then placed
in a 20-well slot blotting manifold apparatus (Mini-PROTEAN II
Multiscreen Apparatus Ca#170-4017; Bio-Rad Laboratories, Inc.,
Hercules, CA, USA). Approximately 600 µl containing 1–2 types of
primary antibodies were added to lanes 1–19, and lane 20 was added
with protein ladders. The membranes were incubated for 12 h at
4°C.
Subsequently, the primary antibodies were retrieved
and the membranes were washed by 600 µl Tris-buffered saline (TBS)
for 3 times and 600 µl Tris-buffered saline with Tween-20 (TBST)
for 2 times. Binding was detected using horseradish
peroxidase-conjugated secondary antibodies (anti-rat/lamb/rabbit;
Bio-Rad Laboratories, Inc.) for 1 h at room temperature and washed
by TBST.
Immun-Star™ HRP peroxide buffer and the Immun-Star™
HRP luminol enhancer (Cat#94547; Bio-Rad Laboratories, Inc.) in a
1:1 volume ratio was used for enhanced chemiluminescent assay. The
luminescent images were captured using a ChemiDoc XRS system
(Bio-Rad Laboratories, Inc.) and the images were quantified and
calculated by Quantity One 4.5.0 software based on the global
median subtraction to decrease the variation between the batches of
experiments.
Finally, the antibodies were eluted from the
nitrocellulose membranes using Restore™ Western Blot stripping
buffer (Cat# 21059; Thermo Fisher Scientific, Inc., Waltham, MA,
USA). The thoroughly cleaned membranes were blocked again using 3%
BSA solution for 1 h and re-analyzed as aforementioned.
Statistical analysis
The Student's t-test and the χ2 test were
used to evaluate the relationship between the clinicopathological
factors and drug resistance of patients. A Spearman test was
performed to determine the association between the different T and
N stages, and chemotherapy resistance. The Significance Analysis of
Microarray (SAM; http://www-stat.stanford.edu/~tibs/SAM/) software was
used to screen differentially expressed proteins, and the further
clustering and discriminant analysis for proteins were performed
using k-fold cross-validation and hierachical clustering analysis
(htt://linus.nci.nih.gov/BRB-ArrayTools.html) of BRB
Array Tools v.3.3.0. SPSS 17.0 (SPSS v17.0 software; SPSS, Inc.,
Chicago, IL, USA) was used to identify the relationship between the
PPA and the clinical data. P<0.05 indicated a statistically
significant difference. The Ingenuity Pathway Analysis (IPA),
version 9.0 (Ingenuity Systems, Inc., Redwood City, CA, USA) was
used for pathway analysis.
Results
General and pathological
characteristics of subjects
The clinical data and pathological characteristics
of patients are shown in Table I.
According to the evaluation criteria of postoperative disease-free
survival, 73 patients had a disease-free interval <12 months and
were designated as the chemotherapy-resistant group; while 67
patients with a disease-free survival of >36 months, were
designated as the chemotherapy-sensitive group.
 | Table I.Clinicopathological characteristics of
140 gastric cancer cases based on chemosensitivity. |
Table I.
Clinicopathological characteristics of
140 gastric cancer cases based on chemosensitivity.
|
| Number (%) | Chemosensitive
(n=67) | Chemoresitant
(n=73) | P-value |
|---|
| Age (years) |
|
|
| 1 |
| ≤60 | 67 (47.9) | 32 (47.8) | 35(47.9) |
|
|
>60 | 73 (52.1) | 35 (52.2) | 38 (52.1) |
|
| Sex |
|
|
| 0.494 |
| Male | 117 (83.6) | 58 (86.6) | 59 (80.8) |
|
|
Female | 23 (16.4) | 9 (13.4) | 14 (19.2) |
|
| Family history of
cancer |
|
|
| 0.644 |
|
Positive | 21 (15.0) | 9 (13.4) | 12 (16.4) |
|
|
Negative | 119 (85.0) | 58 (86.6) | 61 (83.6) |
|
| Curative surgery for
gastric cancer |
|
|
| 0.085 |
| Subtotal
gastrectomy | 103 (73.6) | 54 (80.6) | 49 (67.1) |
|
| Total
gastrectomy | 37 (26.4) | 13 (19.4) | 24 (32.9) |
|
| Histological
feature |
|
|
| 0.159 |
|
Histological grade |
|
|
|
|
|
Moderate/
high | 48 (34.3) | 27 (40.3) | 21 (28.8) |
|
|
Low | 92 (65.7) | 40 (59.7) | 52 (71.2) |
|
| Vascular
invasion |
|
|
| 0.444 |
|
Positive | 103 (73.6) | 47 (70.1) | 56 (76.7) |
|
|
Negative | 37 (26.4) | 20 (29.9) | 17 (23.3) |
|
| Tumor size
(cm) |
|
|
| 0.041 |
| ≤5 | 79 (56.4) | 44 (65.7) | 35 (47.9) |
|
|
>5 | 61 (43.6) | 23 (34.3) | 38 (52.1) |
|
| Tumor location |
|
|
| 0.728 |
|
Proximal (upper panel) | 53 (37.9) | 24 (35.8) | 29 (39.7) |
|
| Distal
(lower panel) | 87 (62.1) | 43 (64.2) | 44 (60.3) |
|
| Depth of
invasiona |
|
|
| 0.525 |
| T1 | 0 (0.0) | 0 (0.0) | 0 (0.0) |
|
| T2 | 6 (4.3) | 1 (1.5) | 5 (6.8) |
|
| T3 | 13 (9.3) | 7 (10.4) | 6 (8.2) |
|
| T4 | 121 (86.4) | 59 (88.1) | 62 (84.9) |
|
| Degree of lymph
node metastasisa |
|
|
| 0 |
| N0 | 0 (0.0) | 0 (0.0) | 0 (0.0) |
|
| N1 | 33 (23.6) | 24 (35.8) | 9 (12.3) |
|
| N2 | 33 (23.6) | 19 (28.4) | 14 (19.2) |
|
| N3 | 74 (52.8) | 24 (35.8) | 50 (68.5) |
|
| Outcome |
|
|
| 0 |
| The
last follow-up |
|
|
|
|
|
Death | 71 (50.7) | 4 (6.0) | 67 (91.8) |
|
|
Survival | 69 (49.3) | 63 (94.0) | 6 (8.2) |
|
The preoperative average age was 60.5 years old, and
the global sex distribution was 5.1:1. No significant difference
was found in age, sex distribution family history of cancer, the
ratio of radical subtotal gastrectomy, histopathological grade,
vascular invasion, tumor location and depth of invasion between
chemoresistant and chemosensitive patients (p=0.726, p=0.494,
p=0.644, p=0.085, p=0.159, p=0.444, p=0.728 and p=0.525,
respectively). The tumor size of chemoresistant patients was bigger
than that of chemosensitive patients (p=0.041), and the number of
malignant nodes of chemoresistant patients was more than that of
chemosensitive patients (p<0.001). There was a significant
difference in mortality, which was 6.0% in the chemosensitive group
and 91.8% in the chemoresistant group (p<0.001).
Differentially expressed proteins in
signaling pathways between chemosensitive and chemoresistant
patients
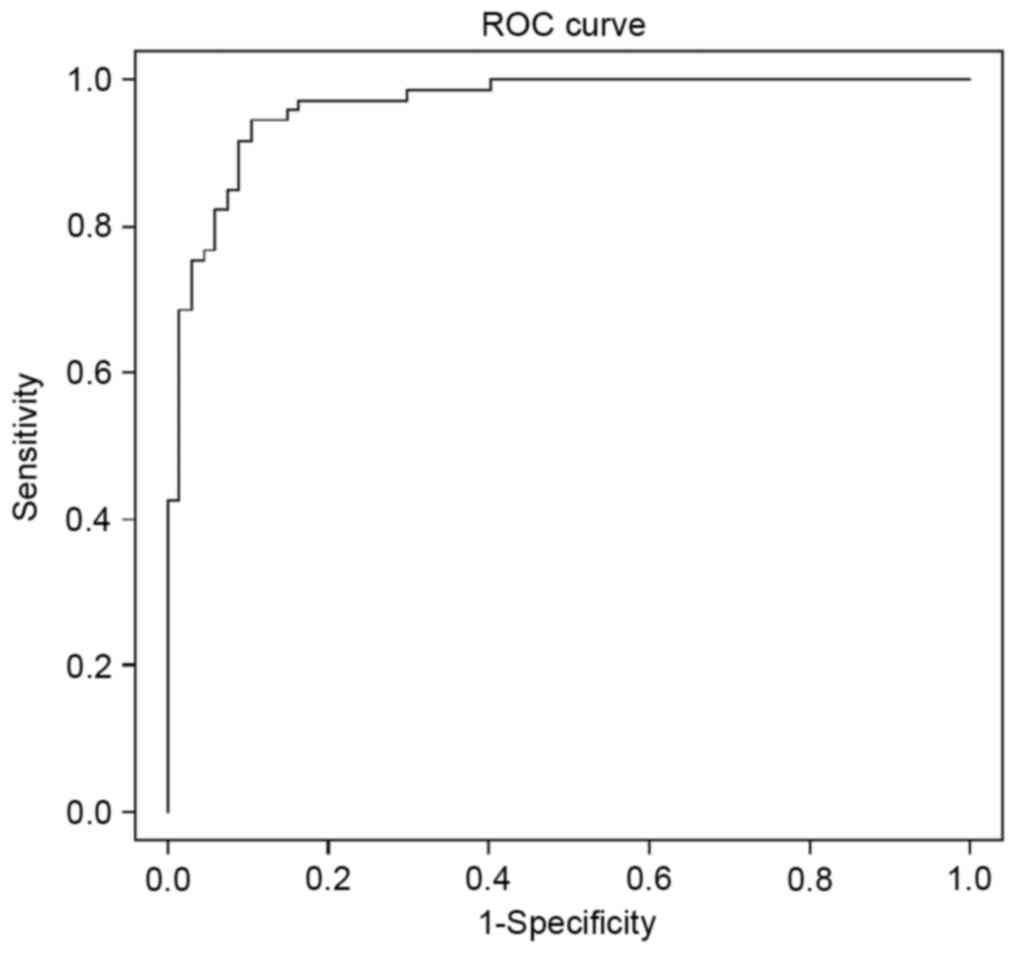
After comparing the differential expression of
proteins between 73 chemoresistant tumors and chemosensitive
tumors, total 23 differentially expressed proteins (18
overexpressed and 5 downexpressed) were identified (t-test
p<0.05; SAM q<0.05; Table
II). SVMs for protein classification revealed 18 proteins,
including PLK1, FKHR, HDAC1, calpain 2, WT1, cdk4, β3 tubulin,
HMG-1, NMT1, Bcl-xL, V-ATPase H, tsg 101, calpastatin, P-cadherin,
ADH, P-JNK, DACH1 and E-cadherin (p<0.01) yielded an accuracy of
93.6%, a sensitivity of 94.8% and a specificity of 93.0%. While 11
proteins were identified by KNN method, including PLK1, FKHR,
HDAC1, WT1, cdk4, β3 tubulin, HMG-1, ADH, P-JNK, DACH1 and
E-cadherin (p<0.01) with an accuracy of 89.3%, a sensitivity of
90.3%, and a specificity of 88.2%. The Bayesian ROC curve
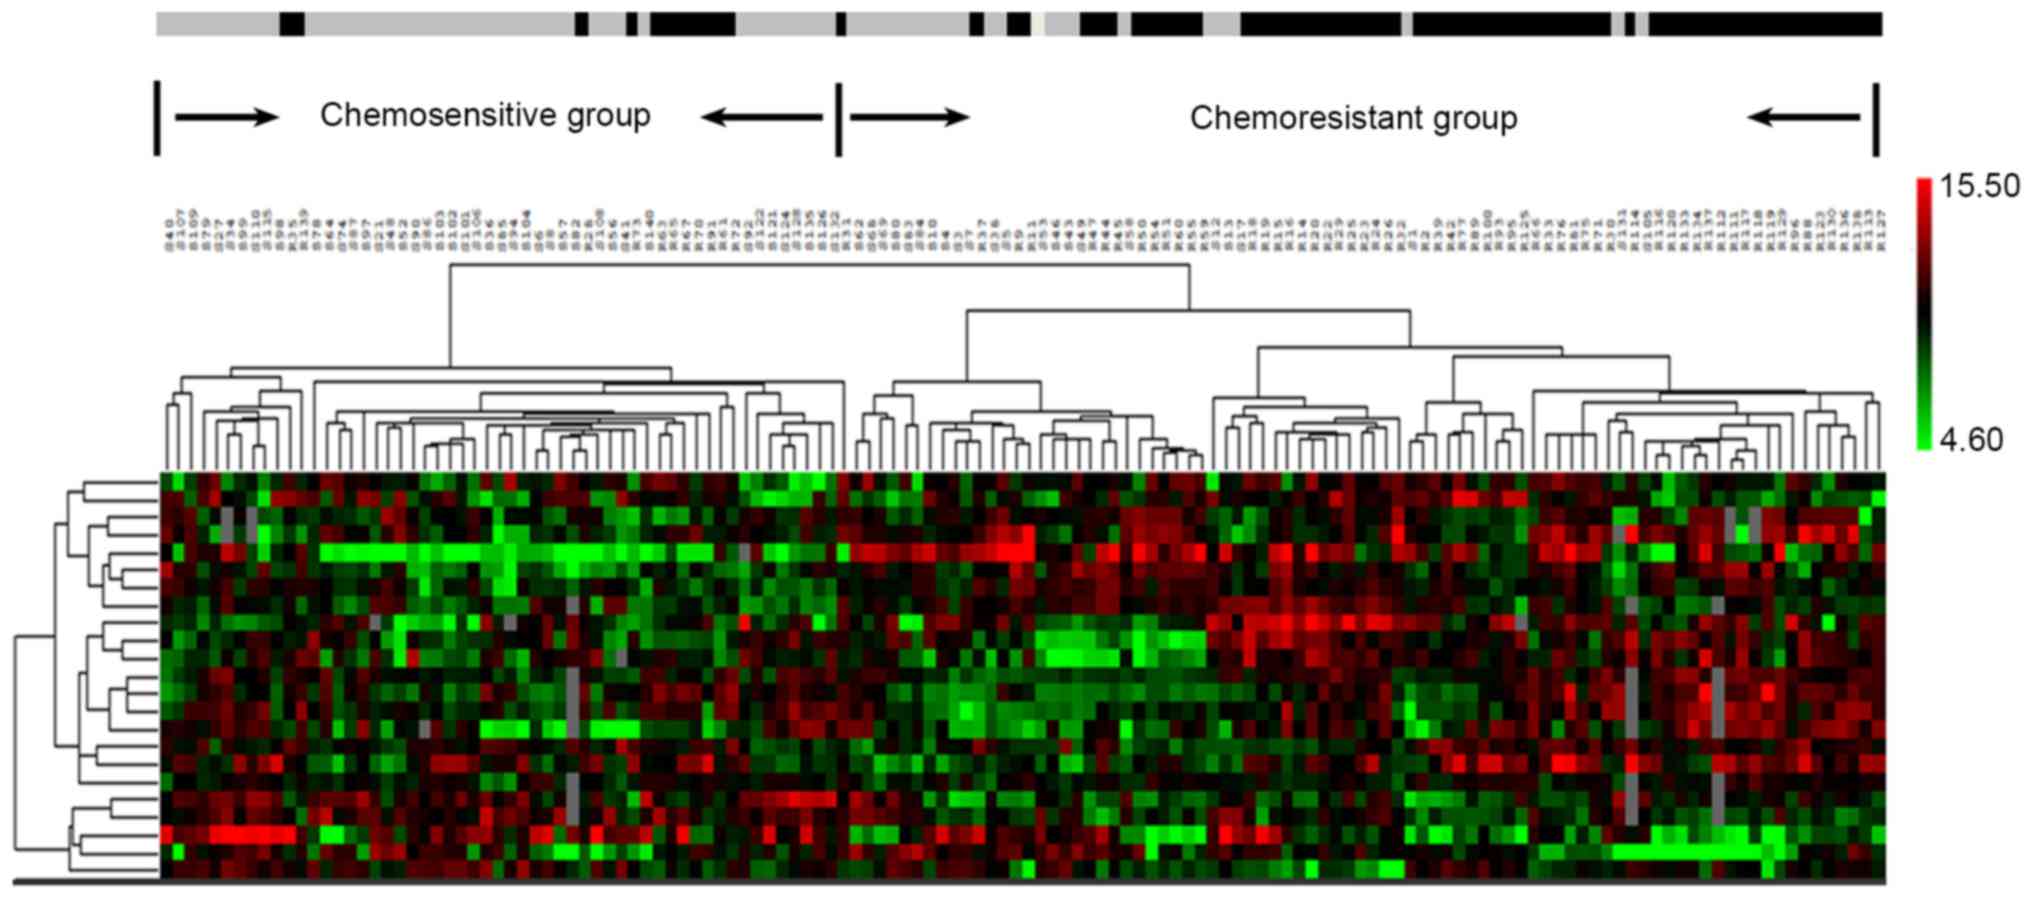
estimation revealed an area under the curve (AUC) = 96.5% (Fig. 1). The hierarchical clustering
analysis of 23 proteins performed by BRB is shown in Fig. 2.
| Table II.Differentially expressed proteins
between chemosensitive and chemoresistant gastric cancer. |
Table II.
Differentially expressed proteins
between chemosensitive and chemoresistant gastric cancer.
|
|
| Average |
|
|
|
|---|
|
|
|
|
|
|
|
|---|
| Protein | Gene ID | Chemosensitive | Chemoresistant | Fold change | P-value | q-value (%) |
|---|
| Up |
|
|
|
|
|
|
|
cdk2 | CDK2 | 12305.4 | 14555.1 | 1.18 | 0.04 | 3.8 |
|
cdk4 | CDK4 | 964.1 | 2109.4 | 2.19 | 0 | 0 |
|
WT1 | WT1 | 1749.3 | 3271.4 | 1.87 | 0 | 0 |
|
NFκBp50 | NFKB1 | 2213.3 | 2865.3 | 1.29 | 0.04 | 3.8 |
|
H-Ras | HRAS | 873.3 | 1268 | 1.45 | 0 | 1.8 |
|
Bcl-xL | BCL2L1 | 7748.7 | 10261.4 | 1.32 | 0.01 | 0 |
|
ERCC1 | ERCC1 | 4749.1 | 6226.5 | 1.31 | 0.03 | 3.8 |
|
HMG-1 | HMGB1 | 1667.7 | 3973.9 | 2.38 | 0 | 0 |
|
FKHR | FOXO1 | 5075.6 | 7949.6 | 1.57 | 0 | 0 |
|
HDAC1 | HDAC1 | 6297.3 | 8257.4 | 1.31 | 0 | 0 |
|
NMT1 | NMT1 | 8433.7 | 10922 | 1.3 | 0 | 0 |
|
PLK1 | PLK1 | 3190 | 6405.5 | 2.01 | 0 | 0 |
|
P-cadherin | CDH3 | 781.9 | 1051.3 | 1.34 | 0 | 3.8 |
|
β3 tubulin | TUBB3 | 946.9 | 1775 | 1.87 | 0 | 1.8 |
|
V-ATPase H | ATP6V1H | 2562.4 | 3252.5 | 1.27 | 0.01 | 0 |
| tsg
101 | TSG101 | 632.5 | 971.4 | 1.54 | 0 | 0 |
|
Calpastatin | BIRC3 | 764.3 | 1114.5 | 1.46 | 0 | 1.8 |
| Calpain
2 | CAPN2 | 12604.6 | 14698.4 | 1.17 | 0 | 0 |
| Down |
|
|
|
|
|
|
|
P-JNK | JNK | 2945.6 | 1247.1 | 0.42 | 0 | 0 |
|
DACH1 | DACH1 | 3070.7 | 1599.8 | 0.52 | 0 | 0 |
|
E-cadherin | CDH1 | 1448.8 | 577.3 | 0.4 | 0 | 0 |
|
Cytokeratin 18 | KRT18 | 30968.5 | 19842.4 | 0.64 | 0 | 0 |
|
ADH | ADH1 | 38848.6 | 23953.8 | 0.62 | 0 | 0 |
Logistic regression model for
chemotherapy response
Univariate logistic regression analysis revealed
that 15 proteins, including PLK1, FKHR, HDAC1, WT1, CDK4, HMG-1,
NMT1, Bcl-xL, H-Ras, ERCC1, ADH, P-JNK, DACH1, cytokeratin 18 and
E-cadherin, as well as 2 clinicopathologic factors of AJCC-N and
AJCC-TNM stages, had significant association with chemotherapy
response.
The multivariate logistic regression analysis was
used to determine the independent predictors associated with
chemotherapeutic sensitivity in human gastric cancer. The results
in Table III revealed that PLK1,
DACH1, E-cadherin, FKHR, ADH and ERCC1 could be the independent
predictors. The Cox and Snell R2 and Nagelkerke
R2 in the logistic model were 0.571 and 0.762,
respectively.
| Table III.Independent predictors of
chemoresistance based on the multivariate logistic regression
analysis. |
Table III.
Independent predictors of
chemoresistance based on the multivariate logistic regression
analysis.
|
|
|
| EXP (B) 95% CI |
|---|
|
|
|
|
|
|---|
| Variables | B | Sig. | Exp (B) | Lower | Upper |
|---|
| PLK | 1.80 | 0.00 | 6.03 | 2.79 | 13.03 |
| DACH1 | −0.48 | 0.04 | 0.62 | 0.39 | 0.98 |
| E-cadherin | −0.77 | 0.00 | 0.46 | 0.30 | 0.71 |
| FKHR | 0.94 | 0.01 | 2.57 | 1.32 | 4.99 |
| ADH | −2.05 | 0.00 | 0.13 | 0.05 | 0.36 |
| ERCC1 | 0.65 | 0.02 | 1.92 | 1.10 | 3.35 |
| Constant | 1.95 | 0.84 | 7.05 |
|
|
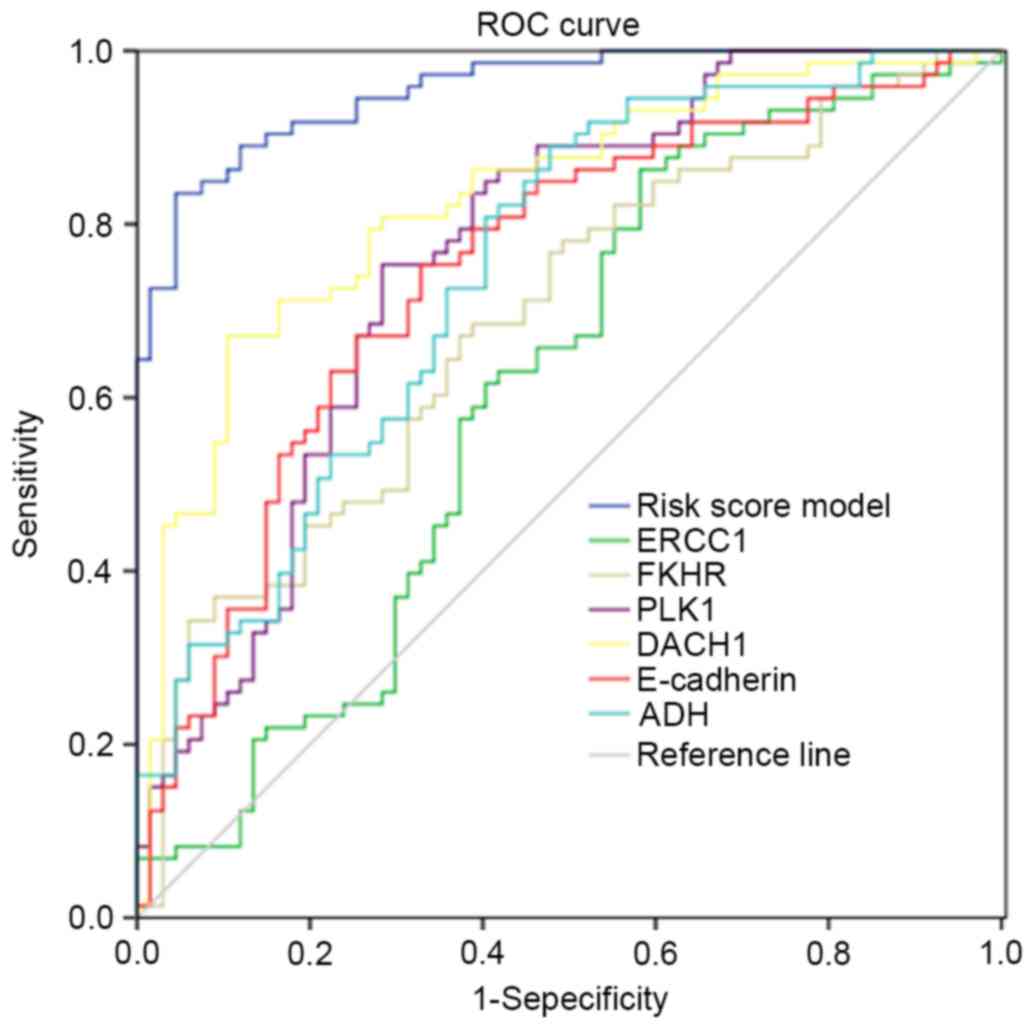
The ROC curve analysis of 6 independent factors
revealed the overall predictive value with a AUC of 96%, which was
higher than the area of a single predictor (61–83%). This indicated
the good prediction efficiency of the predictive risk score model
(Fig. 3).
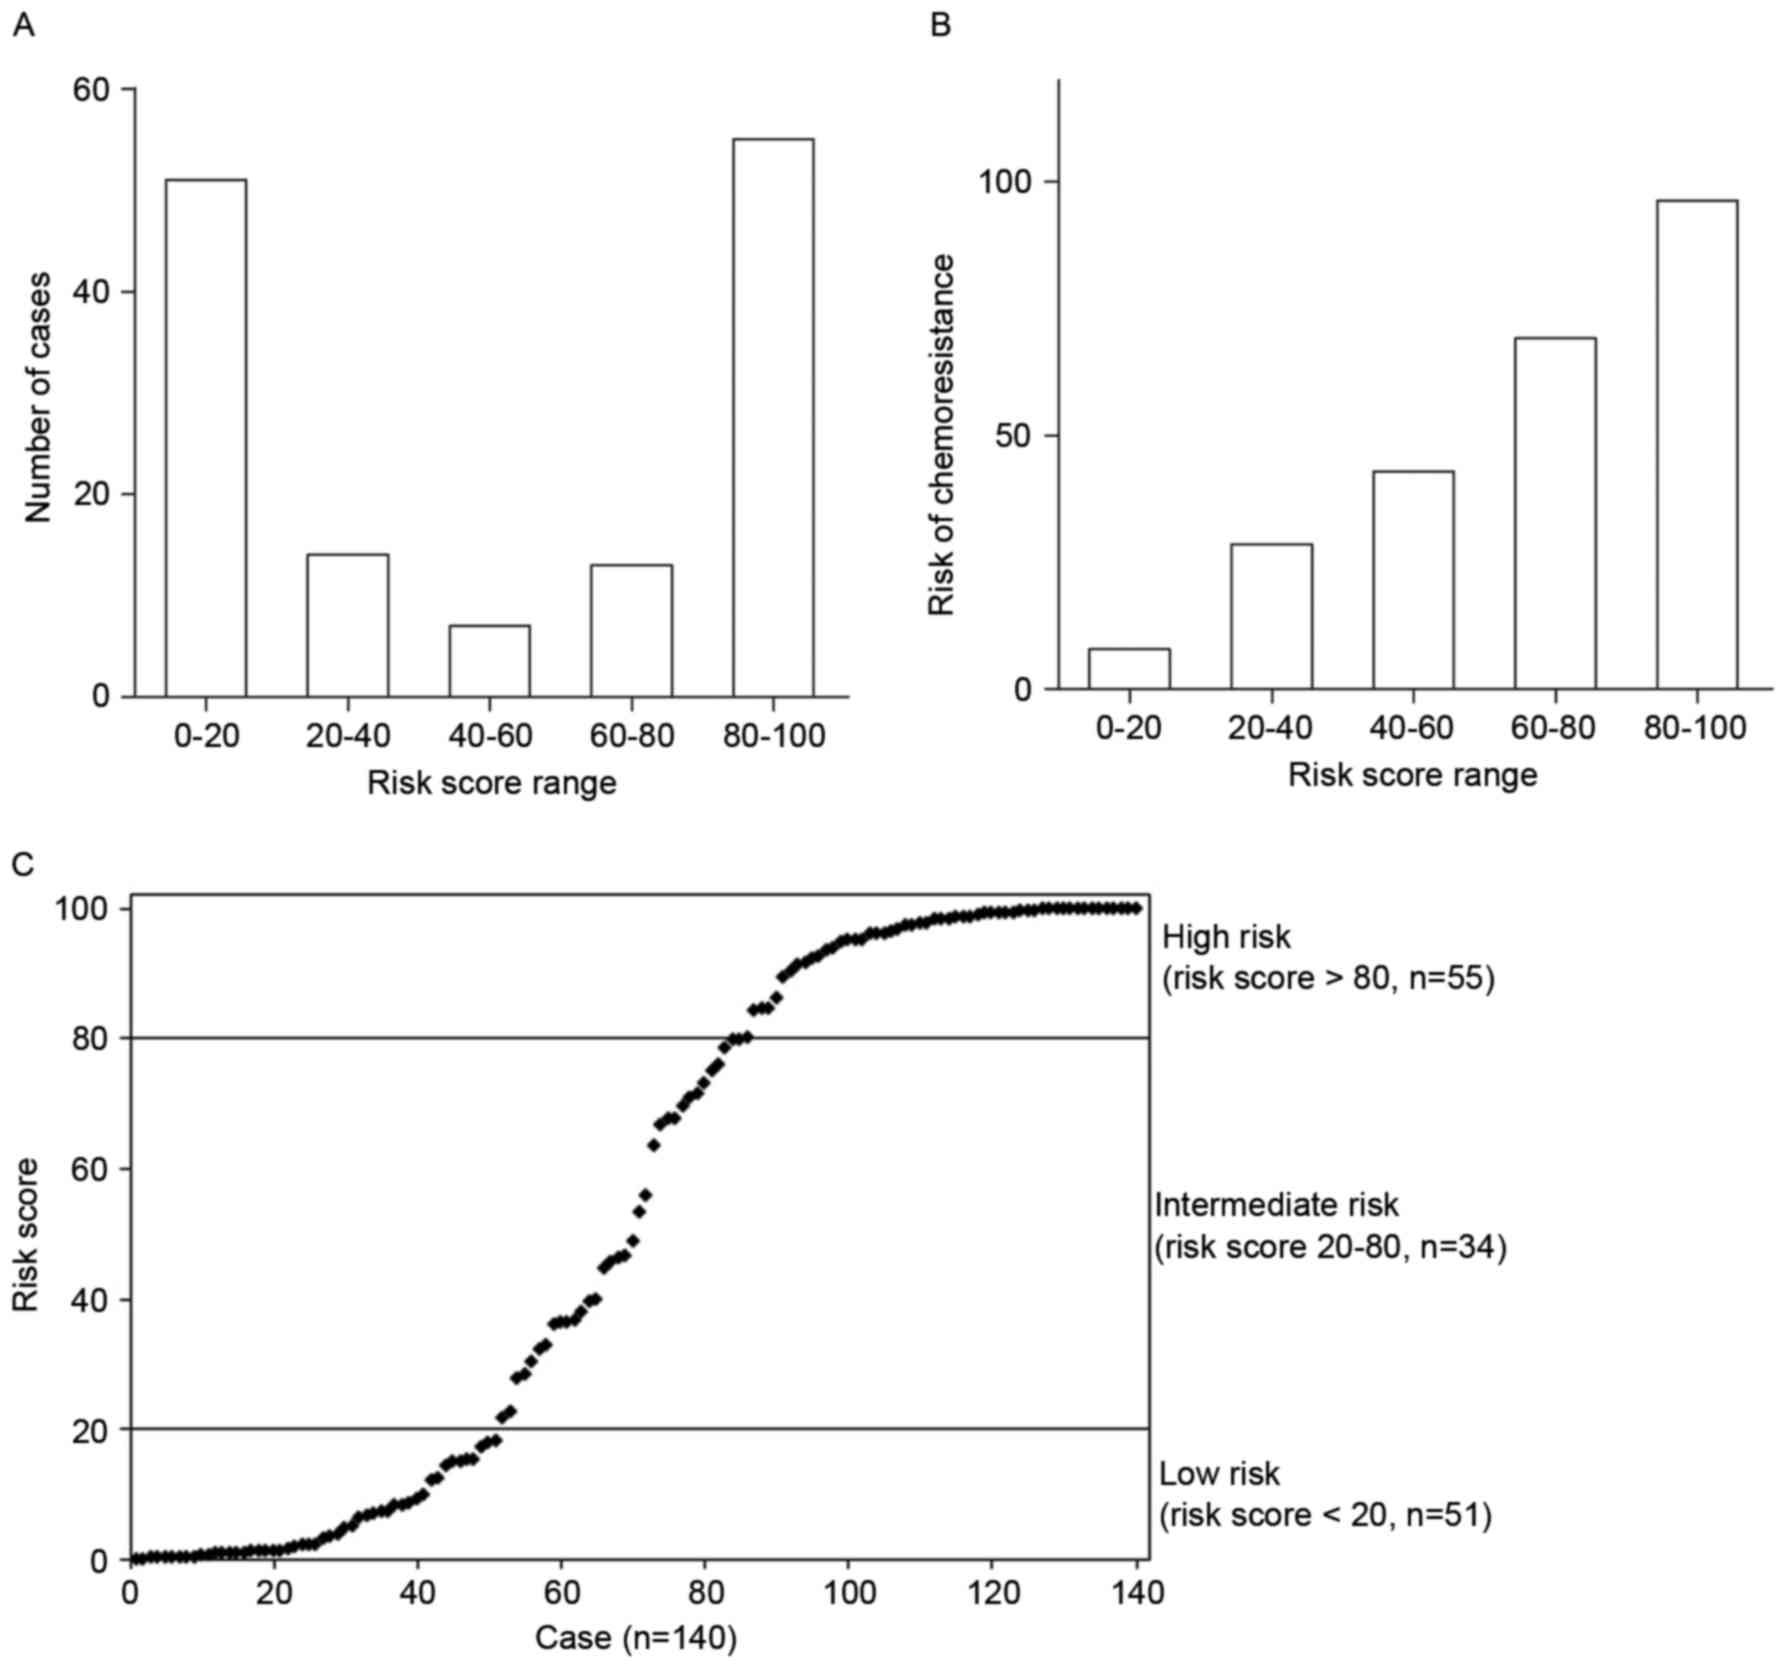
Moreover, the Risk Assessment System (RAS) of
chemotherapy resistance in gastric cancer was built: Risk score =
ez/(1+ez) × 100; Z = B0 + B1 × V1 + B2 × V2
+…….+ Bn × Vn. Where e denotes the natural logarithm; Z is the
results of logistic regression; B0 represents the logistic
regression coefficient for the constant; ‘V1…Vn’ is the independent
variable for multivariate regression; ‘B1…Bn’ is the regression
coefficient corresponding to ‘V1…Vn’. Fig. 4A revealed that most of the patients
had a risk score of 0–20 and 80–100, and the risk of chmoresistance
increased according to the increased risk score (Fig. 4B). Therefore, all of the patients
were subjected to 3 groups: the high-risk group with a risk score
of >80, and a high risk of chemotherapeutic resistance; the
medium-risk group with a risk score between 20–80, and a moderate
risk of chemotherapeutic resistance; the low-risk group with a risk
score of <20, and a low risk of chemotherapeutic resistance
(Fig. 4C).
Finally, the RAS was validated in each subject. The
results revealed that a total of 87.9% samples were correctly
predicted, among which, 89.6% were correct in the chemosensitive
group, and in the chemoresistant group, 86.3% of cases were
predicted correctly (data not shown).
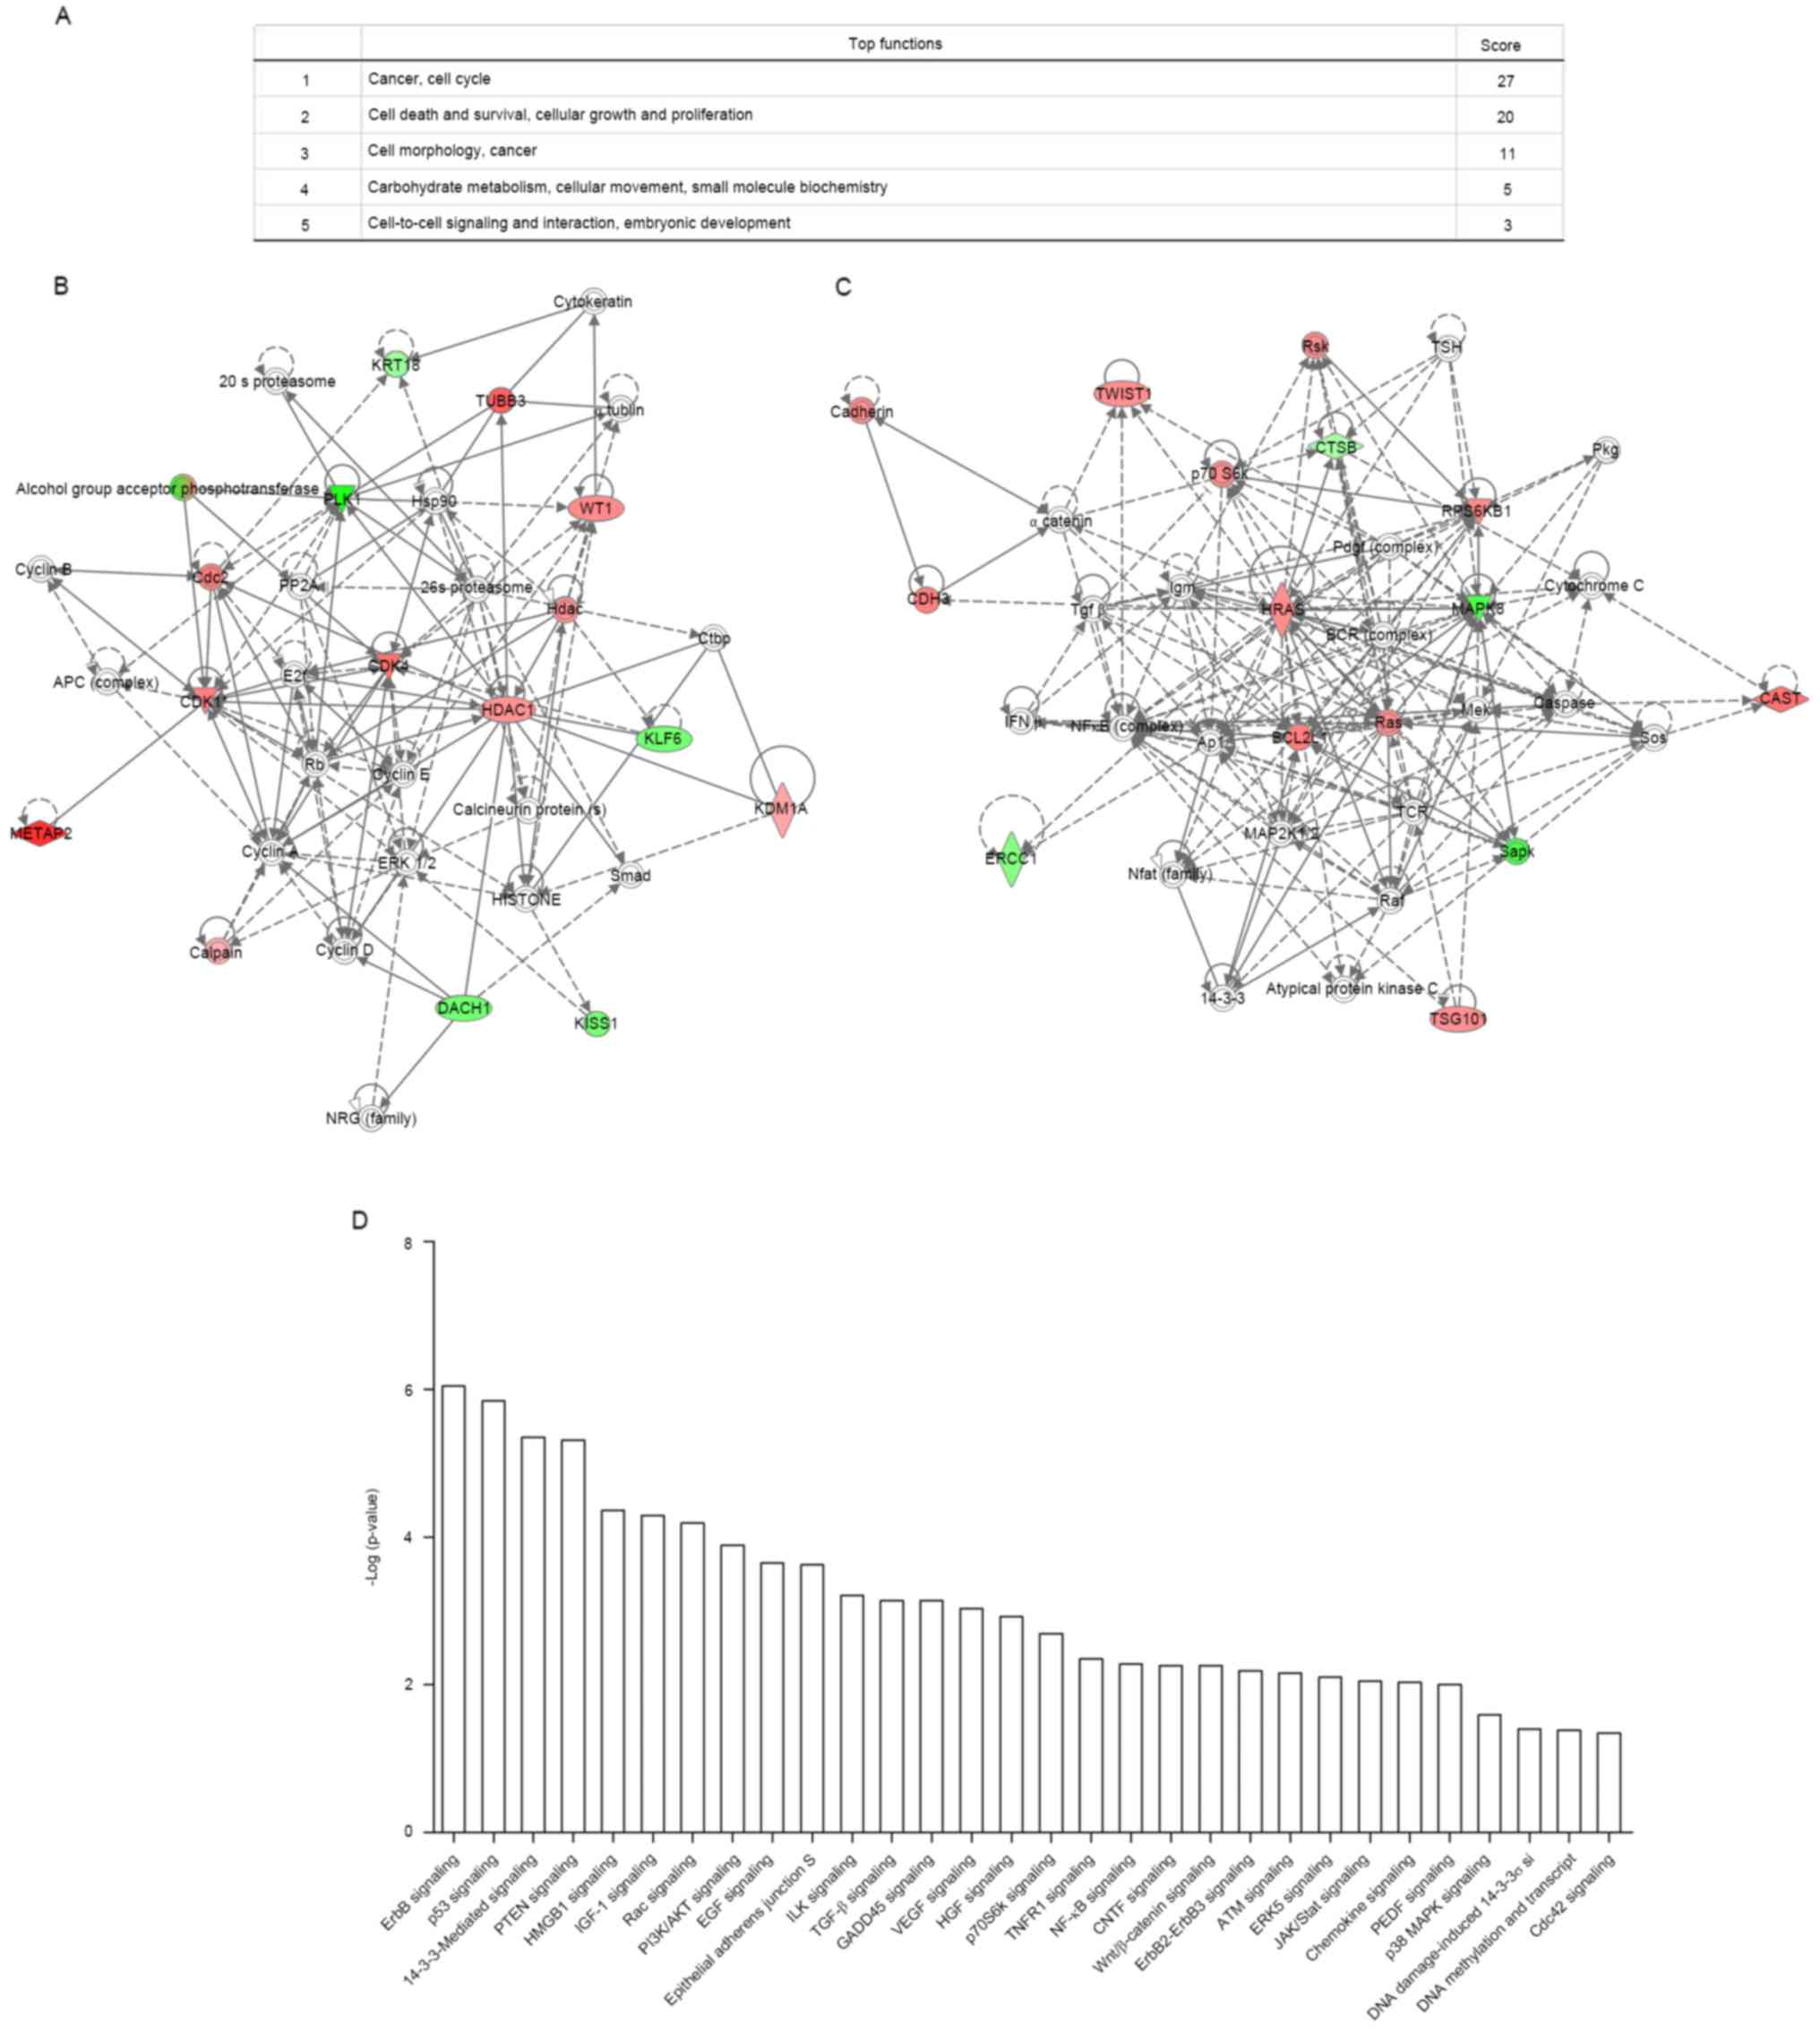
IPA system and the signaling pathways
associated with chemotherapeutic sensitivity in gastric cancer
To identify the roles of differentially expressed
proteins in the signal transduction pathway contributing to
chemotherapy resistance in gastric cancer, the IPA system (version
9.0) revealed that 23 proteins were mainly participated in 5 types
of signaling pathways (Fig. 5A),
such as cancer, cell cycle (12 proteins) and cell death and
survival, cellular growth and proliferation (10 proteins). Two
significant signaling networks with the most differentially
expressed proteins are shown in Fig. 5B
and C and each node in the network indicated a classic
signaling pathway. In addition, the top 30 signaling pathways
(p<0.01) with the highest correlation are shown in Fig. 5D, such as ErbB signaling, p53
signaling, 14-3-3-mediated signaling, and the PTEN signaling.
Discussion
More individualized treatment regimens to decrease
side-effects induced by adjuvant chemotherapy may be essential and
the molecular mechanisms underlying resistance to chemotherapeutic
drugs was widely investigated (16). In the present study, the PPA method
was used to explore the underlying mechanisms of chemoresistance in
gastric cancer. The results revealed that 23 proteins obtained
between 73 chemotherapy-resistant patients and 67
chemotherapy-sensitive patients were mainly associated with cell
adhesion, proliferation, migration, cell cycle, cell signaling and
interaction. In addition, 11 proteins distinguished 2 groups of
patients with an accuracy of 89.3%, a sensitivity of 90.3% and a
specificity of 88.2%. These results may help surgeons to classify
the gastric cancer tissues into chemotherapy sensitive and
chemotherapy resistant.
The differentially expressed proteins identified in
the present study were consistent with various studies. For
example, calpain, ERCC1 and β3 tubulin were observed to be highly
expressed in gastric cancer cells resistant to chemotherapeutic
agents (17–19), while E-cadherin and DACH1 were lowly
expressed (20,21). This may indicate the prediction
features of proteins in chemotherapy drug-resistance. Since single
predictors usually do not provide accurate predictions at the
individual-level, the multivariable risk prediction model which
included multiple predictors, facilitates clinical decision-making
(22). The similar prediction
models were built in various types of cancer, such as lung cancer
(23,24). The PPA analysis built a predictive
model for chemoresistance based on the protein expression
profiling. Moreover, the efficacy and the good prediction strength
was explained. This model may help to predict drug resistance to
chemotherapeutic agents in gastric cancer patients with high
specificity and sensitivity.
Previous studies have demonstrated the correlation
between chemotherapy resistance in gastric cancer tissues and a
large number of aberrantly expressed proteins in signal
transduction pathways, such as protein phosphorylation (25), methylation (8) and aberrant expression (9). IPA is commonly used to combine
differentially expressed genes with associated-networks, functions
and canonical pathways (26). The
results revealed that the differentially expressed proteins were
mainly associated with cell actions, cancers and cell signaling and
interaction. Moreover, the ErbB, p53 and 14-3-3-mediated signaling,
and the PTEN signaling pathway were enriched by 23 differentially
expressed proteins. This is consistent with previous studies that
revealed that chemoresistance in cancer is mediated via various
signaling pathways (27–30).
Our results revealed that multiple signaling
pathways and proteins were involved in chemotherapy and
chemotherapy resistance in gastric cancer. The phosphorylation,
methylation and aberrant expression of proteins are closely related
to the chemoresistance of gastric cancer. The predictive risk model
established by PPA technique, the model classifier and the logistic
regression for chemoresistance are feasible, and could have
important clinical implications in predicting the chemoresistance
in radically resected gastric cancer patients.
Acknowledgements
The present study was supported by the National
Natural Science Foundation of China (Program no. 81572355).
References
|
1
|
Fox JG and Wang TC: Inflammation, atrophy,
and gastric cancer. J Clin Invest. 117:60–69. 2007. View Article : Google Scholar : PubMed/NCBI
|
|
2
|
Jemal A, Bray F, Center MM, Ferlay J, Ward
E and Forman D: Global cancer statistics. CA Cancer J Clin.
61:69–90. 2011. View Article : Google Scholar : PubMed/NCBI
|
|
3
|
Nakajima T, Kinoshita T, Nashimoto A,
Sairenji M, Yamaguchi T, Sakamoto J, Fujiya T, Inada T, Sasako M
and Ohashi Y; National Surgical Adjuvant Study of Gastric Cancer
Group, : Randomized controlled trial of adjuvant uracil-tegafur
versus surgery alone for serosa-negative, locally advanced gastric
cancer. Br J Surg. 94:1468–1476. 2007. View
Article : Google Scholar : PubMed/NCBI
|
|
4
|
Sasako M, Sakuramoto S, Katai H, Kinoshita
T, Furukawa H, Yamaguchi T, Nashimoto A, Fujii M, Nakajima T and
Ohashi Y: Five-year outcomes of a randomized phase III trial
comparing adjuvant chemotherapy with S-1 versus surgery alone in
stage II or III gastric cancer. J Clin Oncol. 29:4387–4393. 2011.
View Article : Google Scholar : PubMed/NCBI
|
|
5
|
Bang YJ, Kim YW, Yang HK, Chung HC, Park
YK, Lee KH, Lee KW, Kim YH, Noh SI, Cho JY, et al CLASSIC trial
investigators, : Adjuvant capecitabine and oxaliplatin for gastric
cancer after D2 gastrectomy (CLASSIC): A phase 3 open-label,
randomised controlled trial. Lancet. 379:315–321. 2012. View Article : Google Scholar : PubMed/NCBI
|
|
6
|
Di Costanzo F, Gasperoni S, Manzione L,
Bisagni G, Labianca R, Bravi S, Cortesi E, Carlini P, Bracci R,
Tomao S, et al Italian Oncology Group for Cancer Research, :
Adjuvant chemotherapy in completely resected gastric cancer: A
randomized phase III trial conducted by GOIRC. J Natl Cancer Inst.
100:388–398. 2008. View Article : Google Scholar : PubMed/NCBI
|
|
7
|
Cunningham D, Allum WH, Stenning SP,
Thompson JN, Van de Velde CJ, Nicolson M, Scarffe JH, Lofts FJ,
Falk SJ, Iveson TJ, et al MAGIC Trial Participants, : Perioperative
chemotherapy versus surgery alone for resectable gastroesophageal
cancer. N Engl J Med. 355:11–20. 2006. View Article : Google Scholar : PubMed/NCBI
|
|
8
|
Arnold CN, Goel A and Boland CR: Role of
hMLH1 promoter hypermethylation in drug resistance to
5-fluorouracil in colorectal cancer cell lines. Int J Cancer.
106:66–73. 2003. View Article : Google Scholar : PubMed/NCBI
|
|
9
|
Violette S, Poulain L, Dussaulx E, Pepin
D, Faussat AM, Chambaz J, Lacorte JM, Staedel C and Lesuffleur T:
Resistance of colon cancer cells to long-term 5-fluorouracil
exposure is correlated to the relative level of Bcl-2 and Bcl-XL in
addition to Bax and p53 status. Int J Cancer. 98:498–504. 2002.
View Article : Google Scholar : PubMed/NCBI
|
|
10
|
Liu R, Page C, Beidler DR, Wicha MS and
Núñez G: Overexpression of Bcl-xL promotes chemotherapy resistance
of mammary tumors in a syngeneic mouse model. Am J Pathol.
155:1861–1867. 1999. View Article : Google Scholar : PubMed/NCBI
|
|
11
|
Shi X, Liu S, Kleeff J, Friess H and
Büchler MW: Acquired resistance of pancreatic cancer cells towards
5-Fluorouracil and gemcitabine is associated with altered
expression of apoptosis-regulating genes. Oncology. 62:354–362.
2002. View Article : Google Scholar : PubMed/NCBI
|
|
12
|
Viniegra J Guinea, Hernández Losa J,
Sánchez-Arévalo VJ, Cobo C Parada, Fernández, Soria VM, Ramón y
Cajal S and Sánchez-Prieto R: Modulation of PI3K/Akt pathway by E1a
mediates sensitivity to cisplatin. Oncogene. 21:7131–7136. 2002.
View Article : Google Scholar : PubMed/NCBI
|
|
13
|
Machuy N, Rajalingam K and Rudel T:
Requirement of caspase-mediated cleavage of c-Abl during
stress-induced apoptosis. Cell Death Differ. 11:290–300. 2004.
View Article : Google Scholar : PubMed/NCBI
|
|
14
|
Vekris A, Meynard D, Haaz MC, Bayssas M,
Bonnet J and Robert J: Molecular determinants of the cytotoxicity
of platinum compounds: The contribution of in silico research.
Cancer Res. 64:356–362. 2004. View Article : Google Scholar : PubMed/NCBI
|
|
15
|
Shu C, Liu Z, Cui L, Wei C, Wang S, Tang
JJ, Cui M, Lian G, Li W, Liu X, et al: Protein profiling of
preeclampsia placental tissues. PLoS One. 9:e112890. 2014.
View Article : Google Scholar : PubMed/NCBI
|
|
16
|
Wildiers H and Brain E: Different adjuvant
chemotherapy regimens in older breast cancer patients? Ann Oncol.
26:613–615. 2015. View Article : Google Scholar : PubMed/NCBI
|
|
17
|
Nabeya Y, Suzuki T, Furuya A, Koide N,
Ohkoshi M, Takiguchi M, Ochiai T, Matsubara H and Hiwasa T: Calpain
regulates thymidylate synthase-5-fluoro-dUMP complex levels
associated with response to 5-fluorouracil in gastric cancer cells.
Cancer Sci. 102:1509–1515. 2011. View Article : Google Scholar : PubMed/NCBI
|
|
18
|
Yin M, Yan J, Martinez-Balibrea E,
Graziano F, Lenz HJ, Kim HJ, Robert J, Im SA, Wang WS,
Etienne-Grimaldi MC, et al: ERCC1 and ERCC2 polymorphisms predict
clinical outcomes of oxaliplatin-based chemotherapies in gastric
and colorectal cancer: A systemic review and meta-analysis. Clin
Cancer Res. 17:1632–1640. 2011. View Article : Google Scholar : PubMed/NCBI
|
|
19
|
Sève P and Dumontet C: Is class III
beta-tubulin a predictive factor in patients receiving
tubulin-binding agents? Lancet Oncol. 9:168–175. 2008. View Article : Google Scholar : PubMed/NCBI
|
|
20
|
Carneiro P, Figueiredo J, Bordeira-Carriço
R, Fernandes MS, Carvalho J, Oliveira C and Seruca R: Therapeutic
targets associated to E-cadherin dysfunction in gastric cancer.
Expert Opin Ther Targets. 17:1187–1201. 2013. View Article : Google Scholar : PubMed/NCBI
|
|
21
|
Yamada Y, Arao T, Gotoda T, Taniguchi H,
Oda I, Shirao K, Shimada Y, Hamaguchi T, Kato K, Hamano T, et al:
Identification of prognostic biomarkers in gastric cancer using
endoscopic biopsy samples. Cancer Sci. 99:2193–2199. 2008.
View Article : Google Scholar : PubMed/NCBI
|
|
22
|
Ahmed I, Debray TP, Moons KG and Riley RD:
Developing and validating risk prediction models in an individual
participant data meta-analysis. BMC Med Res Methodol. 14:32014.
View Article : Google Scholar : PubMed/NCBI
|
|
23
|
Spitz MR, Hong WK, Amos CI, Wu X, Schabath
MB, Dong Q, Shete S and Etzel CJ: A risk model for prediction of
lung cancer. J Natl Cancer Inst. 99:715–726. 2007. View Article : Google Scholar : PubMed/NCBI
|
|
24
|
Marcus MW, Raji OY, Duffy SW, Young RP,
Hopkins RJ and Field JK: Incorporating epistasis interaction of
genetic susceptibility single nucleotide polymorphisms in a lung
cancer risk prediction model. Int J Oncol. 49:361–370. 2016.
View Article : Google Scholar : PubMed/NCBI
|
|
25
|
Oki E, Baba H, Tokunaga E, Nakamura T,
Ueda N, Futatsugi M, Mashino K, Yamamoto M, Ikebe M, Kakeji Y, et
al: Akt phosphorylation associates with LOH of PTEN and leads to
chemoresistance for gastric cancer. Int J Cancer. 117:376–380.
2005. View Article : Google Scholar : PubMed/NCBI
|
|
26
|
Krämer A, Green J, Pollard J Jr and
Tugendreich S: Causal analysis approaches in Ingenuity Pathway
Analysis. Bioinformatics. 30:523–530. 2014. View Article : Google Scholar : PubMed/NCBI
|
|
27
|
Tan M and Yu D: Molecular mechanisms of
erbB2-mediated breast cancer chemoresistance. Adv Exp Med Biol.
608:119–129. 2007. View Article : Google Scholar : PubMed/NCBI
|
|
28
|
Rohwer N, Dame C, Haugstetter A,
Wiedenmann B, Detjen K, Schmitt CA and Cramer T: Hypoxia-inducible
factor 1α determines gastric cancer chemosensitivity via modulation
of p53 and NF-kappaB. PLoS One. 5:e12038. 2010. View Article : Google Scholar : PubMed/NCBI
|
|
29
|
Zhao J, Meyerkord CL, Du Y, Khuri FR and
Fu H: 14-3-3 proteins as potential therapeutic targets. Semin Cell
Dev Biol. 22:705–712. 2011. View Article : Google Scholar : PubMed/NCBI
|
|
30
|
Li J, Zhang Y, Zhao J, Kong F and Chen Y:
Overexpression of miR-22 reverses paclitaxel-induced
chemoresistance through activation of PTEN signaling in p53-mutated
colon cancer cells. Mol Cell Biochem. 357:31–38. 2011. View Article : Google Scholar : PubMed/NCBI
|