Introduction
Gastric cancer is the fourth most common cancer and
the second leading cause of cancer-related deaths in the world
(1). More than 980,000 new gastric
cancer cases are diagnosed annually, and the disease causes
approximately 730,000 deaths per year, with the highest incidence
rates in Eastern Asia (1).
Scirrhous cancer, which accounts for approximately 10% of all
gastric cancers, is characterized by diffuse infiltration of poorly
differentiated adenocarcinoma cells with extensive stromal
fibrosis, leading to frequent peritoneal dissemination and
extremely poor prognosis (2,3).
Molecular analyses have revealed that reduction in the expression
of the cell-cell adhesion molecule, E-cadherin, was involved in the
development and infiltrative growth of scirrhous type gastric
carcinomas (4,5). Reduction in E-cadherin expression
observed in poorly differentiated carcinomas of the lungs and
endometrium (6,7), promotes detachment of cells from each
other and increases cell motility; thus, leading to
epithelial-mesenchymal transition (EMT) (8).
On the other hand, epigenetic regulation including
the role of microRNAs (miRNAs, miRs) in carcinogenesis has recently
been intensively studied. miRNAs are endogenous 18–24-nucleotide
(nt) single-stranded RNA molecules that act as post-transcriptional
regulators of gene expression (9).
They stabilize target mRNA transcripts through post-transcriptional
gene silencing via either inhibition of the translation process or
cleavage of target mRNAs (10,11).
miRNAs sharing the same seed sequence are grouped into families and
are theorized to target overlapping sets of genes (12). miRNAs play diverse roles in numerous
cellular processes; in particular, their expression is altered
during tumorigenesis, and they can act as oncogenes or tumor
suppressors (13).
Recent studies have shown the importance of certain
miRNAs in modulating EMT, and the miR-200 family has been described
to be a key regulator of this process (7,8,14). The
miR-200 family consists of 5 members: miR-200a, miR-200b and
miR-429 which are located on chromosome 1p36 while miR-200c and
miR-429 are located on chromosome 12p13 (14). The miR-200 family suppresses
zinc-finger E-box binding homeobox (ZEB) 1 and ZEB2, which in turn
inhibit the expression of E-cadherin; thus, the miR-200 family
maintains the epithelial phenotype through upregulation of
E-cadherin (7,8,14).
Among the miR-200 family, loss of miR-200c has been reported to be
pivotal to inducing aggressive, invasive and chemoresistant
phenotypes in several cancers (15–17).
Although downregulation of miR-200a and miR-200b have been reported
to be associated with poor prognosis or EBV-association in gastric
cancers (18,19), little is known about miR-200c in
this context. Recent reports demonstrated that miR-200c may affect
E-cadherin expression through regulation of ZEB1/2 expression
(20,21); however, the influences of miR-200c
on cell morphology and its association with histological type have
so far not been reported.
In the present study, we investigated the expression
of miR-200c, as well as corresponding targets at both the mRNA and
protein levels, in several gastric carcinoma cell lines. In
addition, we examined the expression level of miR-200c and
respective target proteins in gastric carcinoma tissues and
adjacent non-tumor tissues. Our results revealed that the
expression level of miR-200c was associated with the morphology of
gastric carcinoma cell lines, as well as histological
differentiation in cancer tissues, along with the upregulation or
downregulation of ZEB 1/2 and E-cadherin.
Materials and methods
Cell culture and RNA preparation
Six human gastric carcinoma cell lines, H-111-TC,
HGC-27, Kato-III, MKN-1, MKN-45 and NU-GC-4 were purchased from
Riken Cell Bank (Tsukuba, Japan) and used in the present study.
According to the description by the Riken Cell Bank and literature
(22–27), these cell lines originated from 1
unknown origin (H-111-TC) and 5 metastatic carcinoma, as well as 2
tubular (well differentiated or adenosquamous) carcinoma (H-111-TC
and MKN-1) and 4 poorly differentiated carcinoma including signet
ring cell type. HGC-27 and MKN-1 cell lines were maintained in
Dulbeccos modified Eagles medium (DMEM; Gibco-BRL, Rockville, MD,
USA), whereas NU-GC-4, Kato-III, MKN-45 and H-111-TC cell lines
were maintained in RPMI-1640 (Gibco-BRL), supplemented with 10%
fetal calf serum (FCS), penicillin, and streptomycin, at 37°C in a
humidified atmosphere of 5% CO2. When they reached
80–90% confluence, the cells were washed with phosphate-buffered
saline (PBS) and homogenized immediately in Isogen reagent (Nippon
Gene, Osaka, Japan). Total RNA was extracted according to the
manufacturers instructions.
Quantitative real-time reverse
transcription polymerase chain reaction (qRT-PCR) analysis
The RNA samples were suspended in 20 µl of
nuclease-free water, and miRNA-200c levels were quantified using
TaqMan MicroRNA Assay technology (Applied Biosystems; Life
Technologies, Carlsbad, CA, USA), as previously described (28). miRNA-200c levels were normalized
against levels of RNU6B. The hsa-miR-200c oligonucleotide was a
synthetic double-stranded 23-nt RNA, 5-UAAUACUGCCGGGUAAUGAUGGA-3
and 5-CGUCU UACCCAGCAGUGUUUGG-3 purchased from BONAC Corp.
(Fukuoka, Japan). To assess the mRNA levels of ZEB1, ZEB2 and
E-cadherin, reverse-transcription reactions were performed using
M-MLV reverse transcriptase (Invitrogen, Carlsbad, CA, USA).
Quantitative PCR (FastStart Universal SYBR-Green Master; Roche,
Basel, Switzerland) reactions were run on an Mx3005P thermocycler
(Stratagene, La Jolla, CA, USA) and analyzed using MxPro QPCR
software, version 4.01 (Stratagene, Agilent Technologies, Santa
Clara, CA, USA). The level of gene expression relative to
glyceraldehyde 3-phosphate dehydrogenase (GAPDH) was determined.
The primer sequences were as follows: ZEB1 forward, 5-TGTCA
CCATGAAACCATTGC-3 and reverse, 5-AGGTAAAGTG CGCTTCCTCA-3; ZEB2
forward, 5-GGGCATTCAGTGA CCTGACA-3 and reverse,
5-GCATTGTTCCCATAGAGT TC-3; E-cadherin forward, 5-TCCTCGGATTCTCTGCT
CTC-3 and reverse, 5-CTCTGACCTTTTGCCAGGAG-3; GAPDH forward,
5-ATGGGGAAGGTGAAGGTCG-3 and reverse, 5-GGGTCATTGATGGCAACAATATC-3.
The experiments were performed 3 times, with the average levels and
standard deviations from the mean being obtained. Correlations
between average levels of miR-200c, ZEB1, ZEB2 and E-cadherin in
all cell lines were estimated by Spearmans rank correlation using
the SPSS software package (ver17.0; SPSS Japan Inc., Tokyo, Japan).
The results were considered significant if the P<0.05.
Western blot analysis
Cell lines were lysed in RIPA buffer. After boiling
with sodium dodecyl sulfate loading buffer, equal amounts (10 µg)
of the proteins were electrophoresed on 10% sodium dodecyl
sulfate-polyacrylamide gels (SDS-PAGE) and transferred to Immobilon
membranes (Millipore Inc., Bedford, MA, USA) by semidry blotting.
Five percent milk powder dissolved in PBS buffer containing 0.1%
Tween-20 was used to block non-specific binding. Then, using
standard techniques, the membranes were probed with the following
antibodies: anti-E-cadherin antibody (mouse monoclonal antibody to
human E-cadherin; clone: HECD-1; dilution: 1:200; Takara, Tokyo,
Japan), anti-ZEB1 antibody (rabbit monoclonal antibody to ZEB1;
clone: D80D3; dilution: 1:100; Cell Signaling Technology, Danvers,
MA, USA), and anti-β-actin antibody (mouse monoclonal antibody to
β-actin; clone: C4; dilution: 1:1,000; Santa Cruz Biotechnology,
Dallas, TX, USA). Antibody-antigen complexes were detected using
Immobilon Western chemiluminescent horseradish peroxidase substrate
(Millipore), and signals were recorded on a LAS-3000 mini system
(Fujifilm, Tokyo, Japan).
Human tissue specimens and tissue
microarrays
Human tissue specimens were obtained from 97
patients who underwent gastric cancer surgery at Tokyo Medical
University Hospital between 2003 and 2010. The Tokyo Medical
University institutional review board approved the present study,
and all patients provided written informed consent. The patient
cohort included 74 males and 23 females, ranging in age from 40 to
92 years (average 66.3 years). Other clinicopathological
characteristics are listed in Table
I. The tumors were cut into ~5-mm sections after fixation in
10% formalin and embedded in paraffin. From these paraffin blocks,
tissue microarrays (TMAs) were constructed, each consisting of 12
specimens of 6-mm diameter on one slide. As previously described
(29), TMAs allow the relocation of
multiple tissue samples from conventional histologic paraffin
blocks so that tissues from multiple patients can be analyzed on
the same slide.
 | Table I.Clinical and histopathological
features of 97 patients. |
Table I.
Clinical and histopathological
features of 97 patients.
|
Characteristics | Data |
|---|
| Mean age
(years) | 66.3±11.9 |
| Sex
(male/female) | 74/23 |
| Lymph nodes
metastasis (+/-) | 33/64 |
| Tumor diameter
(mm) | 47.8±28.2 |
| Depth
(M/SM/MP/SS/SE/SI) | 25/26/8/25/9/4 |
| Vessel infiltration
(+/-) | 50/47 |
| Histology of
tubular formation (+/-) | 67/30 |
In situ hybridization
In situ hybridization (ISH) was performed on
TMAs containing 3-µm consecutive sections of formalin-fixed,
paraffin-embedded (FFPE) samples. Probes utilized were based on 5
digoxigenin (DIG)-labeled ISH locked nucleic acid (LNA) technology
(miRCURY-LNA detection probe; Exiqon A/S, Vedbaek, Denmark). Slides
were prepared using the Ventana HX System BenchMark (Ventana
Medical Systems, Inc., Tucson, AZ, USA). We used the following 5
DIG-labeled LNA probes for ISH: hsa-miR-200c,
5-TCCATCATTACCCGGCAGTATTA-3; and non-target negative control
sequence, 5-GTGTAACA CGTCTATACGCCCA-3.
Immunohistochemistry
Immunohistochemistry (IHC) was performed on TMAs
containing 4-µm consecutive sections of FFPE gastric tissue
samples. After deparaffinization and rehydration, endogenous
peroxidases were blocked by incubation in 0.3% hydrogen peroxide
solution for 20 min. To expose antigens, the sections were
autoclaved in EDTA buffer (pH 9.0) for 10 min and cooled for 30
min. After rinsing in 0.05 M Tris-buffered saline containing 0.1%
Tween-20 (pH 7.6), the sections were incubated with an
affinity-purified anti-ZEB1 antibody (clone: D80D3; dilution:
1:200; Cell Signaling Technology) and anti-E-cadherin antibody
(clone: HECD-1; dilution: 1:1,000; Takara) for 3 h at RT. Samples
were then washed three times in PBS and incubated with Dako
secondary antibody for 15 min at RT. Horseradish peroxidase-labeled
polymer conjugated to a mixture of goat anti-mouse and anti-rabbit
immunoglobulin antibodies (Code: K5007; prediluted; Dako, Glostrup,
Denmark) was used as the secondary antibody. 3,3-Diaminobenzidine
tetrachloride (DAB) was used for color development and sections
were counterstained with hematoxylin.
Evaluation of tissue images
ISH- or IHC-stained slides were examined by light
microscopy using an Olympus BX50 microscope. Three different fields
(×200) in each tissue were randomly selected. Digital images of ISH
and IHC were captured by the NY-D5000 super system (Microscope
Network; Nikon, Tokyo, Japan) and were printed by a true-color
printer (IPSiO SP C420; Ricoh, Tokyo, Japan). Positive ISH results
caused the cytoplasm to appear blue, whereas positive IHC results
appeared brown. Nuclear immunostaining was assessed for ZEB1, while
cytomembranous immunostaining was assessed for E-cadherin. Images
were interpreted semi-quantitatively by assessing the extent and
intensity of staining on the entirety of each tissue section
present on the slides, as previously described (30). Briefly, the total percentage of
positively-stained tumor cells was first determined. Then, the
percentage of weakly-, moderately- and strongly-stained cells was
determined, so that the sum of these categories equated with the
overall percentage of positivity. A final staining score was then
calculated as the sum of 1 × percentage of weak, 2 × percentage of
moderate, and 3 × percentage of strong staining (maximum
score=300).
Statistical analyses of data from
human tissue studies
Prior to statistical analyses, clinicopathlogical
data as well as tissue image results were dichotomized into two
groups of ‘high’ and ‘low’ levels, according to the median values.
Thus, the final score for staining of miR-200c was used to define
high-level expression (final score ≥201) and low-level expression
(final score <201). Likewise, the final score for staining of
ZEB1 was used to define high-level expression (final score ≥1) and
low-level expression (final score <1), as well as that of
E-cadherin used to define high-level expression (final score ≥111)
and low-level expression (final score <111). Tumor diameter was
dichotomized as either high-level (diameter ≥40 mm) or low-level
(diameter <40 mm). High-age (≥65 years old) and low-age (<65
years old) groups were established according to convention, as were
advanced (depth ≥mp) and early (depth <mp) cancer groups.
Histologically, both a well/moderately differentiated tubular
adenocarcinoma group and a poorly differentiated adenocarcinoma
group were established. Then, statistical analyses including
Chi-square test and multivariate analysis using logistic regression
models were performed using the SPSS software package (ver17.0;
SPSS). Results were considered significant if the P<0.05.
Results
Quantitative analysis of miR-200c and
target mRNA expression in gastric carcinoma cell lines
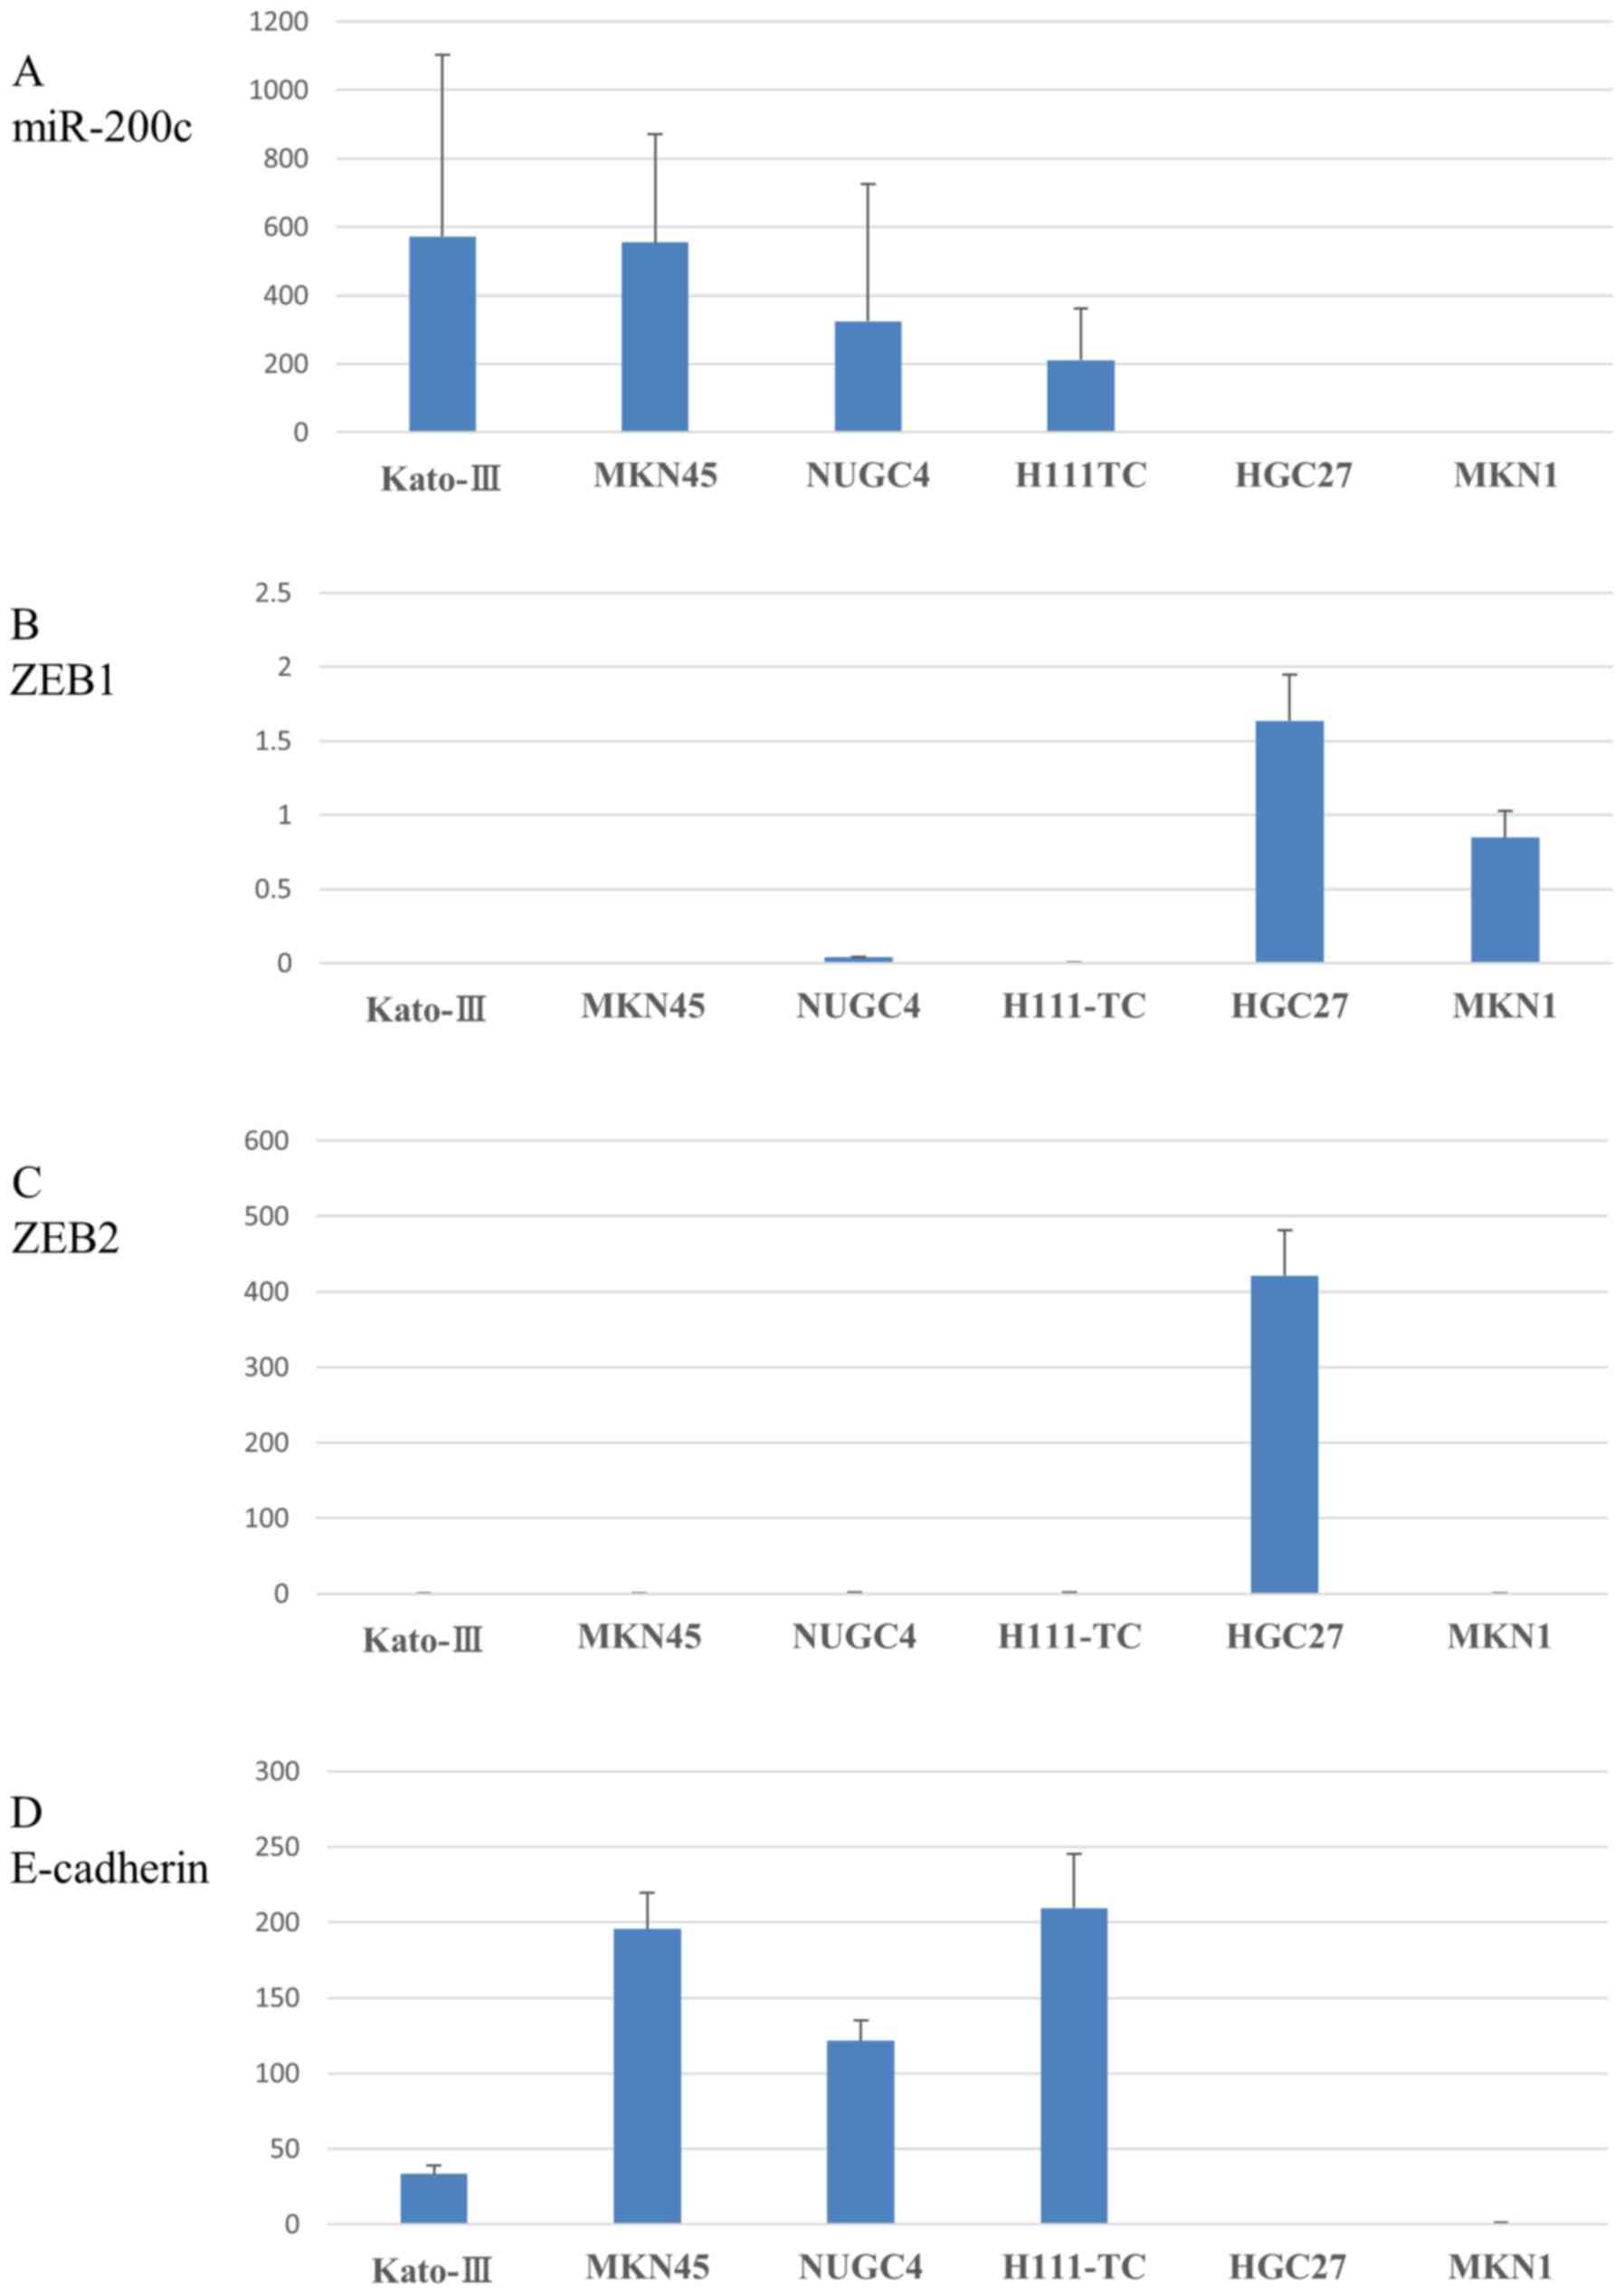
We investigated miR-200c expression in 6 gastric
carcinoma cell lines by qRT-PCR analysis. As shown in Fig. 1A, the expression level of miR-200c
descended in the following order (from high to low): Kato-III >
MKN-45 > NU-GC-4 > H-111-TC > HGC-27 > MKN-1. Of note,
the latter 2 cell lines HGC-27 and MKN-1 expressed very low levels
of miR-200c. We also investigated the expression of particular
target mRNAs, namely ZEB1 and ZEB2, along with E-cadherin, in the
same cell lines. The expression level of ZEB1 descended in the
following order (from high to low): HGC-27 > MKN-1 > NU-GC-4
> H-111-TC > MKN-45 > Kato-III (Fig. 1B). Of note, the 2 cell lines in
which miR-200c expression level was very low exhibited the greatest
expression level of ZEB1. Similarly, the expression level of ZEB2
descended in the following order (from high to low): HGC-27 >
H-111-TC > NU-GC-4 > MKN-45 > MKN-1 > Kato-III
(Fig. 1C). Here, one of the 2 cell
lines in which miR-200c expression level was very low exhibited the
greatest expression level of ZEB2. On the other hand, the
expression level of E-cadherin descended in the following order
(from high to low): H-111-TC > MKN-45 > NU-GC-4 > Kato-III
> MKN-1 > HGC-27 (Fig. 1D).
Of note, the 2 cell lines in which the expression level of miR-200c
was very low exhibited the lowest expression level of E-cadherin.
As shown in Table II, an inverse
correlation was observed between miR-200c and ZEB1 (P<0.05; by
Spearmans rank correlation).
| Table II.Correlations between the average
expression levels of miR-200c, ZEB1, ZEB2 and E-cadherin in all
cell lines estimated by Spearmans rank correlation. |
Table II.
Correlations between the average
expression levels of miR-200c, ZEB1, ZEB2 and E-cadherin in all
cell lines estimated by Spearmans rank correlation.
|
| ZEB1 | ZEB2 | E-cadherin |
|---|
|
|
|
|
|
|---|
|
| Correlation
coefficient | P-value | Correlation
coefficient | P-value | Correlation
coefficient | P-value |
|---|
| miR-200c | −0.886 | 0.019 | −0.429 | 0.397 | 0.429 | 0.397 |
| ZEB1 |
|
| 0.600 | 0.208 | −0.600 | 0.208 |
| ZEB2 |
|
|
|
| 0.029 | 0.957 |
ZEB1 and E-cadherin protein expression
in gastric carcinoma cell lines
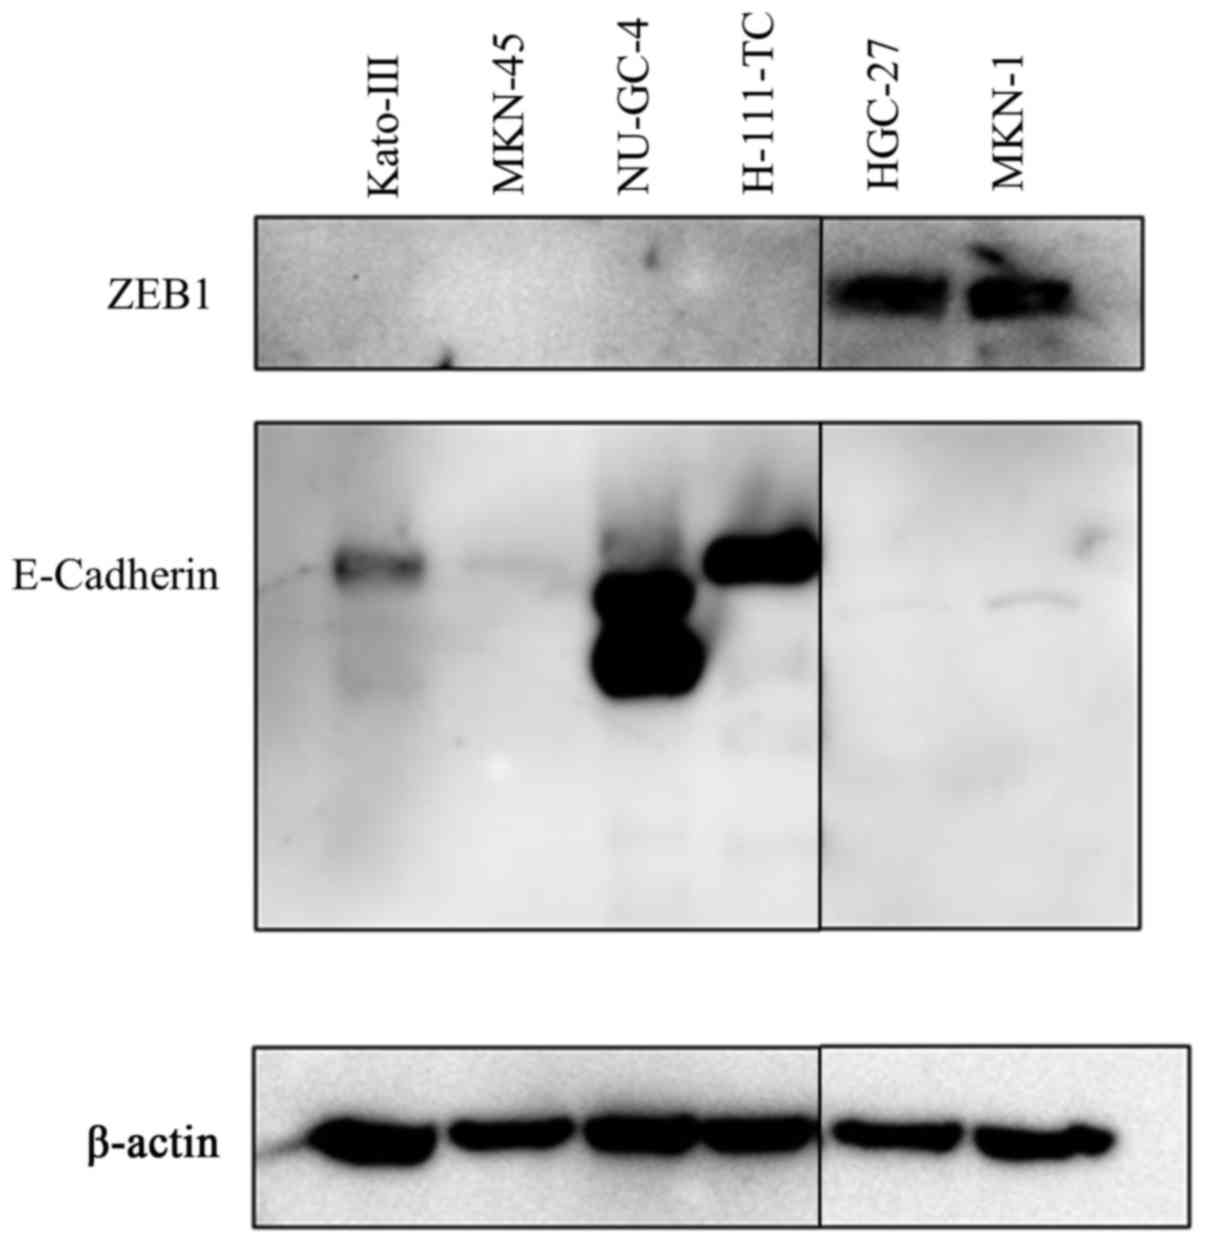
The expression of ZEB1 and E-cadherin proteins was
examined in the 6 human gastric carcinoma cell lines mentioned thus
far by western blot analysis. As shown in Fig. 2, expression of ZEB1 was only
detected in HGC-27 and MKN-1 cells, which exhibited the lowest
expression level of miR-200c determined by qRT-PCR analysis.
Conversely, the expression of E-cadherin was not detected in these
2 cell lines; instead, E-cadherin expression was detected in
NU-GC-4 and H-111-TC cell lines, although very weak expression was
also detected in Kato-III cells.
Interpretation of divergent expression
levels of miR-200c, ZEB1/2, and E-cadherin in different gastric
carcinoma cell lines
The results of qRT-PCR analyses and western blot
analysis were in agreement. Cell lines with a high expression level
of miR-200c exhibited low ZEB1/2 and high E-cadherin expression,
whereas those with a low expression level of miR-200c exhibited
high ZEB1/2 and low E-cadherin expression. Therefore, we
investigated characteristics that illustrated differences between
the group of cell lines with high miR-200c expression and those
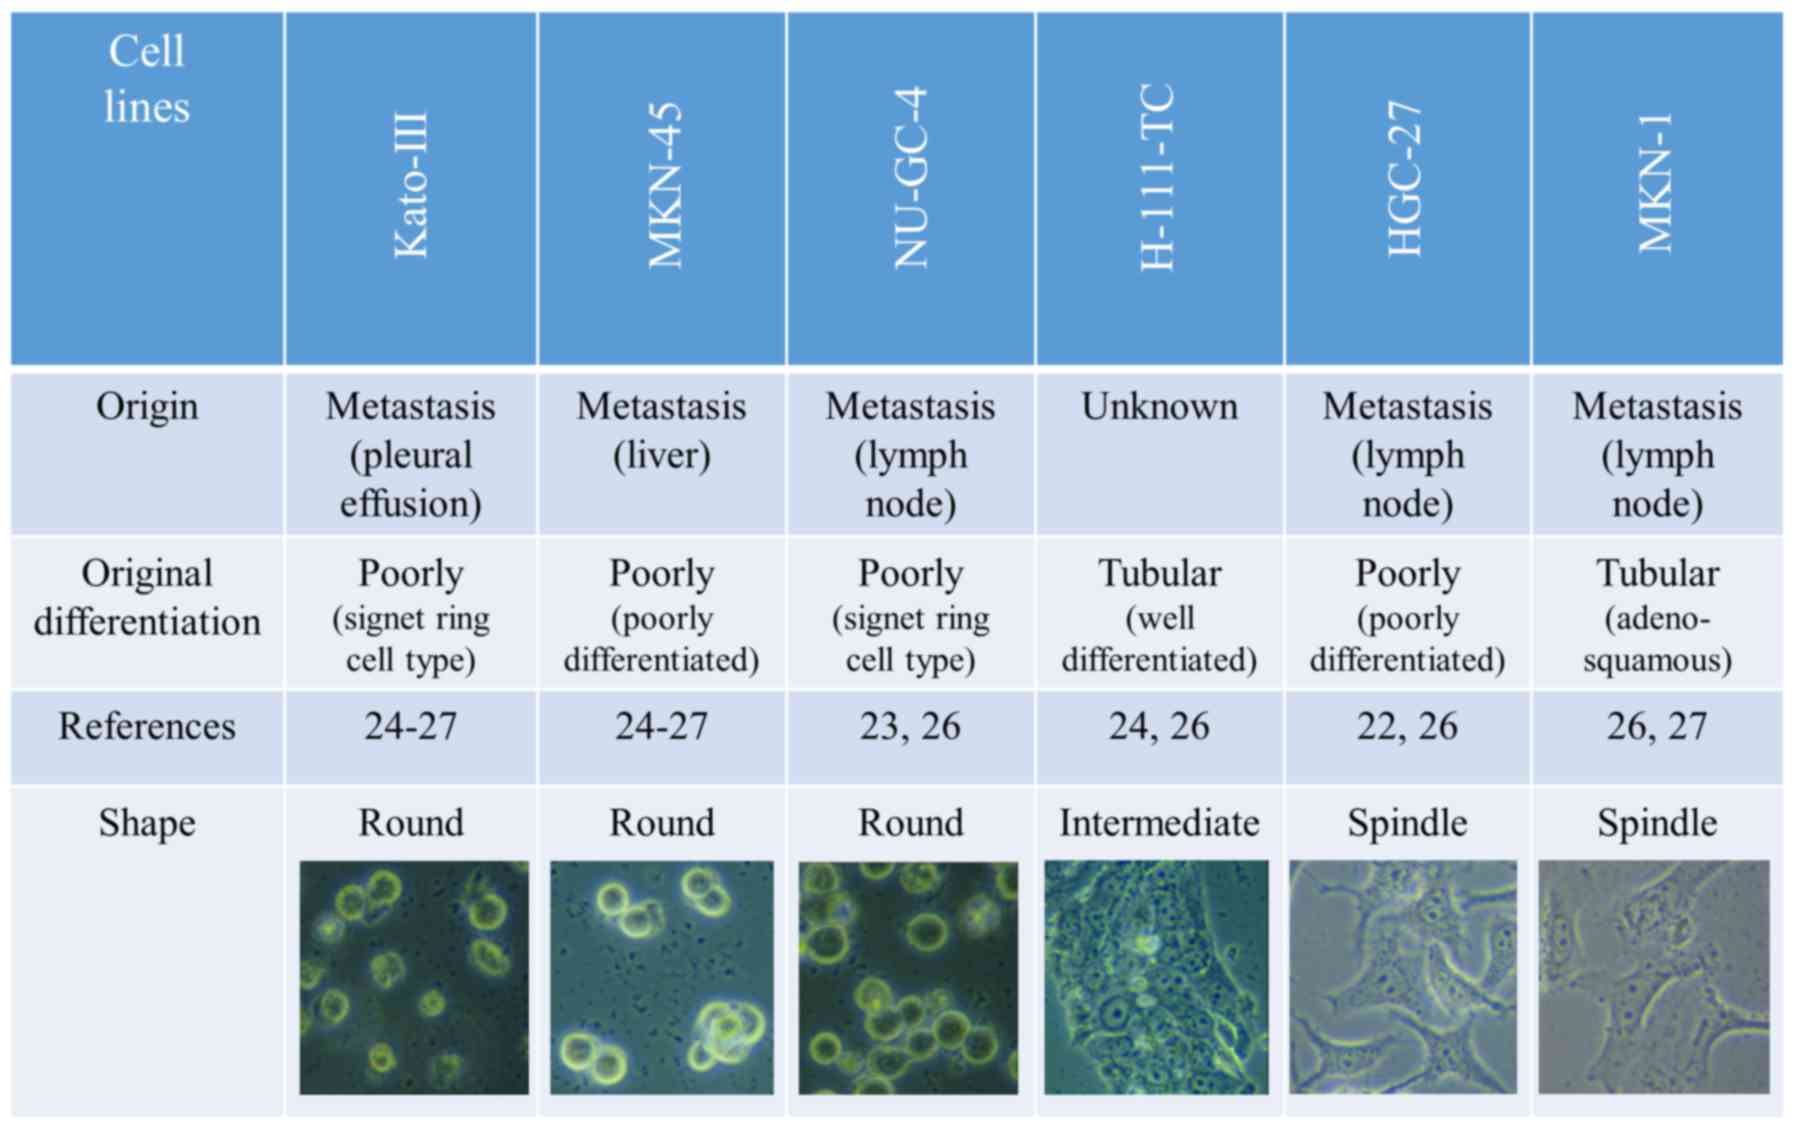
with low miR-200c expression. As shown in Fig. 3, we first compared the tumor origin
(primary or metastatic tumor) of the cell lines. However, the tumor
origin did not clearly correspond to the levels of miR-200c
expression, as cell lines derived from metastatic tumors exhibited
both low and high miR-200c expression levels. Secondly, we compared
the histological differentiation state of the tumors from which the
cell lines were derived was compared. Although cell lines from
poorly differentiated tumors exhibited high miR-200c expression,
the results were inconclusive as one of the cell lines with low
miR-200c expression (HGC-27) was originally from a poorly
differentiated tumor. Thirdly, we revealed that the morphology of
the cell lines was well correlated with the expression level of
miR-200c. Cell lines with high miR-200c expression (Kato-III,
MKN-45 and NU-GC-4) were round-shaped, those with low miR-200c
expression (HGC-27 and MKN-1) were spindle-shaped, and those with
intermediate miR-200c expression (H-111-TC) exhibited a phenotype
which was a mid-way between round- and spindle-shaped (polygonal or
short spindle-shaped).
miR-200c expression patterns in
gastric adenocarcinoma and adjacent non-tumor tissues
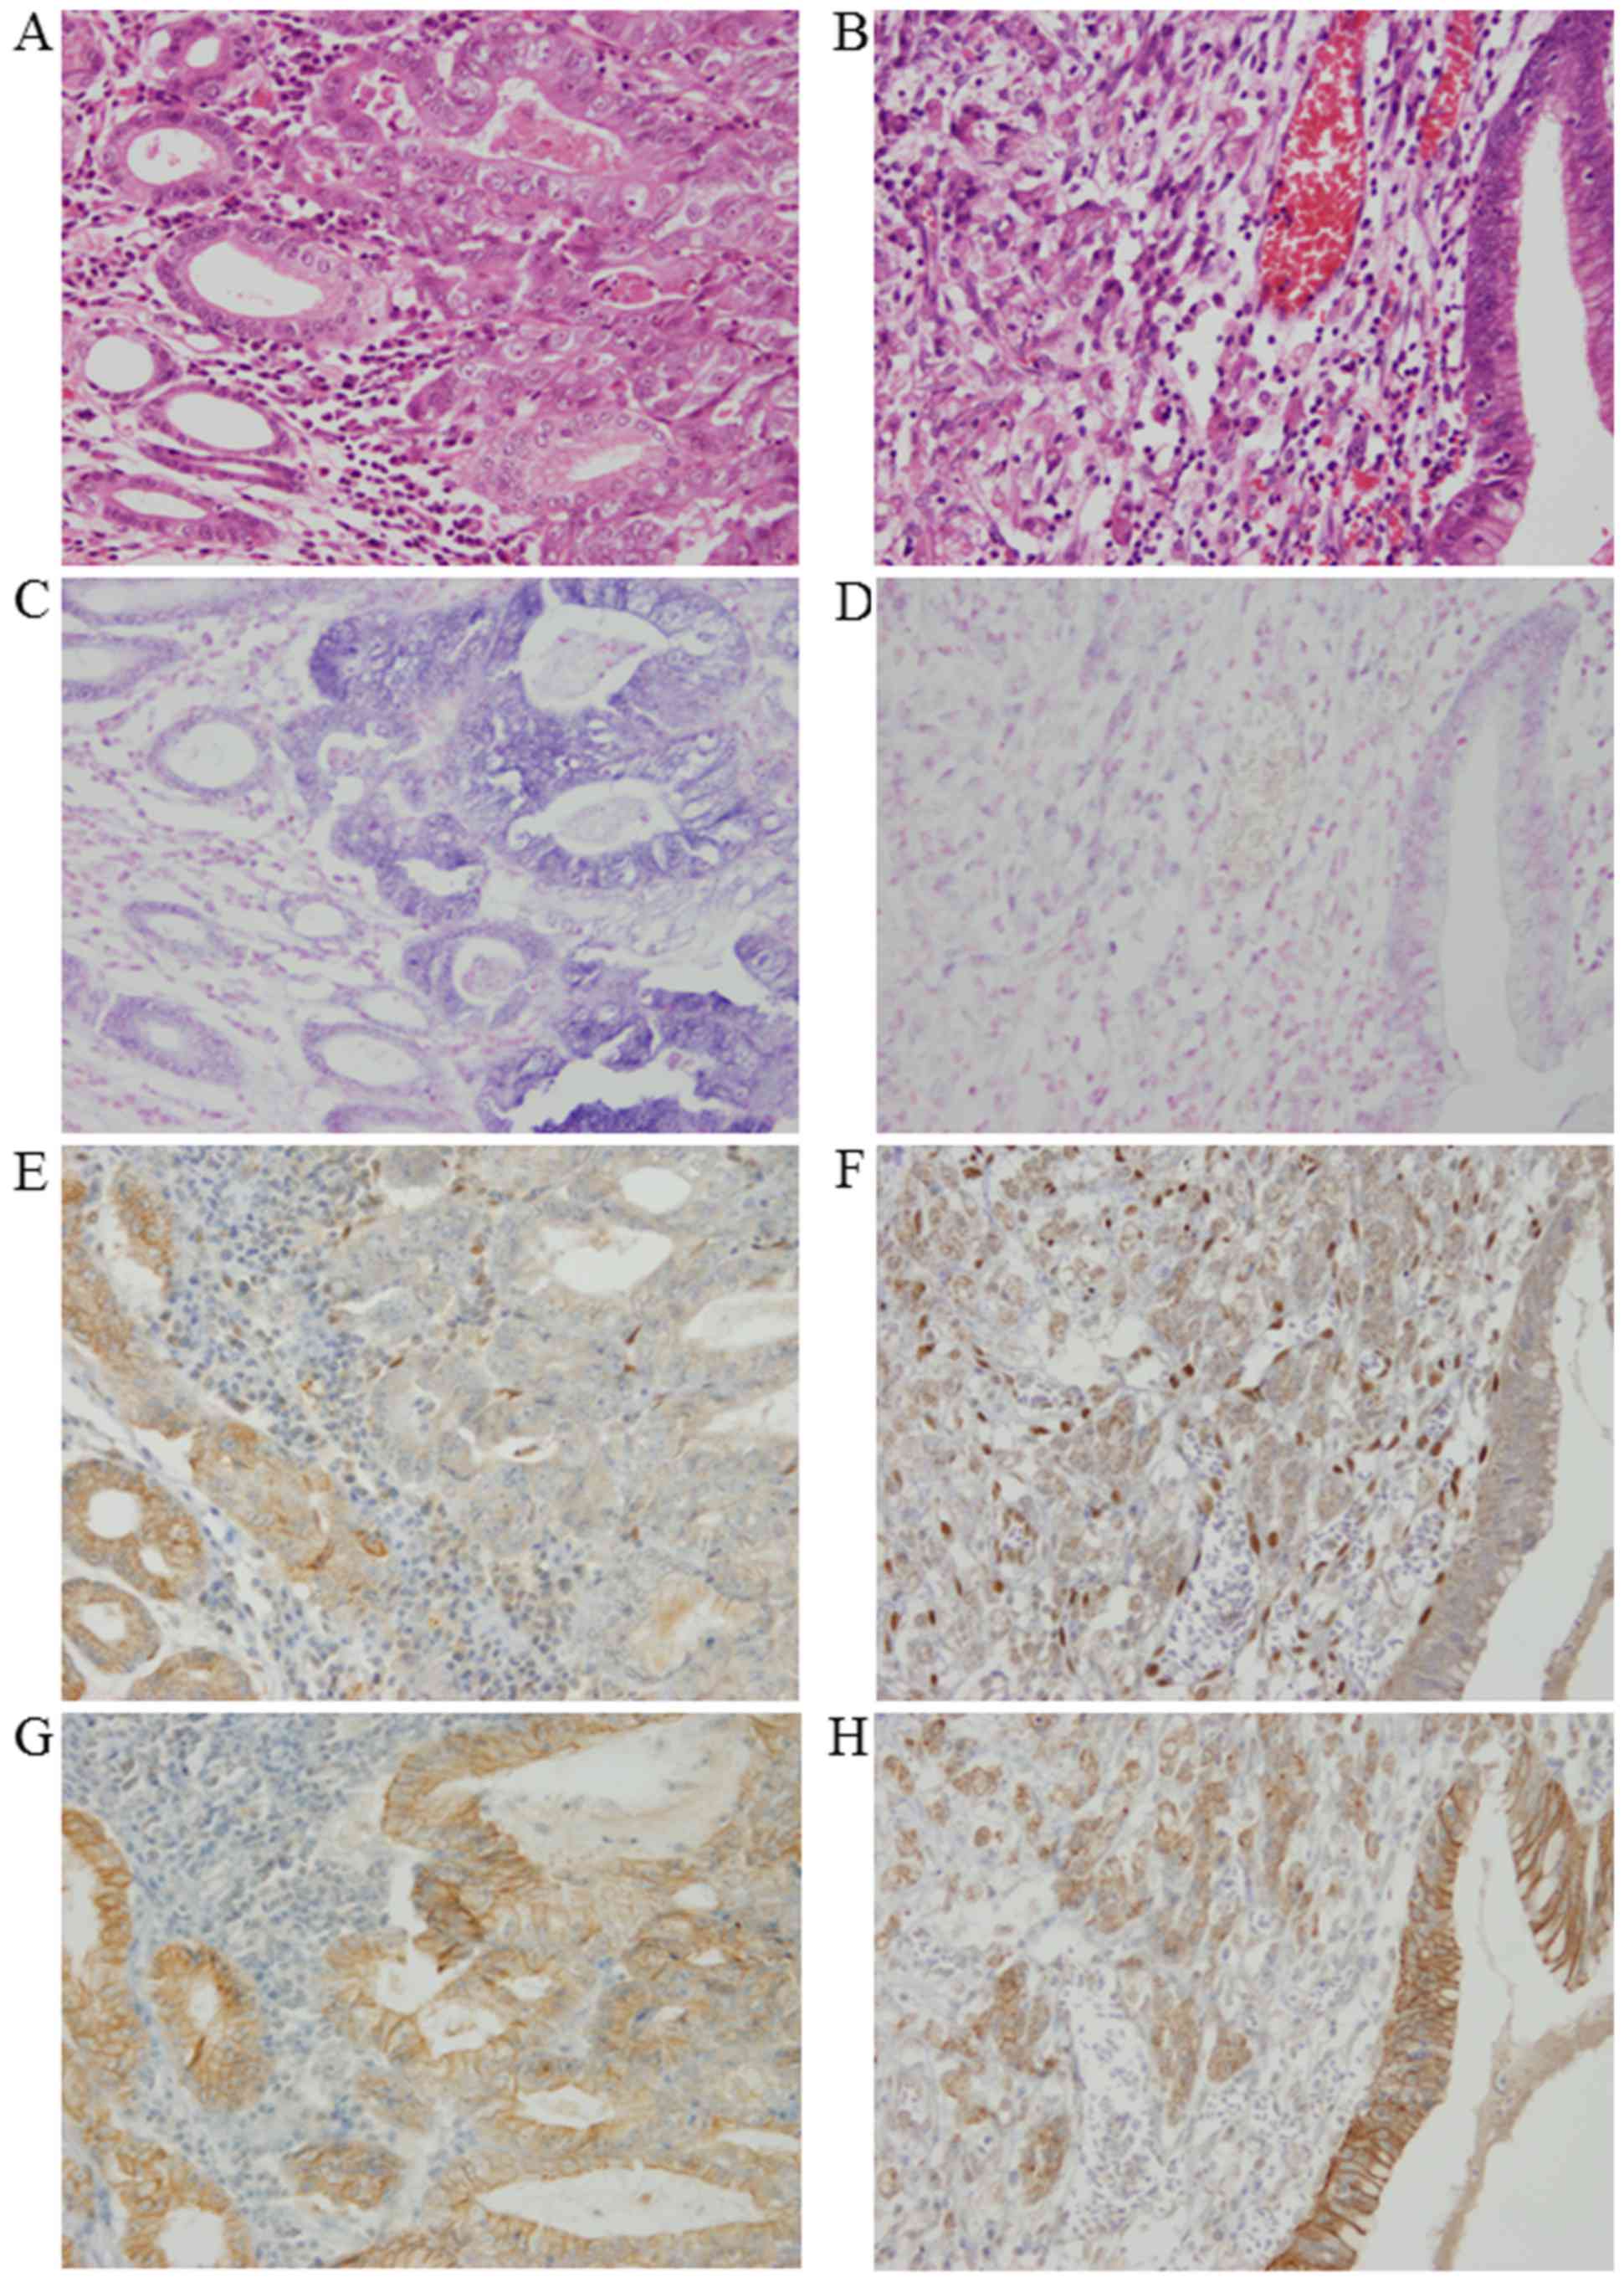
In human tissue samples, positive miR-200c
expression, as determined by ISH, was denoted by cytoplasmic
granular blue staining. Most of the normal tubules stained positive
for miR-200c, whereas stromal tissue was not stained. As shown in
Fig. 4, miR-200c expression
patterns in gastric adenocarcinoma differed substantially between
tubular adenocarcinoma and poorly differentiated adenocarcinoma. In
tubular adenocarcinoma, miR-200c expression was observed with an
intensity level either stronger than or the same as normal tubules.
Conversely, in poorly differentiated adenocarcinoma, miR-200c
expression was either not identified or observed with weaker
staining patterns than normal tubules. The average staining score
for miR-200c was 265±81.6 in tubular adenocarcinomas, while it was
104±75.2 in poorly differentiated adenocarcinomas.
ZEB1 and E-cadherin expression
patterns in gastric adenocarcinoma and adjacent non-tumor
tissues
Positive ZEB1 protein expression was denoted by
nuclear staining. Overall positivity of ZEB1 was relatively low in
normal tubules and gastric carcinomas. ZEB1 was almost negative in
tubular adenocarcinomas; however, positive expression of ZEB1,
although generally weak, was sporadically observed in poorly
differentiated adenocarcinomas. The average staining score for ZEB1
was 0.84±2.93 in tubular adenocarcinomas, while it was 5.8±8.6 in
poorly differentiated adenocarcinomas. Positive E-cadherin protein
expression was indicated by cytomembranous staining. Normal tubules
and tubular adenocarcinomas were strongly stained, while poorly
differentiated adenocarcinomas were weakly stained (Fig. 4). The average staining score for
E-cadherin was 146±52 in tubular adenocarcinomas, while it was
39±38.6 in poorly differentiated adenocarcinomas.
Interpretation of statistical analyses
of human tissue studies
Use of the Chi-square test revealed a correlation
between miR-200c and E-cadherin expression levels (P<0.001) and
an inverse correlation between miR-200c and ZEB1 expression levels
(P<0.001) as well as between ZEB1 and E-cadherin expression
levels (P<0.001). We further compared the expression levels of
miR-200c, ZEB1 and E-cadherin with clinicopathological factors
(Table III). High expression
levels of miR-200c were correlated with older age (≥65 years old)
(P=0.002) and tubular histology (P<0.001). High expression
levels of ZEB1 were correlated with poorly differentiated histology
(P<0.001) and advanced stage (P=0.040). High expression levels
of E-cadherin were correlated with older age (≥65 years old)
(P=0.039) and tubular histology (P<0.001). In the multivariate
analysis (Table IV), among the
clinicopathological factors significantly correlated with the
expression levels of miR-200c, ZEB1 and E-cadherin, there was a
significant association between the expression level of ZEB1 and
advanced stage (P=0.031), as well as a significant correlation
between the expression level of ZEB1 and histology
(P<0.001).
| Table III.Correlations of the expression levels
of miR-200c, ZEB1 and E-cadherin with the clinicopathological
factors as determined by Chi-squared test. |
Table III.
Correlations of the expression levels
of miR-200c, ZEB1 and E-cadherin with the clinicopathological
factors as determined by Chi-squared test.
|
| miR-200c | ZEB1 | E-cadherin |
|---|
|
|
|
|
|
|---|
|
| High | Low | P-value | High | Low | P-value | High | Low | P-value |
|---|
| Sex |
|
| 0.474 |
|
| 0.419 |
|
| 0.812 |
|
Male | 37 | 37 |
| 18 | 56 |
| 35 | 39 |
|
|
Female | 9 | 14 |
| 8 | 15 |
| 12 | 11 |
|
| Age (years
old) |
|
| 0.002 |
|
| 0.063 |
|
| 0.039 |
|
≥65 | 35 | 22 |
| 11 | 46 |
| 33 | 24 |
|
|
<65 | 11 | 29 |
| 15 | 25 |
| 14 | 26 |
|
| LN metastasis |
|
| 0.289 |
|
| 1.000 |
|
| 0.830 |
|
Positive | 13 | 20 |
| 9 | 24 |
| 15 | 18 |
|
|
Negative | 33 | 31 |
| 17 | 47 |
| 32 | 32 |
|
| Histology |
|
|
<0.001 |
|
|
<0.001 |
|
|
<0.001 |
|
Tubular | 45 | 22 |
| 9 | 58 |
| 45 | 22 |
|
| Poor
differentiation | 1 | 29 |
| 17 | 13 |
| 2 | 28 |
|
| Tumor size
(mm) |
|
| 0.224 |
|
| 0.360 |
|
| 0.312 |
|
≥40 | 19 | 28 |
| 15 | 32 |
| 20 | 27 |
|
|
<40 | 27 | 23 |
| 11 | 39 |
| 27 | 23 |
|
| Stage |
|
| 0.310 |
|
| 0.040 |
|
| 0.840 |
|
Advanced | 19 | 27 |
| 17 | 29 |
| 23 | 23 |
|
|
Early | 27 | 24 |
| 9 | 42 |
| 24 | 2 |
|
| Vessel
invasion |
|
| 0.157 |
|
| 0.259 |
|
| 0.840 |
|
Positive | 20 | 30 |
| 16 | 34 |
| 25 | 25 |
|
|
Negative | 26 | 21 |
| 10 | 37 |
| 22 | 25 |
|
| Table IV.Multivariate analyses of correlations
between the clinicopathological factors and positive expression of
miR-200c, ZEB1 and E-cadherin. |
Table IV.
Multivariate analyses of correlations
between the clinicopathological factors and positive expression of
miR-200c, ZEB1 and E-cadherin.
|
| miR-200c | ZEB1 | E-cadherin |
|---|
|
|
|
|
|
|---|
| Clinicopathological
factors | OR (95% CI) | P-value | OR (95% CI) | P-value | OR (95% CI) | P-value |
|---|
| Sex | 1.822 | 0.359 | 0.294 | 0.082 | 0.438 | 0.201 |
| Male
vs. female | (0.505–6.568) |
| (0.074–1.170) |
| (0.124–1.553) |
|
| Age
(years old) | 2.742 | 0.071 | 0.505 | 0.261 | 1.085 | 0.882 |
| ≥65 vs.
<65 | (0.916–8.202) |
| (0.153–1.662) |
| (0.370–3.184) |
|
| LN metastasis | 1.038 | 0.959 | 0.347 | 0.125 | 0.458 | 0.280 |
|
Positive vs. negative | (0.249–4.320) |
| (0.090–1.342) |
| (0.111–1.888) |
|
| Histology | 0.023 |
<0.001 | 7.556 |
<0.001 | 0.025 |
<0.001 |
| Tubular
vs. poor differentiation | (0.003–0.182) |
| (2.471–23.109) |
| (0.005–0.137) |
|
| Tumor size
(mm) | 1.087 | 0.889 | 0.809 | 0.730 | 0.533 | 0.276 |
| ≥40 vs.
<40 | (0.337–3.509) |
| (0.242–2.703) |
| (0.172–1.652) |
|
| Stage | 1.073 | 0.923 | 5.522 | 0.031 | 2.197 | 0.260 |
|
Advanced vs. early | (0.258–4.473) |
| (1.166–26.148) |
| (0.558–8.653) |
|
| Vessel
invasion | 0.484 | 0.354 | 0.998 | 0.998 | 2.182 | 0.306 |
|
Positive vs. negative | (0.105–2.240) |
| (0.227–4.378) |
| (0.489–9.732) |
|
Discussion
In the present study, we revealed inverse
correlations between miR-200c and ZEB1 in both cell lines and
tissues, as well as inverse correlations between ZEB1 and
E-cadherin in tissues, in gastric carcinoma. These well known
correlations which are associated with EMT (8) have been demonstrated both in
vitro and in vivo in several cancers including non-small
cell lung cancer and pancreatic cancer (15,16)
and recently also in gastric cancer (21,31).
However, this study is the first to have demonstrated that this
phenomenon was associated with the morphology of cell lines and
histological differentiation, the latter as visualized by ISH, in
gastric carcinoma.
qRT-PCR analysis of 6 cell lines in the present
study revealed that the expression level of miR-200c descended in
the following order: Kato-III > MKN-45 > NU-GC-4 >
H-111-TC > HGC-27 > MKN-1. The expression level of ZEB1 or
ZEB2 corresponded to the reverse order, and that of E-cadherin
corresponded to this order. Indeed, significantly inverse
correlations between miR-200c and ZEB1 were obtained by Spearmans
rank correlation. Our results are in line with a previous study in
which E-cadherin gene expression was present in MKN-45 cells but
absent in HGC-27 cells (32), along
with a recent study which revealed that Kato-III, MKN-45 and
NU-GC-4 cells had high expression of E-cadherin and low expression
of ZEB1, while MKN-1 cells had low expression of E-cadherin and
high expression of ZEB1 (33).
However, these authors did not mention any differences in cell
morphology in their studies. In the present study, western blot
analysis coincided with qRT-PCR data, albeit E-cadherin expression
in Kato-III and MKN-45 cells was almost absent contrary to positive
expression as determined by qRT-PCR analysis. This result was
compatible with another study that revealed that E-cadherin protein
expression was undetectable by western blot analysis, while it was
detected at the DNA and mRNA level by southern and northern blot
analysis, respectively, in Kato-III and MKN-45 cells (4). They mentioned that the possibility of
post-translational modification or minor abnormalities in
antibody-recognition sites may be involved in this discrepancy.
We searched for key differences in the
characteristics between cell lines displaying divergent expression
levels of miR-200c which also corresponded to differences in the
expression levels of ZEB1/2 and E-cadherin. Although histological
differences were conspicuous in the tissue studies mentioned below,
cell line groupings based on the expression of miR-200c and
associated targets did not correspond to histological
differentiation of the derived tumors. Other authors have also
demonstrated that E-cadherin was ‘unexpectedly’ detected in cell
lines that originated from poorly differentiated gastric carcinomas
(26). This may be due to the fact
that cell lines have generally been established from tumors
exhibiting heterogenous histology. Indeed, it has been reported
that histological difference in original tumors did not influence
the growth rate of various cell lines in gastric carcinomas
(25). Instead, we established that
cell lines with high miR-200c expression (Kato-III, MKN-45 and
NU-GC-4), low miR-200c expression (HGC-27 and MKN-1), and
intermediate miR-200c expression (H-111-TC) exhibited round,
spindle, and intermediate, respectively, cell morphologies.
Although studies concerning cell morphology in association with
expression of miR-200 family members are scant, one research group
demonstrated that expression of miR-200c was associated with round
cell morphology whereas that of miR-200a was associated with
spindle cell morphology in melanoma cell lines (34). The phenomenon where E-cadherin (+)
cells are round and E-cadherin (−) cells are spindle in shape has
been reported in esophageal cancer cells and, recently, in colon
cancer cells (35,36). Furthermore, it was formerly reported
that cell morphology of E-cadherin-deficient cell lines was
generally altered from the fibroblastic cell type to the epithelial
cell type by transfection with complementary DNA that codes for
E-cadherin (37). Therefore, the
influence of miR-200c and E-cadherin on cell morphology may be a
universal phenomenon.
In the tissue samples, miR-200c expression, as
visualized by ISH, was strongly expressed in tubular
adenocarcinomas but weakly expressed in poorly differentiated
adenocarcinomas. This result was in agreement with a recent study
in which low expression levels of each member of the miR-200 family
were associated with histological grade in gastric carcinoma
tissues, as assessed by qRT-PCR analysis (31). Analysis of non-small cell lung
cancer tissue also revealed that low miR-200c expression levels
were associated with poorly differentiated histology (15). Assessment of endometrial
carcinosarcoma tissues revealed that members of the miR-200 family
were downregulated in the mesenchymal part of the tumor (38). Therefore, it is likely that the
expression of miR-200c is associated with epithelial histology of
tumors in general.
IHC analysis revealed that tubular adenocarcinomas
were negative for ZEB1 and positive for E-cadherin, while poorly
differentiated adenocarcinomas were sporadically positive for ZEB1
and negative for E-cadherin. Notably, it has long been pointed out
that the level of E-cadherin is significantly lower in poorly
differentiated adenocarcinomas compared to differentiated
adnocarcinomas and non-neoplastic mucosa of the stomach (4,32). The
reason for this phenomenon was proposed to be inactivation of the
E-cadherin gene due to either a classic two-hit mechanism or
hypermethylation (32). In the
present study, we add EMT mediated by miR-200c as a possible causal
mechanism, since miR-200c and ZEB1 expression levels, as well as
ZEB1 and E-cadherin expression levels, were inversely correlated
(P<0.001). Other authors have also demonstrated an inverse
correlation between ZEB1 and E-cadherin mRNA expression in gastric
cancer tissue (33). Association of
poorly differentiated histology with high expression of ZEB1 and
low expression of E-cadherin, as determined by IHC, has also been
demonstrated in endometrioid carcinoma and non-small cell lung
cancers (6,7).
In addition to histology, older age was also
correlated with high expression levels of miR-200c and E-cadherin
as assessed by Chi-squared test. However, in terms of multivariate
analyses, age was not correlated with miR-200c and E-cadherin
expression, although histology remained correlated. These results
coincide with a well-known fact that poorly differentiated
scirrhous gastric carcinoma is more frequent in younger patients
(2,3). Conversely, a high expression level of
ZEB1 was correlated with advanced stage by multivariate analyses.
As other authors have also reported, gastric cancer patients with
high ZEB1 mRNA expression displayed significantly poorer survival
than those with low expression (33), ZEB1 may be independently associated
with advanced stage.
Concerning miR-200c expression in tumors in general,
a meta-analysis revealed that low expression of miR-200c in primary
cancer tissue from early-stage patients was significantly
associated with poor survival (39). Association of low miR-200c
expression with high propensity to metastasis, along with highly
invasive/aggressive ability, has been demonstrated in several
cancers including non-small cell lung cancer and pancreatic cancer
(15,16). Recent studies have also demonstrated
that migration/invasion abilities of gastric cancer cells were
promoted by decreased expression of miR-200c, while they were
inhibited by ZEB1 siRNA (21,33).
In addition, the present study demonstrated an association of
miR-200c with cell morphology and histological differentiation of
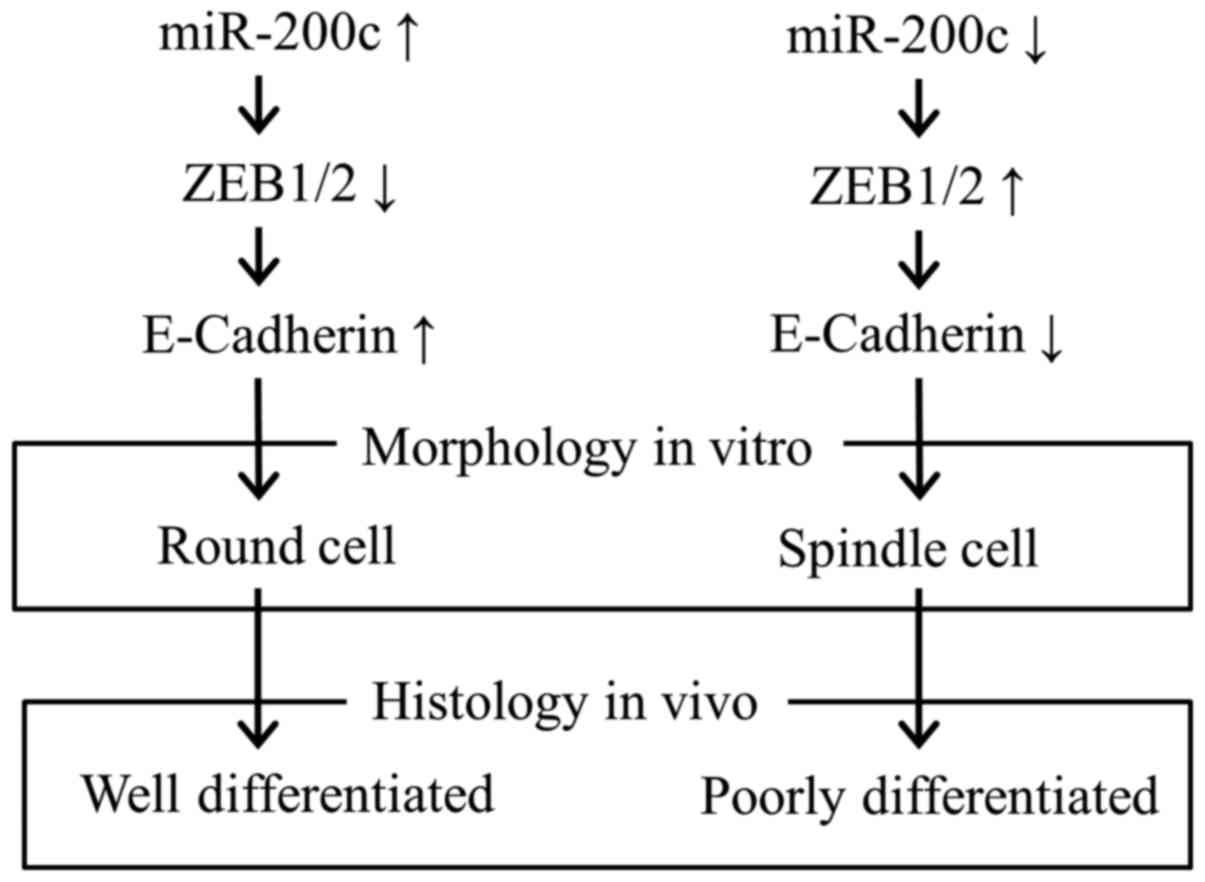
the tumor. Since it has been proposed that the ability of miR-200c
to regulate morphological plasticity may be important in relation
to dissemination capacity in melanoma (34), we postulate that downregulation of
miR-200c primarily regulates cell morphology by downregulation of
E-cadherin through upregulation of ZEB1/2, with this morphological
change causing poorly differentiated histology (Fig. 5), producing enhanced
migration/invasion abilities, and finally leading to scirrhous
stromal reaction and poor prognosis (2,3).
In summary, using cell culture models and
histological assessment of gastric carcinoma, we demonstrated an
inverse correlation in the expression level between miR-200c and
ZEB1 in vitro and in vivo, as well as between ZEB1
and E-cadherin in vivo. Low miR-200c expression was
associated with spindle cell morphology in vitro and poorly
differentiated histology in vivo; thus, this factor may be
involved in the carcinogenesis of scirrhous gastric carcinoma.
Acknowledgements
The present study was supported by Grants-in-Aid for
scientific research (C) (grant no. 24590431).
References
|
1
|
Jemal A, Bray F, Center MM, Ferlay J, Ward
E and Forman D: Global cancer statistics. CA Cancer J Clin.
61:69–90. 2011. View Article : Google Scholar : PubMed/NCBI
|
|
2
|
Duarte I and Llanos O: Patterns of
metastases in intestinal and diffuse types of carcinoma of the
stomach. Hum Pathol. 12:237–242. 1981. View Article : Google Scholar : PubMed/NCBI
|
|
3
|
Yokota T, Teshima S, Saito T, Kikuchi S,
Kunii Y and Yamauchi H: Borrmanns type IV gastric cancer:
Clinicopathologic analysis. Can J Surg. 42:371–376. 1999.PubMed/NCBI
|
|
4
|
Yasui W, Kuniyasu H, Akama Y, Kitahara K,
Nagafuchi A, Ishihara S, Tsukita S and Tahara E: Expression of
e-cadherin, alpha-catenins and Beta-catenins in human gastric
carcinomas - correlation with histology and tumor progression.
Oncol Rep. 2:111–117. 1995.PubMed/NCBI
|
|
5
|
Hippo Y, Yashiro M, Ishii M, Taniguchi H,
Tsutsumi S, Hirakawa K, Kodama T and Aburatani H: Differential gene
expression profiles of scirrhous gastric cancer cells with high
metastatic potential to peritoneum or lymph nodes. Cancer Res.
61:889–895. 2001.PubMed/NCBI
|
|
6
|
Matsubara D, Kishaba Y, Yoshimoto T,
Sakuma Y, Sakatani T, Tamura T, Endo S, Sugiyama Y, Murakami Y and
Niki T: Immunohistochemical analysis of the expression of
E-cadherin and ZEB1 in non-small cell lung cancer. Pathol Int.
64:560–568. 2014. View Article : Google Scholar : PubMed/NCBI
|
|
7
|
Romero-Pérez L, López-García MÁ,
Díaz-Martín J, Biscuola M, Castilla MÁ, Tafe LJ, Garg K, Oliva E,
Matias-Guiu X, Soslow RA, et al: ZEB1 overexpression associated
with E-cadherin and microRNA-200 downregulation is characteristic
of undifferentiated endometrial carcinoma. Mod Pathol.
26:1514–1524. 2013. View Article : Google Scholar : PubMed/NCBI
|
|
8
|
Burk U, Schubert J, Wellner U, Schmalhofer
O, Vincan E, Spaderna S and Brabletz T: A reciprocal repression
between ZEB1 and members of the miR-200 family promotes EMT and
invasion in cancer cells. EMBO Rep. 9:582–589. 2008. View Article : Google Scholar : PubMed/NCBI
|
|
9
|
Poliseno L, Salmena L, Riccardi L, Fornari
A, Song MS, Hobbs RM, Sportoletti P, Varmeh S, Egia A, Fedele G, et
al: Identification of the miR-106b~25 microRNA cluster as a
proto-oncogenic PTEN-targeting intron that cooperates with its host
gene MCM7 in transformation. Sci Signal. 3:ra292010. View Article : Google Scholar : PubMed/NCBI
|
|
10
|
Sethi S, Kong D, Land S, Dyson G, Sakr WA
and Sarkar FH: Comprehensive molecular oncogenomic profiling and
miRNA analysis of prostate cancer. Am J Transl Res. 5:200–211.
2013.PubMed/NCBI
|
|
11
|
Hassan O, Ahmad A, Sethi S and Sarkar FH:
Recent updates on the role of microRNAs in prostate cancer. J
Hematol Oncol. 5:92012. View Article : Google Scholar : PubMed/NCBI
|
|
12
|
Landgraf P, Rusu M, Sheridan R, Sewer A,
Iovino N, Aravin A, Pfeffer S, Rice A, Kamphorst AO, Landthaler M,
et al: A mammalian microRNA expression atlas based on small RNA
library sequencing. Cell. 129:1401–1414. 2007. View Article : Google Scholar : PubMed/NCBI
|
|
13
|
Ventura A and Jacks T: MicroRNAs and
cancer: Short RNAs go a long way. Cell. 136:586–591. 2009.
View Article : Google Scholar : PubMed/NCBI
|
|
14
|
Bojmar L, Karlsson E, Ellegård S, Olsson
H, Björnsson B, Hallböök O, Larsson M, Stål O and Sandström P: The
role of microRNA-200 in progression of human colorectal and breast
cancer. PLoS One. 8:e848152013. View Article : Google Scholar : PubMed/NCBI
|
|
15
|
Ceppi P, Mudduluru G, Kumarswamy R, Rapa
I, Scagliotti GV, Papotti M and Allgayer H: Loss of miR-200c
expression induces an aggressive, invasive, and chemoresistant
phenotype in non-small cell lung cancer. Mol Cancer Res.
8:1207–1216. 2010. View Article : Google Scholar : PubMed/NCBI
|
|
16
|
Yu J, Ohuchida K, Mizumoto K, Sato N,
Kayashima T, Fujita H, Nakata K and Tanaka M: MicroRNA,
hsa-miR-200c, is an independent prognostic factor in pancreatic
cancer and its upregulation inhibits pancreatic cancer invasion but
increases cell proliferation. Mol Cancer. 9:1692010. View Article : Google Scholar : PubMed/NCBI
|
|
17
|
Marchini S, Cavalieri D, Fruscio R, Calura
E, Garavaglia D, Nerini I Fuso, Mangioni C, Cattoretti G, Clivio L,
Beltrame L, et al: Association between miR-200c and the survival of
patients with stage I epithelial ovarian cancer: A retrospective
study of two independent tumour tissue collections. Lancet Oncol.
12:273–285. 2011. View Article : Google Scholar : PubMed/NCBI
|
|
18
|
Kurashige J, Mima K, Sawada G, Takahashi
Y, Eguchi H, Sugimachi K, Mori M, Yanagihara K, Yashiro M, Hirakawa
K, et al: Epigenetic modulation and repression of miR-200b by
cancer-associated fibroblasts contribute to cancer invasion and
peritoneal dissemination in gastric cancer. Carcinogenesis.
36:133–141. 2015. View Article : Google Scholar : PubMed/NCBI
|
|
19
|
Shinozaki A, Sakatani T, Ushiku T, Hino R,
Isogai M, Ishikawa S, Uozaki H, Takada K and Fukayama M:
Downregulation of microRNA-200 in EBV-associated gastric carcinoma.
Cancer Res. 70:4719–4727. 2010. View Article : Google Scholar : PubMed/NCBI
|
|
20
|
Song F, Yang D, Liu B, Guo Y, Zheng H, Li
L, Wang T, Yu J, Zhao Y, Niu R, et al: Integrated microRNA network
analyses identify a poor-prognosis subtype of gastric cancer
characterized by the miR-200 family. Clin Cancer Res. 20:878–889.
2014. View Article : Google Scholar : PubMed/NCBI
|
|
21
|
Zhou X, Wang Y, Shan B, Han J, Zhu H, Lv
Y, Fan X, Sang M, Liu XD and Liu W: The downregulation of
miR-200c/141 promotes ZEB1/2 expression and gastric cancer
progression. Med Oncol. 32:4282015. View Article : Google Scholar : PubMed/NCBI
|
|
22
|
Akagi T and Kimoto T: Human cell line
(HGC-27) derived from the metastatic lymph node of gastric cancer.
Acta Med Okayama. 30:215–219. 1976.PubMed/NCBI
|
|
23
|
Akiyama S, Amo H, Watanabe T, Matsuyama M,
Sakamoto J, Imaizumi M, Ichihashi H, Kondo T and Takagi H:
Characteristics of three human gastric cancer cell lines, NU-GC-2,
NU-GC-3 and NU-GC-4. Jpn J Surg. 18:438–446. 1988. View Article : Google Scholar : PubMed/NCBI
|
|
24
|
Kakinuma N, Sato M, Yamada T, Kohu K,
Nakajima M, Akiyama T, Ohwada S and Shibanaka Y: Cloning of novel
LERGU mRNAs in GPR30 3 untranslated region and detection of 2
bp-deletion polymorphism in gastric cancer. Cancer Sci. 96:191–196.
2005. View Article : Google Scholar : PubMed/NCBI
|
|
25
|
Motoyama T, Hojo H and Watanabe H:
Comparison of seven cell lines derived from human gastric
carcinomas. Acta Pathol Jpn. 36:65–83. 1986.PubMed/NCBI
|
|
26
|
Konno-Shimizu M, Yamamichi N, Inada K,
Kageyama-Yahara N, Shiogama K, Takahashi Y, Asada-Hirayama I,
Yamamichi-Nishina M, Nakayama C, Ono S, et al: Cathepsin E is a
marker of gastric differentiation and signet-ring cell carcinoma of
stomach: A novel suggestion on gastric tumorigenesis. PLoS One.
8:e567662013. View Article : Google Scholar : PubMed/NCBI
|
|
27
|
Yamada Y, Yoshida T, Hayashi K, Sekiya T,
Yokota J, Hirohashi S, Nakatani K, Nakano H, Sugimura T and Terada
M: p53 gene mutations in gastric cancer metastases and in gastric
cancer cell lines derived from metastases. Cancer Res.
51:5800–5805. 1991.PubMed/NCBI
|
|
28
|
Tanaka M, Oikawa K, Takanashi M, Kudo M,
Ohyashiki J, Ohyashiki K and Kuroda M: Down-regulation of miR-92 in
human plasma is a novel marker for acute leukemia patients. PLoS
One. 4:e55322009. View Article : Google Scholar : PubMed/NCBI
|
|
29
|
Wu W, Takanashi M, Borjigin N, Ohno SI,
Fujita K, Hoshino S, Osaka Y, Tsuchida A and Kuroda M: MicroRNA-18a
modulates STAT3 activity through negative regulation of PIAS3
during gastric adenocarcinogenesis. Br J Cancer. 108:653–661. 2013.
View Article : Google Scholar : PubMed/NCBI
|
|
30
|
Acs G, Zhang PJ, McGrath CM, Acs P,
McBroom J, Mohyeldin A, Liu S, Lu H and Verma A: Hypoxia-inducible
erythropoietin signaling in squamous dysplasia and squamous cell
carcinoma of the uterine cervix and its potential role in cervical
carcinogenesis and tumor progression. Am J Pathol. 162:1789–1806.
2003. View Article : Google Scholar : PubMed/NCBI
|
|
31
|
Chang L, Guo F, Huo B, Lv Y, Wang Y and
Liu W: Expression and clinical significance of the microRNA-200
family in gastric cancer. Oncol Lett. 9:2317–2324. 2015.PubMed/NCBI
|
|
32
|
Tamura G, Sakata K, Nishizuka S, Maesawa
C, Suzuki Y, Iwaya T, Terashima M, Saito K and Satodate R:
Inactivation of the E-cadherin gene in primary gastric carcinomas
and gastric carcinoma cell lines. Jpn J Cancer Res. 87:1153–1159.
1996. View Article : Google Scholar : PubMed/NCBI
|
|
33
|
Murai T, Yamada S, Fuchs BC, Fujii T,
Nakayama G, Sugimoto H, Koike M, Fujiwara M, Tanabe KK and Kodera
Y: Epithelial-to-mesenchymal transition predicts prognosis in
clinical gastric cancer. J Surg Oncol. 109:684–689. 2014.
View Article : Google Scholar : PubMed/NCBI
|
|
34
|
Elson-Schwab I, Lorentzen A and Marshall
CJ: MicroRNA-200 family members differentially regulate
morphological plasticity and mode of melanoma cell invasion. PLoS
One. 5:e131762010. View Article : Google Scholar : PubMed/NCBI
|
|
35
|
Doki Y, Shiozaki H, Tahara H, Inoue M, Oka
H, Iihara K, Kadowaki T, Takeichi M and Mori T: Correlation between
E-cadherin expression and invasiveness in vitro in a human
esophageal cancer cell line. Cancer Res. 53:3421–3426.
1993.PubMed/NCBI
|
|
36
|
Ji M, Lee EJ, Kim KB, Kim Y, Sung R, Lee
SJ, Kim DS and Park SM: HDAC inhibitors induce
epithelial-mesenchymal transition in colon carcinoma cells. Oncol
Rep. 33:2299–2308. 2015. View Article : Google Scholar : PubMed/NCBI
|
|
37
|
Takeichi M: The cadherins: Cell-cell
adhesion molecules controlling animal morphogenesis. Development.
102:639–655. 1988.PubMed/NCBI
|
|
38
|
Castilla MÁ, Moreno-Bueno G, Romero-Pérez
L, Van De Vijver K, Biscuola M, López-García MÁ, Prat J,
Matías-Guiu X, Cano A, Oliva E, et al: Micro-RNA signature of the
epithelial-mesenchymal transition in endometrial carcinosarcoma. J
Pathol. 223:72–80. 2011. View Article : Google Scholar : PubMed/NCBI
|
|
39
|
Shao Y, Geng Y, Gu W, Huang J, Pei H and
Jiang J: Prognostic role of tissue and circulating microRNA-200c in
malignant tumors: A systematic review and meta-analysis. Cell
Physiol Biochem. 35:1188–1200. 2015. View Article : Google Scholar : PubMed/NCBI
|