Introduction
Cholangiocellular carcinoma (CCA) is more prevalent
in Asian countries than it is in Western countries. However, the
incidence of intrahepatic CCA has increased worldwide. Most
patients present with advanced disease, and less than 30% are
eligible for curative resection. After surgery, the 5-year survival
rate is 20%, and chemotherapy and radiation have not yet been
proven to prolong survival time (1). Chronic inflammation, cytokines and
molecular alterations induce genetic and epigenetic changes, which
contribute to the initiation, promotion and progression of CCA
(2). Acetylation or deacetylation
of the lysine residue in histones modifies chromatin through the
competitive action of histone acetyltransferases (HATs) and histone
deacetylases (HDACs). HDACs promote carcinogenesis by repressing
tumor-suppressor genes, and they are overexpressed in numerous
types of tumors (3). HDACs are
divided into four classes based on their homology to yeast
HDACs.
HDAC inhibitors are also divided into four classes
based on their chemical structures: Hydroxamates [including
trichostatin A (TSA) and suberoylanilide hydroxamic acid (SAHA)],
aliphatic acids [including valproic acid (VPA)], cyclic peptides,
and benzamides (4).
Hyperacetylation by HDAC inhibitors is associated with chromatin
decondensation, leading to the transcription of genes with
anticancer effects such as antiproliferation, cell cycle arrest,
differentiation and apoptosis. TSA exhibits antiproliferative
effects on biliary tract cancer cell lines (5). SAHA and VPA act synergistically with
the chemotherapeutic drug 5-fluorouracil (5-FU) against CCA cells
(6). VPA augments the effect of
5-FU on CCA and pancreatic cancer cells, possibly by increasing
apoptosis or p21 expression (7).
These results suggest that HDAC inhibitors have therapeutic
potential for cancers of the biliary tract, and act synergistically
with conventional chemotherapeutic drugs.
Malignant cells undergo epithelial-to-mesenchymal
transition (EMT), a process by which epithelial cells lose their
cell-cell adhesion properties, acquire a non-polarized mesenchymal
phenotype, and express proteins such as vimentin, Snail, zinc
finger E-box-binding homeobox 1 (Zeb1) and Twist family bHLH
transcription factor 1 (Twist) (8).
The expression of vimentin and loss of E-cadherin are associated
with carcinogenesis and are linked to tumor cell migration and
invasion (9). Histone modification
has been shown to play a key role in controlling EMT. Specifically,
recent reports have shown that HDAC inhibitors are associated with
suppression of EMT in various solid tumors (10–14).
Numerous studies have reported that various HDAC inhibitors reverse
or attenuate EMT through the upregulation of E-cadherin in
different solid tumors such as hepatocellular carcinoma (HCC)
(10), breast (11,12),
esophageal (13), and ovarian
(14) cancers.
In addition, HDAC inhibitors attenuate EMT induced
by transforming growth factor (TGF)-β1 in different cells, such as
hepatocytes (15), retinal pigment
epithelial (16), lens epithelial
(17), and renal epithelial cells
(18). These results suggest that
HDAC inhibitors may be applied therapeutically to reduce EMT.
However, recent studies have also reported that HDAC inhibitors may
induce EMT and stem cell properties, as well as enhance metastasis
and invasion in prostate (19),
head and neck squamous cell carcinoma (20), nasopharyngeal carcinoma (21), and colorectal (22) cancer. In contrast, Sakamoto et
al (23) reported that the HDAC
inhibitor vorinostat suppressed TGF-β-induced EMT in biliary tract
cancer. The effect of HDAC inhibitors on the suppression of EMT
appears to differ according to the cell type examined, the specific
HDAC inhibitor used, and its dose. Whether HDAC inhibitors inhibit
or induce EMT in cholangiocarcinoma needs to be clarified.
Therefore, in this study, we investigated the effect
of the HDAC inhibitors TSA and VPA on the EMT of CCA cells alone
and in combination with the chemotherapeutic drug gemcitabine
(GEM). We evaluated the expression of E-cadherin or zonula
occludens (ZO-1), epithelial markers, and vimentin, a mesenchymal
marker. EMT was evaluated by observing cell morphology and
performing migration and invasion assays.
Materials and methods
Cell lines and culture condition
We used three CCA cell lines. HuCC-T1 and SNU-1079
cells were purchased from the American Type Culture Collection
(ATCC, Rockville, MD, USA) and the Korea Cell Line Bank (Seoul,
Korea), respectively, and JCK cells were a kind gift from D.H. Kim,
from Cheonbuk National University. The cell lines were maintained
in Dulbecco's modified Eagle's medium (DMEM; Sigma-Aldrich, St.
Louis, MO, USA) containing 10% heat-inactivated fetal bovine serum
(FBS; Sigma-Aldrich), 100 U/ml potassium penicillin
(Sigma-Aldrich), 100 g/ml streptomycin, 2 mM glutamine
(Sigma-Aldrich) and 20 mM sodium bicarbonate (Sigma-Aldrich). The
cells were incubated with 5% CO2 in 95% humidity in a
37°C chamber. The growth medium was changed every 3 days.
Real-time quantitative polymerase
chain reaction (RT-qPCR)
Total RNA was isolated using the RNase Mini kit
(Qiagen, Inc., Valencia, CA, USA). Residual DNA was removed using
an RNase free DNase kit (Qiagen, Inc.). Applied Biosystems™
High-Capacity RNA-to-cDNA kit (Thermo Fisher Scientific, Inc.,
Waltham, MA, USA) was used to reverse-transcribe 1 µg RNA into
cDNA, according to the manufacturer's instructions. RT-qPCR was
performed using specific primers to quantify gene expression using
Applied Biosystems™ SYBR Green RT-PCR reagents (Thermo Fisher
Scientific, Inc.).
The relative amount of mRNA was normalized to the
expression of actin. The primer sequences used in this study were
as follows: Actin: Forward, 5′-GTTGTCGACGACGAGCG-3′ and reverse,
5′-GCACAGAGCCTCGCCTT-3′; zonula occludens (ZO-1): Forward,
5′-CCCCACTCTGAAAATGAGGA-3′ and reverse, 5′-GGGAACAACATACAGTGACGC-3;
E-cadherin: Forward, 5′-TTCTGCTGCTCTTGCTGTTT-3′ and reverse,
5′-TGGCTCAAGTCAAAGTCCTG-3; and vimentin: Forward,
5′-GCCCTTAAAGGAACCAATGA-3′ and reverse, 5′-AGCTTCAACGGCAAAGTTCT-3′.
The PCR reactions were repeated three times in three independent
experiments. The expression of ZO-1 was determined for SNU-1079
cells.
Western blot analysis
Total protein was extracted, and the protein
concentration was measured using the Bradford DC protein assay
(Bio-Rad Laboratories, Inc., Hercules, CA, USA). Subsequently,
20–40 µg protein from each sample was separated using 12% Bis-Tris
polyacrylamide gel electrophoresis and blotted onto Immobilon
transfer membranes (EMD Millipore, Billerica, MA, USA). The blots
were immunostained with E-cadherin (1:100; cat. no. 701134;
Invitrogen; Thermo Fisher Scientific), ZO-1 (1:200; cat. no.
61-7300; Zymed Laboratories®; Thermo Fisher Scientific)
and vimentin (1:200; cat. no. V2258; Sigma-Aldrich; Merck KGaA,
Darmstadt, Germany) primary antibodies at 4°C overnight, followed
by incubation with the secondary antibody at room temperature for 1
h. The expression of ZO-1 was determined for SNU-1079 cells. The
proteins were visualized using enhanced chemiluminescence (ECL)
with Plus Western Blotting Detection reagents (iNtRon
Biotechnology, Daejeon, Korea), followed by exposure to X-ray film
(LAS-3000 mini; Fuji Film, Tokyo, Japan).
Immunofluorescence microscopy
For the immunofluorescence microscopy analysis, the
CCA cell lines were seeded on individual sterile coverslips placed
in the wells of 4-well plates and incubated for 24 h. Subsequently,
the cells were treated with 200 nM TSA or 0.5 mM VPA diluted in
DMEM with 1% FBS for 48 h. After washing the cells with PBS, they
were fixed in 3.7% paraformaldehyde for 20 min at room temperature.
The paraformaldehyde was removed, the cells were washed with PBS,
incubated with blocking solution for 30 min to prevent non-specific
binding, and then incubated with anti-E-cadherin (1:100; cat. no.
14472; Cell Signaling Technology, Inc., Danvers, MA, USA), anti
ZO-1 (1:200; Zymed Laboratories®; Thermo Fisher
Scientific, Inc.) and anti-vimentin (1:200; cat. no. VIM-572-L-CE;
Leica Microsystems, Wetzlar, Germany) primary antibodies overnight
at 4°C on a rocking platform. The expression of ZO-1 was determined
for SNU-1079 cells. The washed slides were incubated for 1 h at
room temperature with 1:100 dilutions of Alexa-488 anti-rabbit IgG
(H+L) and Alexa-568 goat anti-mouse IgG (H+L) secondary antibodies
(both from Molecular Probes Inc.; Thermo Fisher Scientific). The
cells were washed again, mounted with Dako Vectashield mounting
medium (Agilent Technologies, Inc., Santa Clara, CA, USA), and
examined using a Leica Zeiss optics microscope at the Core Facility
of Chungbuk National University.
Cell invasion and migration
assays
We performed cell invasion and migration assays
using HuCC-T1 cells. Briefly, HuCC-T1 cells were seeded in 96-well
plates over a homogeneous, thin layer of fibronectin (BD
Biosciences, Bedford, MA, USA) in Millicell cell culture inserts
(EMD Millipore, Billerica, MA, USA) containing polycarbonate filter
membranes with 8-µm diameter pores. The invasion assay was
performed using Transwell chambers coated with Matrigel prior to
cell seeding. Control group tumor cells were maintained in DMEM
supplemented with 1% FBS and 1% antibiotics, and the cells in the
HDAC inhibitor group were treated with 50 nM GEM, 200 nM TSA, or
0.5 mM VPA diluted in the medium. The lower chamber contained DMEM
supplemented with 10% FBS and 1% antibiotics. After plating, cells
were incubated for 24 h at 37°C in a 5% CO2-humidified
incubator. Invasive cells in the lower chamber were stained with
hematoxylin and eosin (H&E). Images were acquired using a
QImaging ExiAqua monochrome digital camera attached to a Nikon
Eclipse 80i Microscope (Nikon, Melville, NY, USA) and visualized
using the QCapture Pro software (pro 5.1; QImaging Corp., Surrey,
BC, Canada). HuCC-T1 cells were allowed to grow in DMEM containing
10% FBS confluently in a 6-well plate. A central linear wound was
made with a 200-ml sterile pipette tip and then the cells were
washed twice with PBS. Afterwards, the HDAC inhibitor group was
treated with 50 nM GEM, 200 nM TSA, or 0.5 mM VPA diluted in the
medium with 1% FBS. Plates were photographed after 0, 24 and 48
h.
Cytotoxicity assay
Cell viability was assessed using the Promega cell
proliferation
3-(4,5-dimethylthiazol-2-yl)-5-(3-carboxymethoxyphenyl)-2-(4-sulfophenyl)-2H-tetrazolium
(MTS) assay kit (Promega, Madison, WI, USA). Briefly, HuCC-T1 cells
were seeded in 96-well plates at a density of 1×10³ per
well and incubated with increasing concentrations of TSA, VPA, and
GEM for 48 h, and concentration-response curves were calculated.
Subsequently, dead cells were washed away, and the attached cells
were incubated with MTS, followed by cell viability detection using
microplate reader Model-680 (Bio-Rad Laboratories). All experiments
were performed in triplicate.
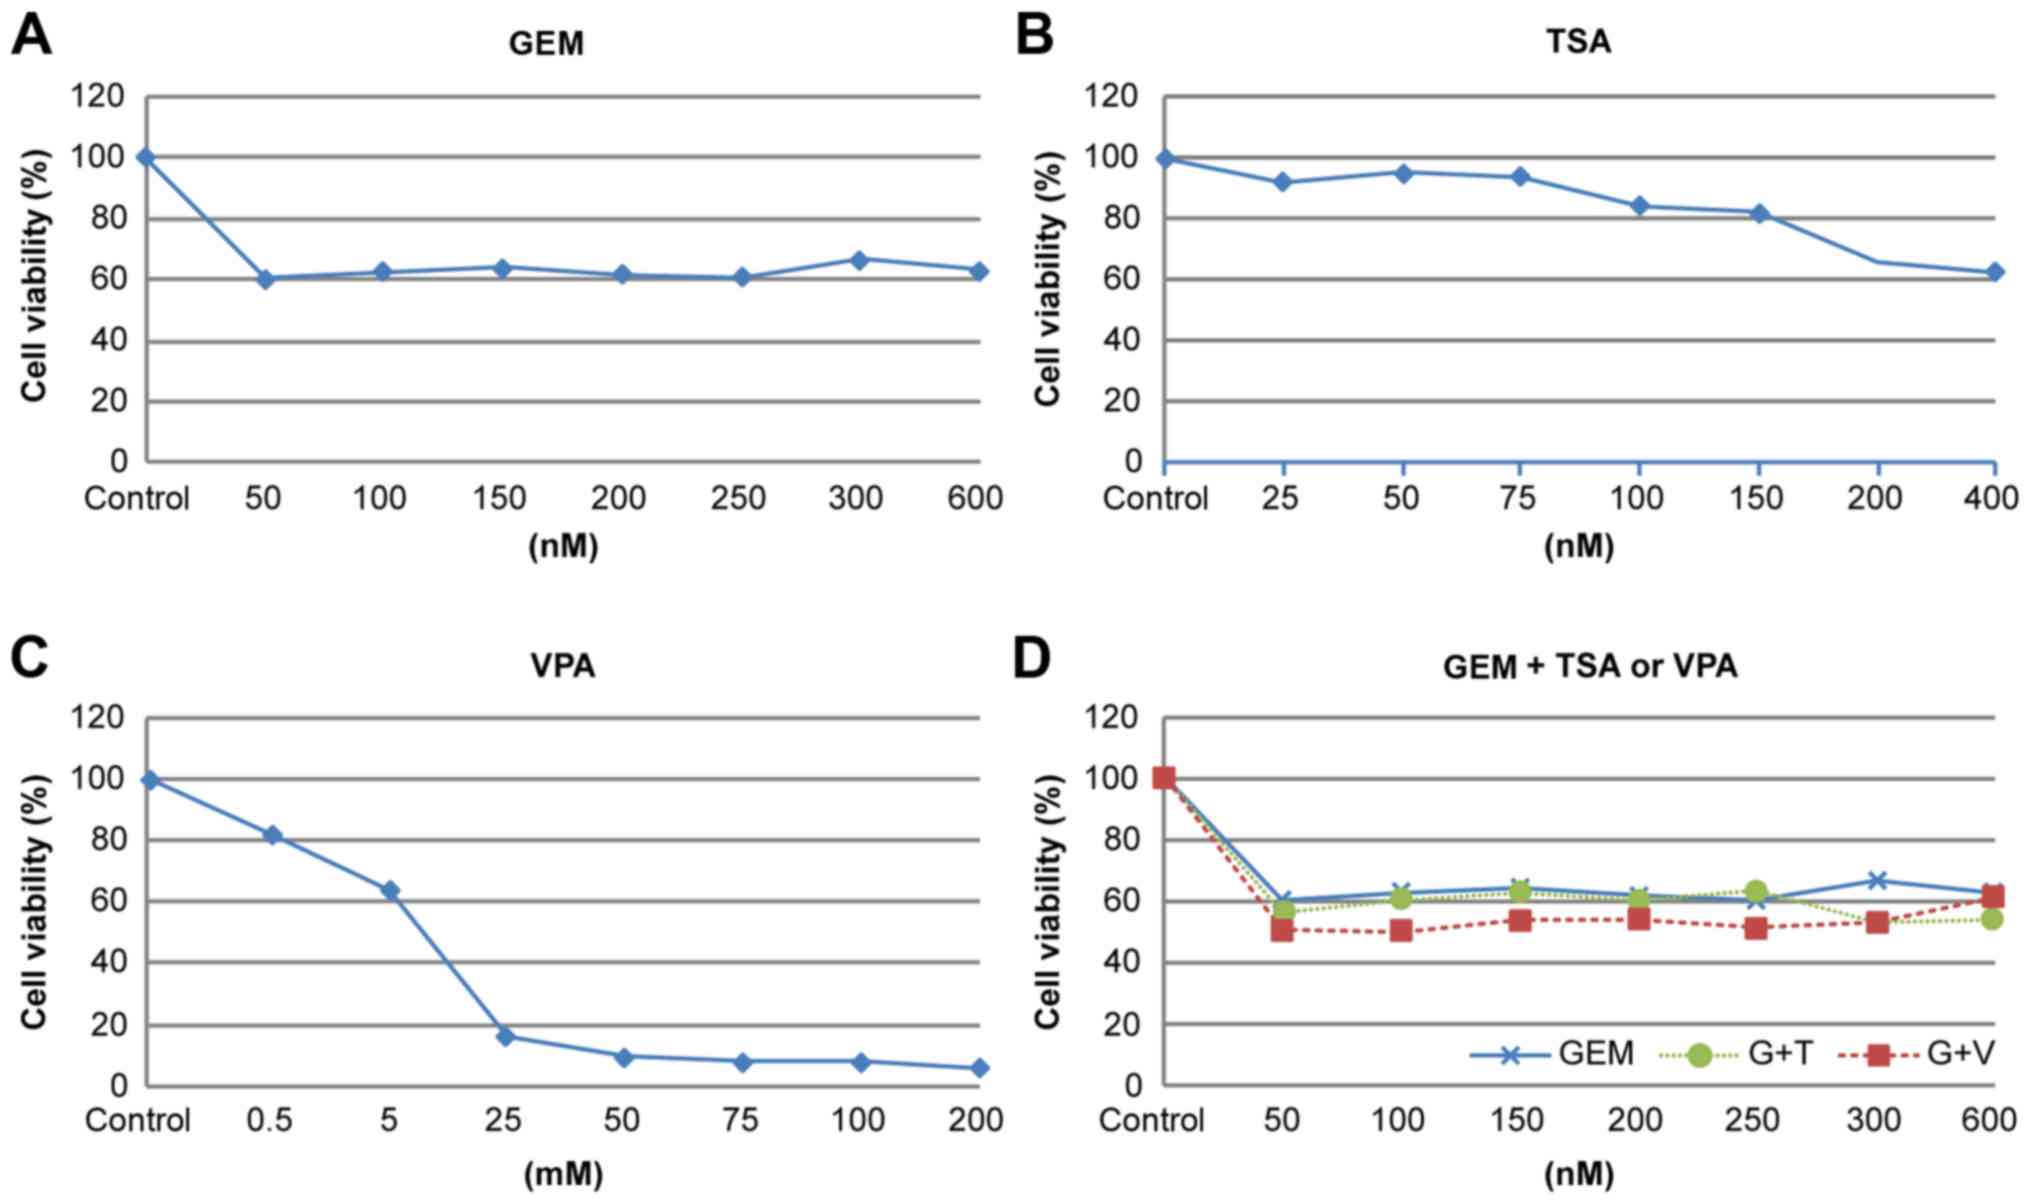
We performed a cytotoxicity assay for gemcitabine,
TSA, and VPA for the three CCA cell lines. For gemcitabine and TSA
we selected concentrations that inhibit cell proliferation by
0–20%. For valproic acid, we selected a tolerable toxicity to
humans, <0.5 mM.
Statistical analysis
Data were analyzed with SPSS software version 18.0
(SPSS Inc., Chicago, IL, USA). Continuous variables are presented
as means ± standard deviation and were compared between the groups
by one-way analysis of variance (ANOVA) followed by Turkey's
multiple comparison tests. Differences with P-values <0.05 were
considered significant.
Results
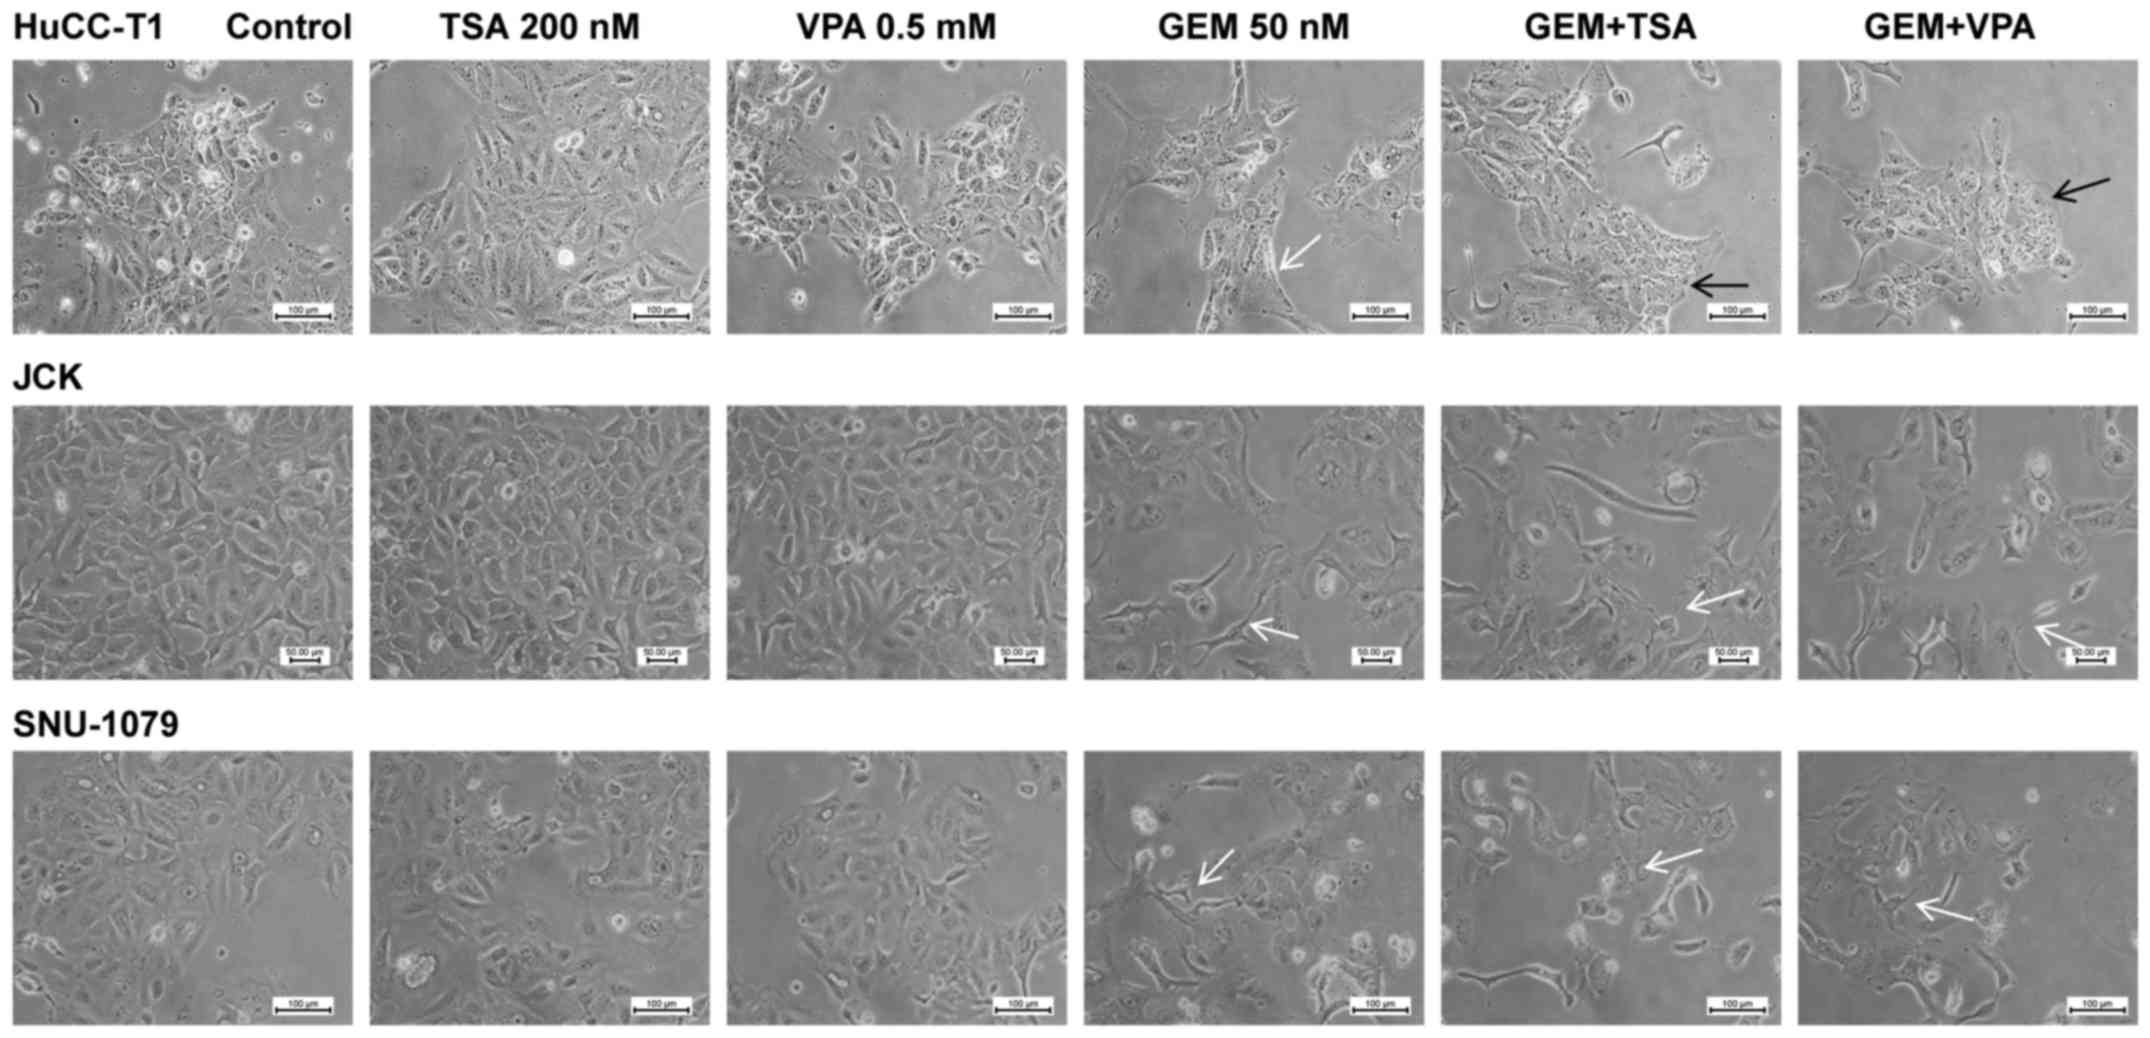
Cell morphology
Morphological changes were most prominent in the
HuCC-T1 cells, which were elongated following treatment with GEM
alone. Notably, after co-treatment with GEM and TSA or VPA the
cells reverted to a rectangular shape. JCK and SNU-1079 cells
treated with GEM exhibited a spindle-shaped morphology. However,
co-treatment with GEM and TSA or VPA did not show an additive
effect (Fig. 1).
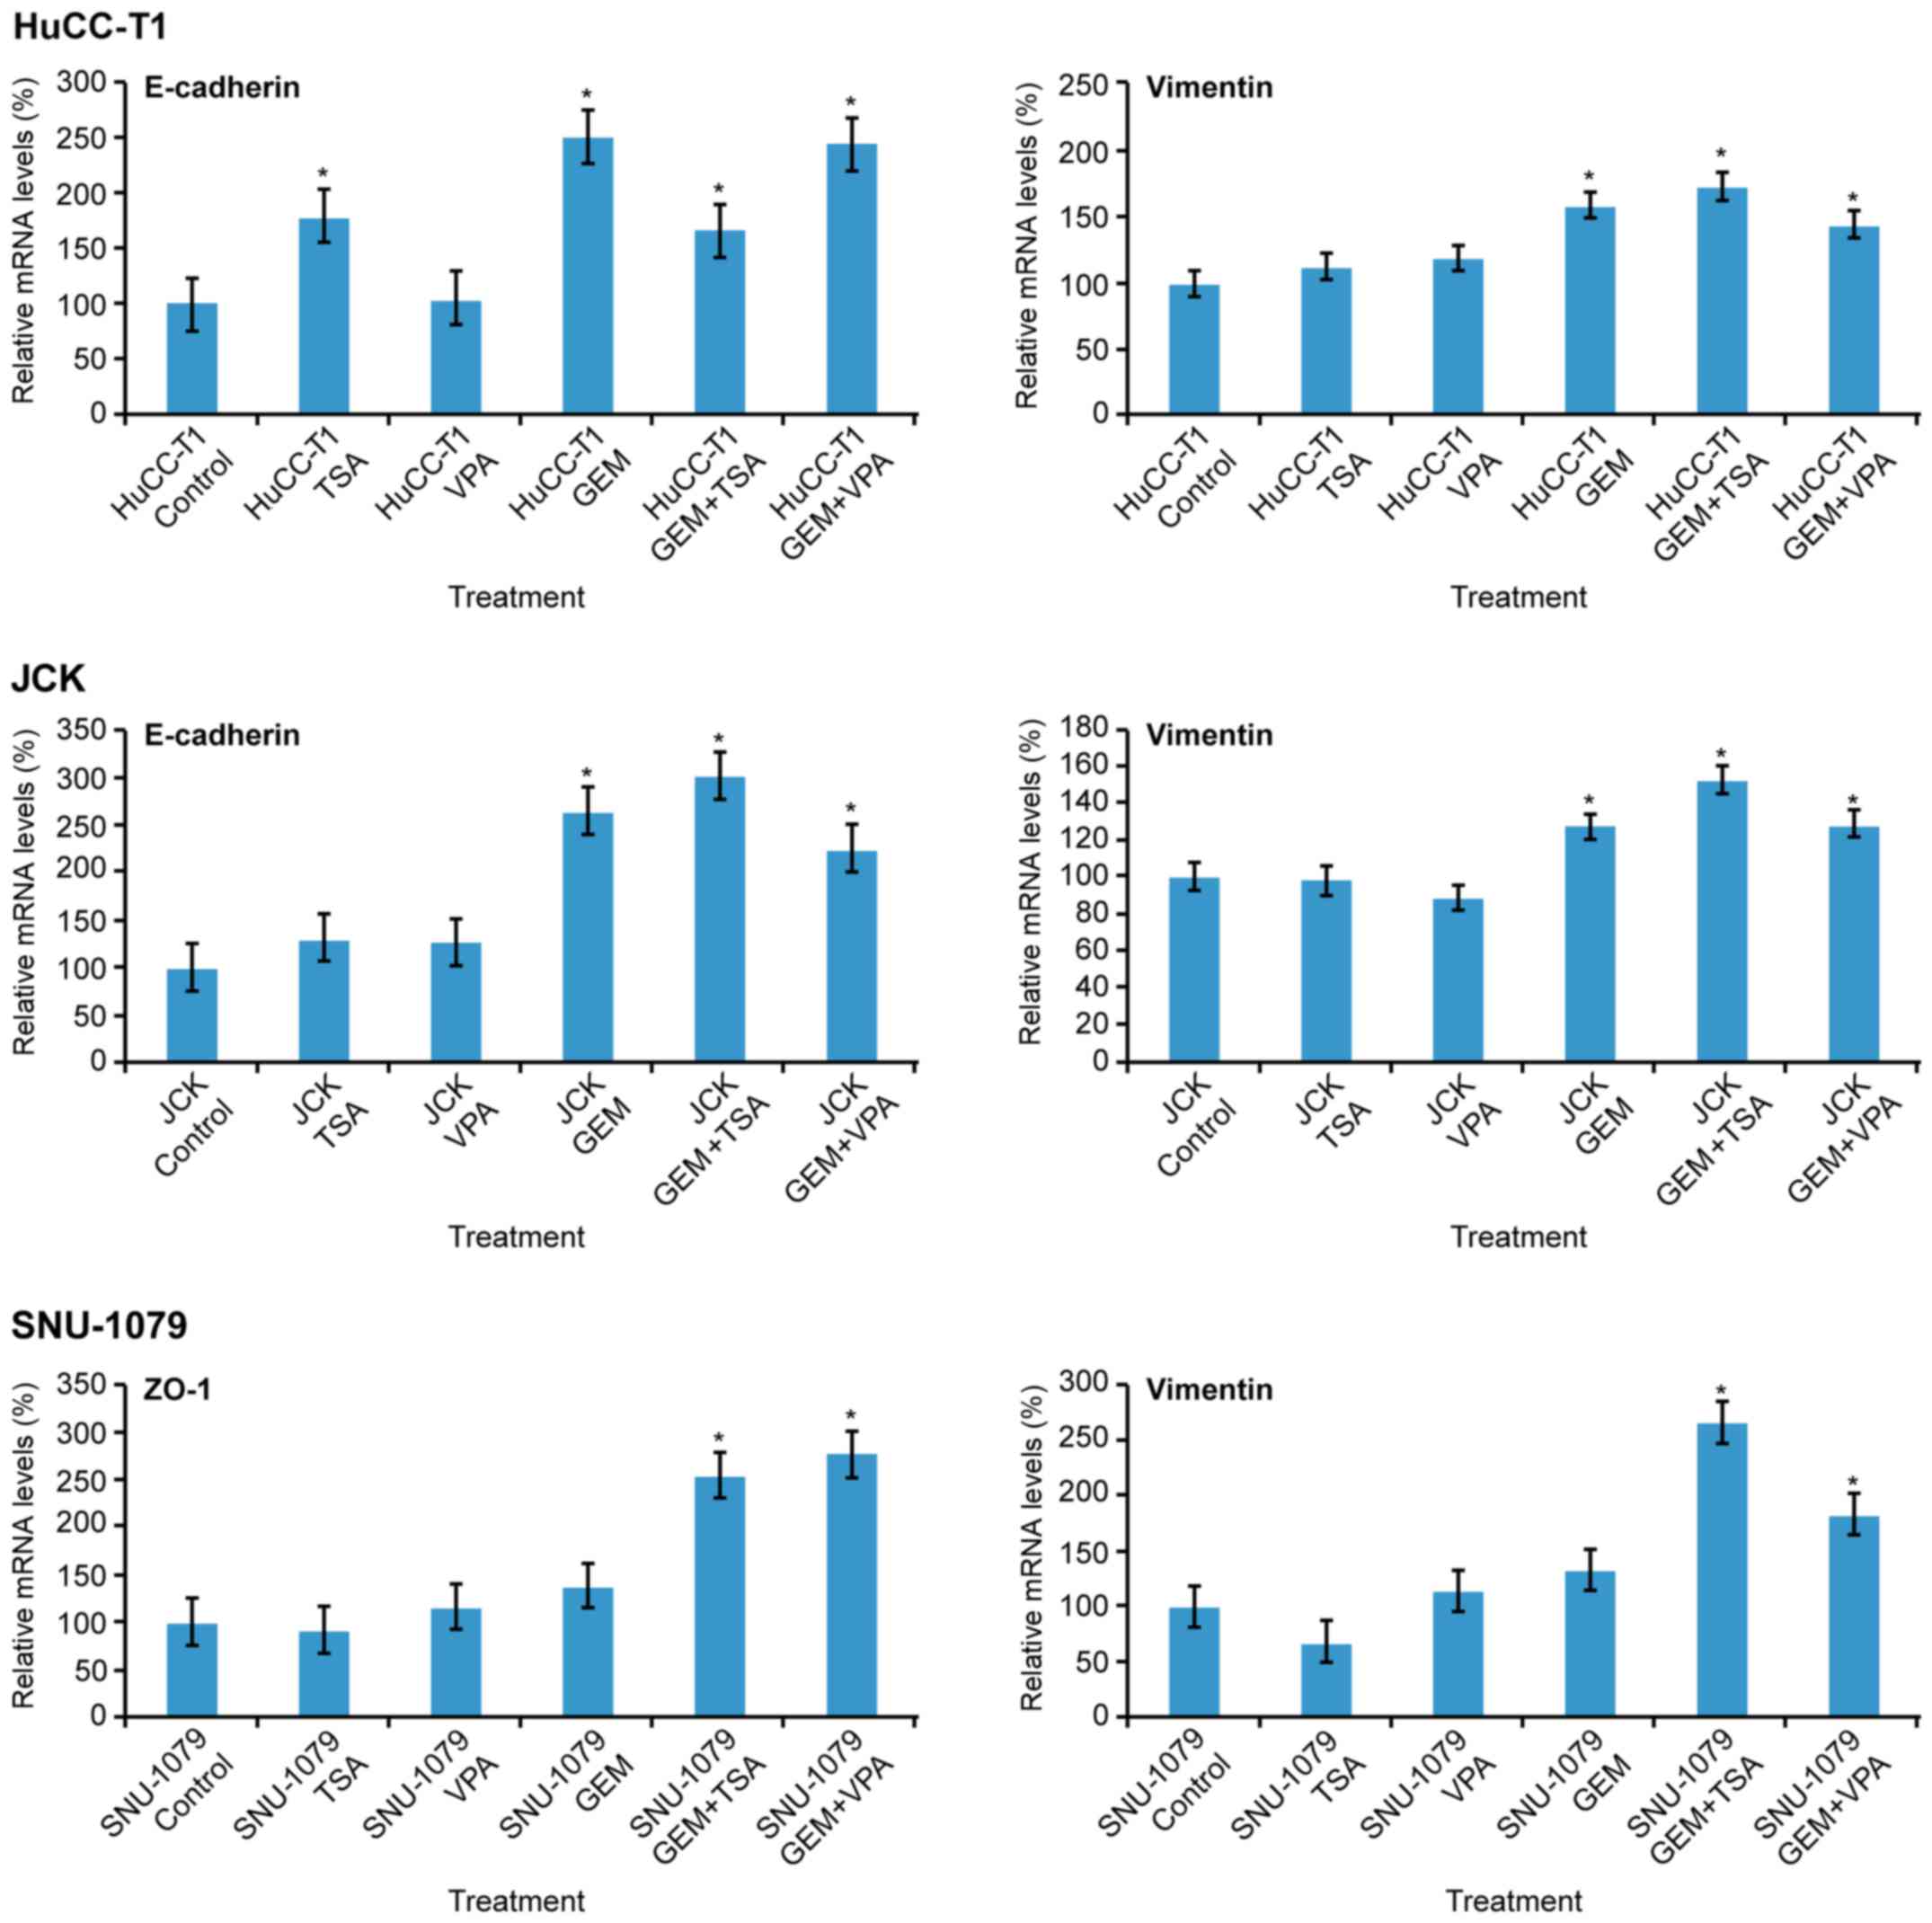
mRNA expression of E-cadherin (or
ZO-1) and vimentin
In the HuCC-T1 cells, mRNA expression of E-cadherin
increased following treatment with TSA, GEM, and co-treatment with
GEM and TSA or VPA. In JCK cells, expression of E-cadherin was
increased by GEM and co-treatment with GEM and TSA or VPA. In
SNU-1079 cells, mRNA levels of ZO-1 were increased by co-treatment
with GEM and TSA or VPA. Vimentin levels were increased by GEM and
TSA or VPA in all three cell lines. Co-treatment with GEM and TSA
augmented vimentin expression compared to GEM treatment alone in
all three cell lines (Fig. 2).
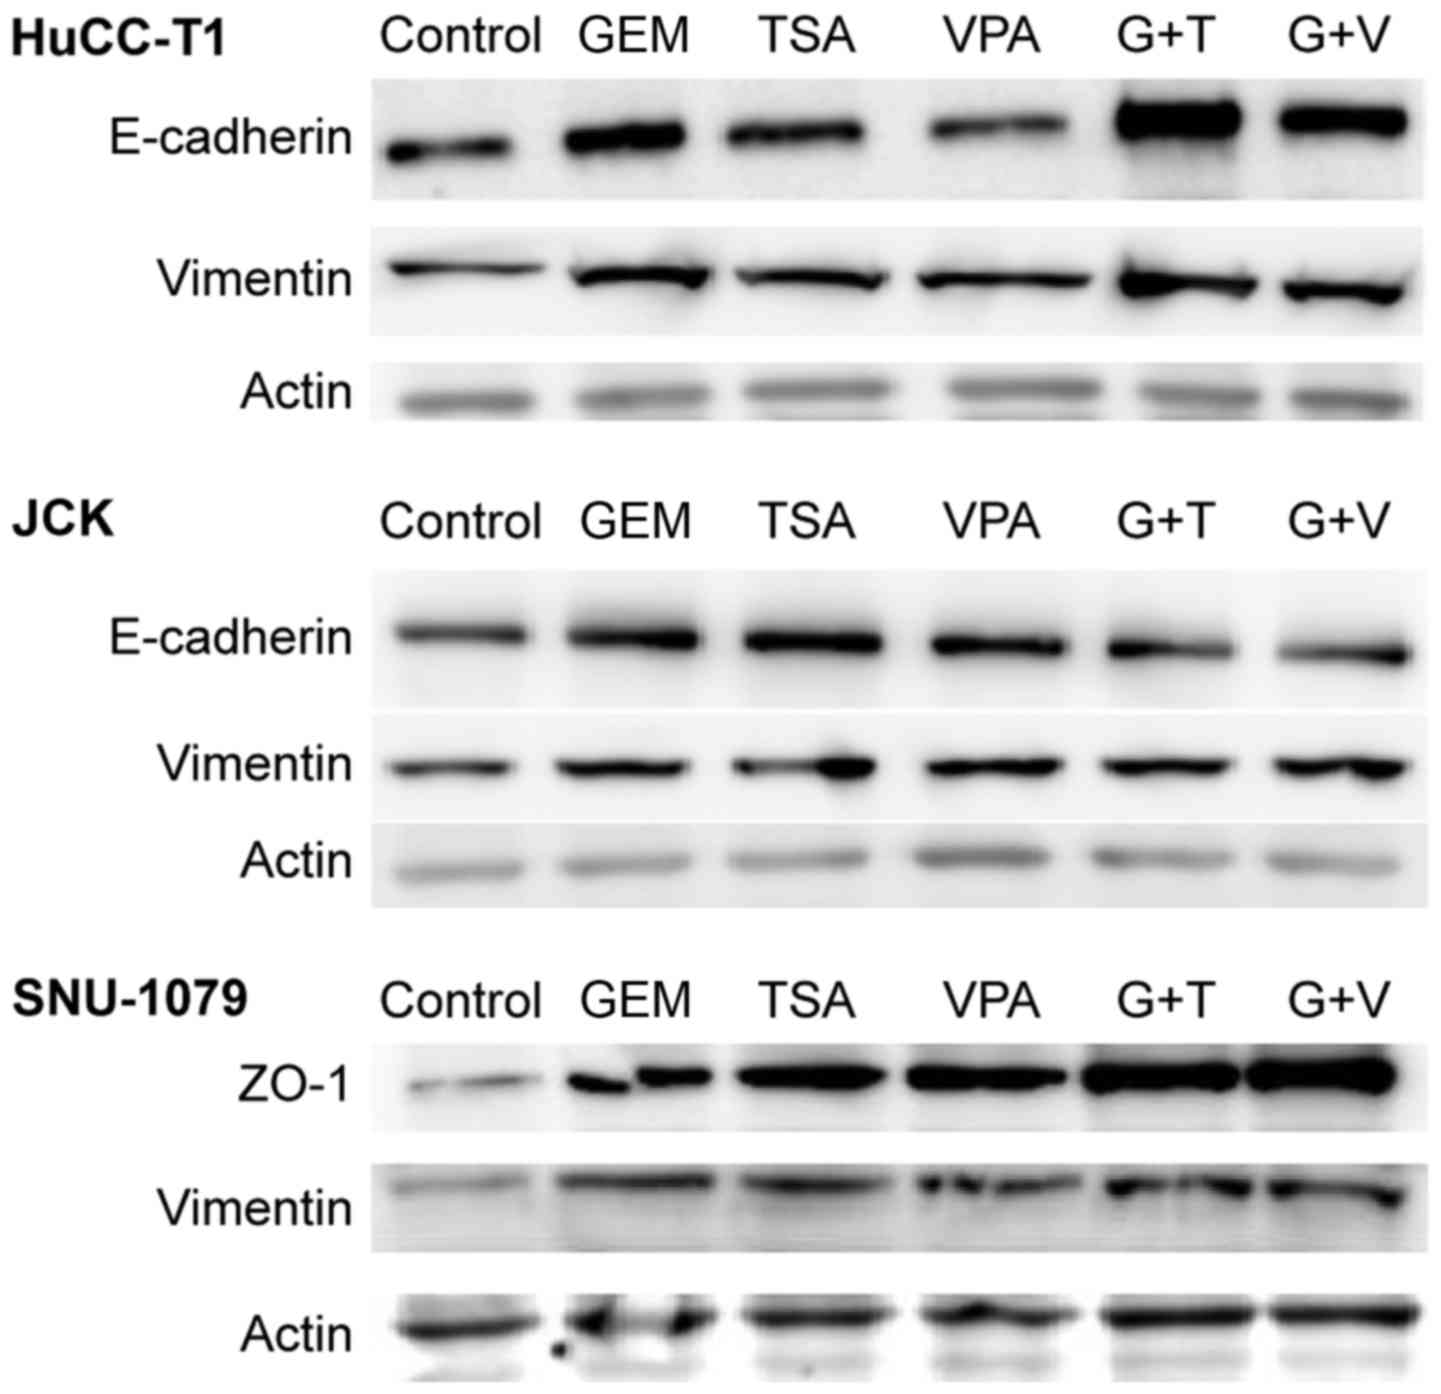
Protein expression of E-cadherin (or
ZO-1) and vimentin
In HuCC-T1 cells, expression of E-cadherin increased
in the presence of TSA or GEM, compared to levels in the control
cells. Co-treatment of cells with GEM and TSA increased the
expression of E-cadherin more than treatment with GEM alone.
However, VPA did not induce any change. In JCK cells, treatment
with GEM, TSA and VPA increased the expression of E-cadherin
compared to that in the control cells. Notably, compared to the
cells treated with GEM alone, expression of E-cadherin did not
increase when cells were co-treated with GEM and TSA or VPA. In
SNU-1079 cells, treatment with GEM, TSA and VPA increased
expression of ZO-1 compared to that in the control cells.
Furthermore, cells co-treated with GEM and TSA or VPA showed higher
expression levels of ZO-1 than cells treated with GEM alone. The
expression of vimentin slightly increased in all three cell lines
following co-treatment with GEM and TSA or VPA, as well as with GEM
alone (Fig. 3). Immunofluorescent
staining revealed that E-cadherin or ZO-1 expression in the
membranes of HuCC-T1, J-CK, and SNU 1079 cells was increased by
treatment with TSA or VPA and GEM compared with GEM treatment
alone. However, vimentin expression in the cytoplasm was also
increased in all three CCA cell lines (Fig. 4).
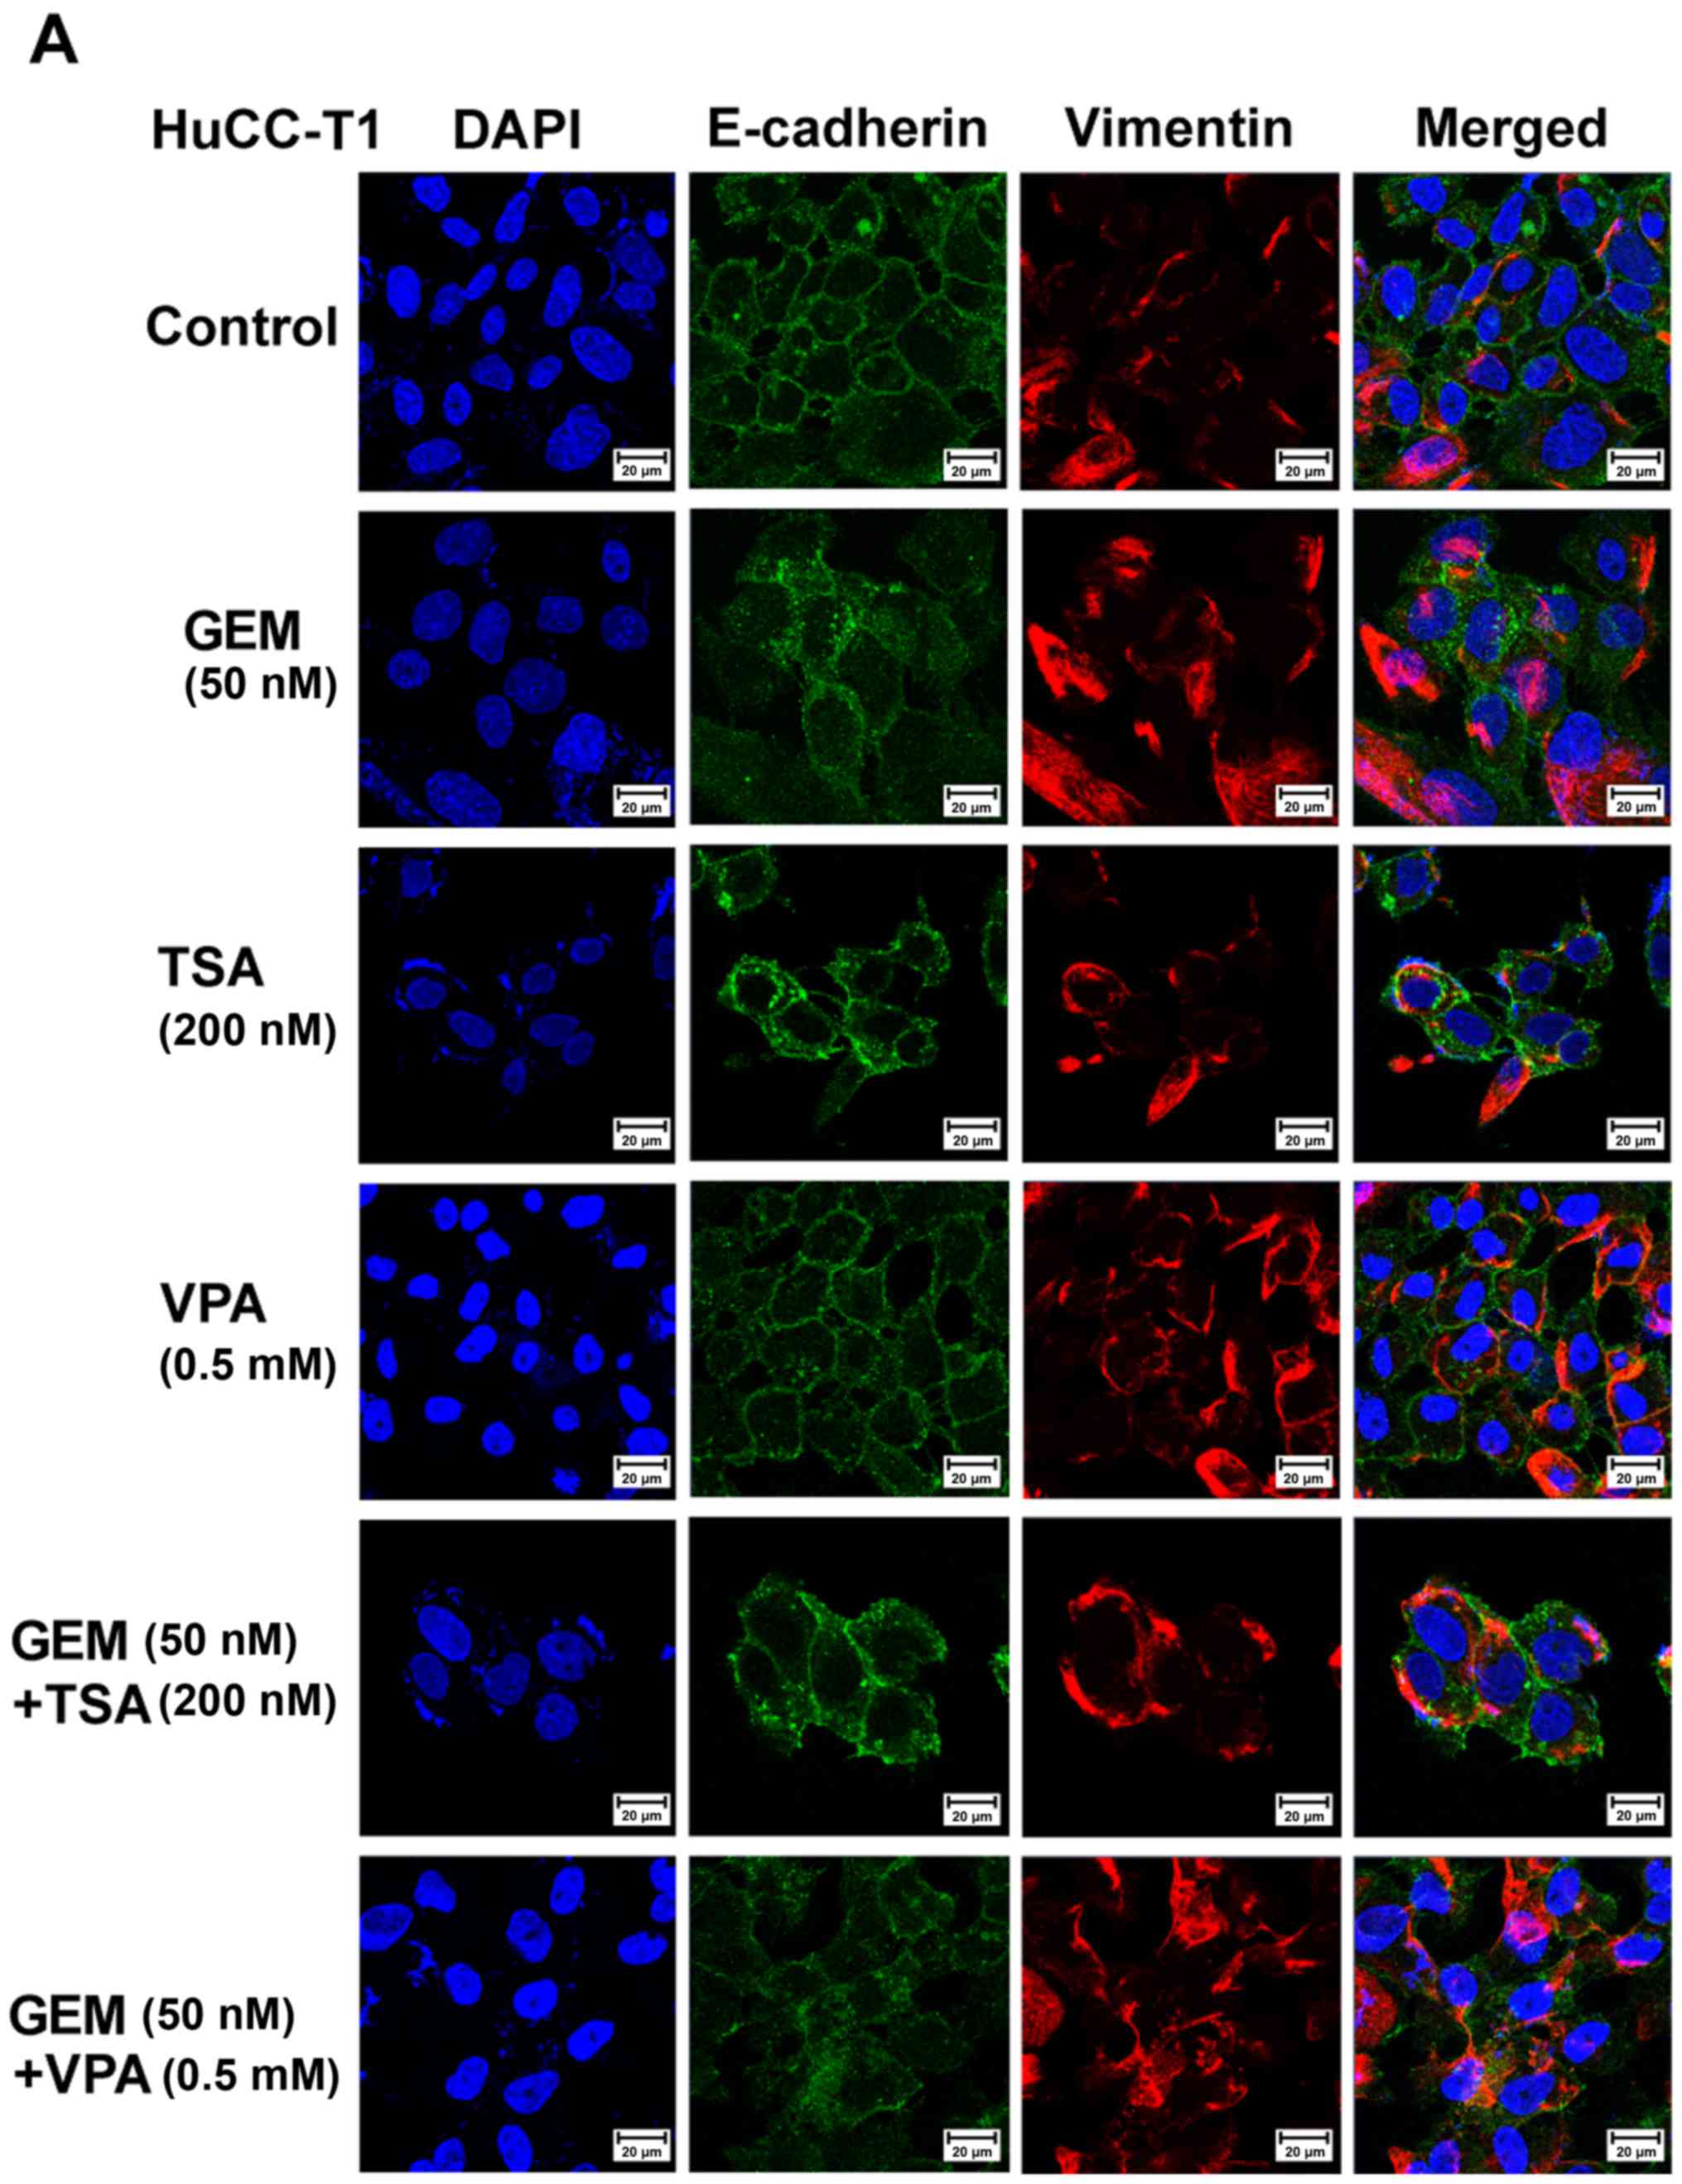 | Figure 4.Immunofluorescence microscopy of
E-cadherin, zonula occludens (ZO)-1 and vimentin in human
cholangiocellular carcinoma (A) HuCC-T1, (B) JCK and (C) SNU-1079
cells. Cholangiocarcinoma cells treated with trichostatin A (TSA,
200 nM) or valproic acid (VPA, 0.5 mM) alone or with gemcitabine
(GEM, 50 nM) exhibited increased E-cadherin expression in the
HuCC-T1 and JCK cells, ZO-1 in SNU-1079, and vimentin in all cell
lines compared to the control cells. E-cadherin or ZO-1 (green),
vimentin (red), 4′,6-diamidino-2-phenylindole (DAPI, blue), and
merged images (original magnification, ×400). |
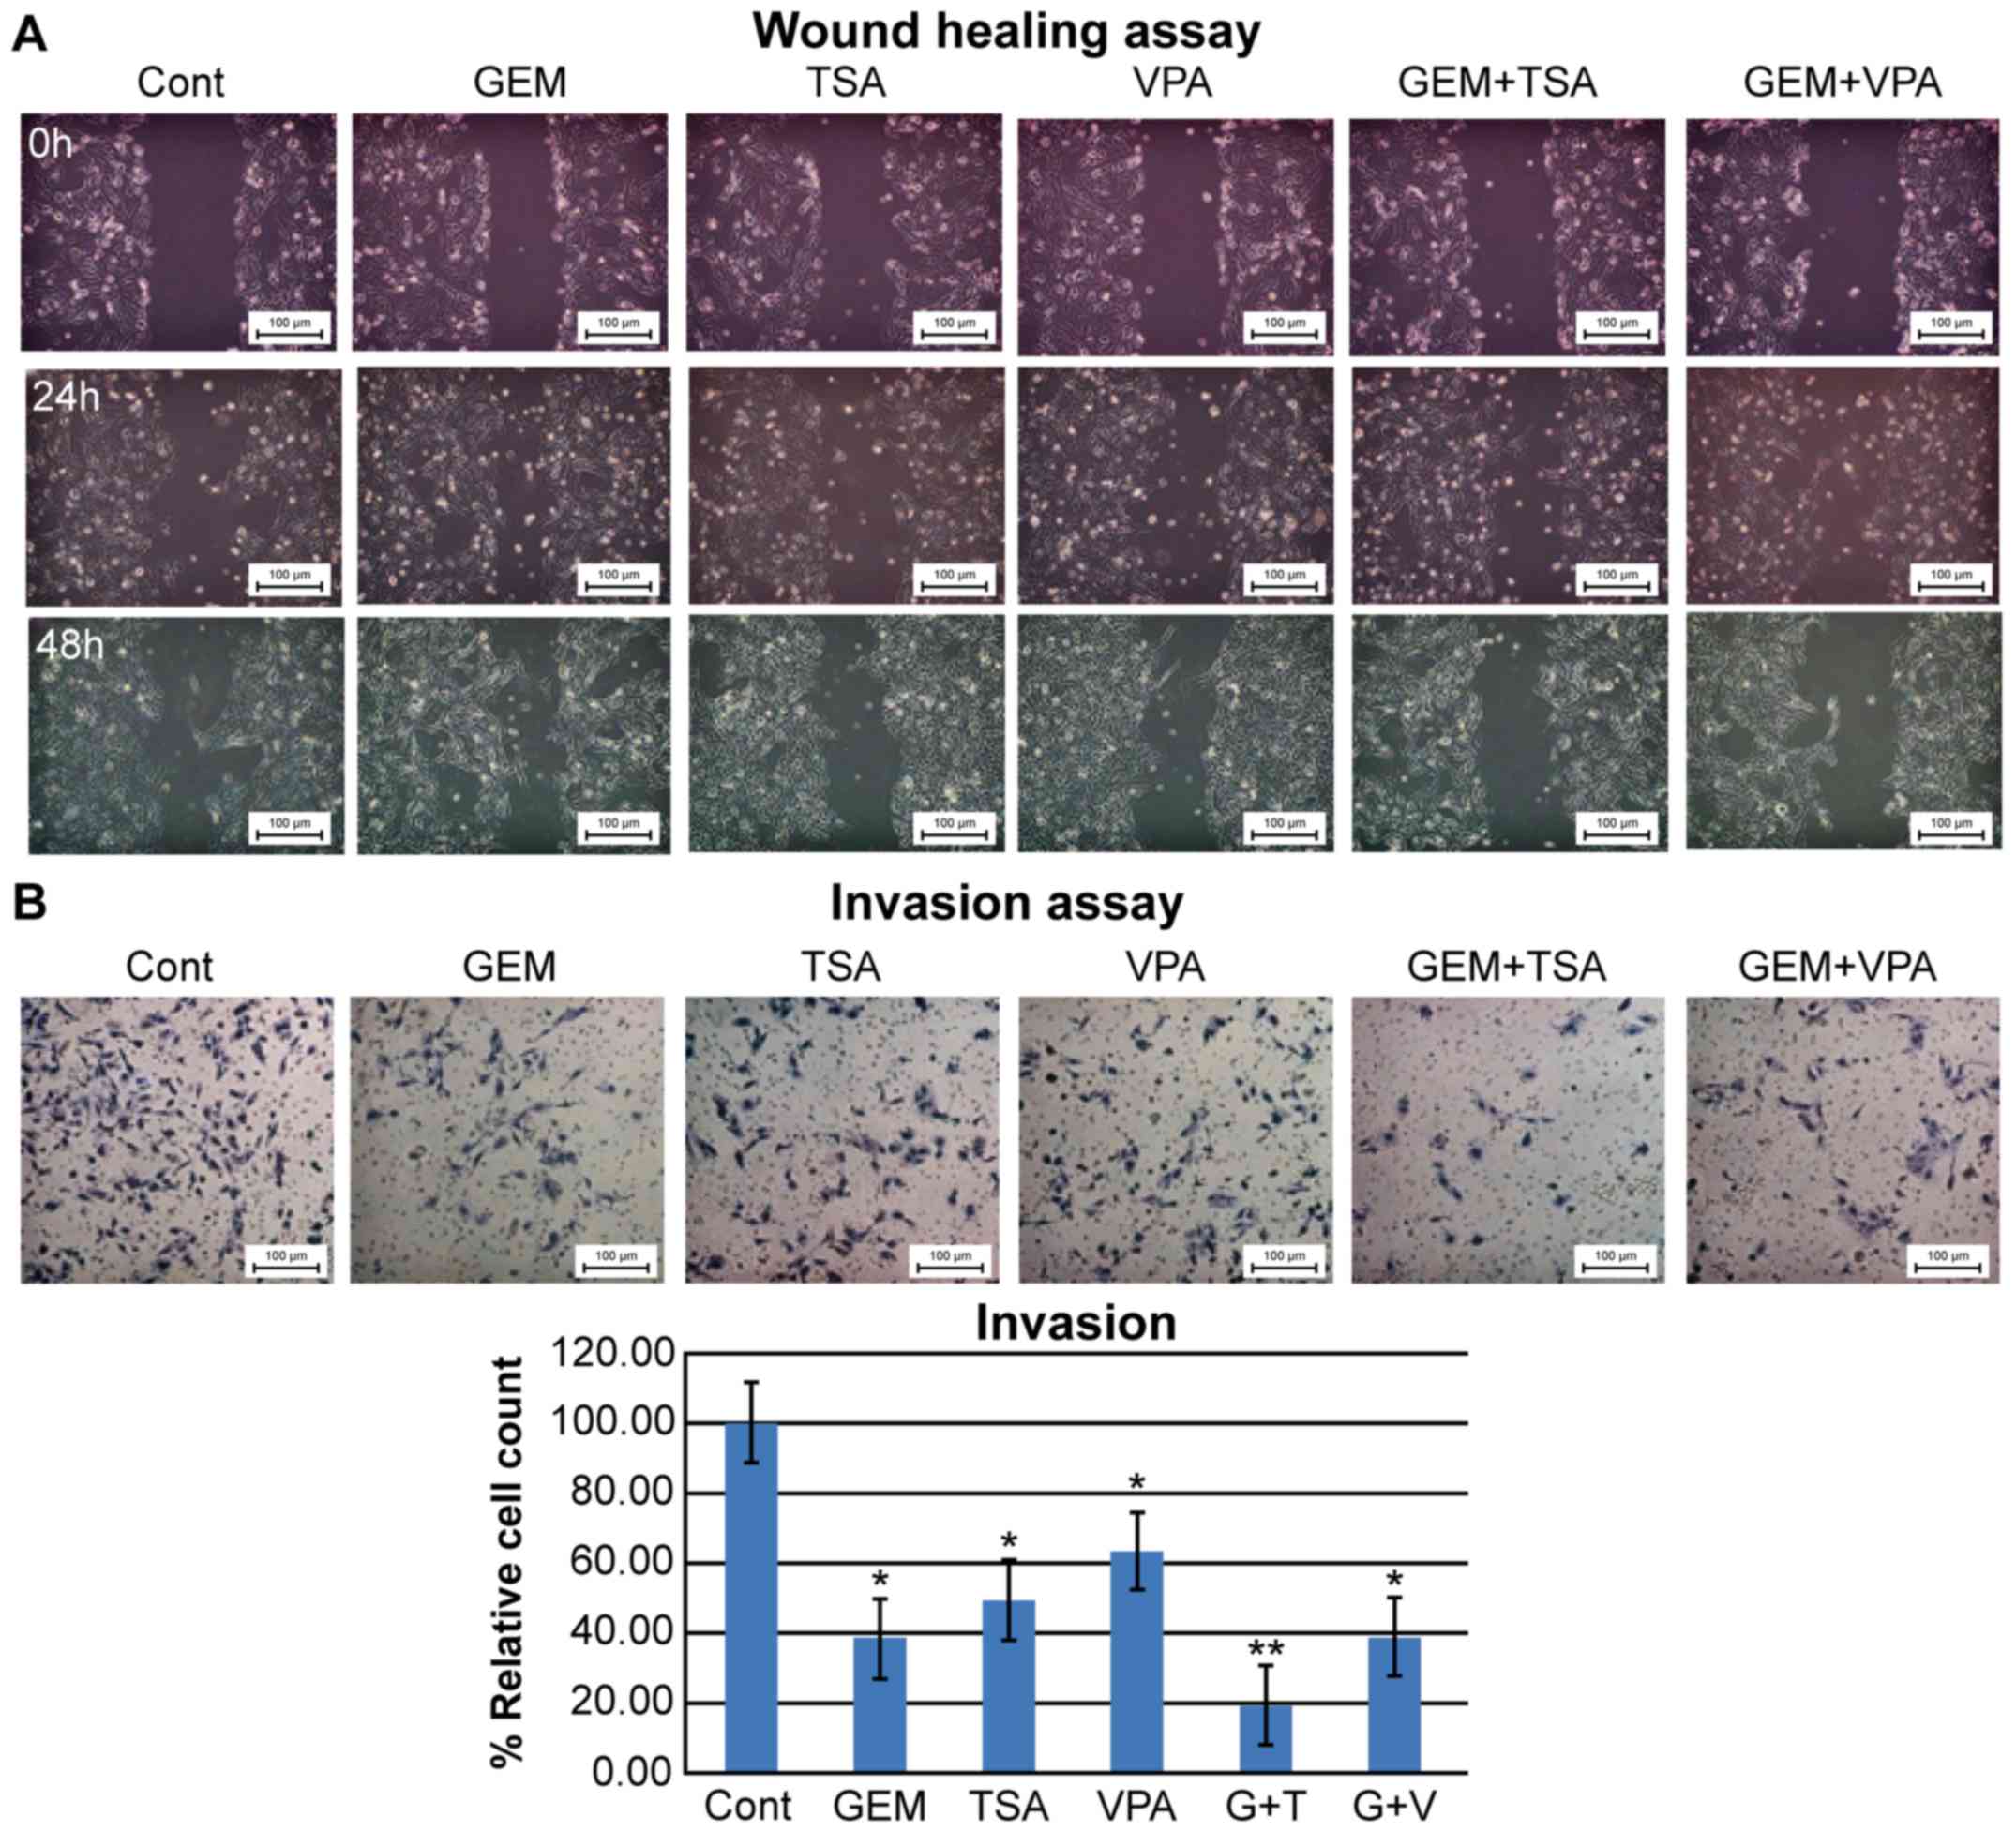
Migration and invasion assays
The migration assays after treatment of HuCC-T1
cells with GEM alone showed augmented migration areas, which
decreased in cells co-treated with GEM and TSA or VPA. Treatment
with TSA or VPA alone showed a decrease or no change in the
migration area, respectively (Fig.
5A). The invasion assays showed that cell invasion was
decreased by treatment with GEM, TSA, or VPA. GEM and TSA had an
additive effect on inhibition of cell invasion, whereas GEM and VPA
did not (Fig. 5B).
Cell proliferation
Cell proliferation was assessed in the presence of
single or co-treatment with GEM, TSA, and VPA. We investigated the
potential dose-related response of cells exposed to increasing
concentrations of GEM with or without TSA or VPA. We evaluated the
effects of a fixed concentration of GEM (50 nM) and the HDAC
inhibitors TSA or VPA (200 nM or 0.5 mM, respectively) on EMT, as
these concentrations slightly inhibited cell proliferation
(Fig. 6).
Discussion
This study demonstrated that the HDAC inhibitors,
trichostatin A (TSA) and valproic acid (VPA), increased the
expression levels of both E-cadherin and vimentin but inhibited the
migration and invasion of cholangiocellular carcinoma (CCA) cells,
and this effect was enhanced by co-treatment with the
chemotherapeutic drug gemcitabine (GEM).
Epithelial-mesenchymal transition (EMT), which
confers invasiveness and migratory properties to cells, is the
initial step in carcinogenesis and is associated with poor outcome
and resistance to chemotherapy (24). EMT comprises modifications of gene
expression that permit concurrent epithelial phenotype repression
and mesenchymal phenotype activation. E-cadherin and ZO-1 maintain
cell-to-cell adhesion, and N-cadherin, vimentin, fibronectin,
a-smooth muscle actin, and matrix metalloproteinases constitute
intermediate filaments that are detected in mesenchymal cells.
EMT-inducing transcription factors (EMT-TFs), such as SNAIL, ZEB,
and TWIST, are highly expressed in CCA cells (25). In this study, we selected E-cadherin
as an epithelial marker and vimentin as a mesenchymal cell marker.
We used ZO-1 as an epithelial marker for SNU-1079 cells, in which
E-cadherin is lost owing to hypermethylation (26).
The TGF-β signaling pathway plays a major role in
EMT and increases the expression of Twist, N-cadherin, and vimentin
(27). TSA was found to suppress
TGF-β-induced downregulation of E-cadherin and increase the
expression of DNA binding 2 and bone morphogenic protein-7, which
in turn inhibited TGF-β-induced EMT in human renal epithelial cells
(18). These findings are
consistent with our observation that TSA or VPA upregulated
E-cadherin levels in CCA cells. Specifically, we investigated the
expression of E-cadherin following exposure of cells to HDAC
inhibitors alone or in combination with GEM. Despite some
differences between the cell lines, the expression of E-cadherin
increased following treatment with the HDAC inhibitors, and this
effect was synergistic with GEM.
The human vimentin gene (VIM) includes a TATA
box, eight putative GC-boxes, a nuclear factor (NF)-κB binding
site, a polyoma enhancer activator 3-binding site, and proximal
silencer elements, suggesting that gene regulation of VIM is
associated with various EMT-specific and general transcription
factors (28–31). For example, zinc-finger binding
protein 89 is a negative regulator of vimentin, which recruits
HDAC1 at the VIM promoter. Treatment with TSA releases HDAC1
from the promoter and activates VIM expression (32). Vorinostat, an HDAC inhibitor, was
found to increase the expression and the acetylation of the EMT-TF
Snail and decrease its degradation in nasopharyngeal carcinoma
cells. In turn, Snail increased VIM expression (21). TSA suppressed EMT by upregulating
E-cadherin and downregulating vimentin, by suppressing Slug
expression in colorectal and prostate cancer. Specifically, TSA was
found to increase HDAC1 and 2 on the promoter of Slug,
decreasing the expression of Slug and consequently that of vimentin
(33). Therefore, HDAC inhibitors
have been indicated as both inducers and repressors of vimentin.
The specific effect probably depends on the cell type and the HDAC
inhibitor used.
The present study showed that TSA or VPA increased
not only the expression of E-cadherin but also that of vimentin.
However, the effects on vimentin expression were less than those on
E-cadherin. Therefore, the effect of vimentin has limited action on
cell motility and wound healing potential. This would justify the
reversion to the epithelial phenotype, despite the elevation of
vimentin expression. This study revealed that the invasion and
wound healing abilities of HuCC-T1 were cells decreased following
co-treatment with one of the HDAC inhibitors in addition to GEM,
indicating suppression of EMT. Additionally, HuCC-T1 cell
morphology reverted from an elongated to a rectangular shape after
co-treatment with TSA or VPA in addition to GEM.
Han et al (34) reported that TSA induced a
mesenchymal-like morphology and vimentin expression in human
gastric and breast cancer cells. However, E-cadherin expression was
also increased and the migratory activity was decreased (34). Deprivation of E-cadherin increased
migration and invasion and potentiated the metastatic potential of
vimentin (35). These results
support our findings that the upregulation of E-cadherin suppressed
migration and invasion ability.
Some studies indicate that HDAC inhibitors induce
EMT (19,22). Our previous study revealed that HDAC
inhibitors induced EMT by decreasing E-cadherin through its
translocation into the nucleus and potentiated the effect of
TGF-β-induced EMT of colon cancer cells (22). Another study reported that TSA and
SAHA induced EMT by upregulating mesenchymal markers (vimentin,
N-cadherin, and fibronectin) and stem cell markers [sex determining
region Y-box 2 (Sox-2) and Nanog] through the activation of EMT-TFs
(Zeb1, Zeb2, and Slug) in prostate cancer cells (19). In contrast, a different study
indicated that vorinostat inhibited TGF-b1/Smad signaling and
increased the expression of the cadherin-1 gene (CDH1) in
biliary cancer cells (23). The
authors suggested that vorinostat is associated with the
downregulation of mesenchymal markers such as Snail, Zeb, and
Twist, indicating the suppression of EMT (23). These discrepant results may have
originated from the differential effect of HDAC inhibitors on the
various cell types and the expression pattern of the HDACs, as well
as the type of HDAC inhibitor and its dose. Other factors that
could be implicated include non-histone proteins that may act as
substrates of HDACs including transcription factors, transcription
regulators and signal mediators (36). Therefore, the effect of HDAC
inhibitors might be associated with multiple pathways that are
directly or indirectly regulated by HDACs.
Co-treatment with HDAC inhibitors and conventional
chemotherapy has been reported to exert a synergistic effect on
cancer cell proliferation (37).
Although the combination of HDAC inhibitors and chemotherapeutic
agents has been shown to be effective, the results of the
co-treatment vary in effectiveness according to the type of HDAC
inhibitor, the particular chemotherapeutic agent, the specific
tumor type, and the genetic alterations of the tumor. The
mechanisms by which HDAC inhibitors potentiate the effect of
chemotherapeutics in specific disease are largely unknown. A
plausible mechanism is that the HDAC inhibitor-mediated DNA
decondensation increases chromatin accessibility and subsequently
facilitates access of DNA-damaging agents to their substrate.
Alternatively, chemotherapeutic agents may alter EMT-TFs and
EMT-related signaling pathways, thereby potentiating the
effectiveness of HDAC inhibitors. A recent study reported that
co-treatment with vorinostat and GEM improved the survival time in
a GEM-resistant xenograft mouse model (23). In this study, TSA or VPA showed
limited suppression of GEM-induced EMT in CCA cells.
In conclusion, we suggest that TSA and VPA in
combination with GEM suppressed the migration and invasion of CCA
cells, with tolerable cytotoxicity. However, these HDAC inhibitors
augmented both E-cadherin and vimentin expression, and the effects
were variable in CCA cells. Therefore, the clinical application of
HDAC inhibitors in the treatment of biliary cancer should be
considered with caution.
Acknowledgements
Not applicable.
Funding
The present study was supported by a grant from the
National R&D Program for Cancer Control, Ministry of Health and
Welfare, Republic of Korea (no. 1120330).
Availability of data and materials
The datasets used during the present study are
available from the corresponding author upon reasonable
request.
Authors' contributions
JHW and SMP designed this study and wrote the
manuscript. EJL and MJ performed experiments and interpreted the
results. SMP reviewed and edited the manuscript. All authors read
and approved the manuscript and agree to be accountable for all
aspects of the research in ensuring that the accuracy or integrity
of any part of the work are appropriately investigated and
resolved.
Ethics approval and consent to
participate
Not applicable.
Consent for publication
Not applicable.
Competing interests
The authors declare that they have no competing
interests.
Glossary
Abbreviations
Abbreviations:
|
CCA
|
cholangiocellular carcinoma
|
|
EMT
|
epithelial-mesenchymal transition
|
|
GEM
|
gemcitabine
|
|
HDAC
|
histone deacetylase inhibitor
|
|
TSA
|
trichostatin A
|
|
VPA
|
valproic acid
|
References
|
1
|
Hezel AF and Zhu AX: Systemic therapy for
biliary tract cancers. Oncologist. 13:415–423. 2008. View Article : Google Scholar : PubMed/NCBI
|
|
2
|
Limpaiboon T: Epigenetic aberrations in
cholangiocarcinoma: Potential biomarkers and promising target for
novel therapeutic strategies. Asian Pac J Cancer Prev. 13
Suppl:41–45. 2012.PubMed/NCBI
|
|
3
|
Ropero S and Esteller M: The role of
histone deacetylases (HDACs) in human cancer. Mol Oncol. 1:19–25.
2007. View Article : Google Scholar : PubMed/NCBI
|
|
4
|
Marchion D and Münster P: Development of
histone deacetylase inhibitors for cancer treatment. Expert Rev
Anticancer Ther. 7:583–598. 2007. View Article : Google Scholar : PubMed/NCBI
|
|
5
|
Xu LN, Wang X and Zou SQ: Effect of
histone deacetylase inhibitor on proliferation of biliary tract
cancer cell lines. World J Gastroenterol. 14:2578–2581. 2008.
View Article : Google Scholar : PubMed/NCBI
|
|
6
|
Sriraksa R and Limpaiboon T: Histone
deacetylases and their inhibitors as potential therapeutic drugs
for cholangiocarcinoma-cell line findings. Asian Pac J Cancer Prev.
14:2503–2508. 2013. View Article : Google Scholar : PubMed/NCBI
|
|
7
|
Iwahashi S, Ishibashi H, Utsunomiya T,
Morine Y, Ochir TL, Hanaoka J, Mori H, Ikemoto T, Imura S and
Shimada M: Effect of histone deacetylase inhibitor in combination
with 5-fluorouracil on pancreas cancer and cholangiocarcinoma cell
lines. J Med Invest. 58:106–109. 2011. View Article : Google Scholar : PubMed/NCBI
|
|
8
|
Kalluri R and Weinberg RA: The basics of
epithelial-mesenchymal transition. J Clin Invest. 119:1420–1428.
2009. View
Article : Google Scholar : PubMed/NCBI
|
|
9
|
Vleminckx K, Vakaet L Jr, Marreel M, Fiers
W and van Roy F: Genetic manipulation of E-cadherin expression by
epithelial tumor cells reveals an invasion suppressor role. Cell.
66:107–119. 1991. View Article : Google Scholar : PubMed/NCBI
|
|
10
|
Di Fazio P, Montalbano R, Quint K, Alinger
B, Kemmerling R, Kiesslich T, Ocker M and Neureiter D: The
pan-deacetylase inhibitor panobinostat modulates the expression of
epithelial-mesenchymal markers in hepatocellular carcinoma models.
Oncol Lett. 5:127–134. 2013. View Article : Google Scholar : PubMed/NCBI
|
|
11
|
Shah P, Gau Y and Sabnis G: Histone
deacetylase inhibitor entinostat reverses epithelial to mesenchymal
transition of breast cancer cells by reversing the repression of
E-cadherin. Breast Cancer Res Treat. 143:99–111. 2014. View Article : Google Scholar : PubMed/NCBI
|
|
12
|
Srivastava RK, Kurzrock R and Shankar S:
MS-275 sensitizes TRAIL-resistant breast cancer cells, inhibits
angiogenesis and metastasis, and reverses epithelial-mesenchymal
transition in vivo. Mol Cancer Ther. 9:3254–3266. 2010. View Article : Google Scholar : PubMed/NCBI
|
|
13
|
Taylor MD, Liu Y, Nagji AS, Theodosakis N
and Jones DR: Combined proteasome and histone deacetylase
inhibition attenuates epithelial-mesenchymal transition through
E-cadherin in esophageal cancer cells. J Thorac Cardiovasc Surg.
139:1224–1232. 2010. View Article : Google Scholar : PubMed/NCBI
|
|
14
|
Meng F, Sun G, Zhong M, Yu Y and Brewer
MA: Anticancer efficacy of cisplatin and trichostatin A or
5-aza-2′-deoxycytidine on ovarian cancer. Br J Cancer. 108:579–586.
2013. View Article : Google Scholar : PubMed/NCBI
|
|
15
|
Kaimori A, Potter JJ, Choti M, Ding Z,
Mezey E and Koteish AA: Histone deacetylase inhibition suppresses
the transforming growth factor beta1-induced
epithelial-to-mesenchymal transition in hepatocytes. Hepatology.
52:1033–1045. 2010. View Article : Google Scholar : PubMed/NCBI
|
|
16
|
Xiao W, Chen X, Liu X, Luo L, Ye S and Liu
Y: Trichostatin A, a histone deacetylase inhibitor, suppresses
proliferation and epithelial-mesenchymal transition in retinal
pigment epithelium cells. J Cell Mol Med. 18:646–655. 2014.
View Article : Google Scholar : PubMed/NCBI
|
|
17
|
Chen X, Xiao W, Chen W, Luo L, Ye S and
Liu Y: The epigenetic modifier trichostatin A, a histone
deacetylase inhibitor, suppresses proliferation and
epithelial-mesenchymal transition of lens epithelial cells. Cell
Death Dis. 4:e8842013. View Article : Google Scholar : PubMed/NCBI
|
|
18
|
Yoshikawa M, Hishikawa K, Marumo T and
Fujita T: Inhibition of histone deacetylase activity suppresses
epithelial-to-mesenchymal transition induced by TGF-beta1 in human
renal epithelial cells. J Am Soc Nephrol. 18:58–65. 2007.
View Article : Google Scholar : PubMed/NCBI
|
|
19
|
Kong D, Ahmad A, Bao B, Li Y, Banerjee S
and Sarkar FH: Histone deacetylase inhibitors induce epithelial to
mesenchymal transition in prostate cancer cells. PLoS One.
7:e450452012. View Article : Google Scholar : PubMed/NCBI
|
|
20
|
Giudice FS, Pinto DS Jr, Nör JE, Squarize
CH and Castilho RM: Inhibition of histone deacetylase impacts
cancer stem cells and induces epithelial-mesenchyme transition of
head and neck cancer. PLoS One. 8:e586722013. View Article : Google Scholar : PubMed/NCBI
|
|
21
|
Jiang GM, Wang HS, Zhang F, Zhang KS, Liu
ZC, Fang R, Wang H, Cai SH and Du J: Histone deacetylase inhibitor
induction of epithelial-mesenchymal transitions via up-regulation
of Snail facilitates cancer progression. Biochim Biophys Acta.
1833:663–671. 2013. View Article : Google Scholar : PubMed/NCBI
|
|
22
|
Ji M, Lee EJ, Kim KB, Kim Y, Sung R, Lee
SJ, Kim DS and Park SM: HDAC inhibitors induce
epithelial-mesenchymal transition in colon carcinoma cells. Oncol
Rep. 33:2299–2308. 2015. View Article : Google Scholar : PubMed/NCBI
|
|
23
|
Sakamoto T, Kobayashi S, Yamada D, Nagano
H, Tomokuni A, Tomimaru Y, Noda T, Gotoh K, Asaoka T, Wada H, et
al: A histone deacetylase inhibitor suppresses
epithelial-mesenchymal transition and attenuates chemoresistance in
biliary tract cancer. PLoS One. 11:e01459852016. View Article : Google Scholar : PubMed/NCBI
|
|
24
|
Yao X, Wang X, Dai L, Wang Z, Zhang G, Yan
Q and Zhou W: Clinicopathological and prognostic significance of
epithelial-mesenchymal transition related-protein in intrahepatic
cholangiocarcinoma. Onco Targets Ther. 5:255–261. 2012. View Article : Google Scholar : PubMed/NCBI
|
|
25
|
Vaquero J, Guedj N, Clapéron A, Nguyen
Ho-Bouldoires TH, Paradis V and Fouassier L: Epithelial-mesenchymal
transition in cholangiocarcinoma: From clinical evidence to
regulatory networks. J Hepatol. 66:424–441. 2017. View Article : Google Scholar : PubMed/NCBI
|
|
26
|
Ku JL, Yoon KA, Kim IJ, Kim WH, Jang JY,
Suh KS, Kim SW, Park YH, Hwang JH, Yoon YB and Park JG:
Establishment and characterisation of six human biliary tract
cancer cell lines. Br J Cancer. 87:187–193. 2002. View Article : Google Scholar : PubMed/NCBI
|
|
27
|
Sipos F and Galamb O:
Epithelial-to-mesenchymal and mesenchymal-to-epithelial transitions
in the colon. World J Gastroenterol. 18:601–608. 2012. View Article : Google Scholar : PubMed/NCBI
|
|
28
|
Rittling SR and Baserga R: Functional
analysis and growth factor regulation of the human vimentin
promoter. Mol Cell Biol. 7:3908–3915. 1987. View Article : Google Scholar : PubMed/NCBI
|
|
29
|
Lilienbaum A and Paulin D: Activation of
the human vimentin gene by the Tax human T-cell leukemia virus I:
Mechanisms of regulation by the NF-kappa B transcription factor. J
Biol Chem. 268:2180–2188. 1993.PubMed/NCBI
|
|
30
|
Chen JH, Vercamer C, Li Z, Paulin D,
Vandenbunder B and Stehelin D: PEA3 transactivates vimentin
promoter in mammary epithelial and tumor cells. Oncogene.
13:1667–1675. 1996.PubMed/NCBI
|
|
31
|
Salvetti A, Lilienbaum A, Li Z, Paulin D
and Gazzolo L: Identification of a negative element in the human
vimentin promoter: Modulation by the human T-cell leukemia virus
type I Tax protein. Mol Cell Biol. 13:89–97. 1993. View Article : Google Scholar : PubMed/NCBI
|
|
32
|
Wu Y, Zhang X, Salmon M and Zehner ZE: The
Zinc finger repressor, ZBP-89, recruits histone deacetylase 1 to
repress vimentin gene expression. Gene Cells. 12:905–918. 2007.
View Article : Google Scholar
|
|
33
|
Wang X, Xu J, Wag H, Wu L, Yuan W, Du J
and Cai S: Trichostatin A, a histone deacetylase inhibitor,
reverses epithelial-mesenchymal transition in colorectal cancer
SW480 and prostate cancer PC3 cells. Biochem Biophys Res Commun.
456:320–326. 2015. View Article : Google Scholar : PubMed/NCBI
|
|
34
|
Han RF, Li K, Yang ZS, Chen ZG and Yang
WC: Trichostatin A induces mesenchymal-like morphological change
and gene expression but inhibits migration and colony formation in
human cancer cells. Mol Med Rep. 10:3211–3216. 2014. View Article : Google Scholar : PubMed/NCBI
|
|
35
|
Techasen A, Loilome W, Namwat N, Khuntikeo
N, Puapairoj A, Jearanaikoon P, Saya H and Yongvanit P: Loss of
E-cadherin promotes migration and invasion of cholangiocarcinoma
cells and serves as a potential marker of metastasis. Tumor Biol.
35:8645–8652. 2014. View Article : Google Scholar
|
|
36
|
Xu W, Parmigiani R and Marks P: Histone
deacetylase inhibitors: Molecular mechanisms of action. Oncogene.
26:5541–5552. 2007. View Article : Google Scholar : PubMed/NCBI
|
|
37
|
Donadelli M, Costanzo C, Beghelli S,
Scupoli MT, Dandrea M, Bonora A, Piacentini P, Budillon A, Caraglia
M, Scarpa A and Palmieri M: Synergistic inhibition of pancreatic
adenocarcinoma cell growth by trichostatin A and gemcitabine.
Biochim Biophys Acta. 1773:1095–1106. 2007. View Article : Google Scholar : PubMed/NCBI
|