Introduction
Glioblastoma (GBM) is an aggressive cancer of glial
cells and accounts for 80% of all adult primary malignant brain
tumours (1). Despite advances in
surgical techniques, radiotherapy and chemotherapy for its
treatment, the prognosis of GBM patients remains poor dut to its
complex pathogenesis (2,3). There is substantial evidence that many
oncogenes or tumour-suppressor genes are involved in the
progression of GBM and that the effects of these genes often depend
on the level of their transcription, which can be regulated by gene
mutations, epigenetic modifications or non-coding RNAs (4–6).
However, the dysregulated gene networks and pathways that lead to
GBM progression remain unclear, and the molecular mechanisms
underlying GBM have not yet been elucidated. Thus, the
identification of new oncogenes and establishing the underlying
molecular mechanisms for GBM are critically important and highly
needed.
Microarray technology has now become an important
tool for revealing global gene expression changes to identify the
genes involved in carcinogenesis, including GBM. The widespread
application of gene chips has produced large amounts of microarray
data, which have been deposited and stored in public databases such
as the Gene Expression Omnibus (GEO) database (https://www.ncbi.nlm.nih.gov/geo/) hosted by the
US National Center for Biotechnology Information. This database
serves as a public genetic expression profile repository for a wide
range of microarray data. In the present study, we downloaded the
mRNA expression profile of GSE50161 from the GEO database and used
bioinformatics methods to compare GBM and normal brain samples to
identify the differentially expressed genes (DEGs). Gene ontology
(GO) and pathway enrichment analyses were applied to these DEGs
using the DAVID bioinformatics resource (https://david.ncifcrf.gov/).
Cyclin-dependent kinases (CDKs), including three
interphase CDKs (CDK2, CDK4 and CDK6) and a mitotic CDK (CDK1), are
important regulators of cell cycle progression and cell cycle
regulation (7). Deregulation of
this family of proteins is a hallmark of several diseases,
including cancer, and emerging evidence has demonstrated that
specific interphase CDKs are required for tumour cell proliferation
(8). CDK1 is activated by type A
cyclin at the metaphase to promote mitogenesis, and it has been
shown that, among the cell cycle CDKs, CDK1 is sufficient for
driving the cell cycle of all cell types, indicating its master
role in cell proliferation regulation (8). It has been reported that CDK1 is
overexpressed in several human cancers and that it is associated
with poor survival or the malignancy processes of those cancers
(9–11). However, the role and mechanism of
CDK1 in GBM and its development have not been fully elucidated.
Materials and methods
Microarray data
We extracted the gene expression profile of GSE50161
from the GEO database. GSE50161 was submitted by Griesinger et
al (12) and was based on the
platform of GPL570 (Affymetrix Human Genome U133 Plus 2.0 Array;
Affymetrix Inc., Santa Clara, CA, USA). The GSE50161 dataset
contains 130 samples, including 34 GBM and 13 normal brain
tissues.
Data preprocessing and differentially
expressed gene analysis
The probe-level data in CEL files were converted
into expression measures; then, using the default parameters in the
R Affy package (http://www.bioconductor.org/packages/release/bioc/html/affy.html),
a robust multiple array averaging (RMA) algorithm was applied to
background correct and quartile normalise the data (13). The significance of DEGs were
evaluated with R statistical software (version 3.4.1; http://www.r-project.org/) and Bioconductor analysis
tools (http://www.bioconductor.org/). The
limma package in R was used to identify the genes that were
differentially expressed between GBM and normal samples (14). To circumvent the multi-test problem,
resulting in too many false-positive results, the raw P-values of
the genes were adjusted with the Benjamin and Hochberg method. The
genes with adjusted P<0.05 and |logFC|>2 were considered to
be differentially expressed.
GO and pathway enrichment analysis of
the DEGs
GO analysis is commonly used in functional studies
of large-scale transcriptomic or genomic data (15), with the Kyoto Encyclopedia of Genes
and Genomes (KEGG) knowledge database used to identify functional
and metabolic pathways. In this study, we divided the DEGs into
upregulated and downregulated groups and then used the Database for
Annotation, Visualization and Integrated Discovery (DAVID) to
perform functional enrichment analysis for the identified DEGs with
a threshold of FDR <0.05. Pathway analysis based on the KEGG
database was performed with a threshold value of adjusted
P<0.05.
Cell culture
The malignant glioma cell lines U-87MG, U-251MG and
SHG44 were purchased from the Chinese Academy of Sciences
(Shanghai, China) and STR profiles were presented for all cell
lines used. The malignant glioma cell line U-138MG and the human
normal brain glial cells HEB were sourced from the American Type
Culture Collection (ATCC, Manassas, VA, USA). The cells were
maintained in high-glucose DMEM medium (Hyclone Laboratories,
Logan, UT, USA) containing 10% fetal bovine serum (FBS; Gibco,
Grand Island, NY, USA) and were cultured at 37°C in humidified air
with 5% CO2.
RNA extraction and quantitative
real-time polymerase chain reaction (RT-qPCR)
Total RNA was extracted from GBM cells using TRIzol
reagent (Takara Biotechnology, Co., Ltd., Dalian, China), following
the manufacturer's protocol. cDNA was synthesised using
PrimeScript™ RT Master Mix (Takara Biotechnology),
according to the manufacturer's instructions. The sequences of
primers were as follows: CDK1 forward,
5′-CAGTCAGACCAAAATACCTACTGGGT-3′ and reverse,
5′-ACACCAACCAGCTGCAGCATCTTCTT-3′. RT-qPCR assays were performed
with SYBR Green Master Mix kit (Takara Biotechnology) using a
Real-Time PCR System (Applied Biosystems, Foster City, CA, USA).
Reaction steps were as follows: 95°C for 30 sec, 40 cycles with
95°C for 5 sec, 60°C for 30 sec, and 95°C for 10 sec, 65°C for 5
sec, end of 95°C to 10.5°C. GAPDH was used as internal control and
the 2−ΔCq (or 2−ΔΔCt) method was used to
analyse the relative quantitation of gene expression levels.
Protein extraction and western blot
analysis
Total protein was extracted from GBM cells using
RIPA (Beyotime Institute of Biotechnology, Shanghai, China).
Protein samples were separated by electrophoresis on SDS-PAGE gel
of 10% and transferred onto polyvinylidene fluoride (PVDF)
membranes. The membranes were blocked in 5% skim milk at room
temperature for 2 h, and then incubated at 4°C overnight with
primary antibodies CDK1 (1:2,000 dilution; cat. no. ab18; Abcam,
Cambridge, UK), p-AKT (1:1,000 dilution; cat. no. 4060; Cell
Signalling Technology, Danvers, MA, USA), cyclin A (1:1,000
dilution; cat. no. 4656; Cell Signalling Technology), cyclin B
(1:1,000 dilution; cat. no. 4138; Cell Signalling Technology) and
β-actin (1:3,000 dilution; cat. no. 3700; Cell Signalling
Technology). The membranes were washed with TBST buffer and
incubated in secondary antibodies with horseradish peroxidase
(1:3,000 dilution; cat. no. 14709; Cell Signalling Technology) at
room temperature for 2 h. Finally, the expression of proteins was
visualised with an ECL reagent (Bio-Rad Laboratories, Shanghai,
China). β-actin was used as the internal control, and the
experiments were performed in triplicate. Quantitation of proteins
expression was analysed by Quantity One 4.6.2 software (Bio-Rad
Laboratories, Foster City, CA, USA).
Transfection and stably transfected
cells
CDK1-specific small hairpin RNA (shRNA) sequence and
the overexpression sequence of CDK1 were constructed using a
lentiviral technique from Shanghai GeneChem Co. (Shanghai, China).
The CDK1 shRNA sequences were as follows: shRNA1,
5′-CACCGGTTCCTAGTACTGCAATTCGCGAACGAATTGCAGTACTAGGAACC −3′; shRNA2,
5′-CACCGGATGTGCTTATGCAGGATTCCGAAGAATCCTGCATAAGCACATCC-3′; shRNA3,
5′-CACCGCAGGATTCCAGGTTATATCTCGAAAGATATAACCTGGAATCCTGC-3′. U-87MG
and U-251MG cells were transfected with lentiviral diluent and
selected with 3 µg/ml puromycin (Sigma-Aldrich; Merck KGaA,
Darmstadt, Germany) for one week. The knockdown efficiency of CDK1
was identified by RT-qPCR and western blot assays.
Cell proliferation assays
Cell Counting Kit-8 (CCK-8; Dojindo Laboratories,
Kumamoto, Japan) was used to detected cell proliferation. The cells
were seeded into 96-well plates, with 0.5×10⁴
cells/well. CCK-8 reagent (at a final concentration up to 10%) was
added to each well at 0, 24, 48 and 72 h after complete cell
adherence. The reaction system was incubated at 37°C for 1.5 h, and
the absorbance was measured at 450 nm with a microplate reader
(BioTek Instruments, Inc., Winnoski, VT, USA). The experiments were
conducted in triplicate.
Colony formation assays
In brief, cells were seeded into 6-well plates, at
0.1×10⁴ cells per well, and maintained for two weeks in
a medium containing 10% FBS. When the clones exceeded 50 cells, the
cells were fixed with 4% paraformaldehyde and stained with 1%
crystal violet. Finally, the colonies were imaged by scanner
(Samsung, Gyeonggi-do, Korea) and counted by the counting tool of
Photoshop 6.0 (Adobe Photoshop, San Jose, CA, USA). The experiment
was conducted in triplicate.
Statistical analysis
The overall survival analysis used Kaplan-Meier
curves based on data from the GEO and The Cancer Genome Atlas
(TCGA) databases. Hazard ratios (HRs) with 95% confidence intervals
were calculated, and the log-rank test was used to assess P-values,
and these are displayed on the plot. Data are presented as the mean
± standard deviation (SD) from triplicate independent experiments,
and were analysed with Student's t-test for two group comparisons,
and were analysed by analysis of variance (ANOVA) followed by
Dunnett or Bonferroni post hoc test for multiple comparisons. A
two-tailed P-value <0.05 was considered to indicate a
statistically significant difference. The data analysis was
performed using SPSS version 20.0 (IBM Corp., Armonk, NY, USA).
Results
Identification of DEGs
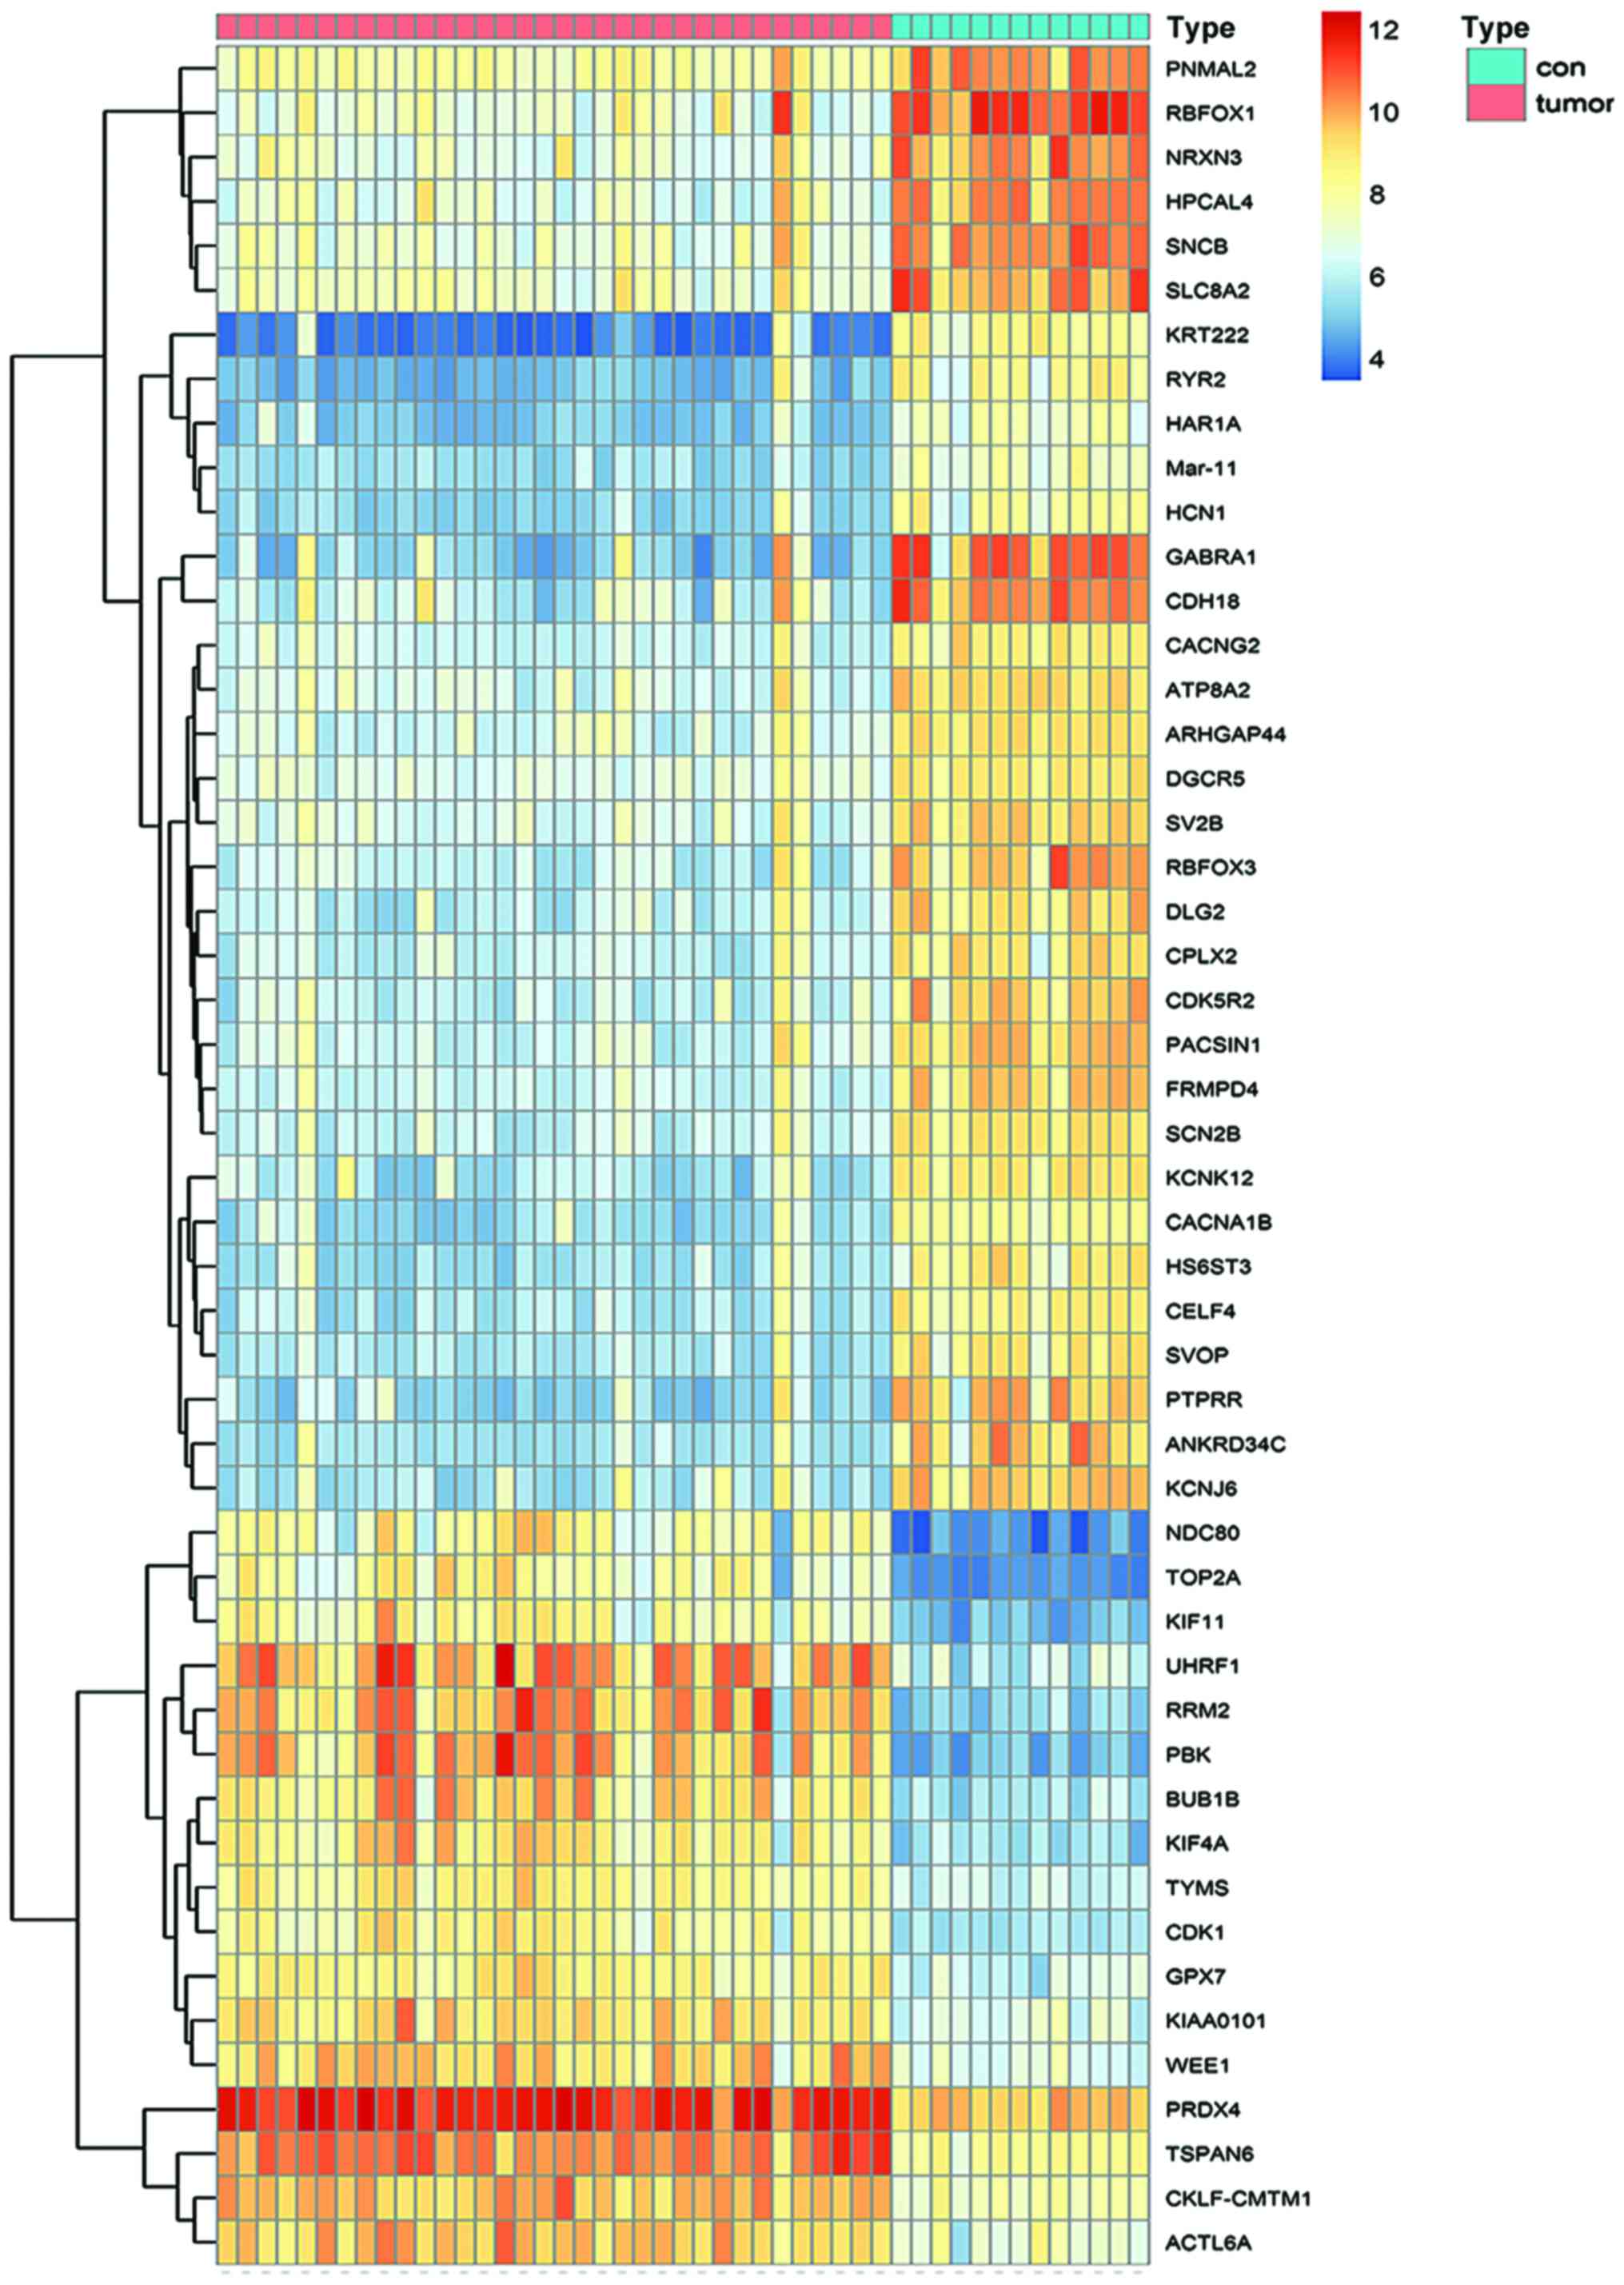
We downloaded the GSE50161 gene expression dataset
from the GEO database. Following careful inspection, we extracted
45 microarrays based on the GPL570 platform, including 34 GBM
samples and 13 normal brain samples. Based on the cut-off criteria
of adjusted P<0.05 and |logFC|>2, a total of 486 DEGs were
identified, of which 128 were upregulated and 358 were
downregulated. Fig. 1 displays the
top 50 upregulated genes as a heat map, and Table I lists details of the top 20
upregulated DEGs.
 | Table I.Top 20 upregulated DEGs in GBM
compared with normal brain tissues. |
Table I.
Top 20 upregulated DEGs in GBM
compared with normal brain tissues.
| Gene symbol | Gene name | logFC | Adjusted P-value |
|---|
| RRM2 | Ribonucleotide
reductase regulatory subunit M2 | 4.453419652 | 5.51E-18 |
| PBK | PDZ binding
kinase | 4.83243913 | 1.00E-17 |
| CKLF-CMTM1 | CKLF-CMTM1
readthrough | 2.037217181 | 8.61E-17 |
| TSPAN6 | Tetraspanin 6 | 2.238197957 | 2.42E-16 |
| TOP2A | Topoisomerase (DNA)
II α | 3.649973973 | 2.69E-16 |
| GPX7 | Glutathione
peroxidase 7 | 2.299383845 | 3.04E-16 |
| PRDX4 | Peroxiredoxin 4 | 2.006805339 | 3.34E-16 |
| TYMS | Thymidylate
synthetase | 2.217762746 | 2.29E-15 |
| KIF11 | Kinesin family
member 11 | 3.25308997 | 2.41E-15 |
| KIAA0101 | KIAA0101 | 2.434042313 | 2.42E-15 |
| ACTL6A | Actin like 6A | 2.334230872 | 2.71E-15 |
| NDC80 | Kinetochore complex
component | 3.801758823 | 3.73E-15 |
| BUB1B | BUB1 mitotic
checkpoint serine/threonine kinase B | 3.326136589 | 4.61E-15 |
| KIF4A | Kinesin family
member 4A | 3.186827599 | 5.43E-15 |
| CDK1 | Cyclin dependent
kinase 1 | 2.632518398 | 8.08E-15 |
| UHRF1 | Ubiquitin like with
PHD and ring finger domains 1 | 3.829808433 | 8.68E-15 |
| WEE1 | WEE1 G2 checkpoint
kinase | 2.605771805 | 1.09E-14 |
| CDCA7L | Cell division cycle
associated 7 like | 2.502772251 | 1.46E-14 |
| EZH2 | Enhancer of zeste 2
polycomb repressive complex 2 subunit | 3.33804613 | 3.34E-14 |
| RAD51AP1 | RAD51 associated
protein 1 | 2.586126911 | 3.59E-14 |
Functional and pathway enrichment
analysis of DEGs
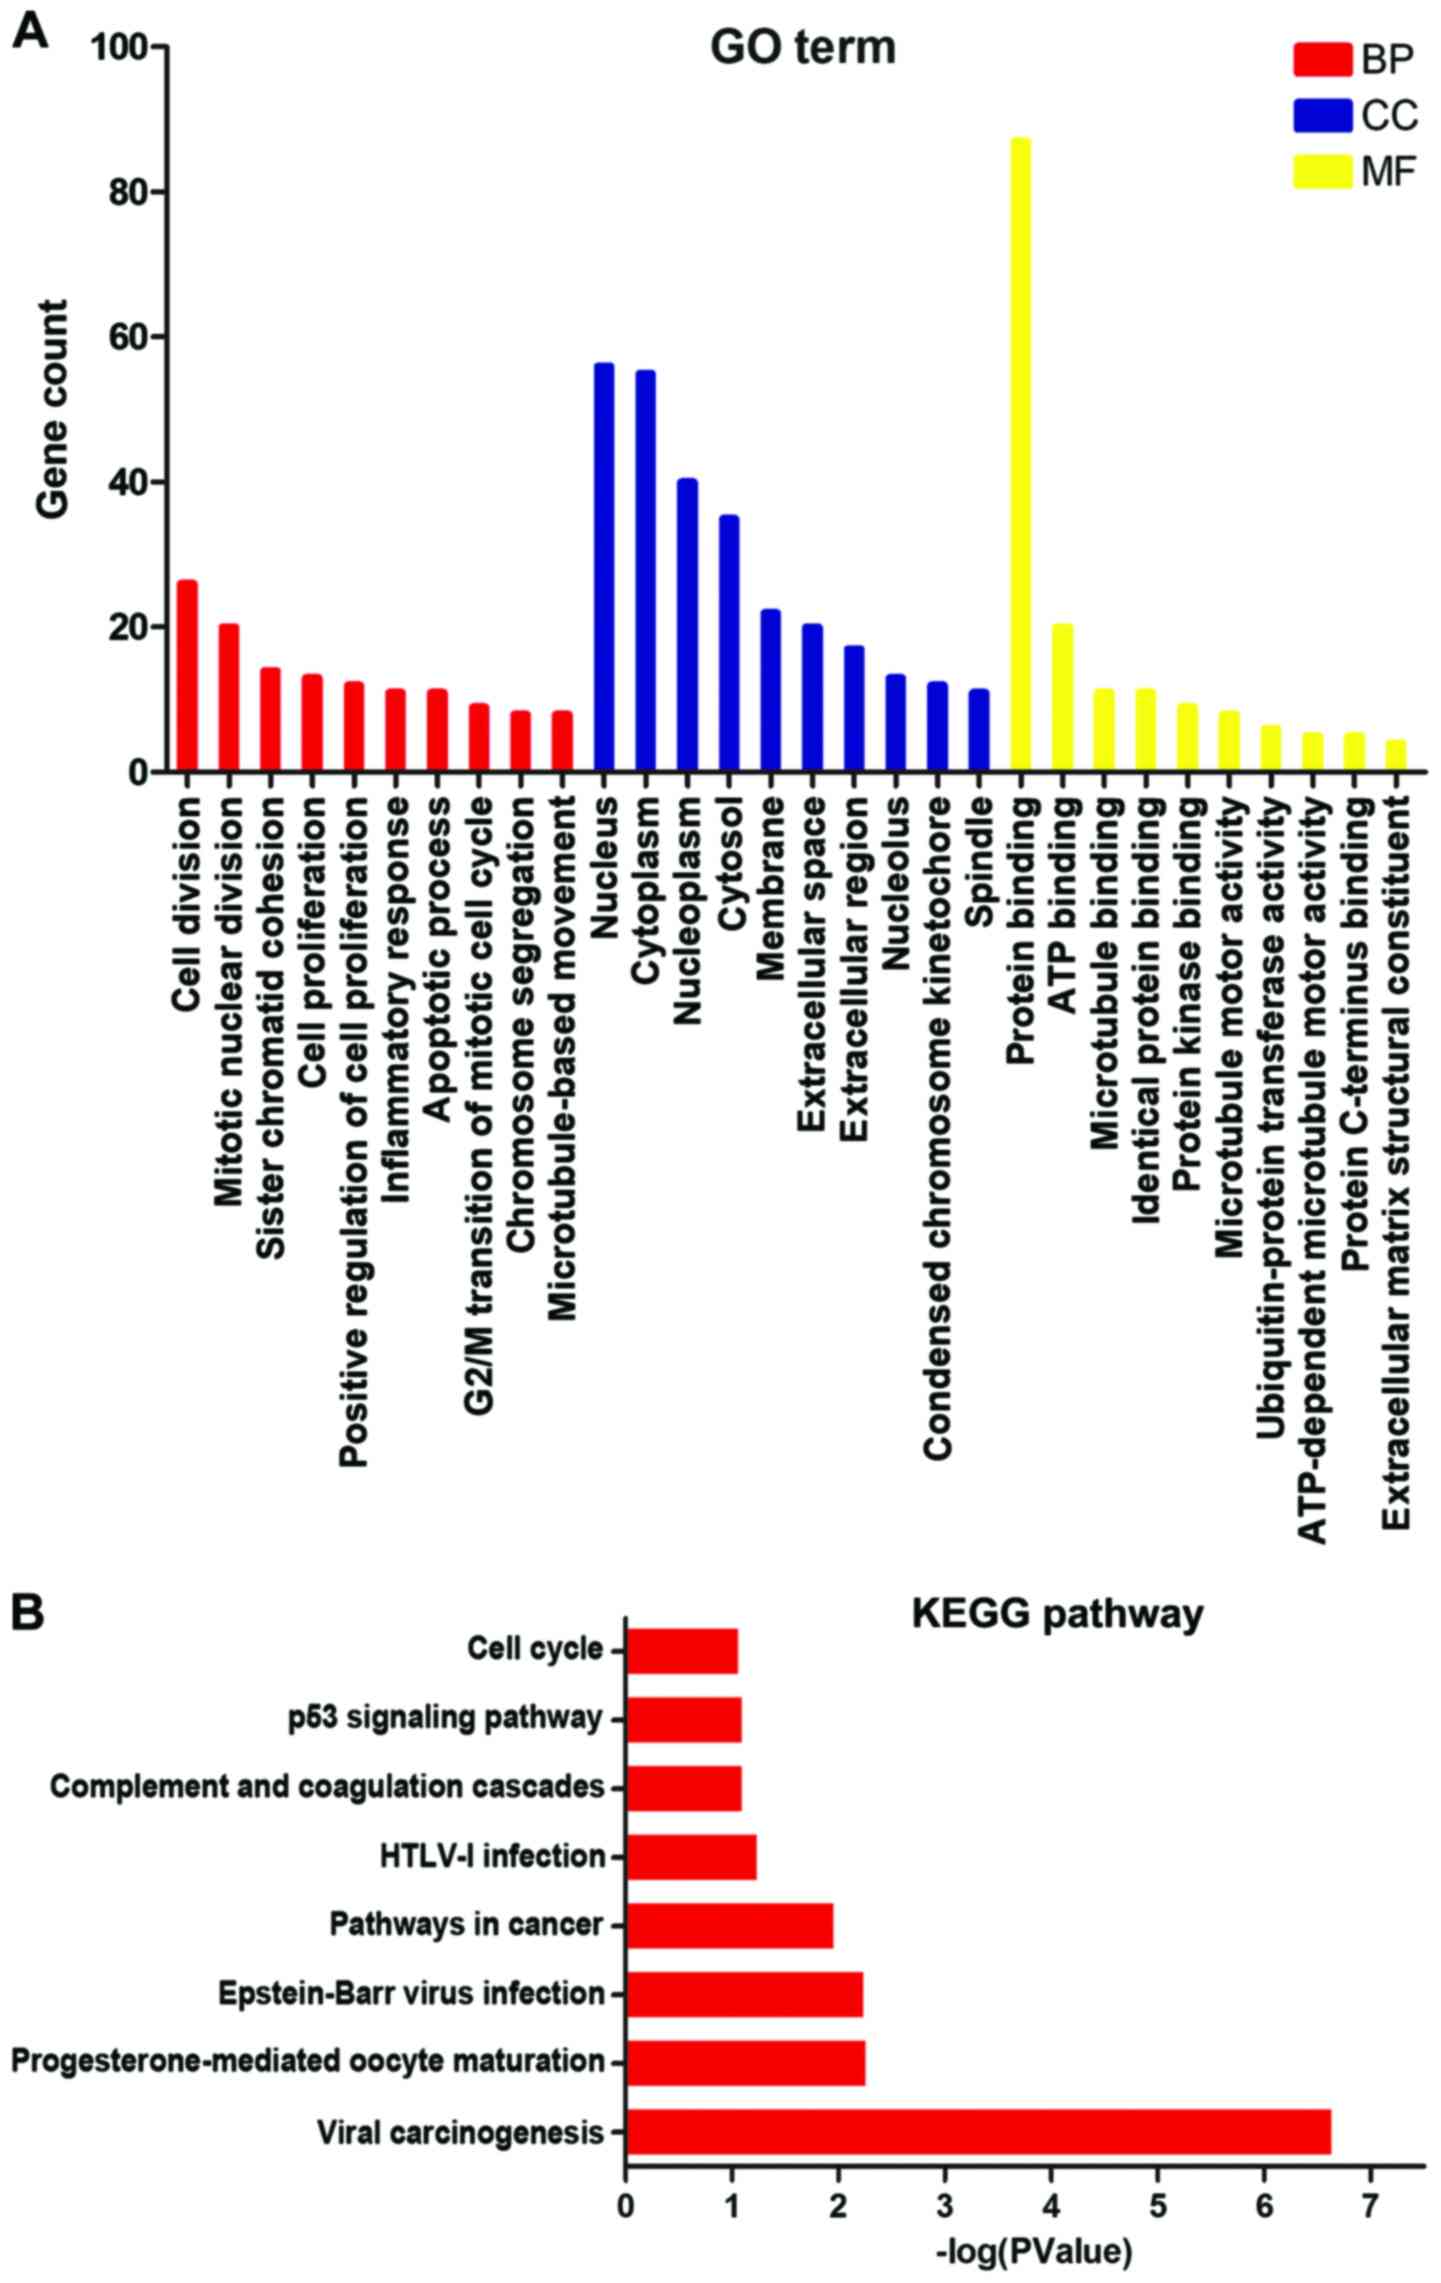
DAVID was used to identify highly enriched GO
categories and KEGG pathways from all the upregulated DEGs. The GO
analysis identified 57 significant enrichments of upregulated DEGs,
which were classified into three GO categories: Biological
processes, cellular components, and molecular functions (Fig. 2A). In the biological process
category, the upregulated DEGs were particularly enriched in cell
division, mitotic nuclear division and cell proliferation. In the
cellular components category, the upregulated DEGs were enriched in
midbodies, nucleoplasm, cytoplasm and nuclei. The GO molecular
functions analysis also showed that the upregulated DEGs were
significantly enriched in protein binding, identical protein
binding, ATP binding and protein kinase binding. In addition, the
pathway enrichment analysis showed that a total of 8 KEGG pathways
were enriched, with cell cycle the most highly enriched pathway
(Fig. 2B).
Partial upregulated genes were
significantly associated with poor survival
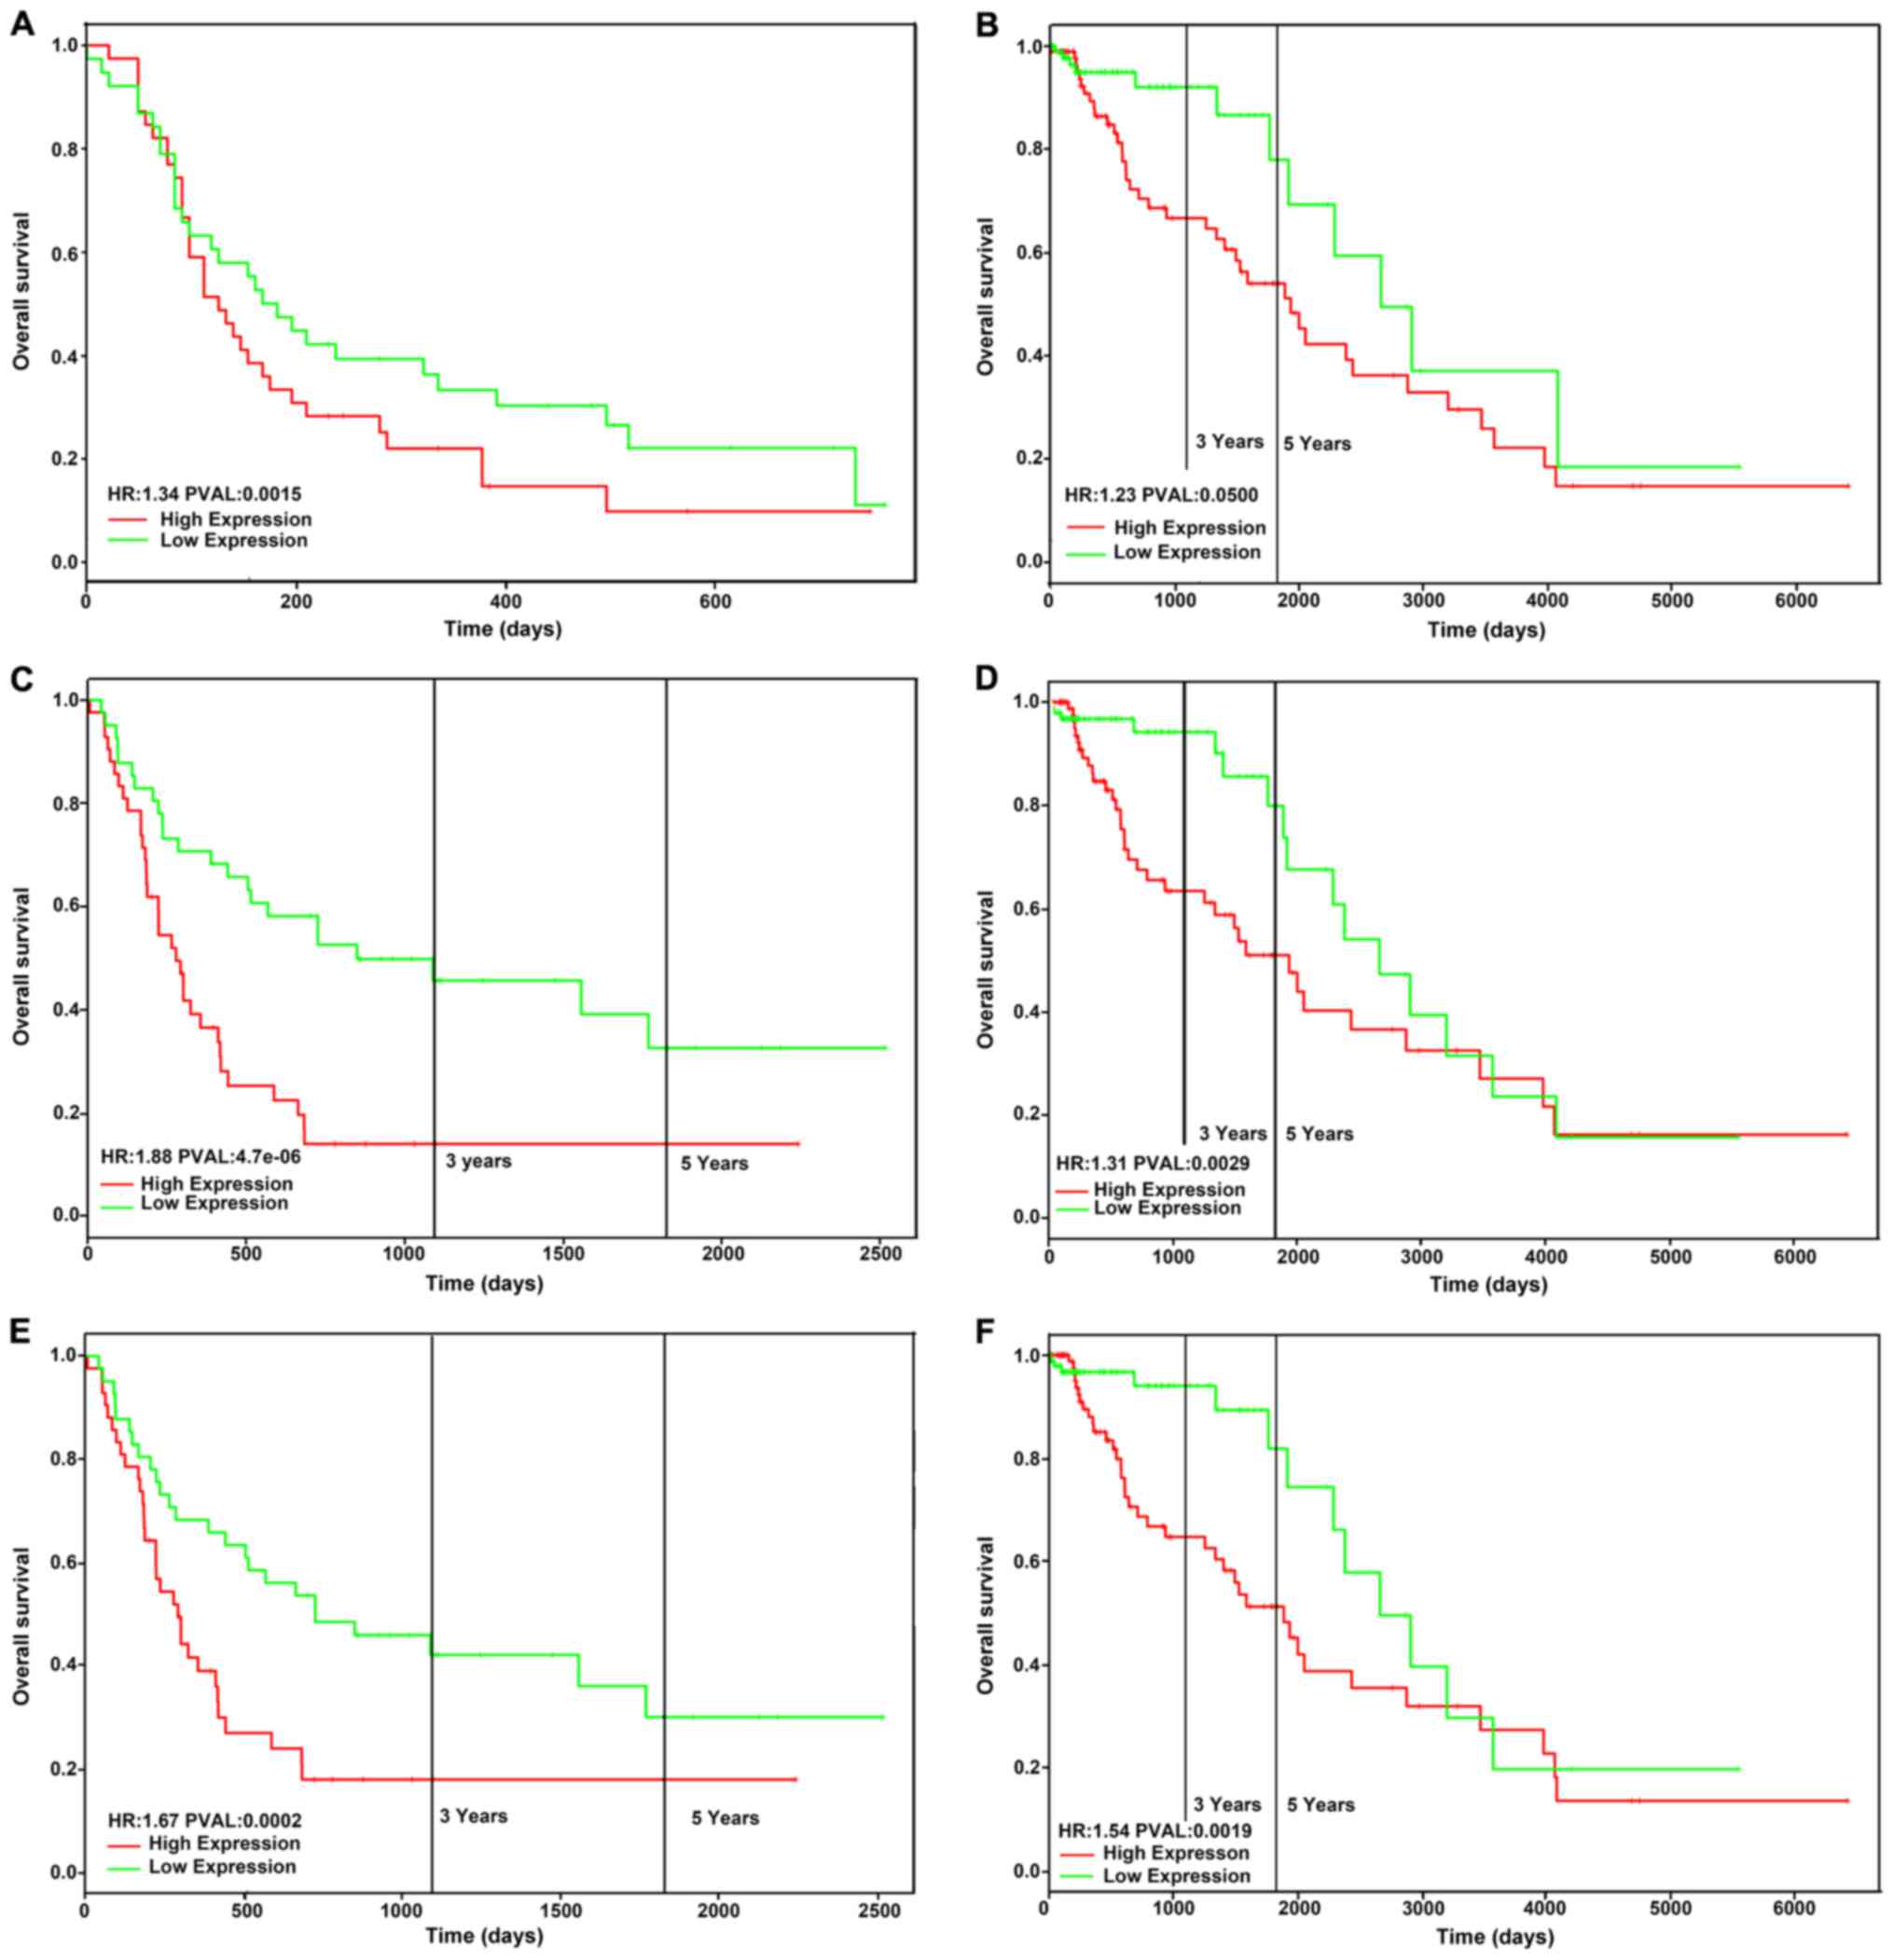
The upregulated DEGs involved in the cell cycle
signalling pathway were CDK1, CCNB1, TTK, BUB1B, CDC20, MCM2, CDK4,
CCNA2 and WEE1. Among these, CDK1, CCNB1 and CDC20 were also
enriched in the most significant function of GO. Therefore, we
selected these three DEGs and evaluated the relationship between
their expression and the survival prognosis of patients with GBM.
Gene expression data and clinical information from the GEO and TCGA
databases were used to investigate the prognostic significance of
these genes. The result showed that high expression of CDK1
(Fig. 3A and B), CDC20 (Fig. 3C and D), and CCNB1 (Fig. 3E and F) was associated with a
significantly poorer overall survival.
CDK1 is overexpressed in GBM tissues
and cell lines
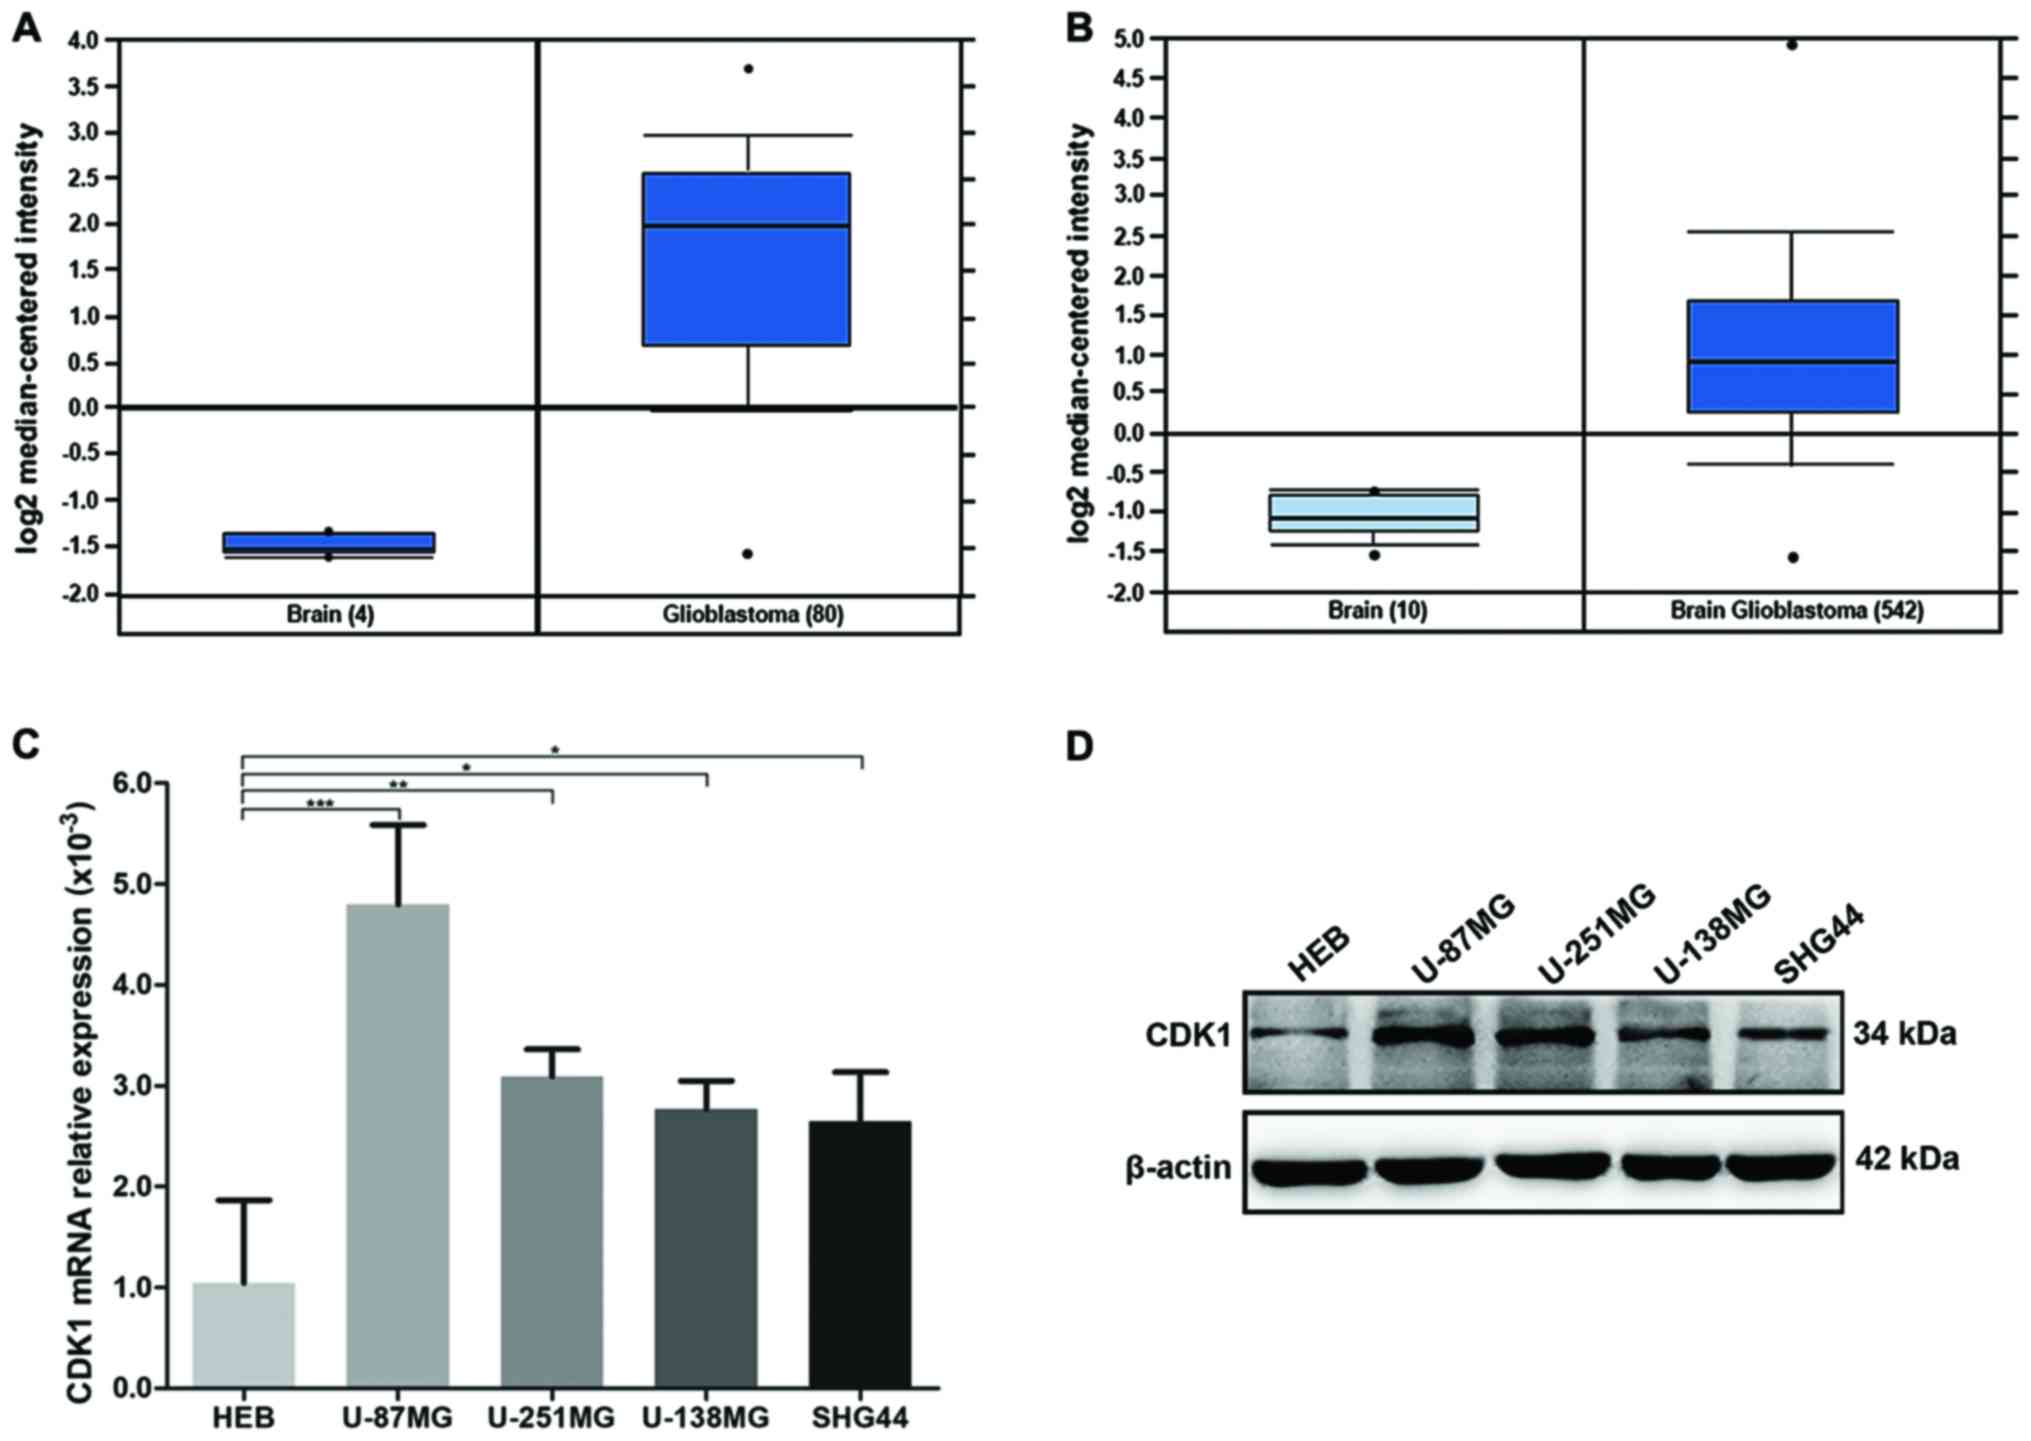
CDK1 mRNA expression in GBM and normal brain tissues
was evaluated from GEO and TCGA databases, showing that CDK1 was
significantly overexpressed in GBM tissues, as compared to that
noted in the normal brain tissues (Fig.
4A and B). Its expression was similarly examined in glioma cell
lines. CDK1 expression was much higher in glioma cells than that in
normal human brain glial cell line (HEB), especially in GBM cells
U-87MG and U-251MG (Fig. 4C and
D).
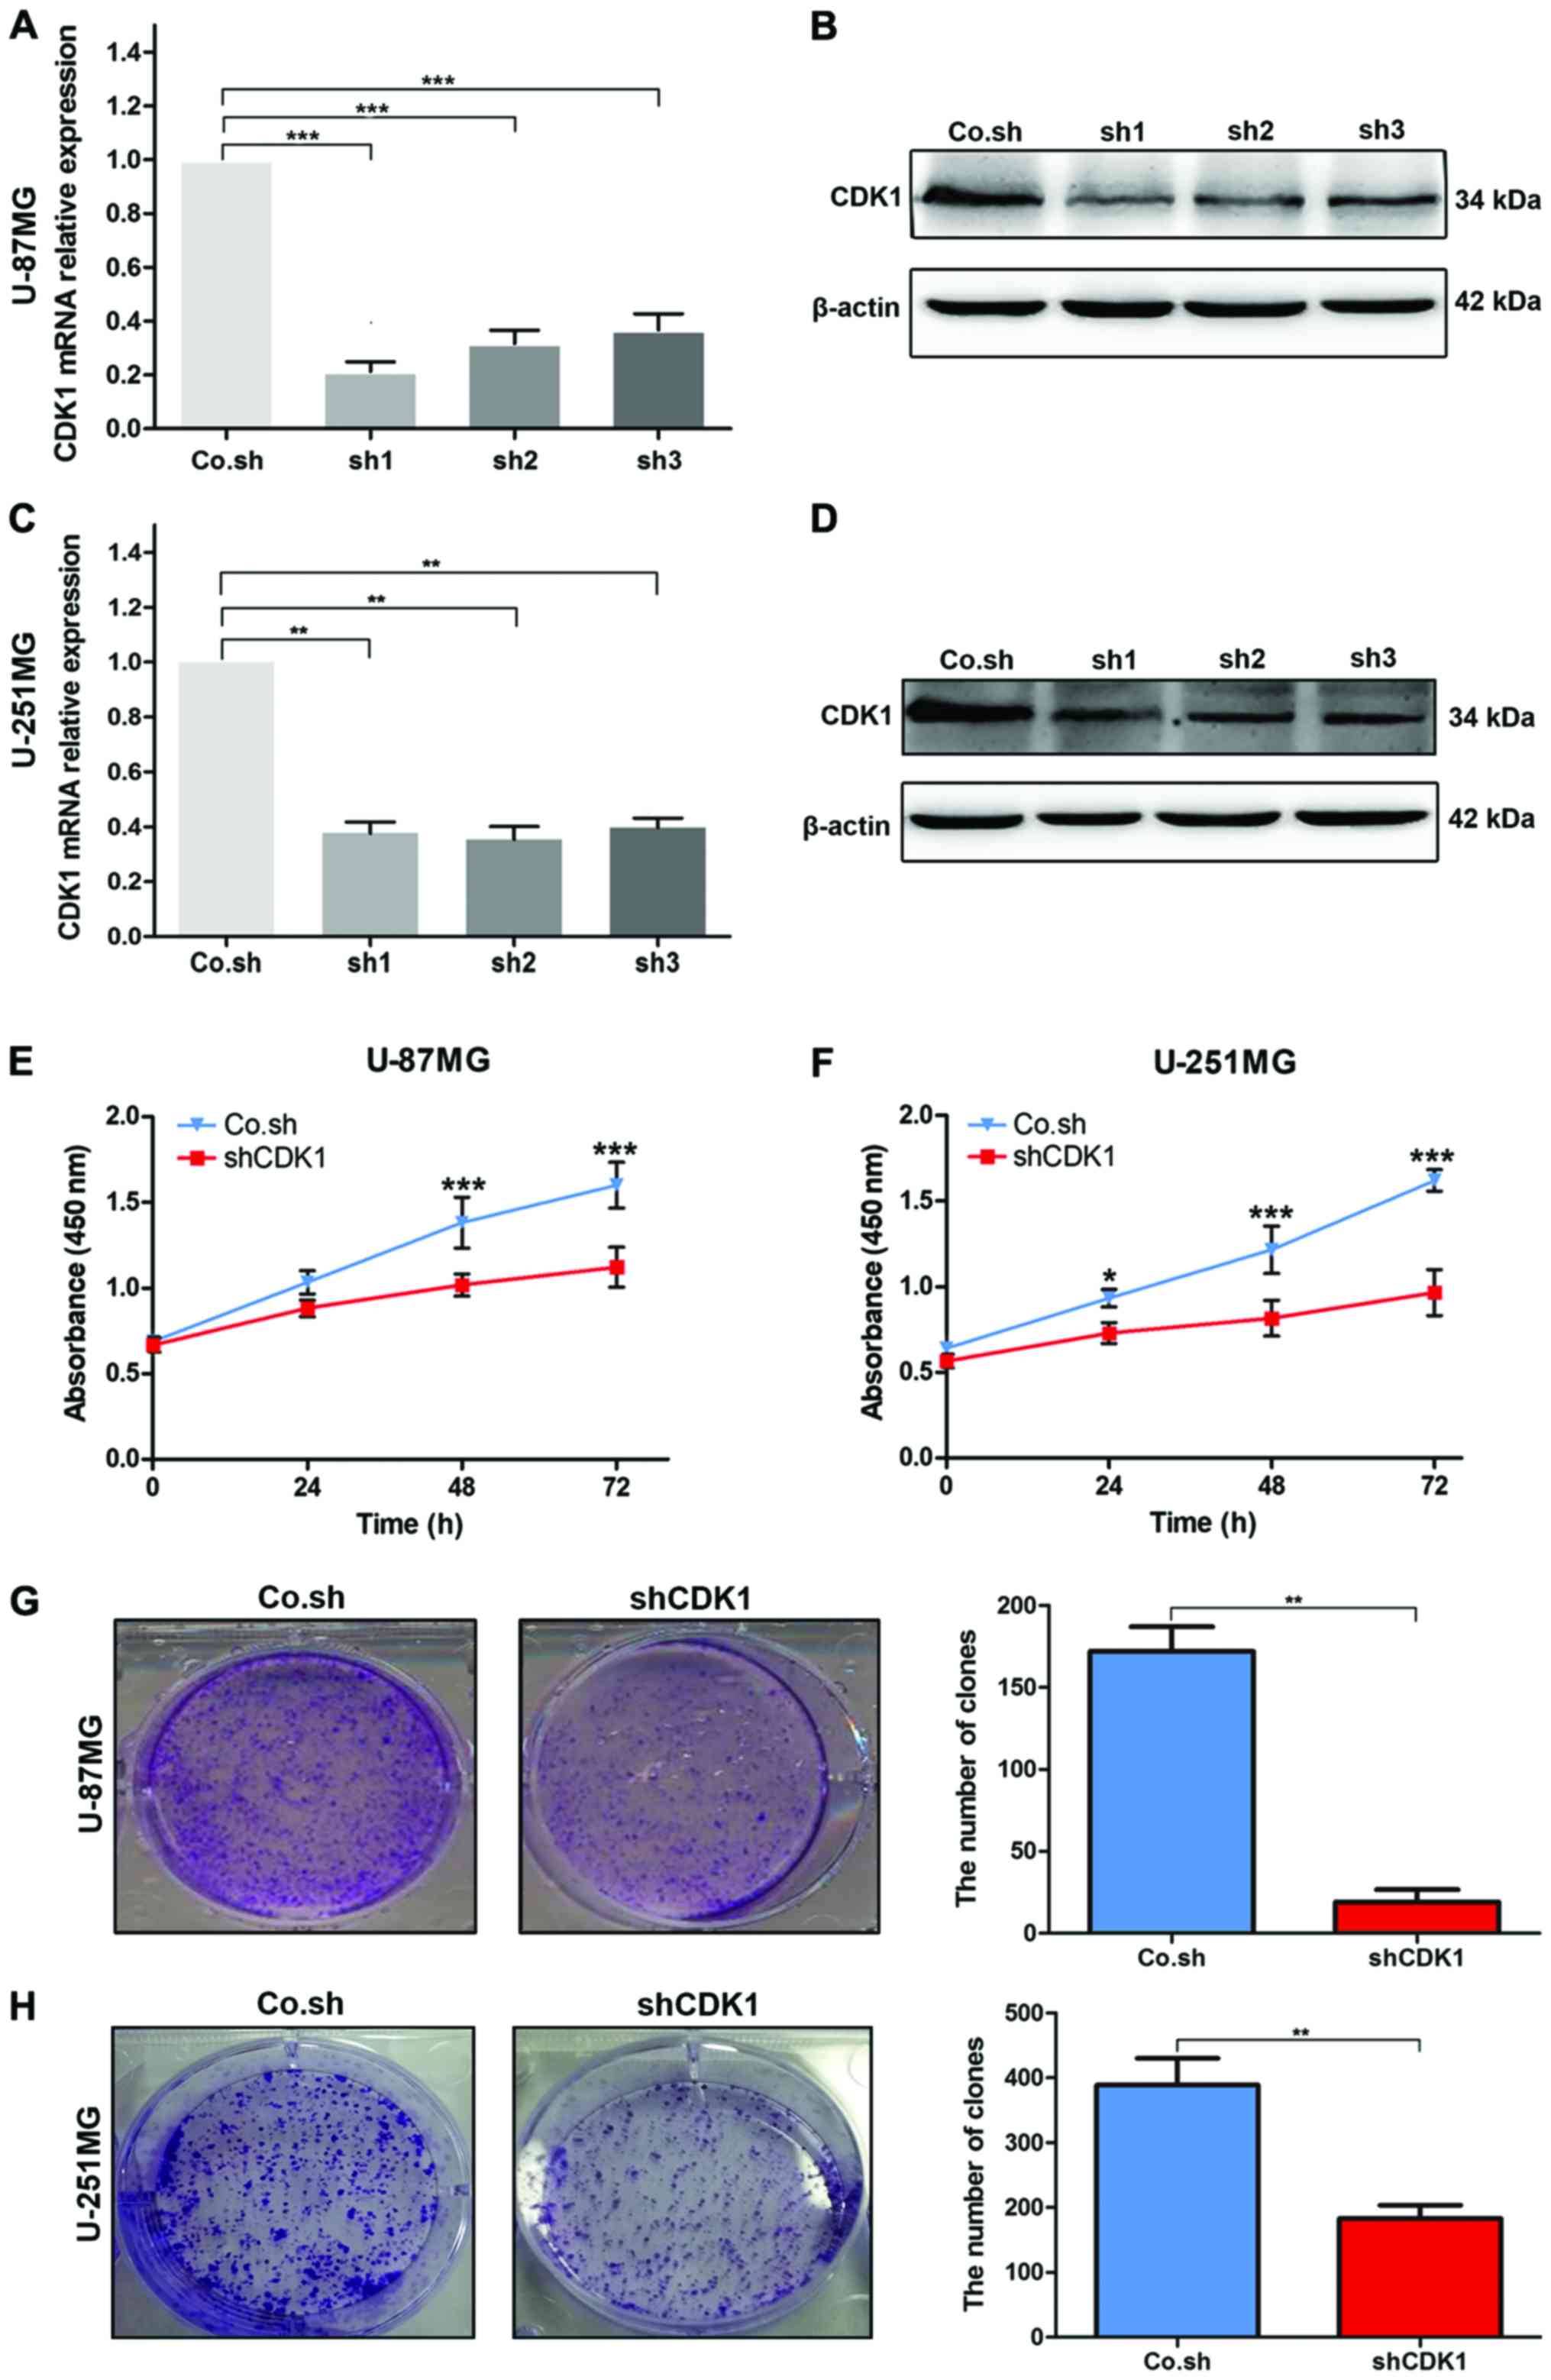
Knockdown of CDK1 significantly
inhibits the proliferation of GBM cells
To study the role of CDK1 in the progression of GBM,
we knocked down CDK1 expression in U-87MG and U-251MG cells using a
lentiviral shRNA technique. The knockdown efficiency was evaluated
using RT-qPCR and western blot analysis. The results showed
significantly lower CDK1 mRNA and protein expression in U-87MG
cells transfected with shRNA1, shRNA2 and shRNA3 than in cells
transfected with control shRNA (Fig. 5A
and B). Similar results were found in U-251MG cells (Fig. 5C and D). The effect of CDK1 on the
proliferation of GBM cells was assessed using CCK-8 cell
proliferation and colony formation assays, which showed that
knockdown of CDK1 significantly inhibited GBM cell proliferation
(Fig. 5E and F). Similarly, the
colony formation assays demonstrated a lower colony formation
ability in the cells transfected with CDK1 shRNA than this ability
noted in the control group (Fig. 5G and
H). These findings indicated that CDK1 plays a vital role in
the proliferation of GBM cells.
CDK1 is involved in the Akt signalling
pathway, promoting the GBM malignancy process
It has been shown the dysregulation of the Akt
signalling pathway is associated with tumorigenesis and the
development of GBM (16). Previous
study have reported that CDK1 could be a downstream molecule in the
Akt signalling pathway (17). In
the present study, we found that knockdown of CDK1 significantly
inhibited the proliferation of GBM cells. To further demonstrate
the involvement of CDK1 in the Akt signalling pathway-promoting GBM
malignancy process, we treated U-87MG cells with IGF-1, an Akt
signalling pathway agonist. p-Akt, proliferation-promoting factors,
including cyclin A and cyclin B, and CDK1 were significantly
increased in the cells treated with IGF-1 when compared with levels
noted in the untreated cells; this effect was observed in the
negative control cells and in the CDK1 shRNA cells (Fig. 6A and B). We next inhibited the Akt
signalling pathway in U-87MG cells by using a potent inhibitor of
PI3K named GDC-0491. Western blot assays showed that p-Akt and CDK1
were significantly decreased in CDK1 overexpressed cells and
negative control cells which were treated with GDC-0491, when
compared with these levels in the untreated cells (Fig. 6C and D). These results indicate that
CDK1 is a downstream molecule of the Akt signalling pathway.
Finally, treatment with GDC-0491 obviously inhibited the
proliferation of U-87MG cell, which could be reversed by the
overexpression of CDK1 (Fig. 6E).
In accordance with expectations, the CCK-8 assays showed that
treatment with IGF-1 clearly promoted the proliferation of U-87MG
cells, and that this was partially attenuated by the knockdown of
CDK1 (Fig. 6F). In summary, this
evidence demonstrated that CDK1 was involved in the Akt signalling
pathway to promote GBM malignancy process.
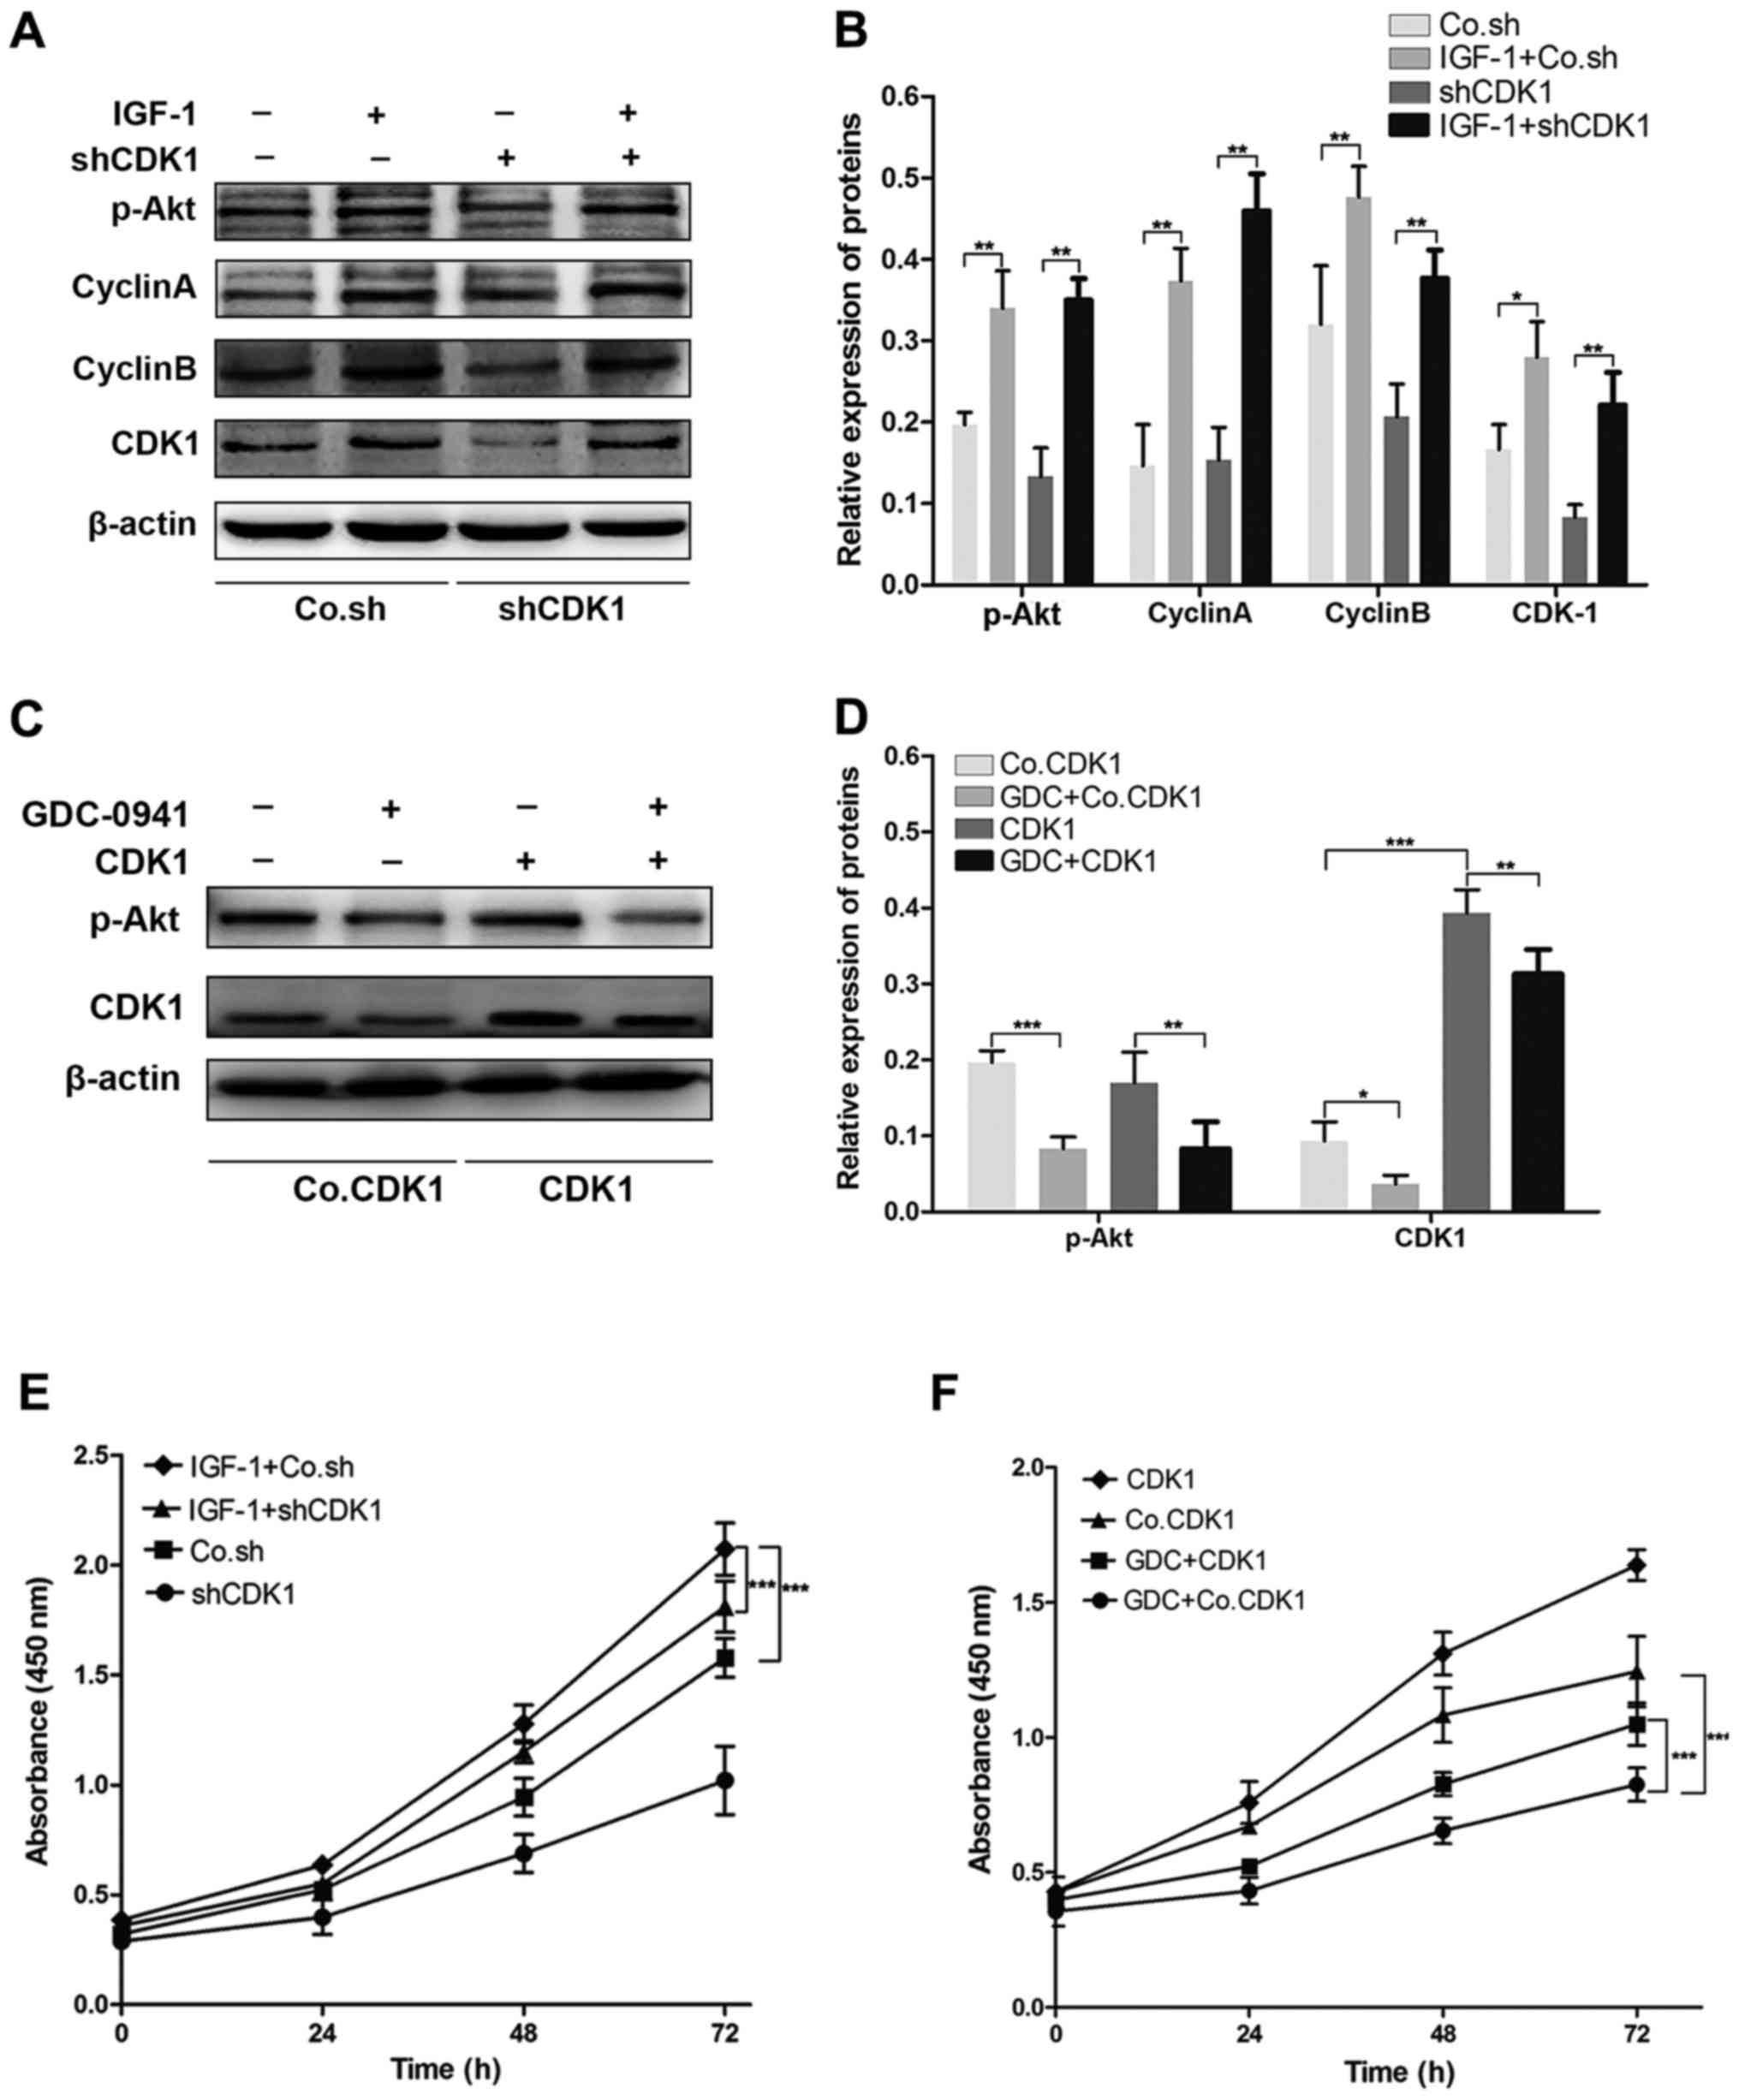 | Figure 6.CDK1 was involved in the Akt
signalling pathway, promoting the GBM malignancy process. (A and B)
The protein level of p-Akt, cyclin A, cyclin B and CDK1 in the
negative control cells and CDK1- shRNA cells, with or without the
treatment of IGF-1. Protein derived from serum-starved cells
treated with IGF-1 (Sigma-Aldrich; Merck KGaA) for 8 h. *P<0.05,
**P<0.01. (C and D) The protein level of p-Akt and CDK1 in CDK1
overexpressed cells and negative control cells, treated with
GDC-0491 (Selleckchem, Munich, Germany) or untreated. For up to 96
h treatment with 0.6 µM GDC-0941, cells were collected and protein
was extracted. *P<0.05, **P<0.01, ***P<0.0001. (E)
Treatment with GDC-0491 (GDC) markedly inhibited the proliferation
of GBM cells, which was reversed by the overexpression of CDK1,
***P<0.0001. GBM, glioblastoma. (F) The treatment of IGF-1
clearly promoted GBM cell proliferation; this was partially
attenuated by the knockdown of CDK1, ***P<0.0001. |
Discussion
GBM is the most common malignant primary brain
tumour in adults (18). Despite
improvements in standard therapy, patients with GBM still have a
poor prognosis, with a median survival of only about 15 months
(19). Understanding the
dysregulated gene networks and pathways leading to GBM is therefore
necessary and urgent. In the present study, 486 DEGs were screened,
including 128 upregulated genes and 358 downregulated genes. To
obtain a fuller understanding of these DEGs, we performed GO
function and KEGG pathway analyses. The GO analysis showed that the
upregulated DEGs were primarily related to cell division, cell
proliferation, midbodies, nucleoplasm, protein binding and protein
kinase binding. The main KEGG pathways of the upregulated DEGs
included the cell cycle, the p53 signalling pathway, complement and
coagulation cascades and pathways in cancer. These analyses may
provide new insights and a better understanding of the oncology of
GBM.
CDK1, also known as cell division cycle protein 2
homolog, is a highly conserved protein that functions as a
serine/threonine kinase. During cell proliferation, it plays a key
role in G1/S and G2/M phase transitions,
which promote the M-phase process. It has been reported that CDK1
is involved in cancer tumourigenesis and development in various
ways (20–22). In the present analysis, CDK1 was
identified as an upregulated gene involved in cell division, cell
proliferation and apoptotic processes, and was shown to be
downstream of the cell cycle and p53 signalling pathways by GO and
KEGG analysis. In addition, the high expression of CDK1 was
significantly associated with poor overall survival in patients
with GBM. Thus, CDK1 may play a vital role in the progression of
GBM. Knockdown of CDK1 significantly inhibited GBM cell
proliferation, confirming this hypothesis. This finding was also
consistent with previous research into the role of CDK1 in other
cancers, which showed that cancer cells with high CDK1 expression
appeared to have greater cell proliferation capability (23–25).
Since its initial discovery as a proto-oncogene, Akt
has attracted much attention due to its critical role in the
regulation of diverse cellular functions, including metabolism,
growth, proliferation, survival, transcription and protein
synthesis (26). Deregulation of
the Akt signalling pathway contributes to the development and
progression of multiple solid tumours, including GBM (27,28).
In GBM, the pathway is regulated by multiple genetic events,
mutations, amplifications, and deletions (29), and the activation of Akt seems to be
a consequence of changes to its upstream molecules, such as PTEN,
EGFR and PDK1 (16). However, its
downstream in GBM is complex and has not yet been completely
elucidated. In the present study, we activated the Akt signalling
pathway with IGF-1. This clearly promoted the cell proliferation of
GBM, indicating that the pathway was associated with the
progression of GBM. In addition, CDK1 expression was upregulated in
cells treated with IGF-1 compared with in untreated cells and was
downregulated in cells treated with GDC-0491 suggesting that CDK1
could be a downstream molecule of this signalling pathway in GBM.
Importantly, the promotion of GBM proliferation by activation of
the Akt signalling pathway was attenuated by the knockdown of CDK1
partially, and the inhibition effect of the inhibitor of this
pathway was reversed by the overexpression of CDK1. These results
indicated that CDK1 was involved in the Akt signalling pathway,
where it promoted the GBM malignancy process. It is known that the
Akt signalling pathway can promote cell cycle via inhibiting the
activation of p21 (30), and that
p21 binds to and inhibits cyclin-dependent kinase activity,
preventing the phosphorylation of critical cyclin-dependent kinase
substrates and blocking cell cycle progression (31). Our finding demonstrated that Akt
promoted tumour cell proliferation, regulating not only the
activity of the proliferation-promoting protein CDK1, but also its
expression level. A previous study showed that the CDK1-mediated
phosphorylation and stabilisation of HIF-1α played a much more
important role in promoting the oncogenic effects of HIF-1 in
normoxic conditions than in hypoxic conditions, where CDK1 is
aberrantly activated (32). Our
results showed that activation of the Akt signalling pathway
increased CDK1 expression. Thus, we present the Akt/CDK1/HIF-1α
signalling axis, and we propose that the aberrant activation of Akt
is a high frequency event in GBM, which could explain the elevated
HIF-1 activity observed in primary and metastatic tumours,
independent of hypoxia.
In summary, using microarray datasets and
bioinformatic analysis, we identified 486 DEGs, including 128
upregulated genes, that may be involved in GBM. GO function and
KEGG pathway analyses showed that these upregulated DEGs may be
associated with the development and progression of GBM. Upregulated
genes, including CDK1, CCNB1 and CDC20, were significantly
associated with the poor prognosis of patients with GBM. We focused
on the relationship between the upregulated DEG CDK1 and the GBM
malignancy process. The knockdown of CDK1 clearly suppressed the
proliferation of GBM cells, indicating that CDK1 was involved in
the Akt signalling pathway, where it promoted the GBM malignancy
process. These findings improve our understanding of the
fundamental mechanisms leading to GBM and may guide further
research into the diagnosis and treatment of this disease.
Acknowledgements
Not applicable.
Funding
No funding was received.
Availability of data and materials
The datasets used during the present study are
available from the corresponding author upon reasonable
request.
Authors' contributions
YZ performed the experiments and wrote the
manuscript, with the contribution of QX. JL designed the study and
analysed the results. All authors read and approved the final
manuscript and agreed to be accountable for all aspects of the
research in ensuring that the accuracy or integrity of any part of
the work are appropriately investigated and resolved.
Ethics approval and consent to
participate
Not applicable.
Patient consent for publication
Not applicable.
Competing interests
The authors declare that they have no competing
interests.
References
|
1
|
Dolecek TA, Propp JM, Stroup NE and
Kruchko C: CBTRUS statistical report: Primary brain and central
nervous system tumors diagnosed in the United States in 2005–2009.
Neuro Oncol. 14 (Suppl 5):v1–v49. 2012. View Article : Google Scholar : PubMed/NCBI
|
|
2
|
Alexander BM and Cloughesy TF: Adult
glioblastoma. J Clin Oncol. 35:2402–2409. 2017. View Article : Google Scholar : PubMed/NCBI
|
|
3
|
Jovčevska I, Kočevar N and Komel R: Glioma
and glioblastoma-how much do we (not) know? Mol Clin Oncol.
1:935–941. 2013. View Article : Google Scholar : PubMed/NCBI
|
|
4
|
Moreno M, Pedrosa L, Paré L, Pineda E,
Bejarano L, Martínez J, Balasubramaniyan V, Ezhilarasan R,
Kallarackal N, Kim SH, et al: GPR56/ADGRG1 inhibits mesenchymal
differentiation and radioresistance in glioblastoma. Cell Rep.
21:2183–2197. 2017. View Article : Google Scholar : PubMed/NCBI
|
|
5
|
Chen Q, Cai J, Wang Q, Wang Y, Liu M, Yang
J, Zhou J, Kang C, Li M and Jiang C: Long non-coding RNA NEAT1,
regulated by the EGFR pathway, contributes to glioblastoma
progression through the WNT/β-Catenin pathway by scaffolding EZH2.
Clin Cancer Res. 24:684–695. 2018. View Article : Google Scholar : PubMed/NCBI
|
|
6
|
Wang W, Zhao Z, Wu F, Wang H, Wang J, Lan
Q and Zhao J: Bioinformatic analysis of gene expression and
methylation regulation in glioblastoma. J Neurooncol. 136:495–503.
2017. View Article : Google Scholar : PubMed/NCBI
|
|
7
|
Malumbres M: Cyclin-dependent kinases.
Genome Biol. 15:1222014. View
Article : Google Scholar : PubMed/NCBI
|
|
8
|
Malumbres M and Barbacid M: Cell cycle,
CDKs and cancer: A changing paradigm. Nat Rev Cancer. 9:153–166.
2009. View
Article : Google Scholar : PubMed/NCBI
|
|
9
|
Xi Q, Huang M, Wang Y, Zhong J, Liu R, Xu
G, Jiang L, Wang J, Fang Z and Yang S: The expression of CDK1 is
associated with proliferation and can be a prognostic factor in
epithelial ovarian cancer. Tumour Biol. 36:4939–4948. 2015.
View Article : Google Scholar : PubMed/NCBI
|
|
10
|
Sung WW, Lin YM, Wu PR, Yen HH, Lai HW, Su
TC, Huang RH, Wen CK, Chen CY, Chen CJ and Yeh KT: High
nuclear/cytoplasmic ratio of Cdk1 expression predicts poor
prognosis in colorectal cancer patients. BMC Cancer. 14:9512014.
View Article : Google Scholar : PubMed/NCBI
|
|
11
|
Kim SJ, Nakayama S, Miyoshi Y, Taguchi T,
Tamaki Y, Matsushima T, Torikoshi Y, Tanaka S, Yoshida T, Ishihara
H and Noguchi S: Determination of the specific activity of CDK1 and
CDK2 as a novel prognostic indicator for early breast cancer. Ann
Oncol. 19:68–72. 2008. View Article : Google Scholar : PubMed/NCBI
|
|
12
|
Griesinger AM, Birks DK, Donson AM, Amani
V, Hoffman LM, Waziri A, Wang M, Handler MH and Foreman NK:
Characterization of distinct immunophenotypes across pediatric
brain tumor types. J Immunol. 191:4880–4888. 2013. View Article : Google Scholar : PubMed/NCBI
|
|
13
|
Wang X, Kang DD, Shen K, Song C, Lu S,
Chang LC, Liao SG, Huo Z, Tang S, Ding Y, et al: An R package suite
for microarray meta-analysis in quality control, differentially
expressed gene analysis and pathway enrichment detection.
Bioinformatics. 28:2534–2536. 2012. View Article : Google Scholar : PubMed/NCBI
|
|
14
|
Ritchie ME, Phipson B, Wu D, Hu Y, Law CW,
Shi W and Smyth GK: Limma powers differential expression analyses
for RNA-sequencing and microarray studies. Nucleic Acids Res.
43:e472015. View Article : Google Scholar : PubMed/NCBI
|
|
15
|
Gene Ontology Consortium: Gene Ontology
Consortium: Going forward. Nucleic Acids Res. 43:D1049–D1056. 2015.
View Article : Google Scholar : PubMed/NCBI
|
|
16
|
Majewska E and Szeliga M: AKT/GSK3β
signaling in glioblastoma. Neurochem Res. 42:918–924. 2017.
View Article : Google Scholar : PubMed/NCBI
|
|
17
|
Chen Q and Li W, Wan Y, Xia X, Wu Q, Chen
Y, Lai Z, Yu C and Li W: Amplified in breast cancer 1 enhances
human cholangiocarcinoma growth and chemoresistance by simultaneous
activation of Akt and Nrf2 pathways. Hepatology. 55:1820–1829.
2012. View Article : Google Scholar : PubMed/NCBI
|
|
18
|
Dolma S, Selvadurai HJ, Lan X, Lee L,
Kushida M, Voisin V, Whetstone H, So M, Aviv T, Park N, et al:
Inhibition of dopamine receptor D4 impedes autophagic flux,
proliferation, and survival of glioblastoma stem cells. Cancer
Cell. 29:859–873. 2016. View Article : Google Scholar : PubMed/NCBI
|
|
19
|
Rapp C, Warta R, Stamova S, Nowrouzi A,
Geisenberger C, Gal Z, Roesch S, Dettling S, Juenger S, Bucur M, et
al: Identification of T cell target antigens in glioblastoma
stem-like cells using an integrated proteomics-based approach in
patient specimens. Acta Neuropathol. 134:297–316. 2017. View Article : Google Scholar : PubMed/NCBI
|
|
20
|
Shapiro GI: Cyclin-dependent kinase
pathways as targets for cancer treatment. J Clin Oncol.
24:1770–1783. 2006. View Article : Google Scholar : PubMed/NCBI
|
|
21
|
Chen X, Zhang FH, Chen QE, Wang YY, Wang
YL, He JC and Zhou J: The clinical significance of CDK1 expression
in oral squamous cell carcinoma. Med Oral Patol Oral Cir Bucal.
20:e7–e12. 2015. View Article : Google Scholar : PubMed/NCBI
|
|
22
|
Zhang C, Elkahloun AG, Robertson M, Gills
JJ, Tsurutani J, Shih JH, Fukuoka J, Hollander MC, Harris CC,
Travis WD, et al: Loss of cytoplasmic CDK1 predicts poor survival
in human lung cancer and confers chemotherapeutic resistance. PloS
One. 6:e238492011. View Article : Google Scholar : PubMed/NCBI
|
|
23
|
Tsaur I, Makarević J, Hudak L, Juengel E,
Kurosch M, Wiesner C, Bartsch G, Harder S, Haferkamp A and Blaheta
RA: The cdk1-cyclin B complex is involved in everolimus triggered
resistance in the PC3 prostate cancer cell line. Cancer Lett.
313:84–90. 2011. View Article : Google Scholar : PubMed/NCBI
|
|
24
|
Willder JM, Heng SJ, McCall P, Adams CE,
Tannahill C, Fyffe G, Seywright M, Horgan PG, Leung HY, Underwood
MA and Edwards J: Androgen receptor phosphorylation at serine 515
by Cdk1 predicts biochemical relapse in prostate cancer patients.
Br J Cancer. 108:139–148. 2013. View Article : Google Scholar : PubMed/NCBI
|
|
25
|
Zeestraten EC, Maak M, Shibayama M,
Schuster T, Nitsche U, Matsushima T, Nakayama S, Gohda K, Friess H,
van de Velde CJ, et al: Specific activity of cyclin-dependent
kinase I is a new potential predictor of tumour recurrence in stage
II colon cancer. Br J Cancer. 106:133–140. 2012. View Article : Google Scholar : PubMed/NCBI
|
|
26
|
Hers I, Vincent EE and Tavare JM: Akt
signalling in health and disease. Cell Signal. 23:1515–1527. 2011.
View Article : Google Scholar : PubMed/NCBI
|
|
27
|
Martini M, De Santis MC, Braccini L,
Gulluni F and Hirsch E: PI3K/AKT signaling pathway and cancer: An
updated review. Ann Med. 46:372–383. 2014. View Article : Google Scholar : PubMed/NCBI
|
|
28
|
Guo D, Reinitz F, Youssef M, Hong C,
Nathanson D, Akhavan D, Kuga D, Amzajerdi AN, Soto H, Zhu S, et al:
An LXR agonist promotes glioblastoma cell death through inhibition
of an EGFR/AKT/SREBP-1/LDLR-dependent pathway. Cancer Discov.
1:442–456. 2011. View Article : Google Scholar : PubMed/NCBI
|
|
29
|
Li X, Wu C, Chen N, Gu H, Yen A, Cao L,
Wang E and Wang L: PI3K/Akt/mTOR signaling pathway and targeted
therapy for glioblastoma. Oncotarget. 7:33440–33450.
2016.PubMed/NCBI
|
|
30
|
Manning BD and Cantley LC: AKT/PKB
signaling: Navigating downstream. Cell. 129:1261–1274. 2007.
View Article : Google Scholar : PubMed/NCBI
|
|
31
|
Pestell RG, Albanese C, Reutens AT, Segall
JE, Lee RJ and Arnold A: The cyclins and cyclin-dependent kinase
inhibitors in hormonal regulation of proliferation and
differentiation. Endocr Rev. 20:501–534. 1999. View Article : Google Scholar : PubMed/NCBI
|
|
32
|
Warfel NA, Dolloff NG, Dicker DT, Malysz J
and El-Deiry WS: CDK1 stabilizes HIF-α via direct phosphorylation
of Ser668 to promote tumor growth. Cell Cycle. 12:3689–3701.
View Article : Google Scholar : PubMed/NCBI
|