Introduction
Colorectal cancer (CRC) is ranked as the third most
common cancer in males and second in females, and the fourth
leading cause of cancer-related deaths worldwide (1). For the patients with early CRC,
surgery is the preferred treatment, and adjuvant chemotherapy is
administered to most patients with CRC after surgery to decrease
the risk of recurrence (2).
However, the disease-free and overall survival of CRC patients
warrants further improvement. The elucidation of the molecular
pathogenesis of CRC may greatly contribute to prolong the survival
of CRC patients.
The DNA mismatch repair (MMR) system is important
for the prevention of gene mutations and maintenance of genome
stability (3). The MMR system
includes the hMLH1, hMSH2, hMSH6, and hPSM2 genes, and defects of
the MMR system are caused by deficient MMR genes (dMMR) in tumor
suppressor genes such as APC and p53 which are closely related to
tumorigenesis mutations (4).
Approximately 12–15% of CRC patients display dMMR, whereas 80–90%
of CRC patients exhibit pMMR (5).
Compared with pMMR patients, dMMR patients have a low relapse rate,
long remission period, low metastasis, high survival rate and good
prognosis (6).
The mechanisms by which the MMR genes affect the
pathogenesis of CRC may vary and involve not only important
components of the internal organelles in cells but also important
homeostasis processes, such as energy transfer, material transport,
information identification and signal transduction,
differentiation, apoptosis and immunity (7). Changes in enzymes involved in lipid
metabolism and their pathways are related to the cancer type,
staging, malignancy and therapeutic efficacy (8). Accumulating evidence from basic
studies suggests that the change of lipid levels is associated with
human gene mutations that would influence the treatment and
prognosis of cancer (9). It is
well-known that a high-fat diet can easily cause CRC, and it has
been reported that lipid metabolism is closely related to the
initiation, development and metastasis of CRC (2). However, there have been few studies
that address the difference in lipid metabolism between dMMR and
pMMR CRC. The lack of reliable and precise lipid analysis
technology severely hampers the analysis of the relationship
between lipid metabolism and CRC.
Liquid chromatography-tandem mass spectrometry
(LC/MS) allows the quantitative detection of hundreds of lipids in
tumor cell membranes, an accurate analysis of lipid metabolites and
the roles of lipids present in low abundance in cell signaling and
membrane stability (10). Studies
on lipid metabolism in CRC have revealed that the levels of
phosphatidylethanolamine (PE), phosphatidylserine (PS) and
phosphatidylcholine (PC) metabolites were significantly increased
compared with polyps and healthy controls (11). In the present study, we used the
LC/MS technique to analyze the difference in lipid metabolism
between dMMR and pMMR CRC.
We hereby analyzed the lipid metabolic profiles of
dMMR and pMMR CRC cells using reverse-phase liquid
chromatography-quadrupole-time-of-flight mass spectrometry
(Q-TOF/MS) comprehensively. The present study revealed that the
levels of metastasis-associated lipids and key enzymes in lipid
metabolism were revealed to be higher in the CRC patients with pMMR
compared with the CRC patients with dMMR, and offered novel
insights into potential therapeutic targets and individual
treatment strategies for CRC patients with dMMR and pMMR.
Materials and methods
Cell culture
The human colon carcinoma cancer cell lines SW620,
SW480, HT29, DLD1, HCT116, HCT15 and LoVo were purchased from the
American Type Culture Collection (ATCC; Manassas, VA, USA), and
were cultured in RPMI-1640 medium containing 10% inactivated fetal
bovine serum (FBS) and 1% antibiotics (penicillin and streptomycin)
in 5% CO2 at 37°C. The non-transformed colonic
epithelial NCM460 cells were obtained from INCELL Corporation (San
Antonio, TX, USA) and cultured in M3 media supplemented with 10%
FBS and 1% antibiotics (penicillin and streptomycin) in 5%
CO2 at 37°C. Cells were sub-cultured at a seeding
density of 1×10⁶ cells/ml, and allowed to grow to ~80%
confluence for metabolic and lipidomic profiling experiments. HT29,
SW620, SW480 and NCM460 cells are MMR proficient, whereas HCT116,
LoVo, HCT15, DLD1 cells are MMR deficient. HCT116 cells lack MLH1
(12), whereas LoVo cells are
deficient in MSH2 and MSH6 genes (13,14);
HCT15 and DLD1 cells also lack the MSH6 protein (15). All experiments were performed in
accordance with relevant guidelines and regulations.
Western blotting
Western blotting was performed to evaluate the
protein expression levels of the MLH1, MSH2, MLH6 and PMS2 in the
CRC cells and normal colonic mucosa cells. Briefly, the cells were
harvested by centrifugation at 200 × g for 3 min, washed twice with
ice-cold phosphate-buffered saline (PBS), and lysed with RIPA
buffer with protease inhibitor cocktails. The concentrations of the
protein extracts were assessed using the Coomassie brilliant blue
G-250 method and equalized before loading. A total of 20 µg protein
from each sample were separated on sodium dodecyl
sulfate-polyacrylamide gel electrophoresis (10% SDS-PAGE) gels, and
then transferred to polyvinylidene difluoride (PVDF) membranes. The
membranes were blocked with 5% skim milk and incubated with
specific primary antibodies overnight at 4°C. After the incubation
with the relevant secondary antibodies, the reactive bands were
identified using an enhanced chemiluminescence kit (Amersham
Biosciences, Piscataway, NJ, USA). The relative quantities of each
protein were analyzed by probing the membranes with MLH1 (cat. no.
4256s), MSH2 (cat. no. 2017s), MLH6 (cat. no. 5424s) and PMS2 (cat.
no. 2455s) antibodies (dilution 1:1,000; all were obtained from
Cell Signaling Technology; New England BioLabs Ltd., Hertfordshire,
UK) and using Gel-Pro Analyzer software. Data presented are from
one representative experiment from 3 repeated experiments.
Reverse transcription polymerase chain
reaction (RT-PCR)
Total RNA was extracted from the cell lines using
TRIzol reagent (Invitrogen; Thermo Fisher Scientific, Inc.,
Waltham, MA, USA), according to the manufacturer's protocol. cDNAs
were synthesized using a Thermo-Scientific reverse transcription
kit. Real-time PCR was conducted using the SsoAdvanced™ Universal
SYBR-Green kit, according to the manufacturer's instructions: 95°C
pre-denaturation for 30 sec, 40 cycles at 95°C denaturation for 5
sec, 60°C refolding, and extension for 20 sec, followed by a
dissolution curve analysis (65–95°C in increments of 0.5°C each 2–5
sec). Data represent the mean ± SEM from 3 repeated experiments
with n=3.
Preparation of cell samples
Cells were placed on ice and washed with 1 ml of
ice-cold PBS to remove extracellular metabolites. Cells were then
detached using a cell scraper, and all cells were resuspended in
PBS and centrifuged at 300 × g for 3 min. The culture mediums were
aspirated, and the cells were suspended in PBS and transferred into
1.5 ml (Eppendorf) EP tubes.
Lipid extraction
Samples were extracted using a modified Folch
procedure (16). Briefly, ice-cold
chloroform (1 ml) and methanol (0.5 ml), with 0.1% butylated
hydroxytoluene (BHT) were added to the dried cells and vortexed for
20 sec. The mixture was sonicated in a 4°C water bath for 30 min
and incubated on ice for 60 min with shaking. Phase separation was
induced by the addition of 380 µl of water with 0.1% BHT, followed
by incubation on ice for 10 min with shaking. The mixture was
centrifuged at 18,500 × g for 10 min at 4°C. The mixture was split
into two aliquots, the lower (chloroform) phase was reserved for
lipid analysis using nanoelectrospray ionization LC-MS. The
extracts were passed through a 0.2-µm filter (Whatman, Maidstone,
UK) and evaporated with nitrogen gas. The dried chloroform fraction
was resuspended in 100 µl of methanol-chloroform (9:1, v/v)
containing a 7.5-mM ammonium acetate buffer solution for analysis,
and the dried methanol fraction was used in the derivatization
procedures. All extracts were stored at −80°C until use.
LC-MS lipid metabolite analysis
The UPLC-MS/MS portion of the platform was based on
the ACQUITY Ultra High-Performance LC mass spectrometry system
(Waters Corp., Milford MA, USA), and samples were analyzed using an
electrospray ionization (ESI)-Q-TOF(quadrupole-time-of-flight) mass
analyzer. The dried samples were redissolved in
acetonitrile/isopropanol (v/v, 7:3), and the injection volume was
fixed at 3 µl. One aliquot was analyzed using acidic-positive
ion-optimized conditions, and the other was analyzed using basic
negative ion-optimized conditions in two independent injections
with separate dedicated columns (1.8 µm, 2.1×100 mm; Waters Corp.).
The column was maintained at 45 to 55°C. The flow rate of the
mobile phase was 250 µl/min, and the injection volume was 5.0 µl
Mobile phase A which consisted of acetonitrile/water at a 4/6 ratio
(10 mmol ammonium acetate). Mobile phase B consisted of
acetonitrile/isopropanol at a 1/9 ratio (10 mmol ammonium acetate).
Extracts reconstituted in acid were eluted using a gradient of
water and methanol containing 0.1% formic acid, and the basic
extracts, which also used the water/methanol solvent, contained 6.5
mM ammonium bicarbonate. The MS analysis alternated between MS and
data-dependent MS/MS scans using dynamic exclusion, and the scan
range was 65–1,000 mass-to-charge ratios (m/z). All types of gas
used nitrogen.
Full-scan spectra were collected at m/z values
ranging from 50–1,200 for positive and negative ion modes. The mass
spectra of each sample were acquired in profile mode over a 2-min
period. The capillary temperature was set to 200°C. The capillary
and tube-lens voltages were set to 32 and 95 V, respectively, in
positive ion mode and to −41 and −93 V in negative ion mode. The
target automatic gain control values for full MS and multistage MS
were 30,000 and 1,000, respectively. MS/MS was applied to pooled
samples to identify lipid species. The normalized collision energy
was set to 35%, with an isolated width of 1.5 m/z units and a
charge state of 1. The dynamic exclusion parameters were a repeat
duration of 60 sec, exclusion duration of 60 sec, and an exclusion
list size of 50. Data represented the mean ± SEM from 3 repeated
experiments with n=3.
Data processing and statistical
analysis
UPLC-ESI-TOFMS data were processed using Progenesis
QI software (Waters Corp., Newcastle, UK). Metabolites were
identified by referring to the Lipid Maps Database (www.lipidmaps.org) and the Human Metabolome Database
(http://www.hmdb.ca/). Data sheets were obtained
from Progenesis QI software, and the absolute intensities of all
identified compounds were recalculated to the relative abundances
of lipid molecules. The resulting datasets from the positive and
negative ion modes were further combined into one dataset prior to
the statistical analysis. A partial least-square discriminant
analysis (PLS-DA) was performed to evaluate differences between
dMMR and pMMR colon cancer cell lines. The highest impact on group
clustering was identified in the variable importance (VIP) plots
(VIP >1). The expression of PLD1, lipin 1, SCD1 and DGAT1 was
compared among the 8 cell lines with one-way analysis of variance
(ANOVA) followed by Newman-Keuls post hoc test. Additionally, an
unpaired Student's t-test (P<0.05) was applied to the chemical
shifts and used to assess the significance of differences in each
metabolite. The metabolites in two groups that exhibited both a VIP
>1 and P<0.05 were identified as significantly different.
Data are presented as the means ± SEM. Statistical analyses were
performed using SPSS software (version 16.0; SPSS, Inc., Chicago,
IL, USA).
Results
Protein expression of MMR of the 8
cell lines
The 8 cell lines were examined by western blotting
to assess the protein levels of MMR. The western blot analysis
confirmed the HCT116 cells were deficient in MLH1 gene, LoVo cells
were deficient in MSH2/MSH6 and DLD1 and HCT15 cells were deficient
in MSH6. Thus, HCT116, LoVo, HCT15 and DLD1 were dMMR cells. In
contrast, the presence of all 4 MMR proteins in SW620, SW480, HT29
and NCM460 indicated that all the 4 cell lines were pMMR CRC cells
(Fig. 1). Therefore, the
aforementioned 8 cell lines were divided into dMMR and pMMR cells
in the subsequent experiments.
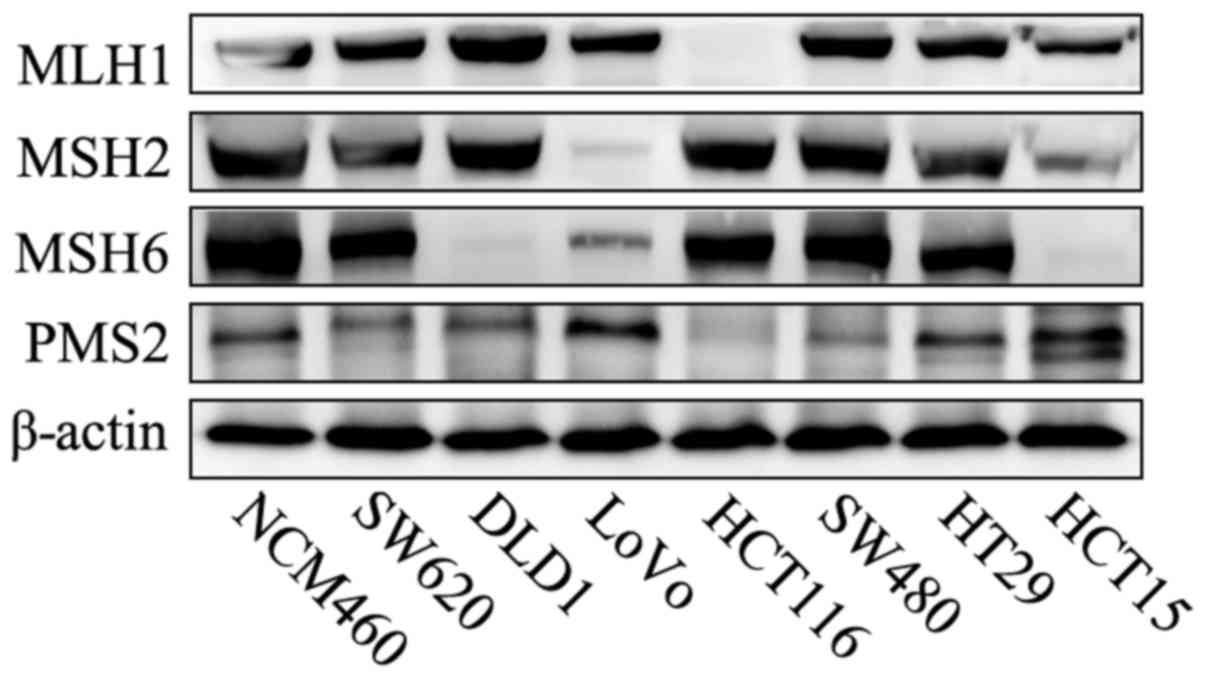 | Figure 1.Western blot analysis of the MMR
protein in CRC cell lines. NCM460, SW620, SW480 and HT29 were pMMR
cells, and they expressed MLH1, PMS2, MSH2 and MSH6. In contrast,
HCT116, LoVo, DLD1 and HCT15 were dMMR cells: HCT116 was deficient
in MLH1 and PMS2, LoVo was deficient in MSH2 and MSH6, and both
DLD1 and HCT15 were deficient in MSH6. MMR, DNA mismatch repair;
CRC, colorectal cancer; pMMR, patients proficient in DNA MMR; dMMR,
patients deficient in DNA MMR. |
Comparative lipidomic and metabolic
profiling of dMMR and pMMR cells
The lipidomic profiles significantly differed
between dMMR and pMMR CRC cells. We detected a diverse range of
lipid species to obtain models that enabled the discrimination of
the 2 different cell types and identified potential biomarkers for
dMMR and pMMR CRC cells. The LC-MS/MS lipidomic profiling of dMMR
and pMMR cells detected 157 lipid molecules in 19 lipid classes,
included phospholipids (85 molecules), sphingolipids (11
molecules), and glycerolipids (61 molecules) (Table I). A total of 157 lipids are
displayed in the heat maps of the dMMR and pMMR cells showing the
fold changes in altered lipids in dMMR cells compared with those in
pMMR cells. The lipidome presented numerous and obvious alterations
in multiple lipid classes (Fig. 2),
including glycerolipids (GL), glycerophospholipids (GP) and
sphingolipids (SP), suggesting that these 3 types of lipid species
exhibit different biological behaviors in the dMMR and pMMR
cells.
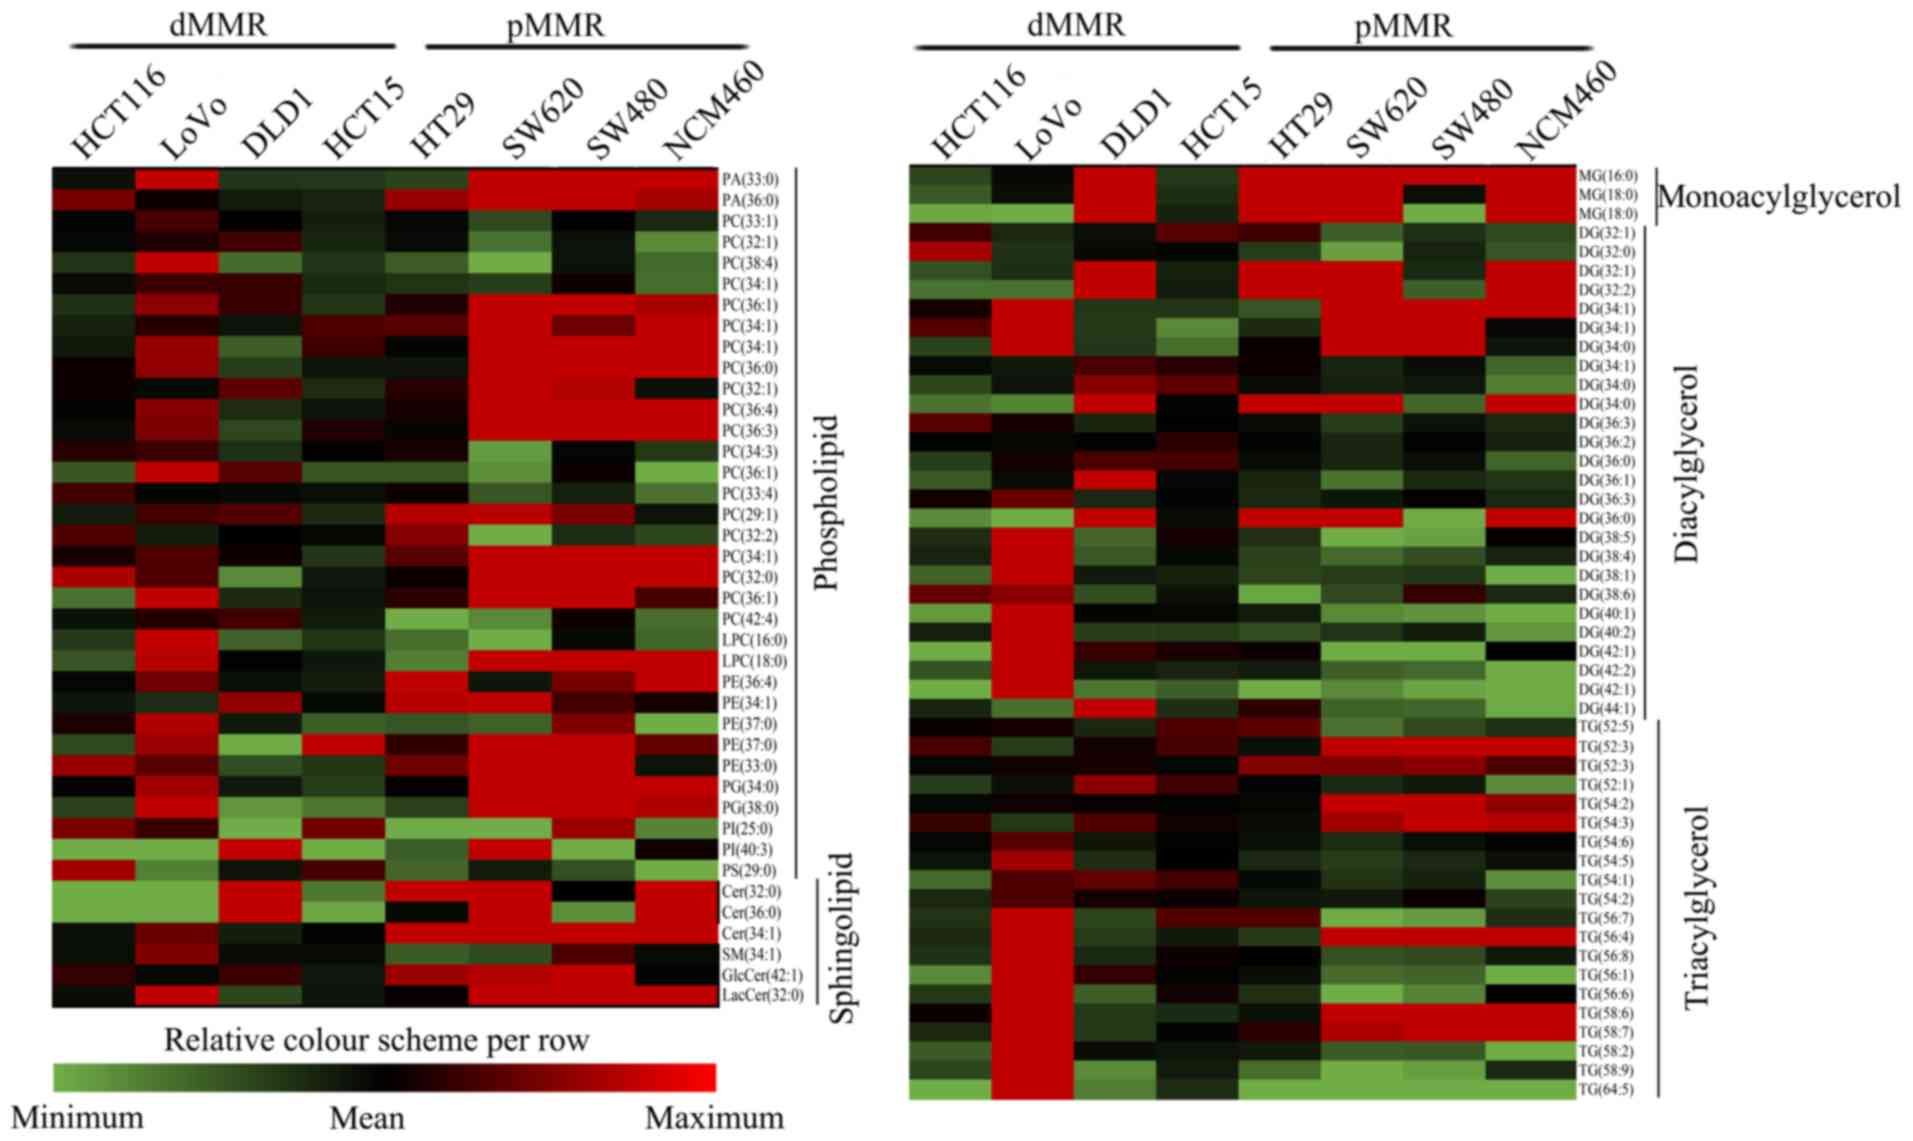 | Figure 2.Comparative lipid profile expression
in dMMR and pMMR cells. The heat maps revealed all modified lipid
species in dMMR and pMMR cells. The color bars represent the log2
value of the ratio for each lipid species and only statistically
significant changes are shown (VIP >1, P<0.05). Statistical
analysis for individual lipid species data were based on the
unpaired two-tailed Student's t-test. PA, phosphatidic acid; PC,
phosphatidylcholine; PE, phosphatidylethanolamine; PG,
phosphatidylglycerol; PI, phosphatidylinositol; PS,
phosphatidylserine. LPC, lysophosphatidylcholine; MG,
monoacylglycerol; DG, diacylglycerol; TG, triacylglycerol; Cer,
ceramide; SM, sphingomyelin; GlcCer, glucosylceramide; LacCer,
lactosylceramide; pMMR, patients proficient in DNA MMR; dMMR,
patients deficient in DNA MMR. |
 | Table I.Quantitated lipid classes and numbers
in dMMR and pMMR colorectal cancer cells. |
Table I.
Quantitated lipid classes and numbers
in dMMR and pMMR colorectal cancer cells.
| Lipid category | Lipid class | Abbreviation | No. of lipid
species |
|---|
| Phospholipid |
Phosphatidylcholine | PC | 27 |
|
|
Alkylphosphatidylcholine | PC(O) | 9 |
|
|
Alkenylphosphatidylcholine | PC(P) | 5 |
|
|
Phosphatidylethanolamine | PE | 18 |
|
|
Alkylphosphatidylethanolamine | PE(O) | 3 |
|
|
Phosphatidylinositol | PI | 3 |
|
|
Phosphatidylserine | PS | 1 |
|
|
Alkylphosphatidylserine | PS(O) | 4 |
|
|
Alkenylphosphatidylserine | PS(P) | 3 |
|
|
Phosphatidylglycerol | PG | 8 |
|
| Phosphatidic
acid | PA | 4 |
| Sphingolipid | Sphingomyelin | SM | 5 |
|
| Ceramide | Cer | 2 |
|
| Glycosylceramide | Gcer | 1 |
|
| Lactosylceramide | Lcer | 3 |
| Glycerolipide | Monoacylglycerol | MG | 3 |
|
| Diacylglycerol | DG | 31 |
|
|
Triacylglycerol | TG | 27 |
| Total lipids |
|
| 157 |
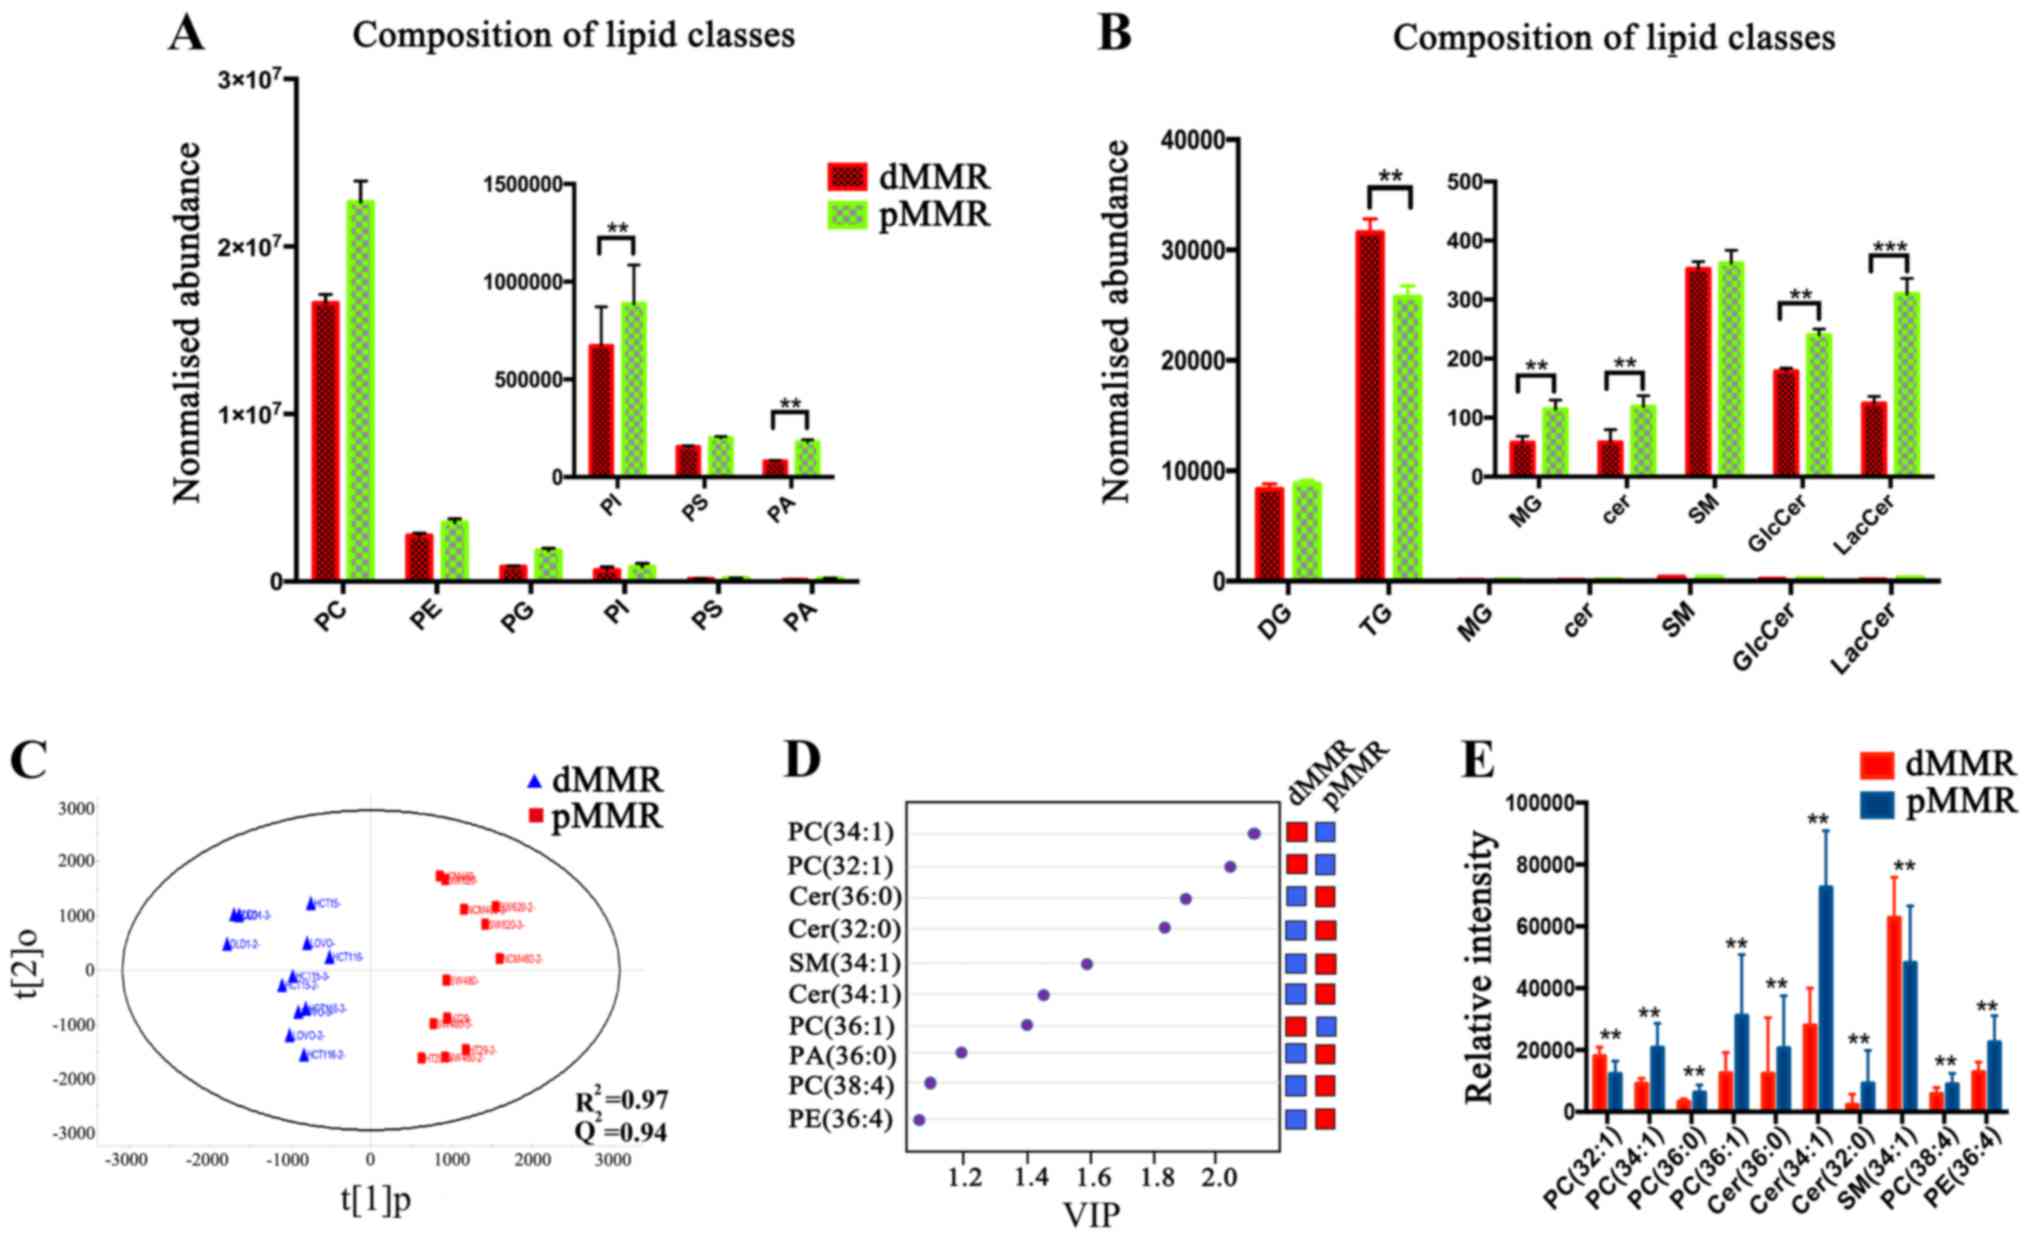
For all lipid classes, the masses of the lipid
species altered in pMMR cells were much greater than those in dMMR
cells. The two main lipid classes detected in dMMR and pMMR cells
were phosphatidylcholine (PC) and phosphatidylethanolamine (PE)
(Fig. 3A). Significantly higher
levels (~2-fold) of the phosphatidylinositol (PI) class were
detected in pMMR cells than those in dMMR cells, and a similar
trend was observed in the phosphatidic acid (PA) (Fig. 3A). Ceramide (Cer), the center of the
sphingolipid metabolism pathway, also exhibited the same trend
(Fig. 3B). Cer levels were
significantly decreased in dMMR cells. Furthermore, the levels of
the downstream metabolites of Cer, including glucosylceramide
(GlcCer) and galactosylceramide (LacCer), were markedly decreased
in the dMMR cells (Fig. 3B).
We compared the composition of the lipidomes between
the dMMR and pMMR cells, and the OPLS-DA score plot further
revealed the obvious and distinctive metabolic clusters between
these 2 groups. As shown in Fig.
3C, the predicted residual sum of square (PRESS) was 0.4018 in
the positive ion mode, indicating that the metabolites exhibited an
intrinsic clustering pattern. Thirty-six significantly
distinguished lipids were observed in the two groups, which
satisfied the requirements of a VIP >1, a fold change and P≤0.05
according to Student's t-test, which contributed to the
characterization of differences between dMMR and pMMR cells, and
the detailed information on their identification is listed in
Table II. As shown in Fig. 3D, 10 types of lipids exhibited the
most significant changes between dMMR and pMMR cells. These 10
lipids were PC (34:1), PC (32:1), Cer (32:0), Cer (36:0), Cer
(34:1), PC (36:1), PC (36:0), PC (38:4), SM (34:1) and PE (36:4).
The levels of PC (34:1), PC (36:0), PC (36:1), Cer (32:0), Cer
(36:0), Cer (34:1) and PC (38:4) in pMMR CRC cells were
significantly increased compared with those in dMMR cells, whereas
the levels of PC (32:1) and SM (34:1) were significantly elevated
in dMMR CRC cells compared with those in pMMR cells. The trends in
the changes in the levels of these 10 lipids between the dMMR and
pMMR CRC cells are shown in Fig.
3E. Notably, the levels of SPs [Cer (32:0), Cer (34:1)] and GPs
[PC (34:1), PC (36:0), PC (36:1) and PC (38:4)] were significantly
increased in pMMR cells compared with those in dMMR cells.
| Table II.Identification of significantly
altered lipid species from dMMR and pMMR cells, along with P-values
and relative changes. |
Table II.
Identification of significantly
altered lipid species from dMMR and pMMR cells, along with P-values
and relative changes.
| Ion mode | Ion form | Metabolite | Molecular
formula | M/Z | P-value | Fold change | VIP |
|---|
| (+) |
[M+H]+ | PA(36:1) | C39H75O7P | 709.5140275 | 2.16E-06 | 1.84 | 1.84 |
| (+) |
[M+H]+ | PC(32:0) | C40H82NO7P | 720.5904492 | 0.0009 | 2.01 | 1.87 |
| (+) |
[M+H]+ | PC(32:1) | C40H80NO7P | 718.5711243 | 0.0135 | 1.56 | 1.68 |
| (+) |
[M+H]+ | PC(32:2) | C40H76NO8P | 730.5384427 | 0.0344 | 1.32 | 1.39 |
| (+) |
[M+H]+ | PC(34:1) | C42H84NO7P | 746.6058638 | 9.20E-06 | 2.29 | 1.97 |
| (+) |
[M+H]+ | PC(34:2) | C42H82NO7P | 744.5898594 | 7.20E-05 | 1.68 | 1.63 |
| (+) |
[M+H]+ | PC(34:3) | C42H78NO8P | 778.5360776 | 0.0323 | 1.30 | 1.4 |
| (+) |
[M+H]+ | PC(36:0) | C44H88NO8P | 772.6191553 | 0.0004 | 1.94 | 1.76 |
| (+) |
[M+H]+ | PC(36:1) | C44H88NO7P | 774.6343973 | 0.0019 | 2.49 | 1.73 |
| (+) |
[M+H]+ | PC(36:3) | C44H84NO7P | 792.5829337 | 9.20E-05 | 2.18 | 1.49 |
| (+) |
[M+H]+ | PC(36:4) | C44H82NO7P | 790.568157 | 3.26E-05 | 1.89 | 1.33 |
| (+) |
[M+H]+ | PC(38:4) | C46H84NO8P | 832.5822233 | 0.0231 | 1.81 | 1 |
| (+) |
[M+H]+ | PC(34:1) | C42H82NO7P | 766.5693969 | 0.0014 | 1.71 | 1.32 |
| (+) |
[M+H]+ | PC(32:1) | C40H78NO8P | 732.5557817 | 0.0017 | 1.47 | 1.39 |
| (+) |
[M+H]+ | PC(34:1) | C42H82NO8P | 760.5882343 | 0.0028 | 1.37 | 1.85 |
| (+) |
[M+H]+ | LysoPC(16:0) | C24H50NO7P | 496.3394888 | 0.0207 | 1.81 | 1.23 |
| (+) |
[M+H]+ | LysoPC(18:0) | C26H54NO6P | 508.3755192 | 0.0124 | 3.20 | 1.12 |
| (+) |
[M+H]+ | PE(34:1) | C39H76NO8P | 740.5532847 | 0.0028 | 1.55 | 1.26 |
| (+) |
[M+H]+ | PE(36:4) | C41H74NO7P | 724.5283148 | 0.0037 | 1.48 | 1.36 |
| (+) |
[M+H]+ | PE(32:1) | C37H72NO8P | 690.5339367 | 0.0082 | 1.34 | 1.34 |
| (+) |
[M+H]+ | PG(34:0) | C40H79O10P | 768.5763566 | 8.27E-05 | 2.13 | 1.72 |
| (+) |
[M+H]+ | PG(38:0) | C44H87O10P | 824.6407199 | 0.0083 | 1.99 | 1.89 |
| (+) |
[M+H]+ | SM(34:2) | C39H77N2O6P | 701.5585441 | 0.0229 | 1.30 | 1.81 |
| (+) |
[M+H]+ | Cer(32:0) | C32H65NO3 | 529.5294728 | 0.0368 | 4.05 | 1.21 |
| (+) |
[M+H]+ | Cer(36:0) | C36H73NO3 | 590.5496807 | 0.0172 | 1.68 | 1.02 |
| (+) |
[M+H]+ | LacCer(32:0) | C44H85NO13 | 818.6013832 | 8.96E-05 | 2.60 | 1.41 |
| (−) |
[M+H]− | PC(36:0) | C44H88NO7P | 754.6076572 | 0.0295 | 1.21 | 1.7 |
| (−) |
[M+H]− | PC(38:2) | C46H88NO8P | 858.6227992 | 0.0145 | 1.55 | 1.14 |
| (−) |
[M+H]− | PC(38:4) | C46H86NO7P | 776.5934588 | 0.0021 | 1.77 | 1.93 |
| (−) |
[M+H]− | PA(38:2) | C41H67O8P | 763.4559916 | 0.0427 | 17.79 | 1.03 |
| (−) |
[M+H]− | PS(38:0) | C44H88NO9P | 804.6133866 | 0.0120 | 1.31 | 1.73 |
| (−) |
[M+H]− | PE(36:3) | C45H84NO7P | 780.5900251 | 0.0195 | 1.35 | 1.04 |
| (−) |
[M+H]− | SM(34:1) | C39H79N2O6P | 747.564329 | 0.0290 | 1.51 | 1.08 |
| (−) |
[M+H]− | SM(40:2) | C45H90N2O6P+ | 784.6425057 | 0.0134 | 2.00 | 1.23 |
| (−) |
[M+H]− | LacCer(34:1) | C46H87NO13 | 906.6192601 | 0.0057 | 1.55 | 1.46 |
| (−) |
[M+H]− | LacCer(36:2) | C48H89NO13 | 886.6217938 | 0.0137 | 1.34 | 1.05 |
Verification of the relevance of the
association of the mRNA expression levels of SCD1, SCD5, DGAT1, PAP
and PLD1 with the invasion and metastasis of dMMR and pMMR
cells
Since patients with pMMR are more likely to have
metastases and a higher level of PC, PA, and ceramide than those
with dMMR, and lipid metabolism plays a pivotal role in cancer
metastasis (17), we subsequently
investigated the change of key enzymes involved in lipid metabolism
associated with metastasis, which are stearoyl-CoA desaturases
(SCD1), diacylglycerol acyltransferase 1 (DGAT1), lipin 1 and
phospholipase D (PLD), for the mRNA analysis of RT-PCR (17). The expression levels of SCD1, DGAT1,
lipin 1 and PLD1 in 7 different CRC cell lines and intestinal
mucosa cells were detected using RT-PCR. SCD1 is closely related to
the stage, grade and lymph node metastasis of renal cell carcinoma,
and SCD1 suppression could make cancer patients more sensitive to
various therapies (18). As shown
in Fig. 4, significantly increased
levels of SCD1 were detected in HT29 and SW620 cells compared with
those in LoVo, DLD1 and HCT15 cells. Diacylglycerol acyltransferase
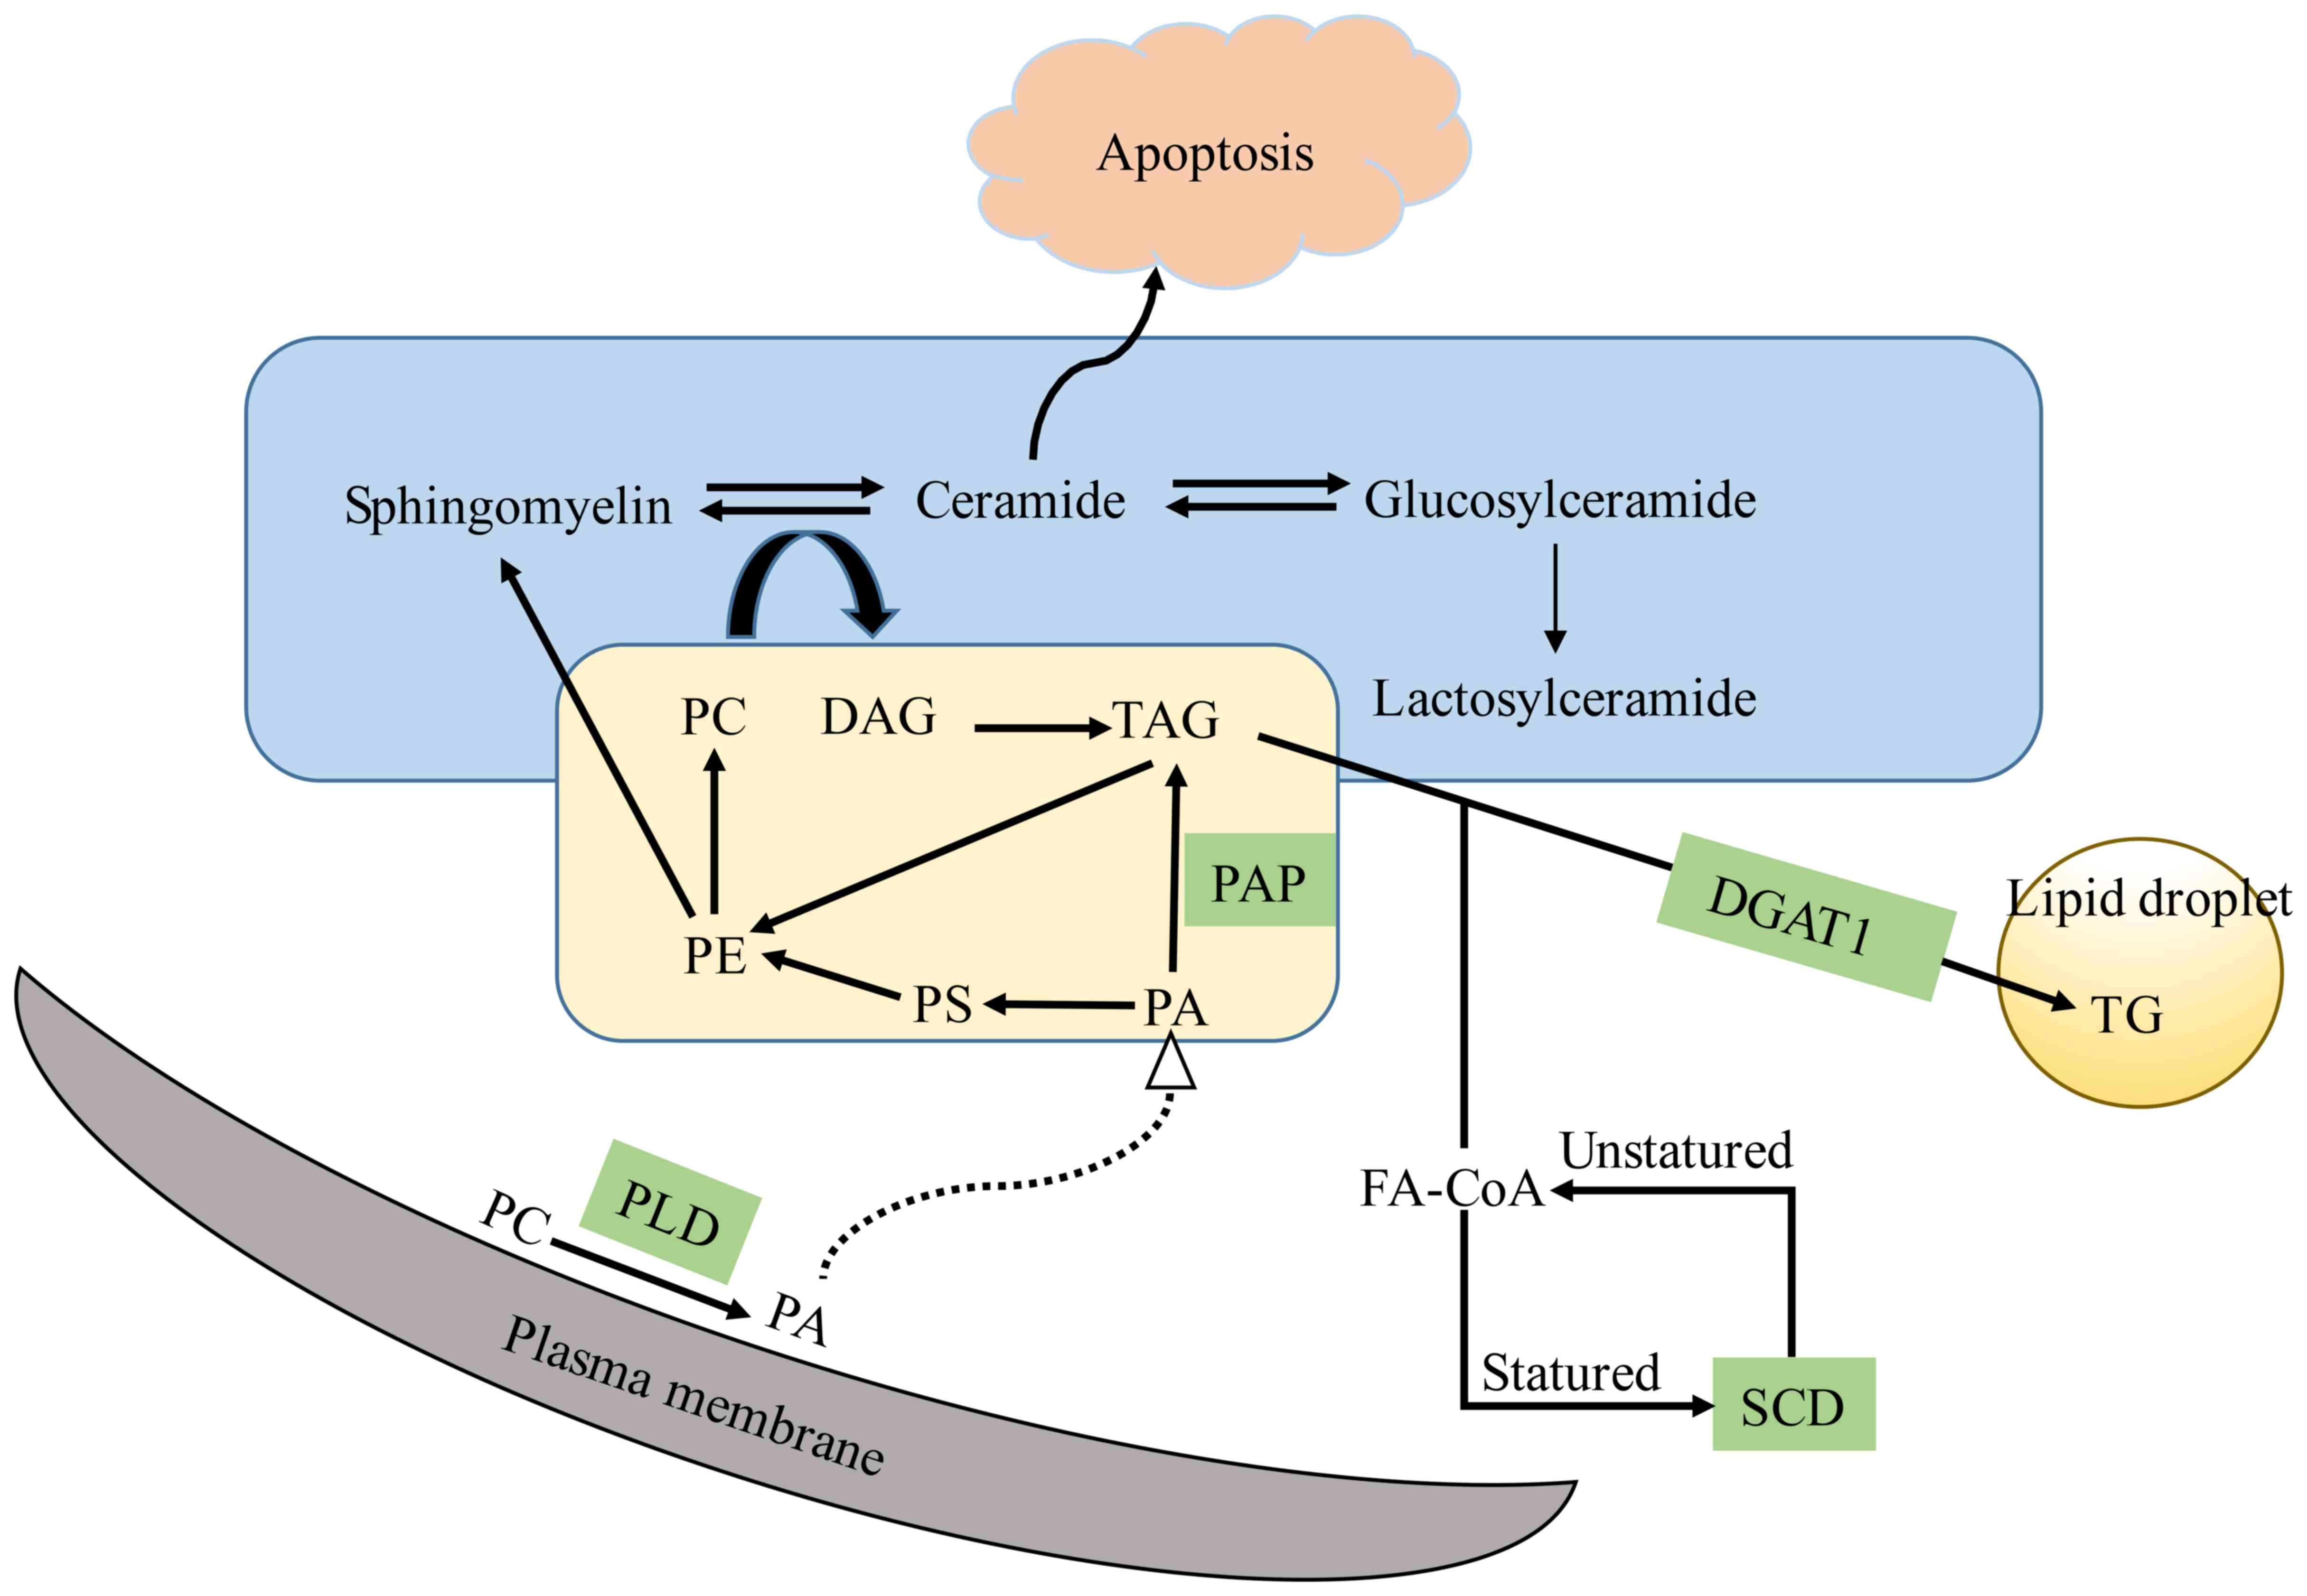
1 (DGAT1) is the enzyme at the final step in TG synthesis (Fig. 5). The overexpression of DGAT1 has
been revealed to inhibit the growth and aggressiveness of tumor
cells, and it is a negative regulator of malignant progression of
the tumor (19). Notably, the level
of DGAT1 expression was significantly increased in dMMR cells
compared with that in pMMR cells, except for DLD1 cells (Fig. 4). PAP is coded by the lipin 1 gene,
which is a negative regulator of the malignant progression of the
tumor (20,21). The expression of lipin 1 in dMMR
cells was higher than that in pMMR cells (Fig. 4). PLD1 has a direct effect on cell
migration, and is a key enzyme involved in cell invasion and
metastasis (19). PLD1 expression
was higher in pMMR cells (HT29 and SW480 cells) than in dMMR cells
(Fig. 4).
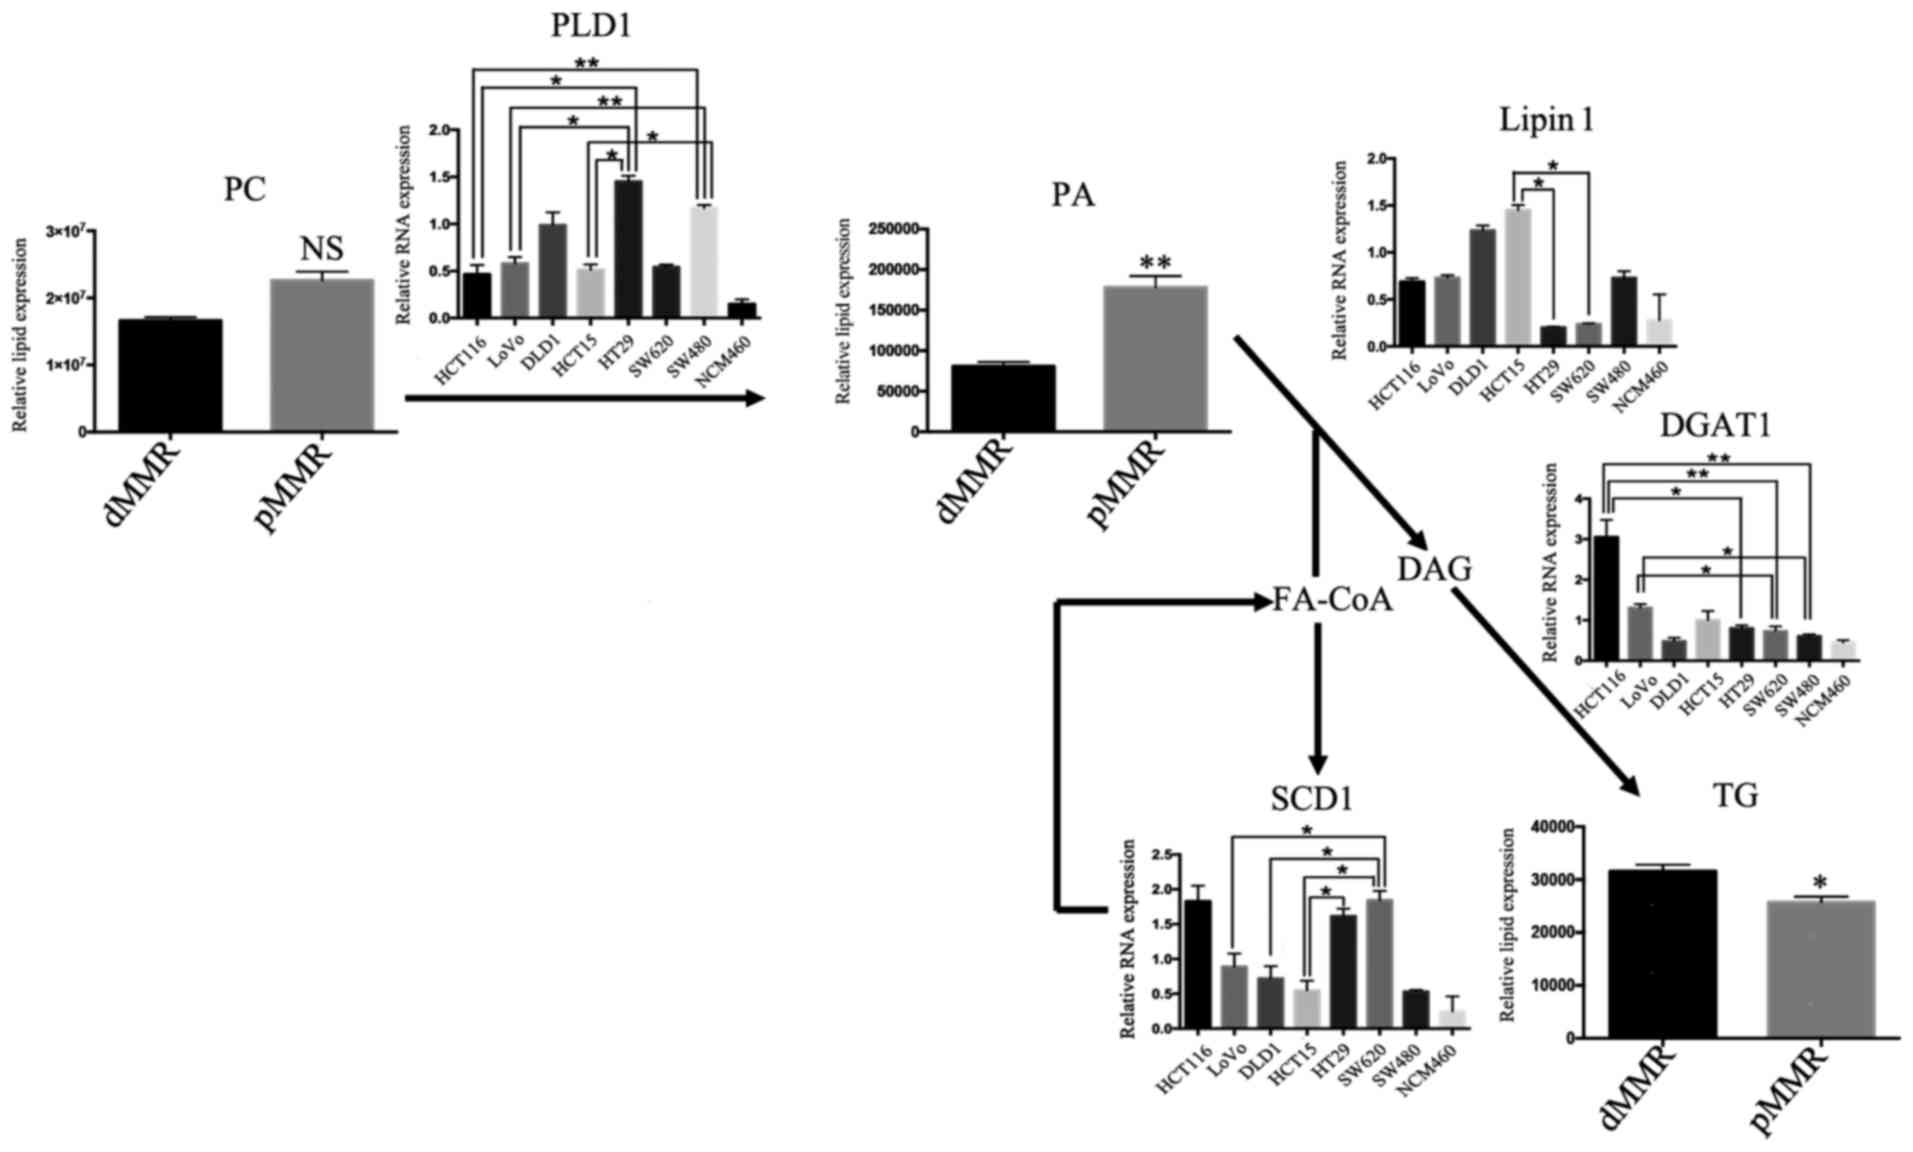 | Figure 4.Levels of lipogenic invasion and
metastasis gene mRNAs in lipid biosynthetic pathways. Levels of
lipogenic gene mRNAs in the lipidomic network in dMMR and pMMR CRC
cells. The gene with the highest invasion and metastasis was
selected as the representative of each pathway. Data represent sums
of ion peak heights of all lipid molecules within each class and
are illustrated as the mean ± SD. The statistical significance of
the differences between measurements in the dMMR and pMMR cells was
assessed using a non-paired Student's t-test with FDR adjustment.
The expression of PLD1, lipin 1, SCD1 and DGAT1 was compared among
the 8 cell lines with one-way analysis of variance (ANOVA) followed
by Newman-Keuls post hoc test. *P<0.05; **P<0.01; NS, not
statistically significant. Abbreviations are described in Table I. The PLD1, PLD2, lipin 1, DGAT1,
and SCD1 genes with the highest invasion and metastasis, and the
expression in 8 cell lines by RT-PCR. PLD hydrolyzes PC to produce
PA. DGAT is a key enzyme involved in the formation of TG by DAG and
FA-CoA. The dephosphorylation of PA could form DAG, which
represents one of the steps in TG synthesis. SCD is an important
enzyme involved in the synthesis of FAs. PA, phosphatidic acid; PC,
phosphatidylcholine; PE, phosphatidylethanolamine; PG,
phosphatidylglycerol; PI, phosphatidylinositol; PS,
phosphatidylserine. LPC, lysophosphatidylcholine; MG,
monoacylglycerol; DG, diacylglycerol; TG, triacylglycerol; Cer,
ceramide; SM, sphingomyelin; GlcCer, glucosylceramide; LacCer,
lactosylceramide; pMMR, patients proficient in DNA MMR; dMMR,
deficient in DNA MMR. |
Discussion
With improvement of molecular biological techniques,
detecting MMR genes has become relatively simple and accurate. MMR
plays an important role in the development and progression of CRC,
and the detection of MMR genes is of great significance in the
prevention, early diagnosis and treatment of CRC (7,20).
Compared to dMMR patients, pMMR patients have early metastases and
poor prognosis. Lipid metabolism plays an important role in tumor
invasion and metastasis, and alterations in the metabolic program
are crucial in cancer metastasis (5). However, the impact of the lipidome on
MMR is largely unknown. In this study, MMR lipid metabolites were
detected using UPLC-MS, and the differences in the levels of lipid
metabolites were also screened. This is the first study to analyze
the difference of lipid metabolic profiles between dMMR and pMMR
cells. According to the OPLS-DA score plot, a VIP >1 and
P<0.05 were obtained for 157 different metabolites, which was
used to differentiate human colon epithelial cells from dMMR and
pMMR cells, suggesting two different categories of membrane lipid
components. Forty-six significantly different metabolites were
identified, and the levels of the main classes of GL, GP and SP
metabolites were significantly higher in pMMR cells than dMMR
cells.
The levels of membrane phospholipids, including PC,
PE, PI, SM and Cer, were higher in cancer tissues than those in
normal tissue samples, particularly in tumor tissues with higher
invasiveness (20,21). Indeed, PC has been used as a marker
of membrane proliferation in tumors or as a predictive biomarker
for monitoring the tumor response (22). In our study, the levels of most
phospholipids were higher in pMMR CRC cells than those in dMMR
cells. These lipids (PS 18:0/20:4, PC 18:0/20:4) significantly
increased the invasive ability of the pMMR cells, suggesting that
they represent potential biomarkers for metastasis. Overexpression
of fatty acid synthase plays an important role in tumorigenesis and
de novo synthesis of fatty acids is required for the rapid
proliferation of cancer cells (23).
As shown in Fig. 5,
the enzymes associated with lipid metabolism play an important role
in the change of membrane lipid levels in dMMR and pMMR cells.
Lipid metabolism plays an important role in the development of
cancer, since lipid metabolism is regulated to satisfy the
increasing energy needs (17).
Therefore, the primary tumor transfers to the metastatic site
through the actions of a number of metabolic enzymes. The prognosis
of CRC patients with pMMR is better than CRC patients with dMMR,
which is associated with less invasion and distant metastasis in
CRC patients with dMMR, and SCD, PAP, PLD and DGAT1 are associated
with tumor invasion and metastasis (17). In our study, pMMR cells (HT29 and
SW620 cells) were found to express a higher level of PLD but a
lower level of DGAT1, and pMMR cells (HT29 and SW480 cells) were
also found to express a higher level of SCD1. Through the study of
different enzymes involved in lipid metabolism, we may identify
potential anti-metastasis targets in the therapy of patients with
pMMR.
In this study, the PLS regression model was
successfully used to distinguish between dMMR and pMMR cells with
high predictive accuracy. Lipidomic and metabolic methods offer an
in-depth understanding of the alterations in metabolism of CRC.
This study also supplied valuable new information related to CRC
divided into dMMR and pMMR types and applied a completely different
in-depth strategy to identify the most suitable treatment
strategies for patients with dMMR and pMMR CRCs in the area of
standardized treatment based on the development of individualized
treatment programs and the development of potential therapeutic
drugs. The underlying mechanisms of MMR genes in tumor cells, such
as the apoptosis-related mechanism, are still unclear. Researchers
have not clearly determined whether other genes located upstream
and downstream of the MMR pathway may represent new therapeutic
targets. DNA MMR genes are neither oncogenes nor tumor-suppressor
genes. Further research is warranted to understand the relationship
between the DNA MMR genes and oncogene/tumor-suppressor genes and
to determine why patients with pMMR CRC are resistant to
chemotherapeutic drugs and other treatments.
In conclusion, in the present study, we used a
lipidomics profiling experiment to analyze the difference in lipid
metabolism between dMMR and pMMR cells. Our data revealed that 10
types of lipids exhibited the most significant changes between dMMR
and pMMR cells. Thus, elucidating the molecular basis of the
alterations in these genes is important to better understand the
differences in the pathophysiology of dMMR and pMMR CRC patients,
identify different MMR gene deletions to develop a better treatment
plan for patients, and identify potential therapeutic targets. To
the best of our knowledge, we are the first to reveal that the
levels of metastasis- associated lipids and key enzymes in lipid
metabolism are found to be higher in the CRC patients with pMMR
compared with the CRC patients with dMMR. Our discovery provided
the identification of potential anti-metastasis targets in the
therapy of patients with pMMR, and also personalized therapy for
patients with pMMR.
Acknowledgements
Not applicable.
Funding
The present study was supported by grants from the
Qian Ke He LH (2016) 7195 and Qian Ke He JC (2016) 1094.
Availability of data and materials
The datasets used during the present study are
available from the corresponding author upon reasonable
request.
Authors' contributions
WP, YLZ and QL conceived and designed the study. WP,
SST, YZX, LW, DQ, CC, YYL, CQL, ZLL and YL performed the
experiments. WP wrote the manuscript. WP, YLZ, and QL reviewed and
edited the manuscript. All authors read and approved the manuscript
and agree to be accountable for all aspects of the research in
ensuring that the accuracy or integrity of any part of the work are
appropriately investigated and resolved.
Ethics approval and consent to
participate
Not applicable. This study does not contain any
studies with human participants or animals performed by any of the
authors.
Patient consent for publication
Not applicable.
Competing interests
The authors declare that they have no competing
interests.
References
|
1
|
Siegel RL, Miller KD and Jemal A: Cancer
Statistics, 2017. CA Cancer J Clin. 67:7–30. 2017. View Article : Google Scholar : PubMed/NCBI
|
|
2
|
Bockelman C and Glimelius B: Need for
adjuvant chemotherapy after colon cancer surgery-has it decreased?
Acta Oncol. 56:629–633. 2017. View Article : Google Scholar : PubMed/NCBI
|
|
3
|
Hewish M, Lord CJ, Martin SA, Cunningham D
and Ashworth A: Mismatch repair deficient colorectal cancer in the
era of personalized treatment. Nat Rev Clin Oncol. 7:197–208. 2010.
View Article : Google Scholar : PubMed/NCBI
|
|
4
|
Lee K, Tosti E and Edelmann W: Mouse
models of DNA mismatch repair in cancer research. DNA Repair.
38:140–146. 2016. View Article : Google Scholar : PubMed/NCBI
|
|
5
|
Kawakami H, Zaanan A and Sinicrope FA:
Microsatellite instability testing and its role in the management
of colorectal cancer. Curr Treat Options Oncol. 16:302015.
View Article : Google Scholar : PubMed/NCBI
|
|
6
|
Tejpar S, Saridaki Z, Delorenzi M, Bosman
F and Roth AD: Microsatellite instability, prognosis and drug
sensitivity of stage II and III colorectal cancer: More complexity
to the puzzle. J Natl Cancer Inst. 103:841–844. 2011. View Article : Google Scholar : PubMed/NCBI
|
|
7
|
Supek F and Lehner B: Differential DNA
mismatch repair underlies mutation rate variation across the human
genome. Nature. 521:81–84. 2015. View Article : Google Scholar : PubMed/NCBI
|
|
8
|
Ray U and Roy SS: Aberrant lipid
metabolism in cancer cells-the role of oncolipid-activated
signaling. FEBS J. 285:432–443. 2018. View Article : Google Scholar : PubMed/NCBI
|
|
9
|
Beloribi-Djefaflia S, Vasseur S and
Guillaumond F: Lipid metabolic reprogramming in cancer cells.
Oncogenesis. 5:e1892016. View Article : Google Scholar : PubMed/NCBI
|
|
10
|
Wenk MR: Lipidomics: New tools and
applications. Cell. 143:888–895. 2010. View Article : Google Scholar : PubMed/NCBI
|
|
11
|
Deng L, Gu H, Zhu J, Nagana Gowda GA,
Djukovic D, Chiorean EG and Raftery D: Combining NMR and LC/MS
Using Backward Variable Elimination: Metabolomics Analysis of
Colorectal Cancer, Polyps, and Healthy Controls. Anal Chem.
88:7975–7983. 2016. View Article : Google Scholar : PubMed/NCBI
|
|
12
|
Cannavo E, Marra G, Sabates-Bellver J,
Menigatti M, Lipkin SM, Fischer F, Cejka P and Jiricny J:
Expression of the MutL homologue hMLH3 in human cells and its role
in DNA mismatch repair. Cancer Res. 65:10759–10766. 2005.
View Article : Google Scholar : PubMed/NCBI
|
|
13
|
Drummond JT, Genschel J, Wolf E and
Modrich P: DHFR/MSH3 amplification in methotrexate-resistant cells
alters the hMutSalpha/hMutSbeta ratio and reduces the efficiency of
base-base mismatch repair. Proc Natl Acad Sci USA. 94:10144–10149.
1997. View Article : Google Scholar : PubMed/NCBI
|
|
14
|
Kantelinen J, Kansikas M, Korhonen MK,
Ollila S, Heinimann K, Kariola R and Nyström M: MutSbeta exceeds
MutSalpha in dinucleotide loop repair. Br J Cancer. 102:1068–1073.
2010. View Article : Google Scholar : PubMed/NCBI
|
|
15
|
Umar A, Koi M, Risinger JI, Glaab WE,
Tindall KR, Kolodner RD, Boland CR, Barrett JC and Kunkel TA:
Correction of hypermutability, N-methyl-N'-nitro-N-nitrosoguanidine
resistance, and defective DNA mismatch repair by introducing
chromosome 2 into human tumor cells with mutations in MSH2 and
MSH61. Cancer Res. 57:3949–3955. 1997.PubMed/NCBI
|
|
16
|
Folch J, Lees M and Sloane stanley GH: A
simple method for the isolation and purification of total lipides
from animal tissues. J Biol Chem. 226:497–509. 1957.PubMed/NCBI
|
|
17
|
Luo X, Cheng C, Tan Z, Li N, Tang M, Yang
L and Cao Y: Emerging roles of lipid metabolism in cancer
metastasis. Mol Cancer. 16:762017. View Article : Google Scholar : PubMed/NCBI
|
|
18
|
Wang H, Zhang Y, Lu Y, Song J, Huang M,
Zhang J and Huang Y: The role of stearoyl-coenzyme A desaturase 1
in clear cell renal cell carcinoma. Tumour Biol. 37:479–489. 2016.
View Article : Google Scholar : PubMed/NCBI
|
|
19
|
Bagnato C and Igal RA: Overexpression of
diacylglycerol acyltransferase-1 reduces phospholipid synthesis,
proliferation, and invasiveness in simian virus 40-transformed
human lung fibroblasts. J Biol Chem. 278:52203–52211. 2003.
View Article : Google Scholar : PubMed/NCBI
|
|
20
|
Kim HY, Lee KM, Kim SH, Kwon YJ, Chun YJ
and Choi HK: Comparative metabolic and lipidomic profiling of human
breast cancer cells with different metastatic potentials.
Oncotarget. 7:67111–67128. 2016.PubMed/NCBI
|
|
21
|
Hilvo M, Denkert C, Lehtinen L, Muller B,
Brockmoller S, Seppänen-Laakso T, Budczies J, Bucher E, Yetukuri L,
Castillo S, et al: Novel theranostic opportunities offered by
characterization of altered membrane lipid metabolism in breast
cancer progression. Cancer Res. 71:3236–3245. 2011. View Article : Google Scholar : PubMed/NCBI
|
|
22
|
Iorio E, Ricci A, Bagnoli M, Pisanu ME,
Castellano G, Di Vito M, Venturini E, Glunde K, Bhujwalla ZM,
Mezzanzanica D, Canevari S and Podo F: Activation of
phosphatidylcholine cycle enzymes in human epithelial ovarian
cancer cells. Cancer Res. 70:2126–2135. 2010. View Article : Google Scholar : PubMed/NCBI
|
|
23
|
Menendez JA and Lupu R: Fatty acid
synthase and the lipogenic phenotype in cancer pathogenesis. Nat
Rev Cancer. 7:763–777. 2007. View
Article : Google Scholar : PubMed/NCBI
|