Introduction
The pathogenesis of pancreatic cancer is opaque, its
progress is rapid, its prognosis and therapeutic effects are poor,
its incidence is almost equal to its mortality rate, and the vast
majority of patients die due to metastases. Pancreatic cancer still
has the fourth highest death rate worldwide (1,2). The
early metastasis of pancreatic cancer is an extremely complex,
dynamic process with multi-factor participation and multi-stage
development. The exact molecular mechanism responsible is still not
clear. Many studies have shown that many factors, including
epithelial-mesenchymal transition (EMT) (3,4), the
tumor microenvironment (5,6), inflammatory factors (7,8),
stress response (9), and
circulating tumor cells (CTCs) (10) play vital roles in the process of
pancreatic cancer metastasis.
EMT is the ‘engine’ that leads to the invasion and
metastasis of pancreatic cancer (11). The process is accompanied by changes
in the expression of multiple genes. The most significant changes
are in the epithelial marker E-cadherin and mesenchymal marker
vimentin. Microenvironmental changes in pancreatic cancer are the
primary causes of EMT. In the present study, we induced changes in
the microenvironment of pancreatic cancer cells in vitro,
such as making it anaerobic, making it serum-deficient, and adding
TGF-β, and then observed the changes of the protein and mRNA
expression levels of EMT markers E-cadherin and vimentin.
Furthermore, we conducted a survival analysis and Cox regression
analysis to investigate the correlation between the expression
level of E-cadherin and overall survival.
Materials and methods
Cell lines
Eight human pancreatic cancer cell lines, AsPC-1,
BxPC-3, Capan-1, Colo-357, MIA PaCa-2, Panc-1, SU86.86 and T3M4,
were kindly donated by Professor Helmut Freiss from the Technical
University Munich of Germany. All the cell lines were individually
cultured in a humidified incubator with 5% CO2 at 37°C
in either RPMI-1640 medium or Dulbecco's modified Eagle's medium
(DMEM) containing 10% fetal bovine serum (FBS; Thermo Fisher
Scientific Inc., Waltham, MA, USA).
Clinical samples
All 52 pancreatic tissues (Table I), including 25 male cases and 27
female cases, age distribution from 41.4 to 81.1 years (65.59±1.21
years), were obtained from the Department of General Surgery,
Peking Union Medical College Hospital (PUMCH), China. The date
range of recruitment was from January 2012 to December 2017. The
experimental protocol was approved by the Peking Union Medical
College Hospital Ethics Committee. Written informed consent was
obtained from the patients. Tissue sampling and processing were
performed as previously described (12).
 | Table I.Association between E-cadherin
expression and clinicopathological features in PDAC patients. |
Table I.
Association between E-cadherin
expression and clinicopathological features in PDAC patients.
| Variables | E-cadherin weak
expression | E-cadherin strong
expression | Mann-Whitney
t-test | Chi-square |
|---|
| No. of
patients | 30 | 22 |
|
|
| Male vs.
female | 17/13 | 8/14 |
| NS |
| Age (years) | Median=66.4 | Median=65.3 | NS |
|
| T1 & T2 vs.
T3 | 1/29 | 3/19 |
| NS |
| N0 vs. N1 | 5/25 | 9/13 |
| NS |
| G1 | 1 | 4 |
|
|
| G2 | 21 | 12 |
|
|
| G3 | 8 | 6 |
|
|
| G1 vs. G2 &
G3 | 1 vs. 29 | 4 vs. 18 |
| NS |
RNA extraction and quantitative
real-time PCR (qPCR)
Total RNA was extracted from cells and tissues using
Invitrogen™ TRIzol reagent (Thermo Fisher Scientific, Inc. Waltham,
MA, USA), according to the manufacturer's instructions. cDNA was
synthesized using Invitrogen™ M-MLV reverse transcriptase (Thermo
Fisher Scientific, Inc.) from 5 µg total RNA. Quantitative RT-PCR
was performed on the Bio-Rad CFX96 Real-Time PCR System (Bio-Rad
Laboratories, Foster City, CA, USA) using KAPA PROBE FAST qPCR kits
(Kapa Biosystems, Inc., Wilmington, MA, USA) and TaqMan probes
(Thermo Fisher Scientific, Inc.) with the following cycling
conditions: 95°C for 10 min (initial denature) and then 40 cycles
of 95°C for 15 sec, 60°C for 60 sec. The expression of genes was
calculated using the 2−ΔΔCq method (13). The sequences of E-cadherin primers
used were as follows: 5′-CTGAGAACGAGGCTAACG-3′ and
5′-TTCACATCCAGCACATCC-3′; the sequences of vimentin primers used
were as follows: 5′-CCAGGCAAAGCAGGAGTC-3′ and
5′-CGAAGGTGACGAGCCATT-3′. Reference gene was GAPDH, the sequences
of GAPDH primers used were as follows:
5′-TCAACGACCACTTTGTCAAGCTCA-3′ and
5′-TCATTCTGGGGACCTGGTGGTCG-3′.
Immunoblot analysis
For immunoblot analysis, cells were grown in 6-well
plates and processed as previously described (1). The primary antibodies were applied
overnight at 4°C, and the secondary antibodies were added and
incubated for 1 h at room temperature. The E-cadherin antibody
(cat. no. sc-21791), HIF-1α antibody (cat. no. sc-71247) and
vimentin antibody (cat. no. sc-66002) (all from Santa Cruz
Biotechnology, Inc., Dallas, TX, USA) were diluted at 1:1,000. The
GAPDH antibody was diluted at 1:5,000 and used to verify equal
loading.
Serum starvation, hypoxia and TGF-β
induction
For serum starvation, Colo-357 and BxPC-3 cells were
seeded in 6-well plates; after the cells reached 70% confluency,
the medium was changed to either 0.5 or 10% FCS containing medium
that was kept on the cells for the indicated periods of time. For
hypoxia, sister clones of Colo-357 cells were incubated under
normoxic and hypoxic conditions (89.25% N2 + 10%
CO2 + 0.75% O2) for 24 and 48 h at 37°C in
medium supplemented with 10% FCS, as previously described (13,19,21).
For TGF-β induction, sister clones of Colo-357 and BxPC-3 cells
were incubated with TGF-β (ab50036, terminal concentration 10
ng/ml; Abcam, Cambridge, UK) or not. All experiments were performed
in triplicate and repeated three times.
Immunohistochemical analysis
Semi-quantitative immunohistochemistry (IHC) was
performed to determine E-cadherin expression in 10 normal pancreas
and 52 pancreatic cancer samples according to a previously
published standard protocol (2).
The E-cadherin antibody was diluted at 1:200. Two pathologists who
specialized in pancreatic cancer independently rated the staining
intensity and percentage of stained cells for each sample. Briefly,
scores were applied to rate staining intensity in the cancer cells
(no staining, 0; weak, 1; moderate, 2; strong, 3) and to determine
the percentage of stained cells (<5%, 0; 5–25%, 1; >25–50%,
2; >50–75%, 3; >75%, 4). The final intensity score was equal
to the staining intensity multiplied by the cell percentage. The
staining was stratified accordingly to low levels of expression
(scores 1–3) or high levels of expression (score ≥4).
Statistical analysis
Statistical analyses were performed using SPSS 23.0
software (IBM Corp., Armonk, NY, USA). Median values were used as
cut-off limits for group comparisons. Survival analyses were
performed using the Kaplan-Meier method and log-rank tests.
Multivariable analysis was performed using a Cox proportional
hazards model. The median survival and estimations of hazard ratios
were reported with 95% confidence intervals. Comparisons of
demographic and clinicopathological data between groups were made
using a Chi-square test. The data are presented as the mean ±
standard deviation (SD) and were compared using either Student's t
test, the Mann-Whitney U test and the one-way analysis of variance
(ANOVA) followed by Fisher's Least Significant Difference post hoc
test. Statistical significance was set at a P-value of <0.05.
Graph-Pad Prism 5 (GraphPad Software, Inc., San Diego, CA, USA)
software was used to create graphs.
Results
E-cadherin protein and mRNA are
expressed in several of 8 pancreatic cancer cell lines, and the
expression was decreased by hypoxia, inversely to vimentin
We first detected the expression of E-cadherin in 8
pancreatic cancer cell lines with western blotting and real-time
PCR. The results showed that E-cadherin mRNA and protein were
distinctly detectable in some of these cell lines, with high
expression in T3M4, BxPC-3 and Colo-357 cells and low expression in
MIA PaCa-2, Panc-1 and SU86.86 cells (Fig. 1A and B). In order to further
research this topic using siRNA and overexpression plasmid, the
cell lines with relatively high expression, BxPC-3 and Colo-357
were chosen for further functional experiments.
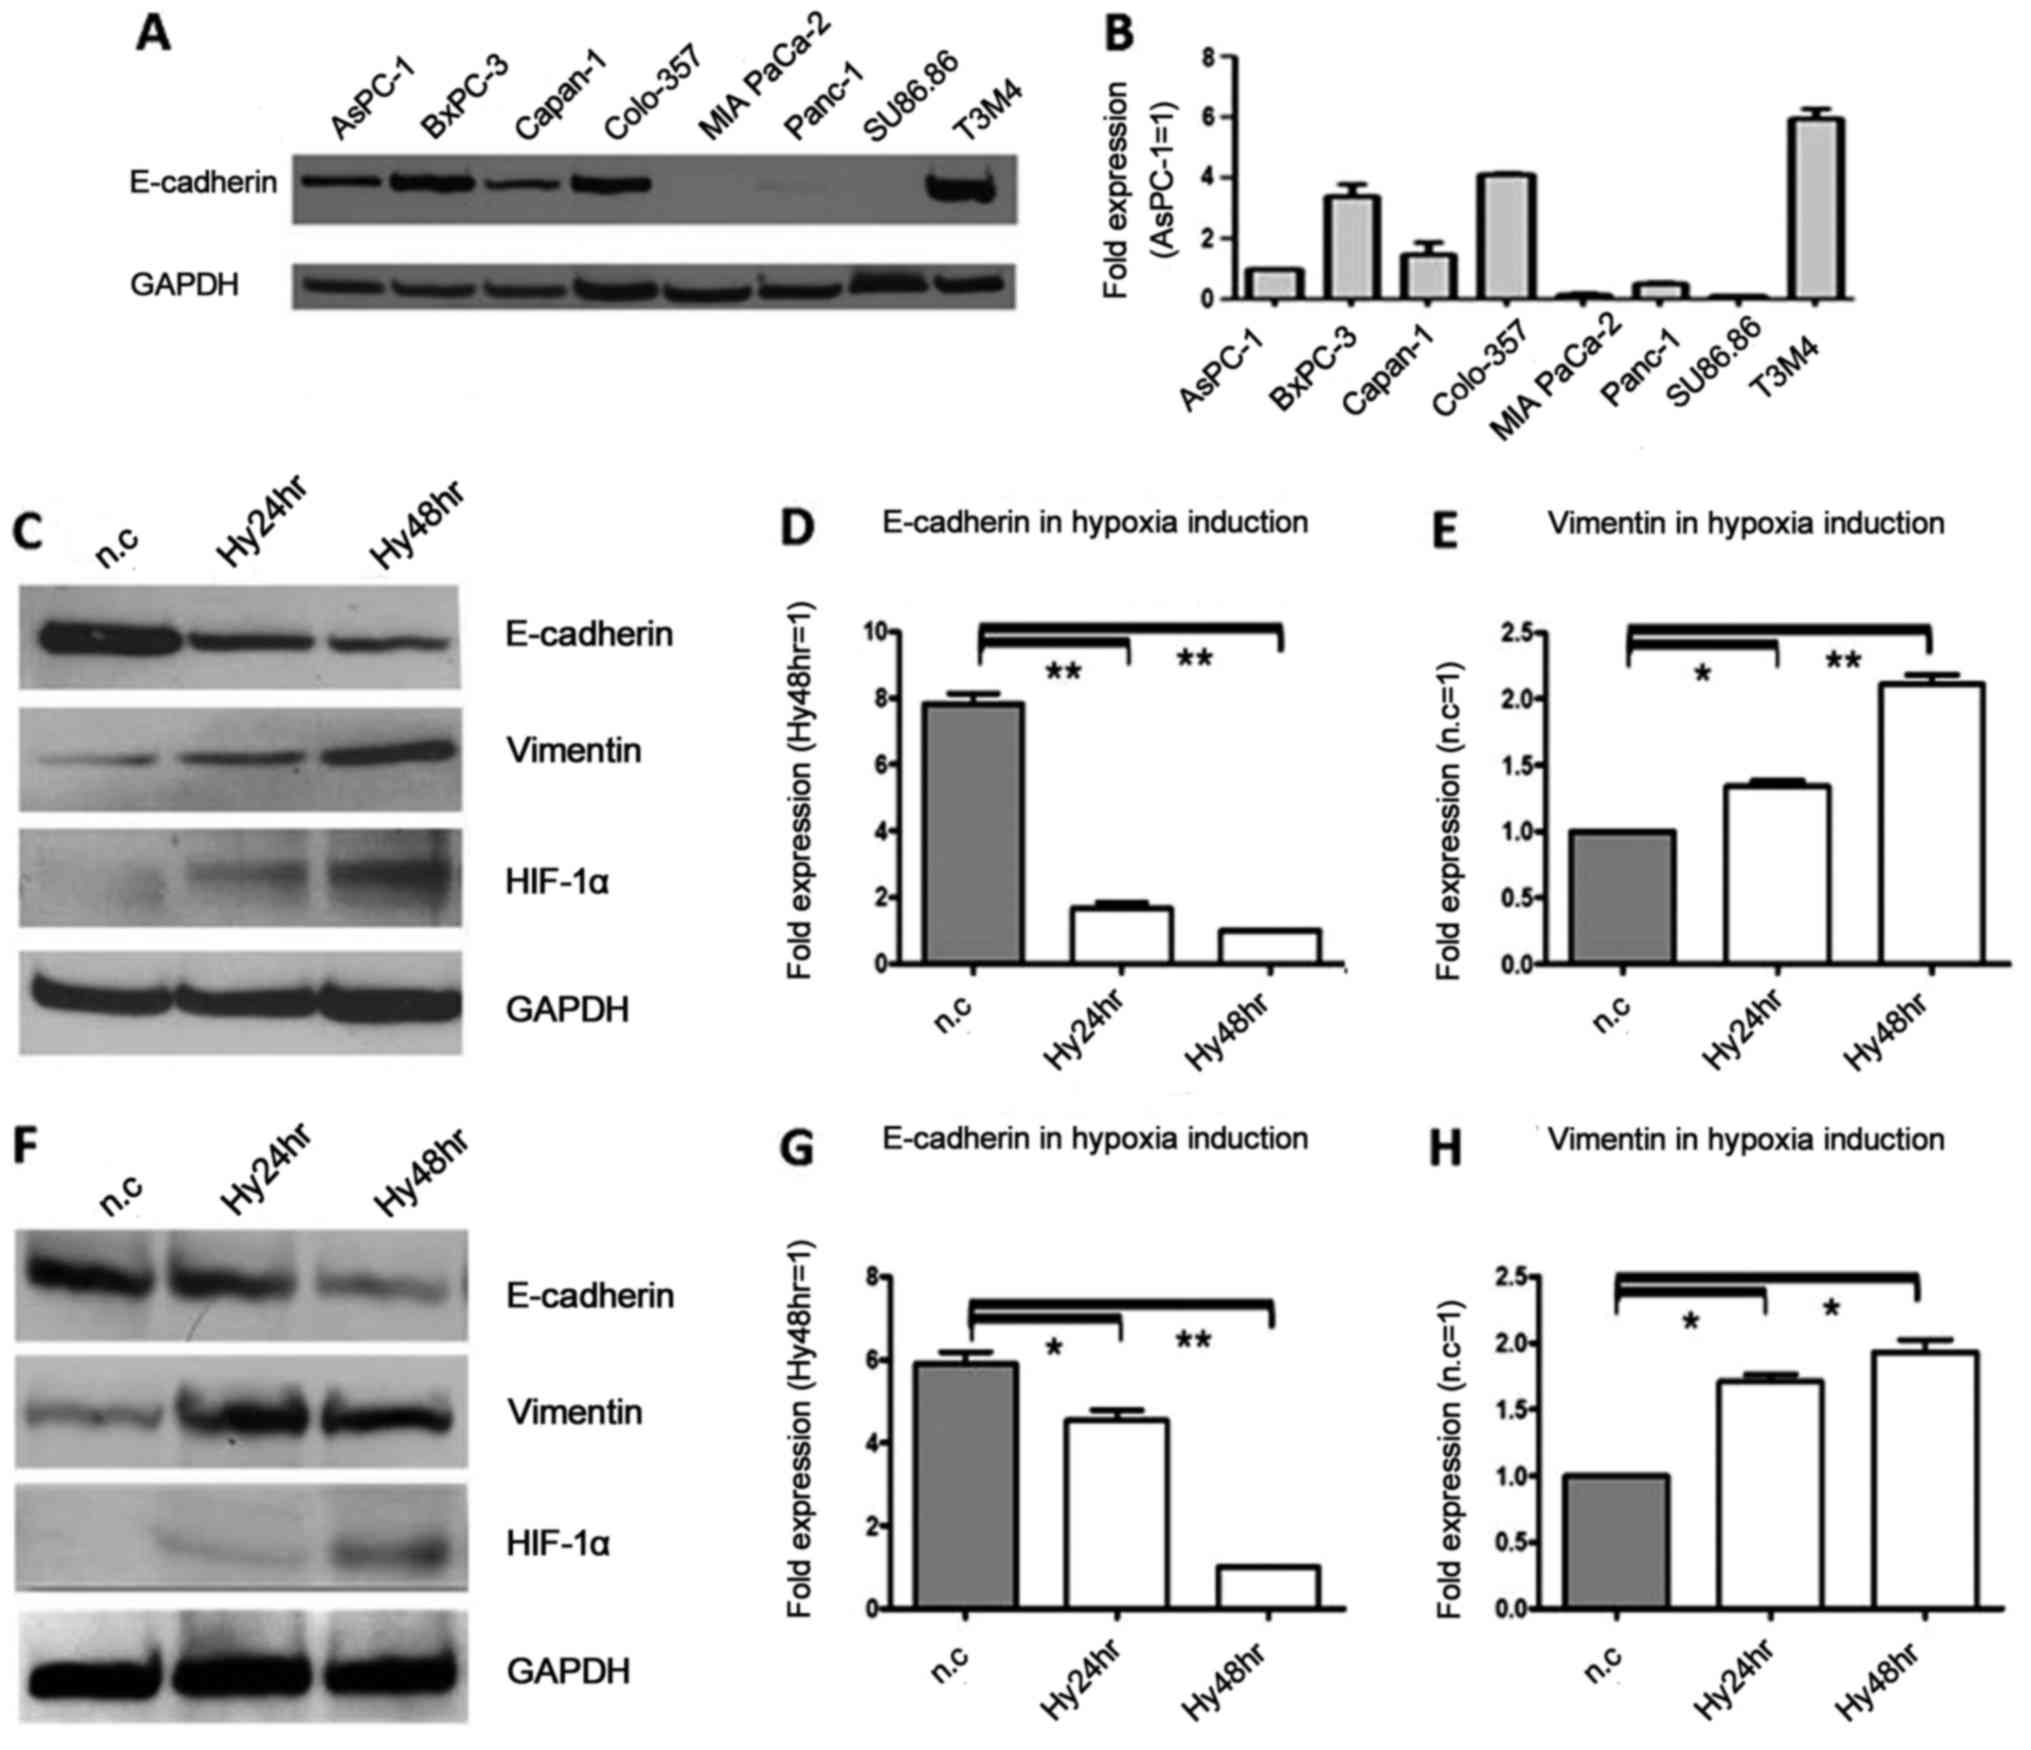 | Figure 1.E-cadherin protein and mRNA expression
in 8 pancreatic cancer cell lines, and downregulation during
hypoxia, in contrast to vimentin. (A) Western blot results showed
that E-cadherin protein was highly expressed in T3M4, BxPC-3 and
Colo-357 cell lines, whereas E-cadherin protein was expressed at a
low level in MIA PaCa-2, Panc-1 and Su86.86 cell lines. GAPDH was
used as the loading control. (B) Real-time PCR results showed that
E-cadherin mRNA was differentially expressed in eight cell lines,
and is presented as a magnitude of relative expression, which was
in accordance with the western blot results. β-actin was used as
the housekeeping gene. (C) The protein expression levels of
E-cadherin and vimentin after exposure to hypoxia for 24 and 48 h
were analyzed by immunoblot analysis in Colo-357 cells. E-cadherin
protein was decreased 1.7- and 2.6-fold (P<0.01), respectively.
In contrast, vimentin protein was increased 1.9- and 3.1-fold
(P<0.01), respectively. GAPDH was used as the loading control.
(D) The mRNA expression levels of E-cadherin after exposure to
hypoxia were analyzed by real-time PCR in Colo-357 cells, and there
were 4.7- and 7.8-fold (P<0.01) decreases at 24 and 48 h,
respectively. β-actin was used as the housekeeping. (E) The mRNA
expression levels of vimentin after exposure to hypoxia were
analyzed by real-time PCR in Colo-357 cells, and there were 1.3-
and 2.1-fold (P<0.01) increases at 24 and 48 h, respectively.
β-actin was used as the housekeeping. (F) The protein expression
levels of E-cadherin and vimentin after exposure to hypoxia for 24
and 48 h were analyzed by immunoblot analysis in BxPC-3 cells.
E-cadherin protein was decreased 1.2- and 2.1-fold (P<0.01),
respectively. In contrast, vimentin protein was increased 1.8- and
1.9-fold (P<0.05), respectively. GAPDH was used as the loading
control. (G) The mRNA expression levels of E-cadherin after
exposure to hypoxia were analyzed by real-time PCR in BxPC-3 cells,
and there were 1.2- and 4.6-fold (P<0.01) decreases at 24 and 48
h, respectively. β-actin was used as the housekeeping. (H) The mRNA
expression levels of vimentin after exposure to hypoxia were
analyzed by real-time PCR in BxPC-3 cells, and there were 1.7- and
1.9-fold (P<0.05) increases at 24 and 48 h, respectively.
β-actin was used as the housekeeping. Results are expressed as the
magnitude of relative expression (means ± SEM) compared with the
control, from three independent experiments. *P<0.05,
**P<0.01. n.c., negative control; Hy24hr, hypoxia for 24 h;
Hy48hr, hypoxia for 48 h. |
To analyze whether hypoxia decreases the expression
of E-cadherin, cancer cells were exposed to a hypoxic environment.
Cellular hypoxia was verified by increased HIF-1α protein
expression. When compared with the normoxic controls, E-cadherin
protein in Colo-357 cells was decreased 1.7- and 2.6-fold
(P<0.01) due to hypoxia at 24 and 48 h, respectively (Fig. 1C), and in BxPC-3 cells, E-cadherin
protein was decreased 1.2- and 2.1-fold (P<0.01) due to hypoxia
at 24 and 48 h, respectively (Fig.
1F). Similarly, in Colo-357 cells, there were 4.7 and 7.8-fold
(P<0.01) decreases at the mRNA level due to hypoxia at 24 and 48
h, respectively (Fig. 1D), and in
BxPC-3 cells, there were 1.2- and 4.6-fold (P<0.01) decreases at
the mRNA level of E-cadherin due to hypoxia at 24 and 48 h,
respectively (Fig. 1G). In
contrast, in Colo357 cells, vimentin protein was increased 1.9- and
3.1-fold (P<0.01) due to hypoxia at 24 and 48 h, respectively
(Fig. 1C), and in BxPC-3 cells,
vimentin protein was increased 1.8- and 1.9-fold (P<0.05) due to
hypoxia at 24 and 48 h, respectively (Fig. 1F). Similarly, there were 1.3- and
2.1-fold (P<0.01) increases at the vimentin mRNA level due to
hypoxia at 24 and 48 h, respectively (Fig. 1E), and in BxPC-3 cells, the vimentin
mRNA level was increased 1.7- and 1.9-fold (P<0.05) due to
hypoxia at 24 and 48 h, respectively (Fig. 1H).
Under serum starvation, E-cadherin
protein and mRNA expression were significantly decreased, while
vimentin was increased
In the next experiment, we tested the effect of
serum starvation on E-cadherin and vimentin protein and mRNA
expression in pancreatic cancer cells. For serum starvation,
Colo-357 and BxPC-3 cells were cultured with 0.5% FCS; this was the
second model of pancreatic cell microenviroment change. Due to
serum starvation, in Colo-357 cells, E-cadherin protein was
decreased 1.5-fold (P<0.05) and 4.3-fold (P<0.01) at 24 and
48 h, respectively (Fig. 2A), and
in BxPC-3 cells, E-cadherin protein was decreased 1.6-fold
(P<0.05) and 2.1-fold (P<0.01) at 24 and 48 h, respectively
(Fig. 2E). Meanwhile, in Colo-357
cells, E-cadherin mRNA was decreased 1.4-fold (P<0.01) and
5.9-fold (P<0.01) at 24 and 48 h, respectively (Fig. 2B), and in BxPC-3 cells, E-cadherin
mRNA was decreased 2.2-fold (P<0.01) and 6.8-fold (P<0.01) at
24 and 48 h, respectively (Fig.
2F). Conversely, in Colo-357 cells, vimentin protein was
increased 2.4-fold (P<0.05) and 2.8-fold (P<0.05) at 24 and
48 h, respectively (Fig. 2C), and
in BxPC-3 cells, vimentin protein was increased 1.2- and 1.7-fold
(P<0.05) at 24 and 48 h, respectively (Fig. 2E). In accordance, in Colo-357 cells,
vimentin mRNA was increased 1.4-fold (P<0.05) and 1.6-fold
(P<0.05) at 24 and 48 h, respectively (Fig. 2D), and in BxPC-3 cells, vimentin
mRNA was increased 1.3- and 3.9-fold (P<0.01) at 24 and 48 h,
respectively (Fig. 2G).
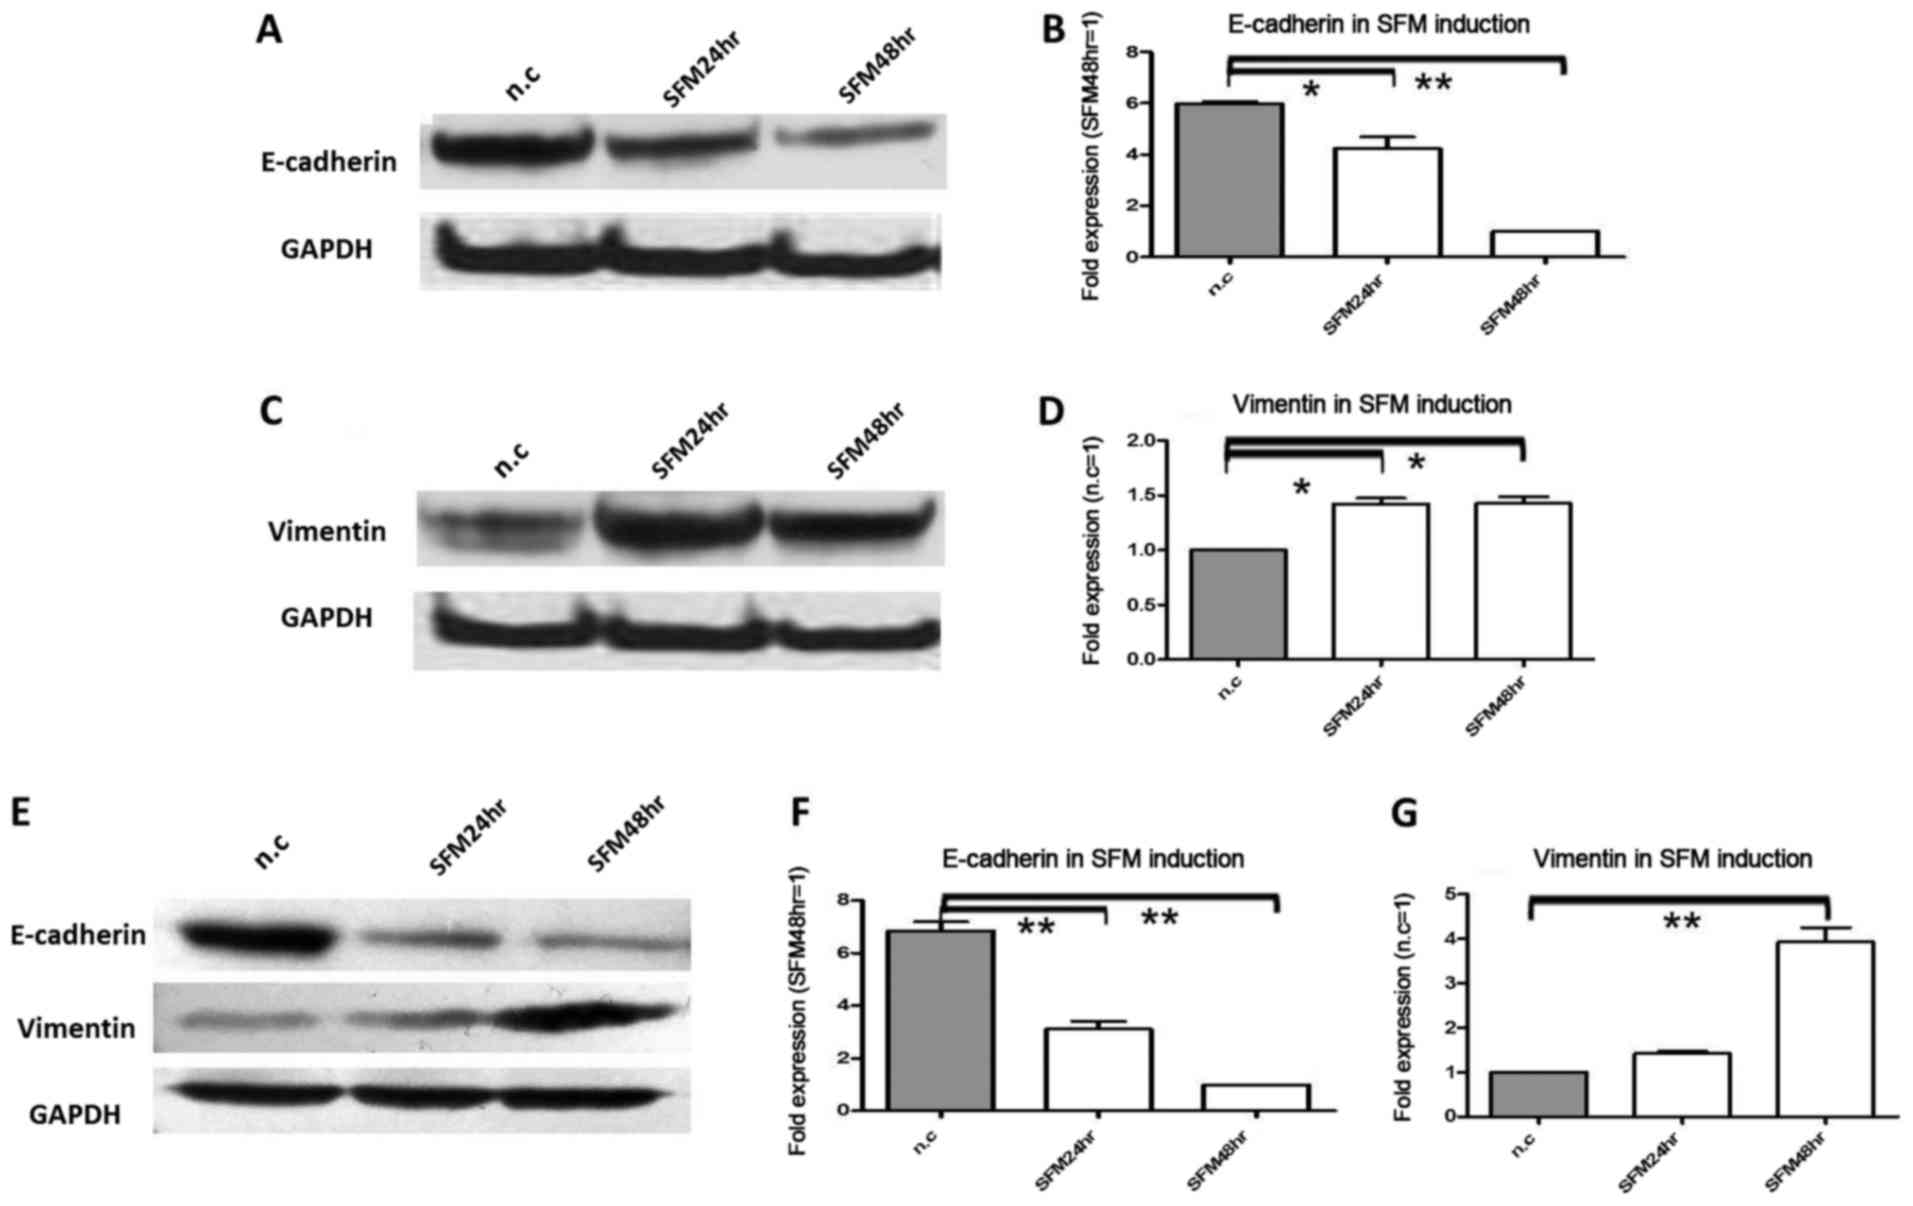 | Figure 2.The protein and mRNA expression
changes in E-cadherin and vimentin under serum starvation.
Pancreatic cancer cells Colo-357 and BxPC-3 were cultured under
serum starvation (FCS 0.5%) for 24 and 48 h. (A) E-cadherin protein
was decreased 1.5-fold (P<0.05) and 3.3-fold (P<0.01) at 24
and 48 h in Colo-357 cells, respectively. (B) E-cadherin mRNA was
decreased 1.4-fold (P<0.05) and 5.9-fold (P<0.01) at 24 and
48 h in Colo-357 cells, respectively. (C) Vimentin protein was
increased 2.4-fold (P<0.01) and 2.8-fold (P<0.01) at 24 and
48 h in Colo-357 cells, respectively. (D) Vimentin mRNA was
increased 1.4-fold (P<0.05) and 1.6-fold (P<0.05) at 24 and
48 h in Colo-357 cells, respectively. (E) E-cadherin protein was
decreased 1.6-fold (P<0.05) and 2.1-fold (P<0.01), and
inversely, vimentin protein was increased 1.2- and 1.7-fold
(P<0.05) at 24 and 48 h in BxPC-3 cells, respectively. (F)
E-cadherin mRNA was decreased 2.2-fold (P<0.01) and 6.8-fold
(P<0.01) at 24 and 48 h in BxPC-3 cells, respectively. (G)
Vimentin mRNA was increased 1.3- and 3.9-fold (P<0.01) at 24 and
48 h in BxPC-3 cells, respectively. GAPDH was used as the loading
control, and β-actin was used as the housekeeping gene. Results are
expressed as the magnitude of relative expression (means ± SEM)
compared with the control, from three independent experiments.
*P<0.05, **P<0.01. n.c., negative control; SFM24hr,
serum-free medium for 24 h; SFM48hr, serum-free medium for 48
h. |
Following exposure to TGF-β induction,
E-cadherin protein and mRNA expression are obviously upregulated,
while vimentin is downregulated
Subsequently, we detected the effect of TGF-β
induction on E-cadherin and vimentin protein and mRNA expression in
pancreatic cancer cells. This was the third model of pancreatic
cancer cell microenviroment, and TGF-β was used as an inducer of
EMT. Due to TGF-β induction, in Colo-357 cells, E-cadherin protein
was decreased 2.1-fold (P<0.05) and 3.2-fold (P<0.01) at 24
and 48 h, respectively (Fig. 3A),
and in BxPC-3 cells, E-cadherin protein was decreased 1.6-fold
(P<0.05) and 1.7-fold (P<0.05) at 24 and 48 h, respectively
(Fig. 3C). In Colo-357 cells,
E-cadherin mRNA was decreased 1.7-fold (P<0.05) and 2.8-fold
(P<0.01) at 24 and 48 h, respectively (Fig. 3B), and in BxPC-3 cells, E-cadherin
mRNA was decreased 2.9-fold (P<0.01) and 3.8-fold (P<0.01) at
24 and 48 h, respectively (Fig.
3D). On the contrary, in Colo-357 cells, vimentin protein was
increased 1.8-fold (P<0.05) and 1.7-fold (P<0.05) at 24 and
48 h, respectively (Fig. 3E), and
in BxpPC-3 cells, vimentin protein was increased 1.2- and 1.5-fold
(P<0.05) at 24 and 48 h, respectively (Fig. 3G). Similarly, in Colo-357 cells,
vimentin mRNA was increased 1.5-fold (P<0.05) and 1.6-fold
(P<0.05), respectively (Fig.
3F), and in BxPC-3 cells, vimentin mRNA was increased 1.4-fold
(P<0.05) and 2.3-fold (P<0.05), respectively (Fig. 3H).
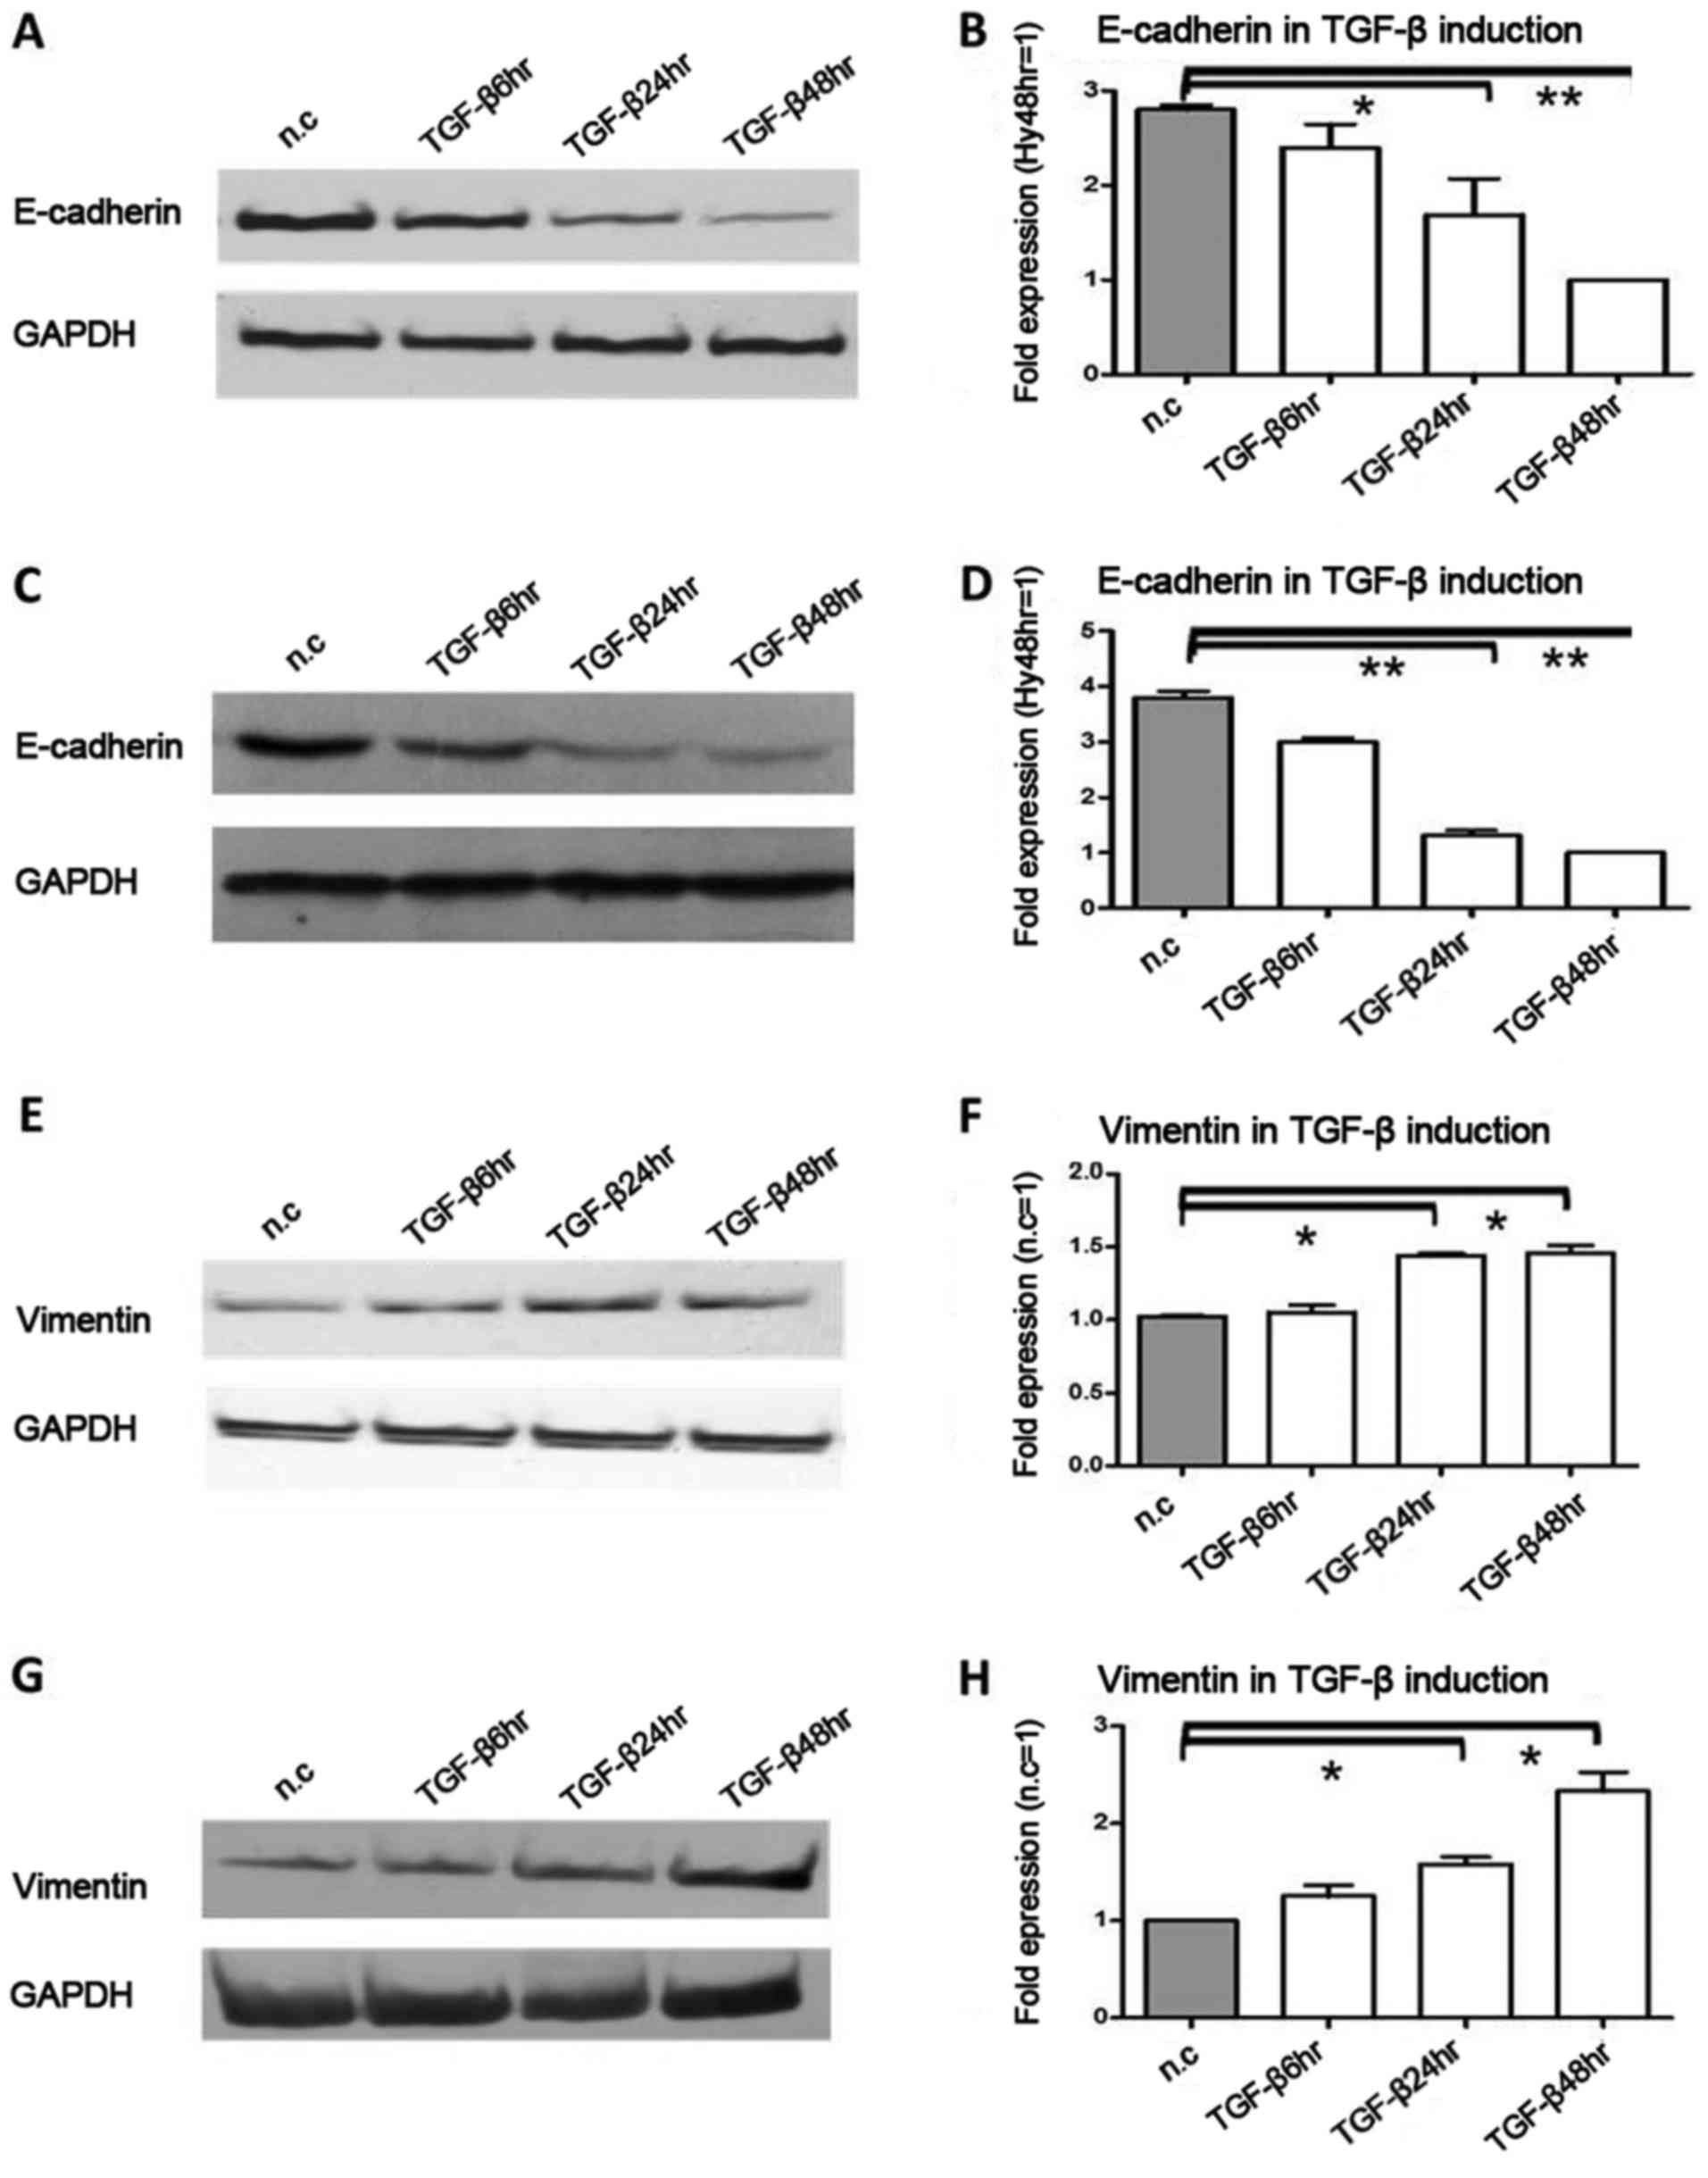 | Figure 3.The protein and mRNA expression
changes in E-cadherin and vimentin under TGF-β induction,
Pancreatic cancer cells Colo-357 and BxPC-3 were incubated with
TGF-β (terminal concentration 10 ng/ml) for 6, 24 and 48 h. (A)
E-cadherin protein was decreased 2.1-fold (P<0.05) and 3.2-fold
(P<0.01) at 24 and 48 h in Colo-357 cells, respectively. (B)
E-cadherin mRNA was decreased 1.7-fold (P<0.05) and 2.8-fold
(P<0.01) at 24 and 48 h in Colo-357 cells, respectively. (C)
E-cadherin protein was decreased 1.6-fold (P<0.05) and 1.7-fold
(P<0.05) at 24 and 48 h in BxPC-3 cells, respectively. (D)
E-cadherin mRNA was decreased 2.9-fold (P<0.01) and 3.8-fold
(P<0.01) at 24 and 48 h in BxPC-3 cells, respectively. (E)
Inversely, vimentin protein was increased 1.8-fold (P<0.05) and
1.7-fold (P<0.05) at 24 and 48 h in Colo-357 cells,
respectively. (F) Vimentin mRNA was increased 1.5-fold (P<0.05)
and 1.6-fold (P<0.05) at 24 and 48 h in Colo-357 cells,
respectively. (G) Vimentin protein was increased 1.2- and 1.5-fold
(P<0.05) at 24 and 48 h in BxPC-3 cells, respectively. (H)
Vimentin mRNA was increased 1.4-fold (P<0.05) and 2.3-fold
(P<0.05) at 24 and 48 h in BxPC-3 cells, respectively. GAPDH was
used as the loading control, and β-actin was used as the
housekeeping gene. Results are expressed as the magnitude of
relative expression (means ± SEM) compared with the control, from
three independent experiments. *P<0.05, **P<0.01. n.c.,
negative control; TGF-β6hr, TGF-β induction for 6 h; TGF-β24hr,
TGF-β induction for 24 h; TGF-β48hr, TGF-β induction for 48 h. |
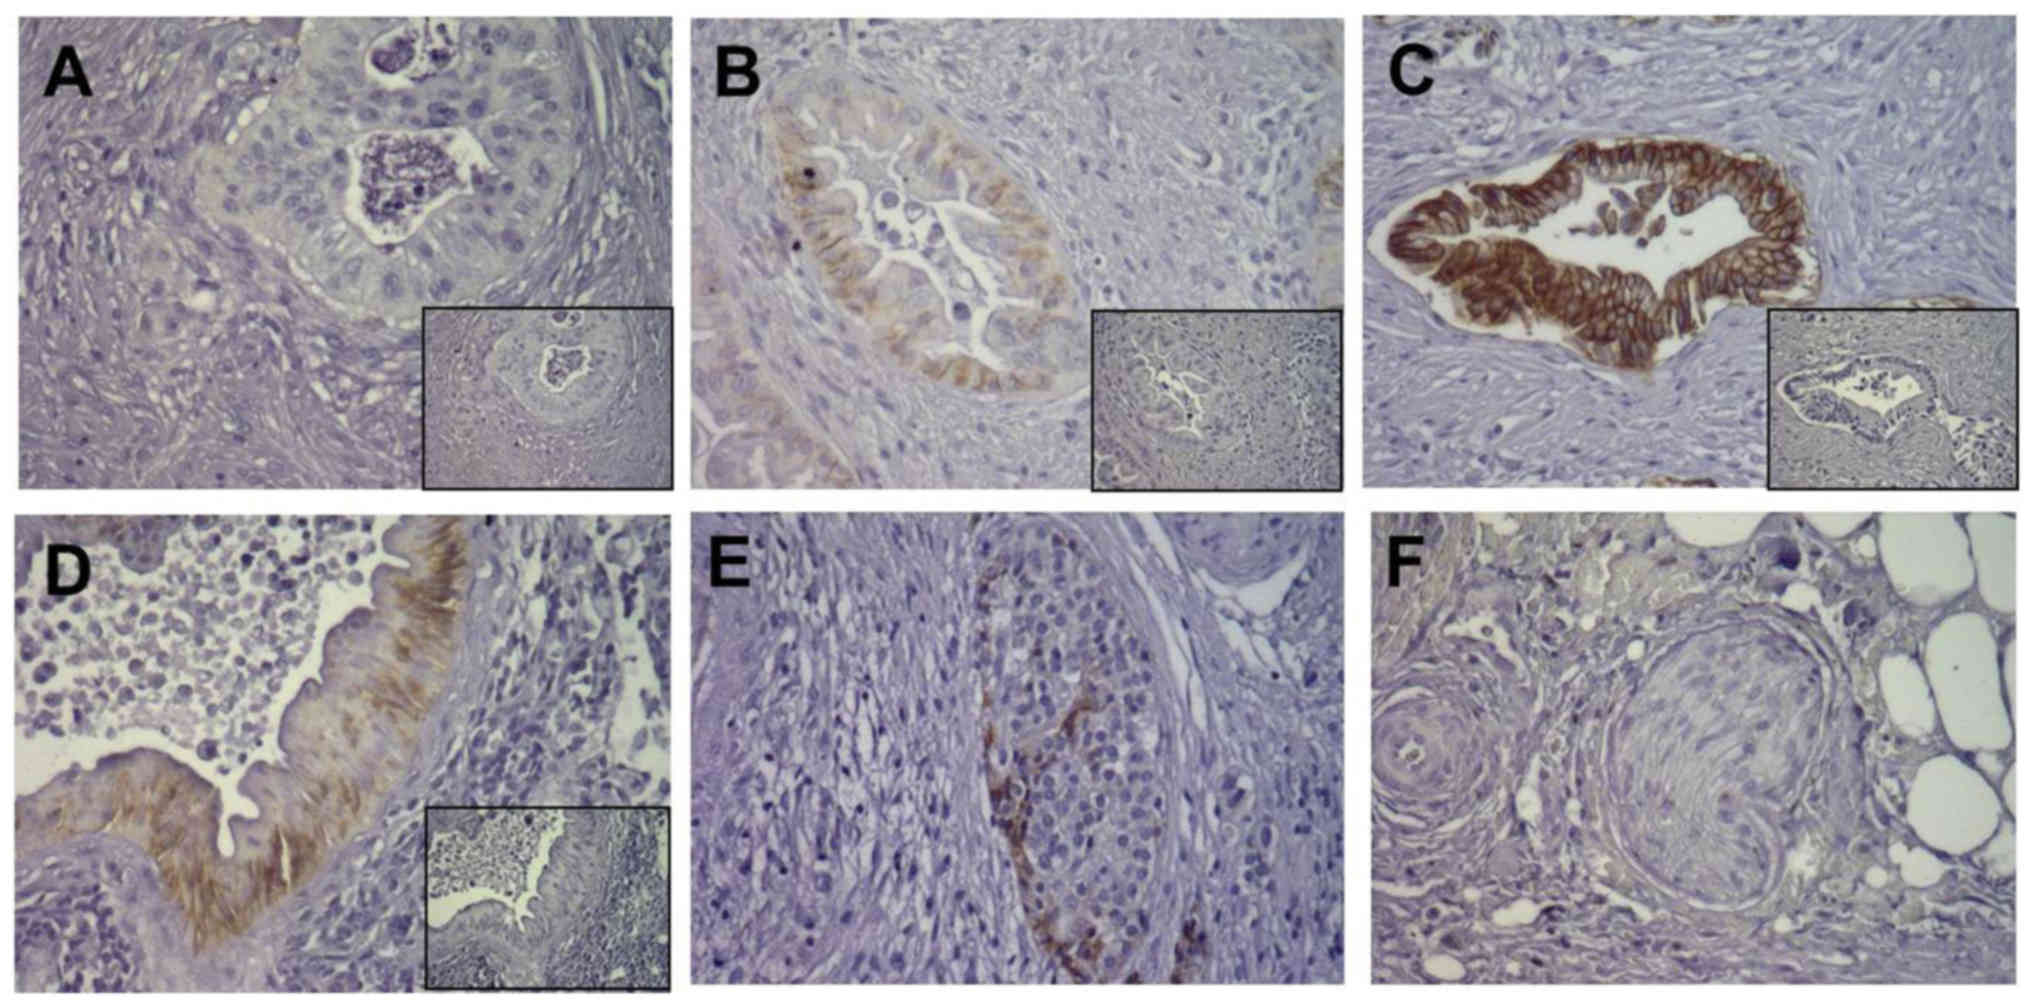
Location and varying expression
intensity of E-cadherin in pancreatic cancer tissues
In order to investigate the expression of E-cadherin
in pancreatic tissues, immunohistochemistry was performed in
consecutive sections of 52 pancreatic ductal adenocarcinoma (PDAC)
tissues. E-cadherin immunoreactivity showed varying intensity in
different pancreatic cancer tissues, and was clearly found in cell
membrane staining. For E-cadherin, some cancer cells had weak and
moderate expression in 30 cases (57.7%, Fig. 4A and B), while some cancer cells
were strongly positive in 22 cases (42.3%, Fig. 4C). In pancreatic PanIN lesions,
E-cadherin was strongly expressed (Fig.
4D). In addition, E-cadherin was also strongly expressed in
pancreatic islet cells (Fig. 4E),
whereas there was no E-cadherin staining in pancreatic nerves
(Fig. 4F).
Correlation of E-cadherin expression
in pancreatic cancer with patient survival
Based on differential E-cadherin expression levels
in PDAC tissues, we further divided the PDAC patients into
E-cadherin-weak and E-cadherin-strong expression groups. The
demographics and the association between E-cadherin expression and
clinicopathological features are displayed in Table I. The correlation analysis results
indicated that the expression level of E-cadherin was not related
to patient sex, age, tumor-node-metastasis (TNM) staging or
histological grade. Consistently, patients with higher levels of
E-cadherin expression [n=22, median survival=22.9 (18.9–26.8)
months] had significantly longer survival times compared to those
with lower E-cadherin expression [n=30, median survival=14.1
(9.1–19.1) months, P<0.01] (Fig.
5A). The prognostic value of E-cadherin expression was assessed
by multivariable analysis using a Cox proportional hazards model
(Table II). Based on the factors
analyzed, the results revealed that the expression of E-cadherin
[HR=6.810, 95% confidence interval (CI), 0.149–0.763, P<0.01]
and the occurrence of lymph node metastasis [hazard ratio
(HR)=9.445, 95% CI, 0.077–0.567, P<0.01] were independent
prognostic factors (Fig. 5C). The
other related prognostic factors (age, T-status, grade), did not
appear to impact the prognosis independently (Table II and Fig. 5B, D and E).
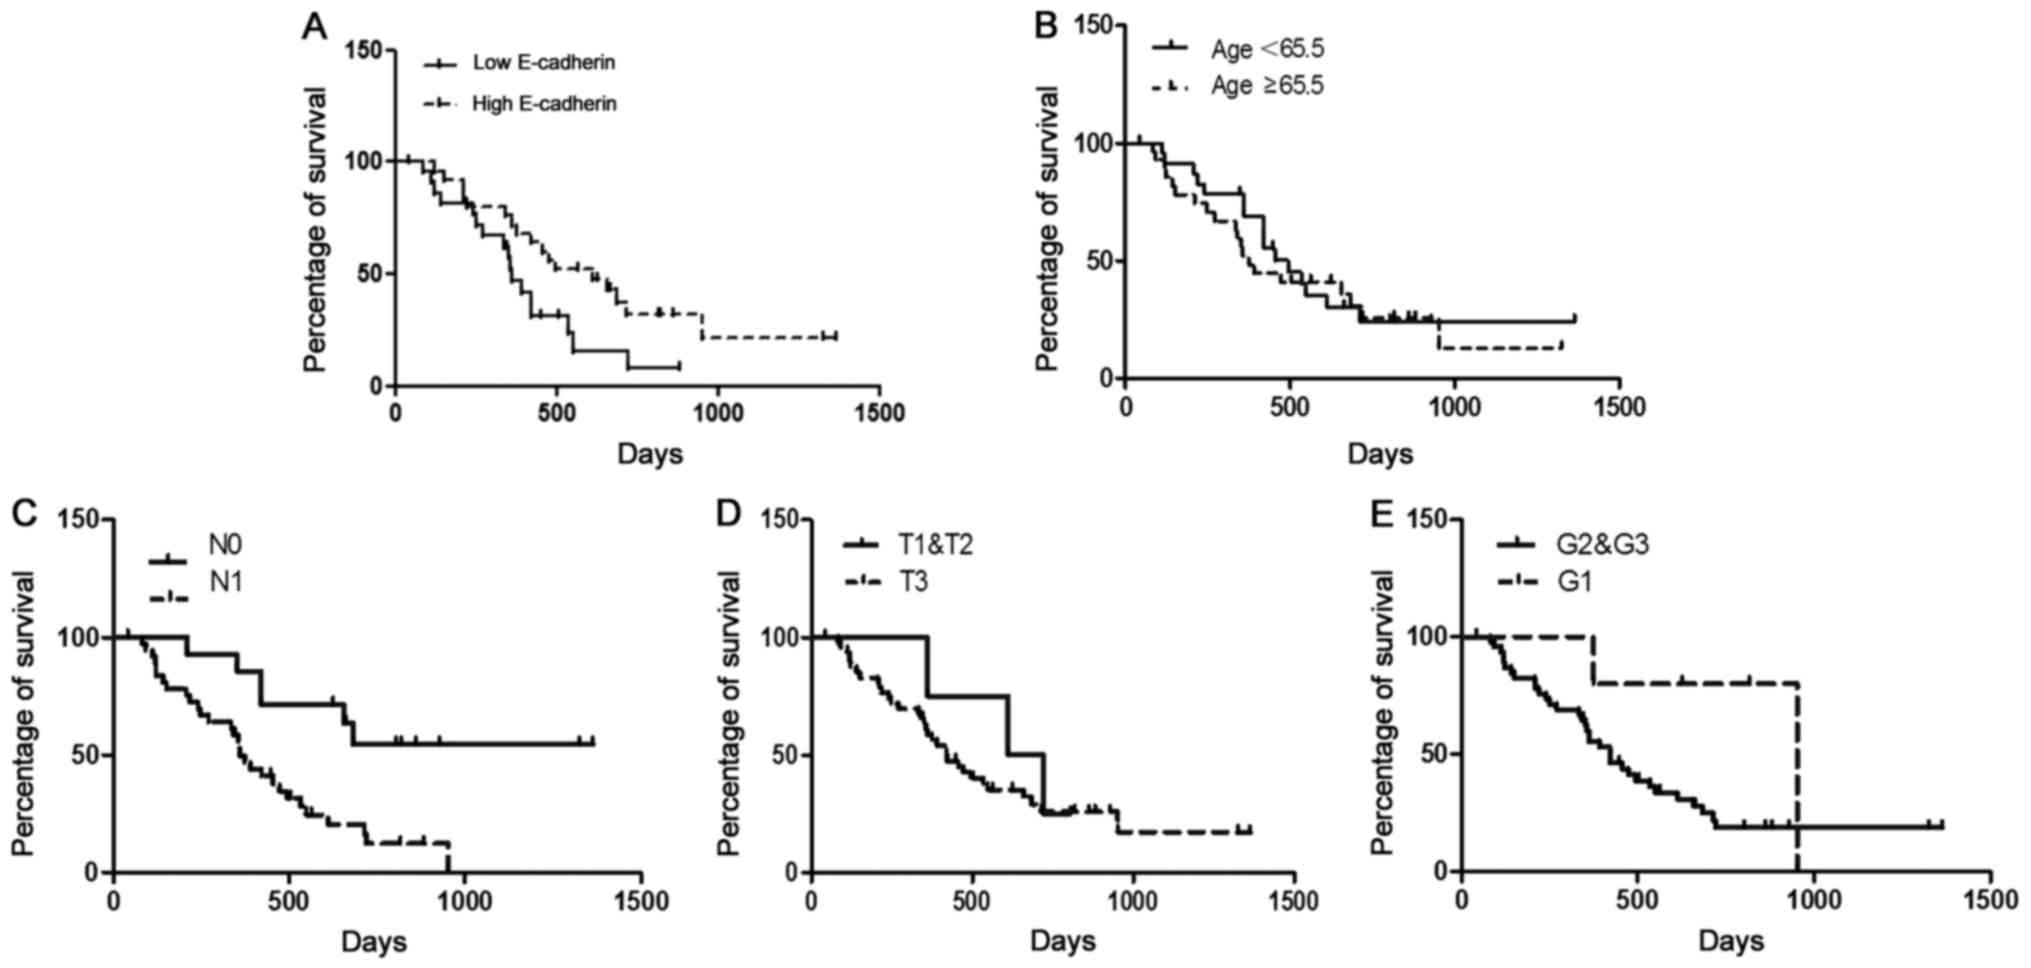 | Figure 5.Kaplan-Meier and log-rank analyses of
prognostic factors assessed in a multivariable analysis using a Cox
proportional hazards model. (A) Patients with higher levels of
E-cadherin expression [n=22, median survival=22.9 (18.9–26.8)
months] had a significantly longer survival time compared to those
with lower E-cadherin expression [n=30, median survival=14.1
(9.1–19.1) months, P<0.01]. (B) There was no significant
difference in survival time between patients of age ≥65.5 years
[n=19, median survival=18.2 (12.8–23.7) months] and patients
<65.5 years [n=23, median survival=21.2 (14.9–27.4) months,
P>0.05]. (C) Patients with lymph node metastasis [n=38, median
survival=14.2 (11.2–17.3) months] had a significantly shorter
survival time compared to those without lymph node metastasis
[n=14, median survival=31.9 (23.6–40.1) months, P<0.01]. (D)
There was no significant difference in survival time between
patients of T1&T2 [n=4, median survival=20.8 (15.3–26.2)
months] and patients of T3 [n=48, median survival=19.2 (14.7–23.8)
months, P>0.05]. (E) There was no significant difference in
survival time between patients of G1&G2 [n=5, median
survival=27.9 (15.2–37.4) months] and patients of G3 [n=47, median
survival=18.6 (14.2–22.9) months, P>0.05]. Median values were
taken as the cut-off limits when the two groups were compared.
Survival analyses were performed using the Kaplan-Meier method for
the estimation of event rates, and a log-rank test was used for
survival comparisons between patient groups. The P-value was
5%. |
| Table II.Univariable and multivariable
analysis of prognostic factors. |
Table II.
Univariable and multivariable
analysis of prognostic factors.
|
|
|
| Univariable
analysis | Multivariable
analysis |
|---|
|
|
|
|
|
|
|---|
| Variable | Comparator | N | Median survival
(95% CI) in months | Log-rank | P-value | HR | 95% CI | P-value |
|---|
| Median age
(years) | ≥65.5 vs.
<65.5 | 19/23 | 18.2 (12.8–23.7)
vs. 21.2 (14.9–27.4) | 0.191 | 0.662 | 0.813 | 0.149–0.763 | 0.367 |
| Sex | M/F | 26/26 | 20.48 (14.2–26.8)
vs. 18.4 (12.9–23.8) | 0.409 | 0.523 | 0.468 | 0.388–1.579 | 0.494 |
| T-status | T3 vs. T1 &
T2 | 48/4 | 19.2 (14.7–23.8)
vs. 20.8 (15.3–26.2) | 0.384 | 0.538 | 0.277 | 0.205–2.496 | 0.599 |
| N-status | N1 vs. N0 | 38/14 | 14.2 (11.2–17.3)
vs. 31.9 (23.6–40.1) | 9.592 | 0.004 | 9.445 | 0.077–0.567 | 0.002 |
| Grade | G1 vs. G2 &
G3 | 5/47 | 27.9 (15.2–37.4)
vs. 18.6 (14.2–22.9) | 3.153 | 0.095 | 2.801 | 0.797–17.735 | 0.094 |
| E-cadherin
score | ≤4 vs. >4 | 30/22 | 14.1 (9.1–19.1) vs.
22.9 (18.9–26.8) | 11.235 | 0.001 | 6.810 | 0.149–0.763 | 0.009 |
Discussion
It is well known that a hypoxic environment is a
common feature of several solid tumors. While normal tissues
generally receive an oxygen (O2) pressure of 30–50 mmHg,
the pressure drops to below 2.5 mmHg in up to 50–60% of locally
advanced solid tumors (14). When
O2 levels were measured in patients with various solid
tumors using pO2 histography, pancreatic cancer was
found to be the most hypoxic, and intraoperative pO2
measurements of seven resectable pancreatic tumors further showed
the hypoxic microenvironment (15,16).
Several mechanisms contribute to the hypoxic milieu of PDAC. The
major mechanism underlying reduced tumor oxygenation is the
insufficient and aberrant vasculature that cannot deliver the
necessary blood supply to all parts of the tumor tissue. In
addition, stromal cells in PDAC may contribute to this hypoxia both
by amplifying the production of antiangiogenic substances or by
physically compressing the capillaries through extracellular matrix
deposition in the periacinar spaces. Importantly, hypoxia is an
important activator of pancreatic stellate cells (PSCs), the major
fibroblastic cells of the pancreas, which perpetuate the vicious
cycle of hypoxia and fibrosis (17,18).
It is likely that the already fibrotic and hypovascular
microenvironment of pancreatic cancer is one of the reasons for the
failure of antiangiogenic therapies in pancreatic cancer in the
clinical setting. Overall, reduced microvessel density, nutrient
deprivation and extracellular matrix deposition create a hypoxic
setting for pancreatic cancer cells.
Hypoxia induces EMT and plays a major role in the
metastatic phenotype of PDAC cells (19–22).
In EMT, cancer cells acquire mesenchymal features, such as
dissolution of adhesion to the extracellular matrix and loss of
cell polarity, which result in their transition into invasive
cells. Moreover, EMT promotes the survival of cancer cells in the
blood and metastatic sites by endowing them with stem-cell-like
features and inhibiting their apoptosis. Furthermore, cells that
have already undergone EMT migrate at the forefront of the invading
cancer, creating tracks that other cancer cells can exploit. EMT is
one important molecular mechanism underlying early invasion and
metastasis in PDAC (23,24).
E-cadherin is a classic cadherin (calcium-dependent
adhesion molecule) family member, with key roles in cell growth and
differentiation, apoptosis and morphological changes in normal
tissues and cells. E-cadherin protein promotes the formation of
stable intercellular connections between adjacent cells, promotes
epithelial cell adhesion, and maintains the integrity of tissue
structure and function (25–27).
In addition, E-cadherin can inhibit tumor cell secretion of matrix
metalloproteinases (MMPs). Therefore, the loss of E-cadherin
protein expression decreases the mutual adhesion force between
tumor cells, which can then break through the extracellular matrix
and basement membrane, detach from the primary tumor and invade and
metastasize (28,29). As a very sensitive EMT marker, the
expression of E-cadherin is often related to the infiltration and
undifferentiated phenotype of tumor cells, and it is closely
related to invasion and metastasis of early tumor cells (30,31).
Throughout cancer development, the expression of the
mesenchymal marker vimentin is increased. Cancer cells often have
altered cell surface molecules, and vimentin is an important
molecular marker of mesenchymal cells. Although mature epithelial
cells show no vimentin expression, during epithelial cell
migration, vimentin can be re-expressed (32). Our experimental results showed that
the expression of E-cadherin was decreased gradually over time with
microenvironmental changes (including lack of serum and anaerobic
environment), suggesting that microenvironmental changes can
downregulate E-cadherin to inhibit the epithelial phenotype of
pancreatic cancer cells. Decreases in E-cadherin induced by changes
to the tumor microenvironment may be involved in the invasion and
metastasis of pancreatic cancer cells. In contrast, alterations in
the microenvironment can significantly promote the expression of
vimentin in pancreatic cancer cells, further demonstrating that
changes in the microenvironment of pancreatic cancer cells lead to
EMT. In addition, HIF-1α was used as a marker for the successful
creation of an anaerobic environment, and its protein expression
was upregulated, suggesting that the anaerobic state was achieved
in the microenvironment surrounding the pancreatic cancer
cells.
Transforming growth factor-β (TGF-β) is a
multifunctional cytokine that participates in the autocrine and
paracrine regulation of a variety of biological functions in cells,
including the inhibition of epithelial cell, immune cell and
hematopoietic cell proliferation, the promotion of angiogenesis,
and the induction of fibroblast differentiation from normal
epithelial cells, a process of transformation that is closely
related to E-cadherin expression (33,34).
Our study applied TGF-β as an EMT-inducing factor. The results
showed that TGF-β addition induced changes to the levels of
E-cadherin and vimentin mRNA in pancreatic cancer cells that were
consistent with those that occurred under serum starvation and in a
hypoxic environment, which further confirmed the interactions of
TGF-β, E-cadherin and vimentin in EMT in pancreatic cancer
cells.
Based on the results of immunohistochemistry,
E-cadherin expression levels were significantly reduced in most
pancreatic cancer samples. In our study, we analyzed 30 pancreatic
cancer tissues from 50 patients with lower E-cadherin expression
(58%), and the Kaplan-Meier and log-rank analyses showed that the
expression level of E-cadherin and the survival time of patients
with pancreatic cancer were positively correlated. It is worth
noting that precancerous lesions such as PanINs and tubular
complexes have abundant E-cadherin expression. This result also
indirectly shows that the changes in expression of E-cadherin,
which occur throughout the transformation of benign pancreatic
diseases to pancreatic cancer, occur simultaneously with EMT.
Therefore, research into the mechanism of this occurrence and the
development of pancreatic cancer is important.
Results from the multivariable analysis of the Cox
proportional hazards model showed that the expression of E-cadherin
and the occurrence of lymph node metastasis both were independent
prognostic factors of pancreatic cancer. G staging showed a trend
towards correlation with patient overall survival, but there was no
statistical significance, and an increased sample size would be
needed to confirm these findings. In summary, the characteristics
of the pancreatic cancer microenvironment can induce pancreatic
cancer cell EMT, furthering the cell invasion and metastasis
capacities.
Further research efforts should focus on how to
effectively address the microenvironmental conditions (i.e., the
lack of serum and occurrence of a hypoxic environment) of
pancreatic cancer cells to inhibit their malignancy. It is well
known; the tumor cell microenvironment is essential for the
generation of EMT in pancreatic cancer. The pancreatic cancer
cells, extracellular matrix cells and related cytokines are the
most important components of the pancreatic cancer microenvironment
(24). In order to investigate the
relationship in vivo between the microenvironment and EMT,
we can conduct primary cultures of pancreatic cancer cells in
vitro from the surgical resection of pancreatic cancer tissues.
We can also extract the extracellular matrix cells (the activated
stellate cells) in vitro, and then combine pancreatic cancer
cells and stellate cells and transplantate into the pancreas of
mice. By successfully establishing a patient-derived xenograft
model (PDX), we can continually develop a series of studies
concerning the microenvironment and EMT in vivo.
Acknowledgements
The authors thank Professor Yu Jia and Professor Ma
Yanni for their technical support.
Funding
The present study was supported by grants from the
2016 PUMCH Science Found for Junior Faculty (no. pumch-2016-2.6)
and the National Natural Science Foundation of China (no.
81773215).
Availability of data and materials
The datasets used during the present study are
available from the corresponding author upon reasonable
request.
Authors' contributions
YZ conceived and designed the study. WW, LD, BZ and
JL performed the experiments. WW and LD wrote the paper. WW and LD
reviewed and edited the manuscript. All authors have read and
approved the final manuscript and agree to be accountable for all
aspects of the research in ensuring that the accuracy or integrity
of any part of the work are appropriately investigated and
resolved.
Ethics approval and consent to
participate
All experimental protocols were approved by the
Peking Union Medical College Hospital Ethics Committee (Beijing,
China).
Patient consent for publication
Not applicable.
Competing interests
The authors state that they have no competing
interests.
References
|
1
|
Kamisawa T, Wood LD, Itoi T and Takaori K:
Pancreatic cancer. Lancet. 388:73–85. 2016. View Article : Google Scholar : PubMed/NCBI
|
|
2
|
Siegel RL, Miller KD and Jemal A: Cancer
statistics, 2016. CA Cancer J Clin. 66:7–30. 2016. View Article : Google Scholar : PubMed/NCBI
|
|
3
|
Rhim AD, Mirek ET, Aiello NM, Maitra A,
Bailey JM, McAllister F, Reichert M, Beatty GL, Rustgi AK,
Vonderheide RHM, et al: EMT and dissemination precede pancreatic
tumor formation. Cell. 148:349–361. 2012. View Article : Google Scholar : PubMed/NCBI
|
|
4
|
De Craene B and Berx G: Regulatory
networks defining EMT during cancer initiation and progression. Nat
Rev Cancer. 13:97–110. 2013. View
Article : Google Scholar : PubMed/NCBI
|
|
5
|
Apte MV, Wilson JS, Lugea A and Pandol SJ:
A starring role for stellate cells in the pancreatic cancer
microenvironment. Gastroenterology. 144:1210–1219. 2013. View Article : Google Scholar : PubMed/NCBI
|
|
6
|
Feig C, Gopinathan A, Neesse A, Chan DS,
Cook N and Tuveson DA: The pancreas cancer microenvironment. Clin
Cancer Res. 18:4266–4276. 2012. View Article : Google Scholar : PubMed/NCBI
|
|
7
|
Mantovani A: Cancer: Inflaming metastasis.
Nature. 457:36–37. 2009. View
Article : Google Scholar : PubMed/NCBI
|
|
8
|
Wen F, Shen A, Choi A, Gerner EW and Shi
J: Extracellular DNA in pancreatic cancer promotes cell invasion
and metastasis. Cancer Res. 73:4256–4266. 2013. View Article : Google Scholar : PubMed/NCBI
|
|
9
|
Cano CE and Iovanna JL: Stress proteins
and pancreatic cancer metastasis. Scientific World Journal.
10:1958–1966. 2010. View Article : Google Scholar : PubMed/NCBI
|
|
10
|
Cen P, Ni X, Yang J, Graham DY and Li M:
Circulating tumor cells in the diagnosis and management of
pancreatic cancer. Biochim Biophys Acta. 1826:350–356.
2012.PubMed/NCBI
|
|
11
|
Franco-Chuaire ML, Magda Carolina SC and
Chuaire-Noack L: Epithelial-mesenchymal transition (EMT):
Principles and clinical impact in cancer therapy. Invest Clin.
54:86–205. 2013.
|
|
12
|
Jiang X, Rieder S, Giese NA, Friess H,
Michalski CW and Kleeff J: Reduced alpha-dystroglycan expression
correlates with shortened patient survival in pancreatic cancer. J
Surg Res. 171:120–126. 2011. View Article : Google Scholar : PubMed/NCBI
|
|
13
|
Livak KJ and Schmittgen TD: Analysis of
relative gene expression data using real-time quantitative PCR and
the 2−ΔΔCT method. Methods. 25:402–408. 2001. View Article : Google Scholar : PubMed/NCBI
|
|
14
|
Vaupel P and Mayer A: Hypoxia in cancer:
Significance and impact on clinical outcome. Cancer Metastasis Rev.
26:225–239. 2007. View Article : Google Scholar : PubMed/NCBI
|
|
15
|
Koong AC, Mehta VK, Le QT, Fisher GA,
Terris DJ, Brown JM, Bastidas AJ and Vierra M: Pancreatic tumors
show high levels of hypoxia. Int J Radiat Oncol Biol Phys.
48:919–922. 2002. View Article : Google Scholar
|
|
16
|
Dhani NC, Serra S, Pintilie M, Schwock J,
Xu J, Gallinger S, Hill RP and Hedley DW: Analysis of the intra-
and intertumoral heterogeneity of hypoxia in pancreatic cancer
patients receiving the nitroimidazole tracer pimonidazole. Br J
Cancer. 113:864–871. 2015. View Article : Google Scholar : PubMed/NCBI
|
|
17
|
Erkan M, Reiser-Erkan C, Michalski CW,
Deucker S, Sauliunaite D, Streit S, Esposito I, Friess H and Kleeff
J: Cancer-stellate cell interactions perpetuate the
hypoxia-fibrosis cycle in pancreatic ductal adenocarcinoma.
Neoplasia. 11:497–508. 2009. View Article : Google Scholar : PubMed/NCBI
|
|
18
|
Samkharadze T, Erkan M, Reiser-Erkan C,
Demir IE, Kong B, Ceyhan GO, Michalski CW, Esposito I, Friess H and
Kleeff J: Pigment epithelium-derived factor associates with
neuropathy and fibrosis in pancreatic cancer. Am J Gastroenterol.
106:968–980. 2011. View Article : Google Scholar : PubMed/NCBI
|
|
19
|
Lei J, Ma J, Ma Q, Li X, Liu H, Xu Q, Duan
W, Sun Q, Xu J, Wu Z and Wu E: Hedgehog signaling regulates hypoxia
induced epithelial to mesenchymal transition and invasion in
pancreatic cancer cells via a ligand-independent manner. Mol
Cancer. 12:662013. View Article : Google Scholar : PubMed/NCBI
|
|
20
|
Cheng ZX, Sun B, Wang SJ, Gao Y, Zhang YM,
Zhou HX, Jia G, Wang YW, Kong R, Pan SH, et al: Nuclear
factor-kappaB-dependent epithelial to mesenchymal transition
induced by HIF-1alpha activation in pancreatic cancer cells under
hypoxic conditions. PLoS One. 6:e237522011. View Article : Google Scholar : PubMed/NCBI
|
|
21
|
Zhu H, Wang D, Zhang L, Xie X, Wu Y, Liu
Y, Shao G and Su Z: Upregulation of autophagy by hypoxia-inducible
factor-1α promotes EMT and metastatic ability of CD133+
pancreatic cancer stem-like cells during intermittent hypoxia.
Oncol Rep. 32:935–942. 2014. View Article : Google Scholar : PubMed/NCBI
|
|
22
|
Salnikov AV, Liu L, Platen M, Gladkich J,
Salnikova O, Ryschich E, Mattern J, Moldenhauer G, Werner J and
Schemmer P: Hypoxia induces EMT in low and highly aggressive
pancreatic tumor cells but only cells with cancer stem cell
characteristics acquire pronounced migratory potential. PloS One.
7:e463912012. View Article : Google Scholar : PubMed/NCBI
|
|
23
|
Zhang Q, Lou Y, Zhang J, Fu Q, Wei T, Sun
X, Chen Q, Yang J, Bai X and Liang T: Hypoxia-inducible
factor-2alpha promotes tumor progression and has crosstalk with
Wnt/beta-catenin signaling in pancreatic cancer. Mol Cancer.
16:1192017. View Article : Google Scholar : PubMed/NCBI
|
|
24
|
Erkan M, Kurtoglu M and Kleeff J: The role
of hypoxia in pancreatic cancer: A potential therapeutic target?
Expert Rev Gastroenterol Hepatol. 10:301–316. 2016. View Article : Google Scholar : PubMed/NCBI
|
|
25
|
van Roy F: Beyond E-cadherin: Roles of
other cadherin superfamily members in cancer. Nat Rev Cancer.
14:121–134. 2014. View
Article : Google Scholar : PubMed/NCBI
|
|
26
|
Hoffman BD and Yap AS: Towards a dynamic
understanding of cadherin-based mechanobiology. Trends Cell Biol.
25:803–814. 2015. View Article : Google Scholar : PubMed/NCBI
|
|
27
|
Lecuit T and Yap AS: E-cadherin junctions
as active mechanical integrators in tissue dynamics. Nat Cell Biol.
17:533–539. 2015. View
Article : Google Scholar : PubMed/NCBI
|
|
28
|
Kotiyal S and Bhattacharya S: Events of
molecular changes in epithelial-mesenchymal transition. Crit Rev
Eukaryot Gene Expr. 26:163–171. 2016. View Article : Google Scholar : PubMed/NCBI
|
|
29
|
Qian X, Anzovino A, Kim S, Suyama K, Yao
J, Hulit J, Agiostratidou G, Chandiramani N, McDaid HM, Nagi C, et
al: N-cadherin/FGFR promotes metastasis through
epithelial-to-mesenchymal transition and stem/progenitor cell-like
properties. Oncogene. 33:3411–3421. 2014. View Article : Google Scholar : PubMed/NCBI
|
|
30
|
Beuran M, Negoi I, Paun S, Ion AD, Bleotu
C, Negoi RI and Hostiuc S: The epithelial to mesenchymal transition
in pancreatic cancer: A systematic review. Pancreatology.
5:217–225. 2015. View Article : Google Scholar
|
|
31
|
Xie D and Xie K: Pancreatic cancer stromal
biology and therapy. Genes Dis. 2:133–143. 2015. View Article : Google Scholar : PubMed/NCBI
|
|
32
|
Kim YR, Park MK, Kang GJ, Kim HJ, Kim EJ,
Byun HJ, Lee MY and Lee CH: Leukotriene B4 induces EMT and vimentin
expression in PANC-1 pancreatic cancer cells: Involvement of BLT2
via ERK2 activation. Prostaglandins Leukot Essent Fatty Acids.
115:67–76. 2016. View Article : Google Scholar : PubMed/NCBI
|
|
33
|
Hilbig A and Oettle H: Transforming growth
factor beta in pancreatic cancer. Curr Pharm Biotechnol.
12:2158–2164. 2011. View Article : Google Scholar : PubMed/NCBI
|
|
34
|
Melzer C, Hass R, von der Ohe J, Lehnert H
and Ungefroren H: The role of TGF-beta and its crosstalk with
RAC1/RAC1b signaling in breast and pancreas carcinoma. Cell Commn
Signal. 15:192017. View Article : Google Scholar
|