Introduction
Gastric cancer (GC) is a type of malignant digestive
tract tumor with a poor prognosis. GLOBOCAN 2015 reported GC as the
third leading cause of cancer-related mortality in the world, with
the majority of cases in developing countries (1). The pathogenesis of GC involves
constant activation of protooncogenes and inactivation of key tumor
suppressor genes that can lead to abnormalities in cell functions
such as proliferation, differentiation and apoptosis (2–5). While
surgery is the predominant treatment for GC, many patients develop
advanced stage disease, or experience recurrence after surgery, and
therefore, require chemotherapy and radiotherapy (6,7).
Currently, due to a lack of concrete knowledge concerning the
molecular basis of GC, there is no effective approach with which to
predict tumorigenesis and prevent recurrence. Therefore, it is
extremely important to discover the molecular mechanisms underlying
tumorigenesis and progression, and to identify novel target genes
for treatment.
It has been reported that mRNAs regulate many
cellular processes, such as proliferation, differentiation,
multi-drug resistance (MDR), and epithelial-mesenchymal transition
(EMT). Some of these processes have been identified as molecular
drivers of malignancy, including GC (8–11). For
example, Musashi-1 protein was found to be significantly
upregulated and correlated with tumor size, tumor-node-metastasis
(TNM) stage, depth of invasion, lymph node metastasis and distant
metastasis (12). The level of
protein expression of Musashi-1 was found to be an
independent prognostic indicator for the survival rate of GC
patients (12). Therefore, mRNAs
play a key role in the pathogenesis, progression and MDR of
malignancies. Thus, the study of mRNA expression profiles is a
strategy by which to understand the underlying functional
mechanisms and identify biomarkers in GC.
mRNA expression microarray platforms are used to
explore aberrant mRNA expression and discover differentially
expressed genes (DEGs). Microarrays have been used to identify
DEGs, some of which have been demonstrated to lead to
tumorigenesis, progression and MDR in malignancies (13–17).
At present, bioinformatic analysis is expanding as a way to better
help investigators analyze mRNA expression via microarray, study
complex biological networks, and identify candidate genes.
In the present study, we retrieved three mRNA
profiles (GSE54129, GSE79973, GSE56807) from Gene Expression
Omnibus (GEO, http://www.ncbi.nlm.nih.gov/geo/). Subsequently, DEGs
were identified by comparing GC with noncancerous gastric tissues.
Overlapped DEGs present in the 3 mRNA expression profiles were then
identified. We next performed the same DEG enrichment analyses by
Gene ontology (GO) and Kyoto Encyclopedia of Genes and Genomes
pathway (KEGG). The subnetwork extraction algorithms were applied
to analyze gene co-expression and protein-protein interactions
(PPIs) by STRING and Cytoscape. By analyzing subnetworks, we found
five key candidate genes, ALDH3A1, COL11A1, BGN, PGA4 and UGT2B15.
While ALDH3A1, COL11A1, BGN and PGA4 have been reported to
contribute to the pathogenesis and progression of GC, UGT2B15 has
never been reported in GC. It was observed that significant
differences in UGT2B15 were correlated with prognosis in GC in the
Cancer Genome Atlas (TCGA). We further demonstrated significant
differences in UGT2B15 mRNA and protein expression in GC tissues.
We analyzed the relationship between UGT2B15 expression and
clinicopathological characteristics and explored molecular
mechanisms in GC. Our results provide an important insight with
which to discover new biomarkers and prognostic markers in GC
patients.
Materials and methods
Microarray data information and
identification of DEGs
NCBI-GEO is a free database of microarray or gene
profiles, from which gastric cancer and normal or adjacent mucosal
tissue gene expression profiles for GSE54129, GSE79973 and GSE56807
were obtained from GEO (https://www.ncbi.nlm.nih.gov/geo/). Microarray data
was based on Agilent GPL 570 platform (Affymetrix Human Genome U133
plus 2.0 Array), and provided 126 GC tissues and 36 non-cancerous
gastric tissues. We chose these 3 datasets for integrated analysis
in this study. All procedures of this study complied with the
following protocol: i) The raw data of high throughput functional
genomic expression of each microarray was analyzed by GEO2R
software (http://www.ncbi.nlm.nih.gov/geo/). DEGs were
identified by classical t-test, and statistically significant DEGs
were defined using P<0.05 and logFC >2 as the cut-off
criterion. ii) Overlapping DEGs were obtained by uploading the DEG
profile datasets and performing integrated analysis using Funrich
software (http://www.funrich.org/).
Gene ontology and pathway enrichment
analysis
Cytoscape (http://www.cytoscape.org/) is an open source software
platform for visualizing molecular interaction networks and
biological pathways and integrating these networks with
annotations, gene expression profiles and other data. Gene Ontology
(GO) and Pathway Enrichment Analysis for overlapping DEGs was
analyzed using Bingo and ClueGo in Cytoscape software, with
P<0.05 as the cut-off criterion.
Protein-protein interaction network
and seed candidate genes
i) Overlapped DEGs were uploaded into STRING, and
DEG-encoded proteins and protein-protein interaction network (PPI)
were constructed, and then the results were downloaded in table TSV
format data. ii) The tabular data obtained above was uploaded into
Cytoscape software, which was used to construct protein-interaction
relationship sub-networks and analyze the interaction relationship
of the candidate DEG-encoding proteins in GC, and obtained seed
candidates genes by calculating node degree.
Expression of candidate genes
TCGA has an interactive web server for analyzing RNA
sequencing expression data from 9,736 tumors and 8,587 normal
samples from the TCGA and the GTEx projects, using a standard
processing pipeline. It provides customizable functions such as
tumor/normal differential expression analysis, profiling according
to cancer types or pathological stages, patient survival analysis,
similar gene detection, correlation analysis and dimensionality
reduction analysis. We downloaded the mRNA profile and clinical
data with Cancer Browser (https://genome-cancer.ucsc.edu/).
Analysis of overall survival time
To analyze the prognostic value of UGT2B15, GC
patients were divided into 2 groups: The upregulated expression and
the downregulated expression group using mean UGT2B15 expression as
cut-off in the TCGA data. The 2 patient cohorts were compared on a
Kaplan-Meier survival plot and the log-rank P-value was
calculated.
Immunohistochemical assays
The study included 32 gastric cancer patients,
containing 16 males and 16 females, aged 61.1±12.2 years, recruited
between August 2012 and September 2014 in Shenzhen People's
Hospital (Shenzheng, China). Written informed consent was obtained
from all patients prior to surgery, and the study was approved by
our Institutional Ethics Committee. Sections were deparaffinized
and rehydrated in steps through a series of graded ethanol and
distilled water, and then treated with 3%
H2O2 in methanol for 30 min to block
endogenous peroxidase activity. The sections were rinsed for 5 min
in PBS twice, and incubated with 10% normal goat serum for 30 min
to block non-specific antibody binding. After washing, the samples
were incubated with primary anti-rabbit UGT2B15 (cat. no. ab154864;
Abcam, Cambridge, MA, USA) at 1:500 dilution at 4°C overnight,
washed in PBS 3 times, then incubated with a secondary antibody
goat anti-rabbit IgG (cat. no. ab6789; Abcam). Later, the sections
were stained with DAB according to the manufacturer's protocols,
mounted and photographed using a digitalized microscope camera
(Nikon Corp., Tokyo, Japan).
Statistical analysis
Gene and protein expression was analyzed by t-test.
Data are presented as mean ± SD. All statistical analyses were
conducted using GraphPad Prism version 7.0 (GraphPad Software,
Inc., La Jolla, CA, USA).
Results
Identification of DEGs and
bioinformatic analysis
NCBI-GEO is a free database of microarray/gene
profiles, from which GC cancer and normal or adjacent mucosal
tissue gene expression profiles for GSE54129, GSE79973 and GSE56807
were obtained. The microarray data of GSE54129 contained 111 GC
tissues and 21 normal GC tissues. GSE79973 and GSE56807 data
contained 10 and 5 pairs of GC tissues and matched paraneoplastic
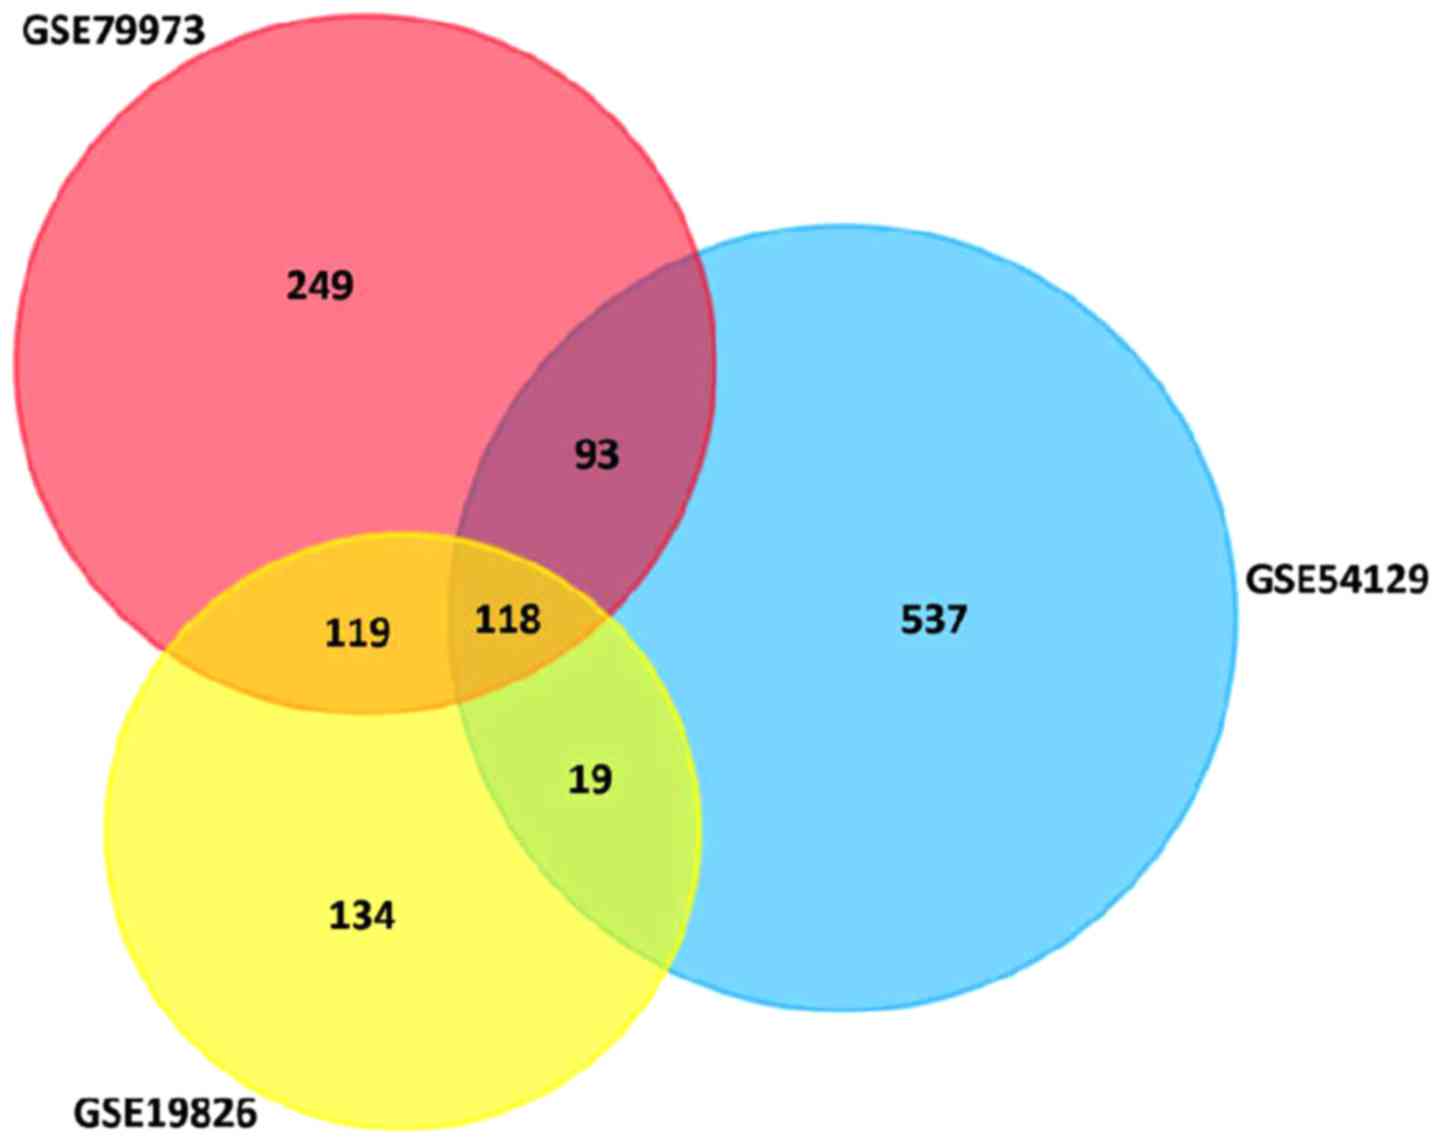
tissues, respectively. We obtained 579 DEGs, including 189
upregulated DEGs and 390 downregulated DEGs in GSE79973, 677 DEGs
including 166 upregulated and 511 downregulated DEGs in GSE54129,
and 390 DEGs including 247 upregulated DEGs and 143 downregulated
DEGs in GSE19826 (FC >2.0, P<0.05). The overlap between the 3
profiles was illustrated in a Venn diagram (Fig. 1). A total of 118 overlapping genes
were in the common region, containing 87 upregulated and 31
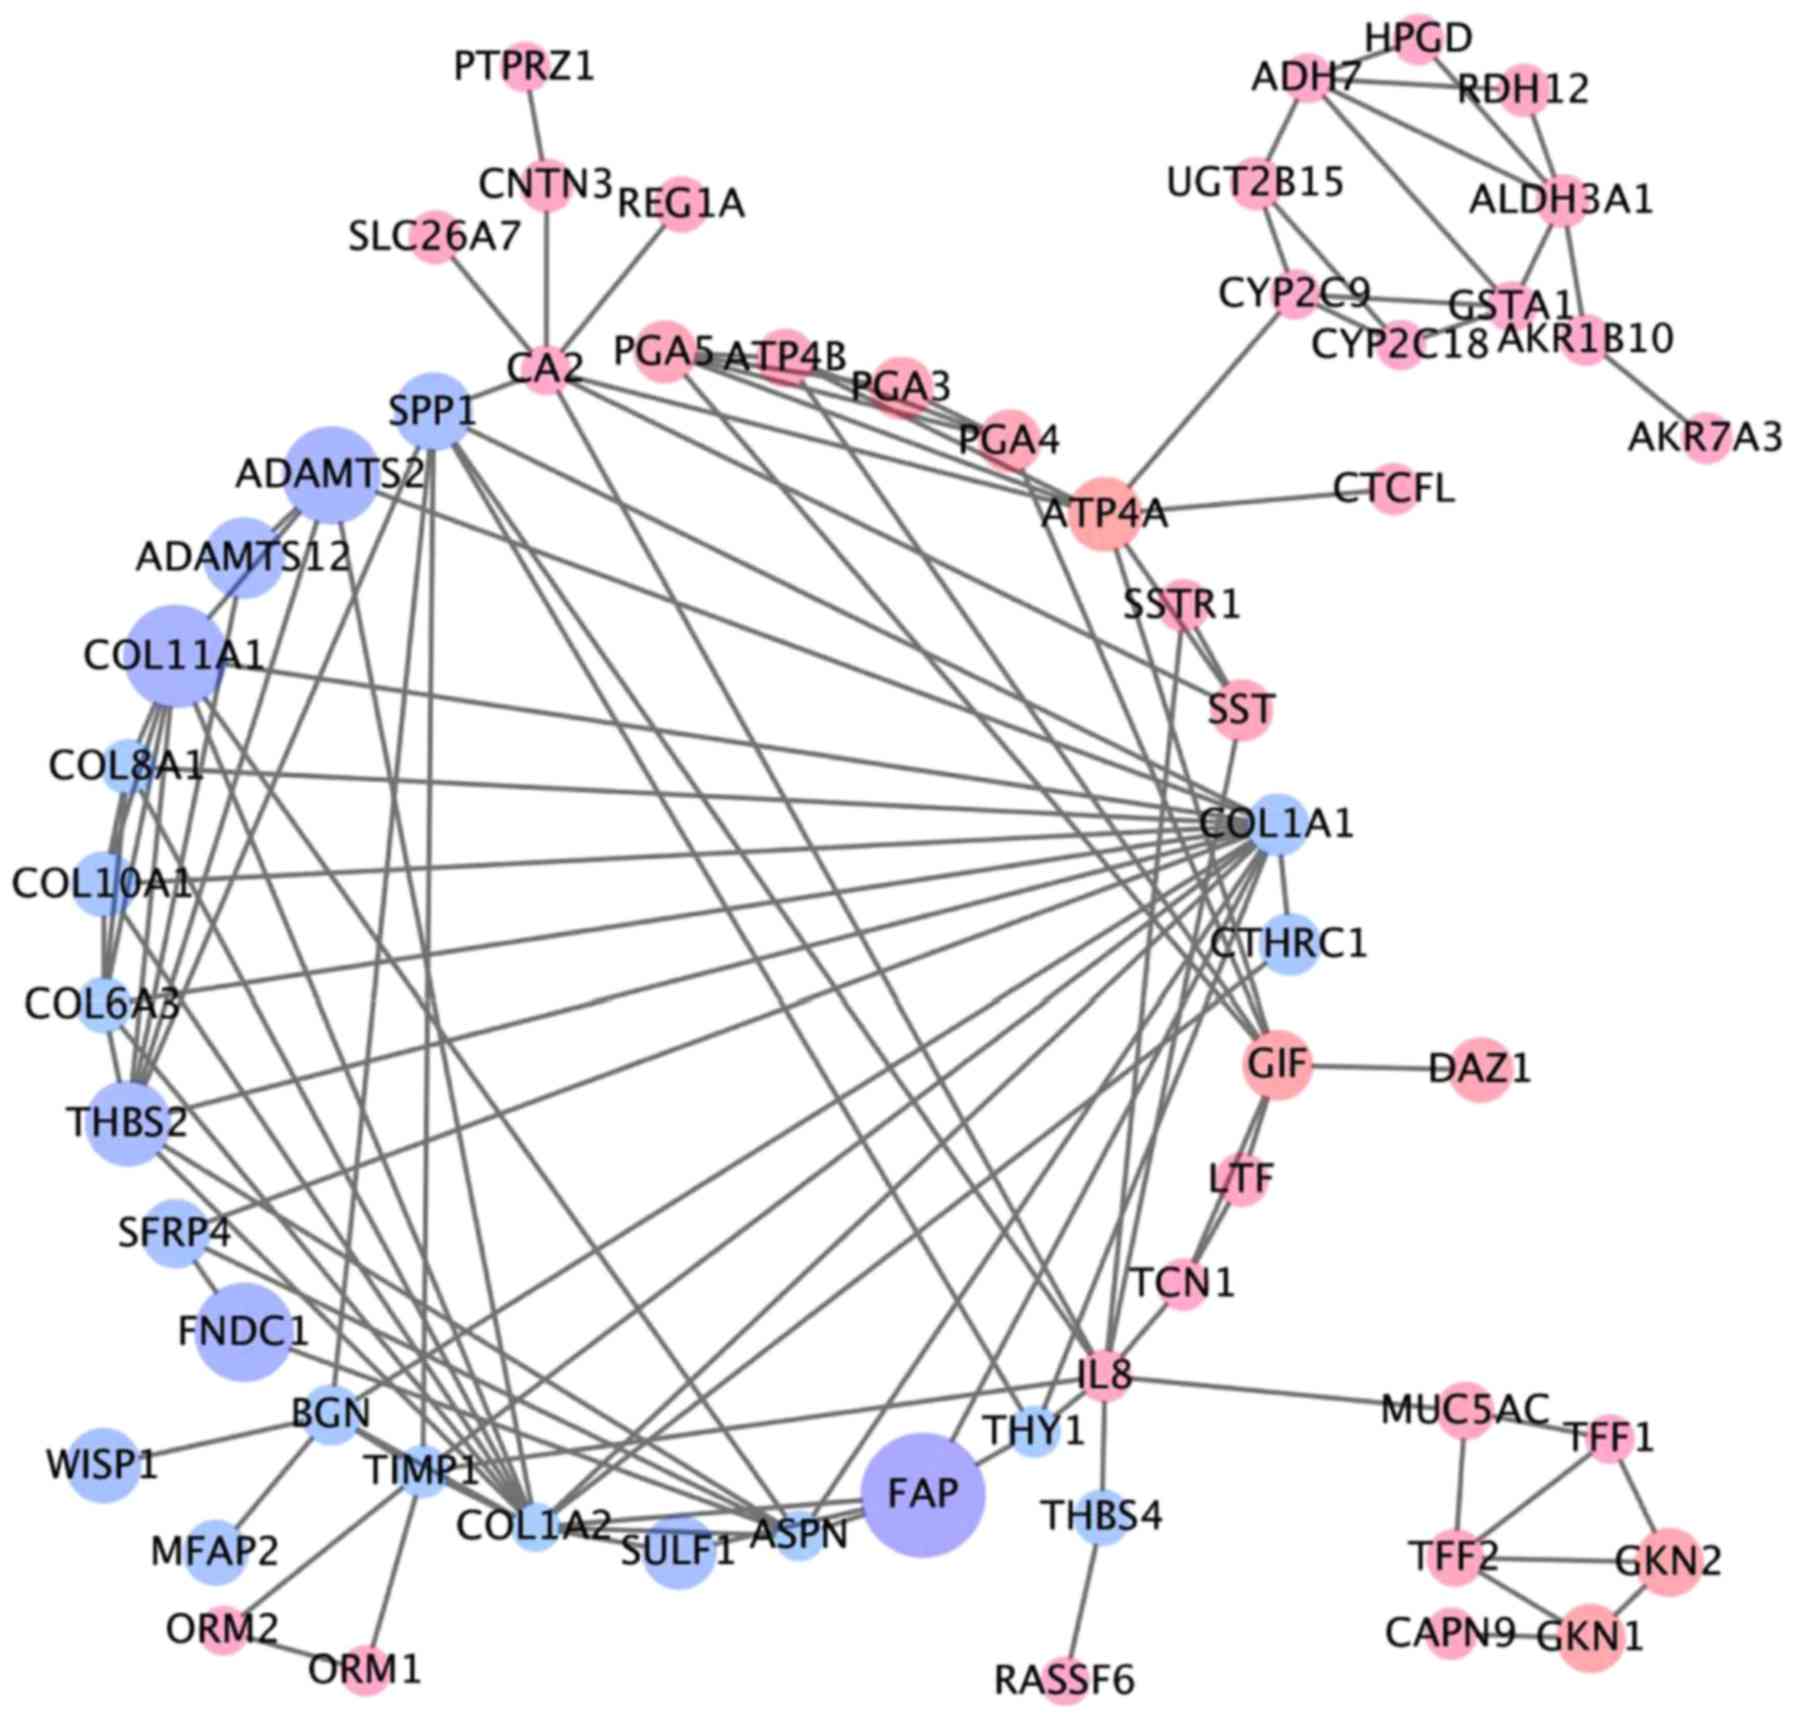
downregulated DEGs (Table I). A PPI
network included 110 nodes and 104 edges of the 118 DEGs, but 58
DEGs did not fall into the DEG PPI network through STRING (data not
shown). We proposed PPI network complex for further analysis using
Cytotype. This identified 5 central node genes, ALDH3A1, BGN,
COL11A1, PGA3 and UGT2B15 with the filtering of degree >4
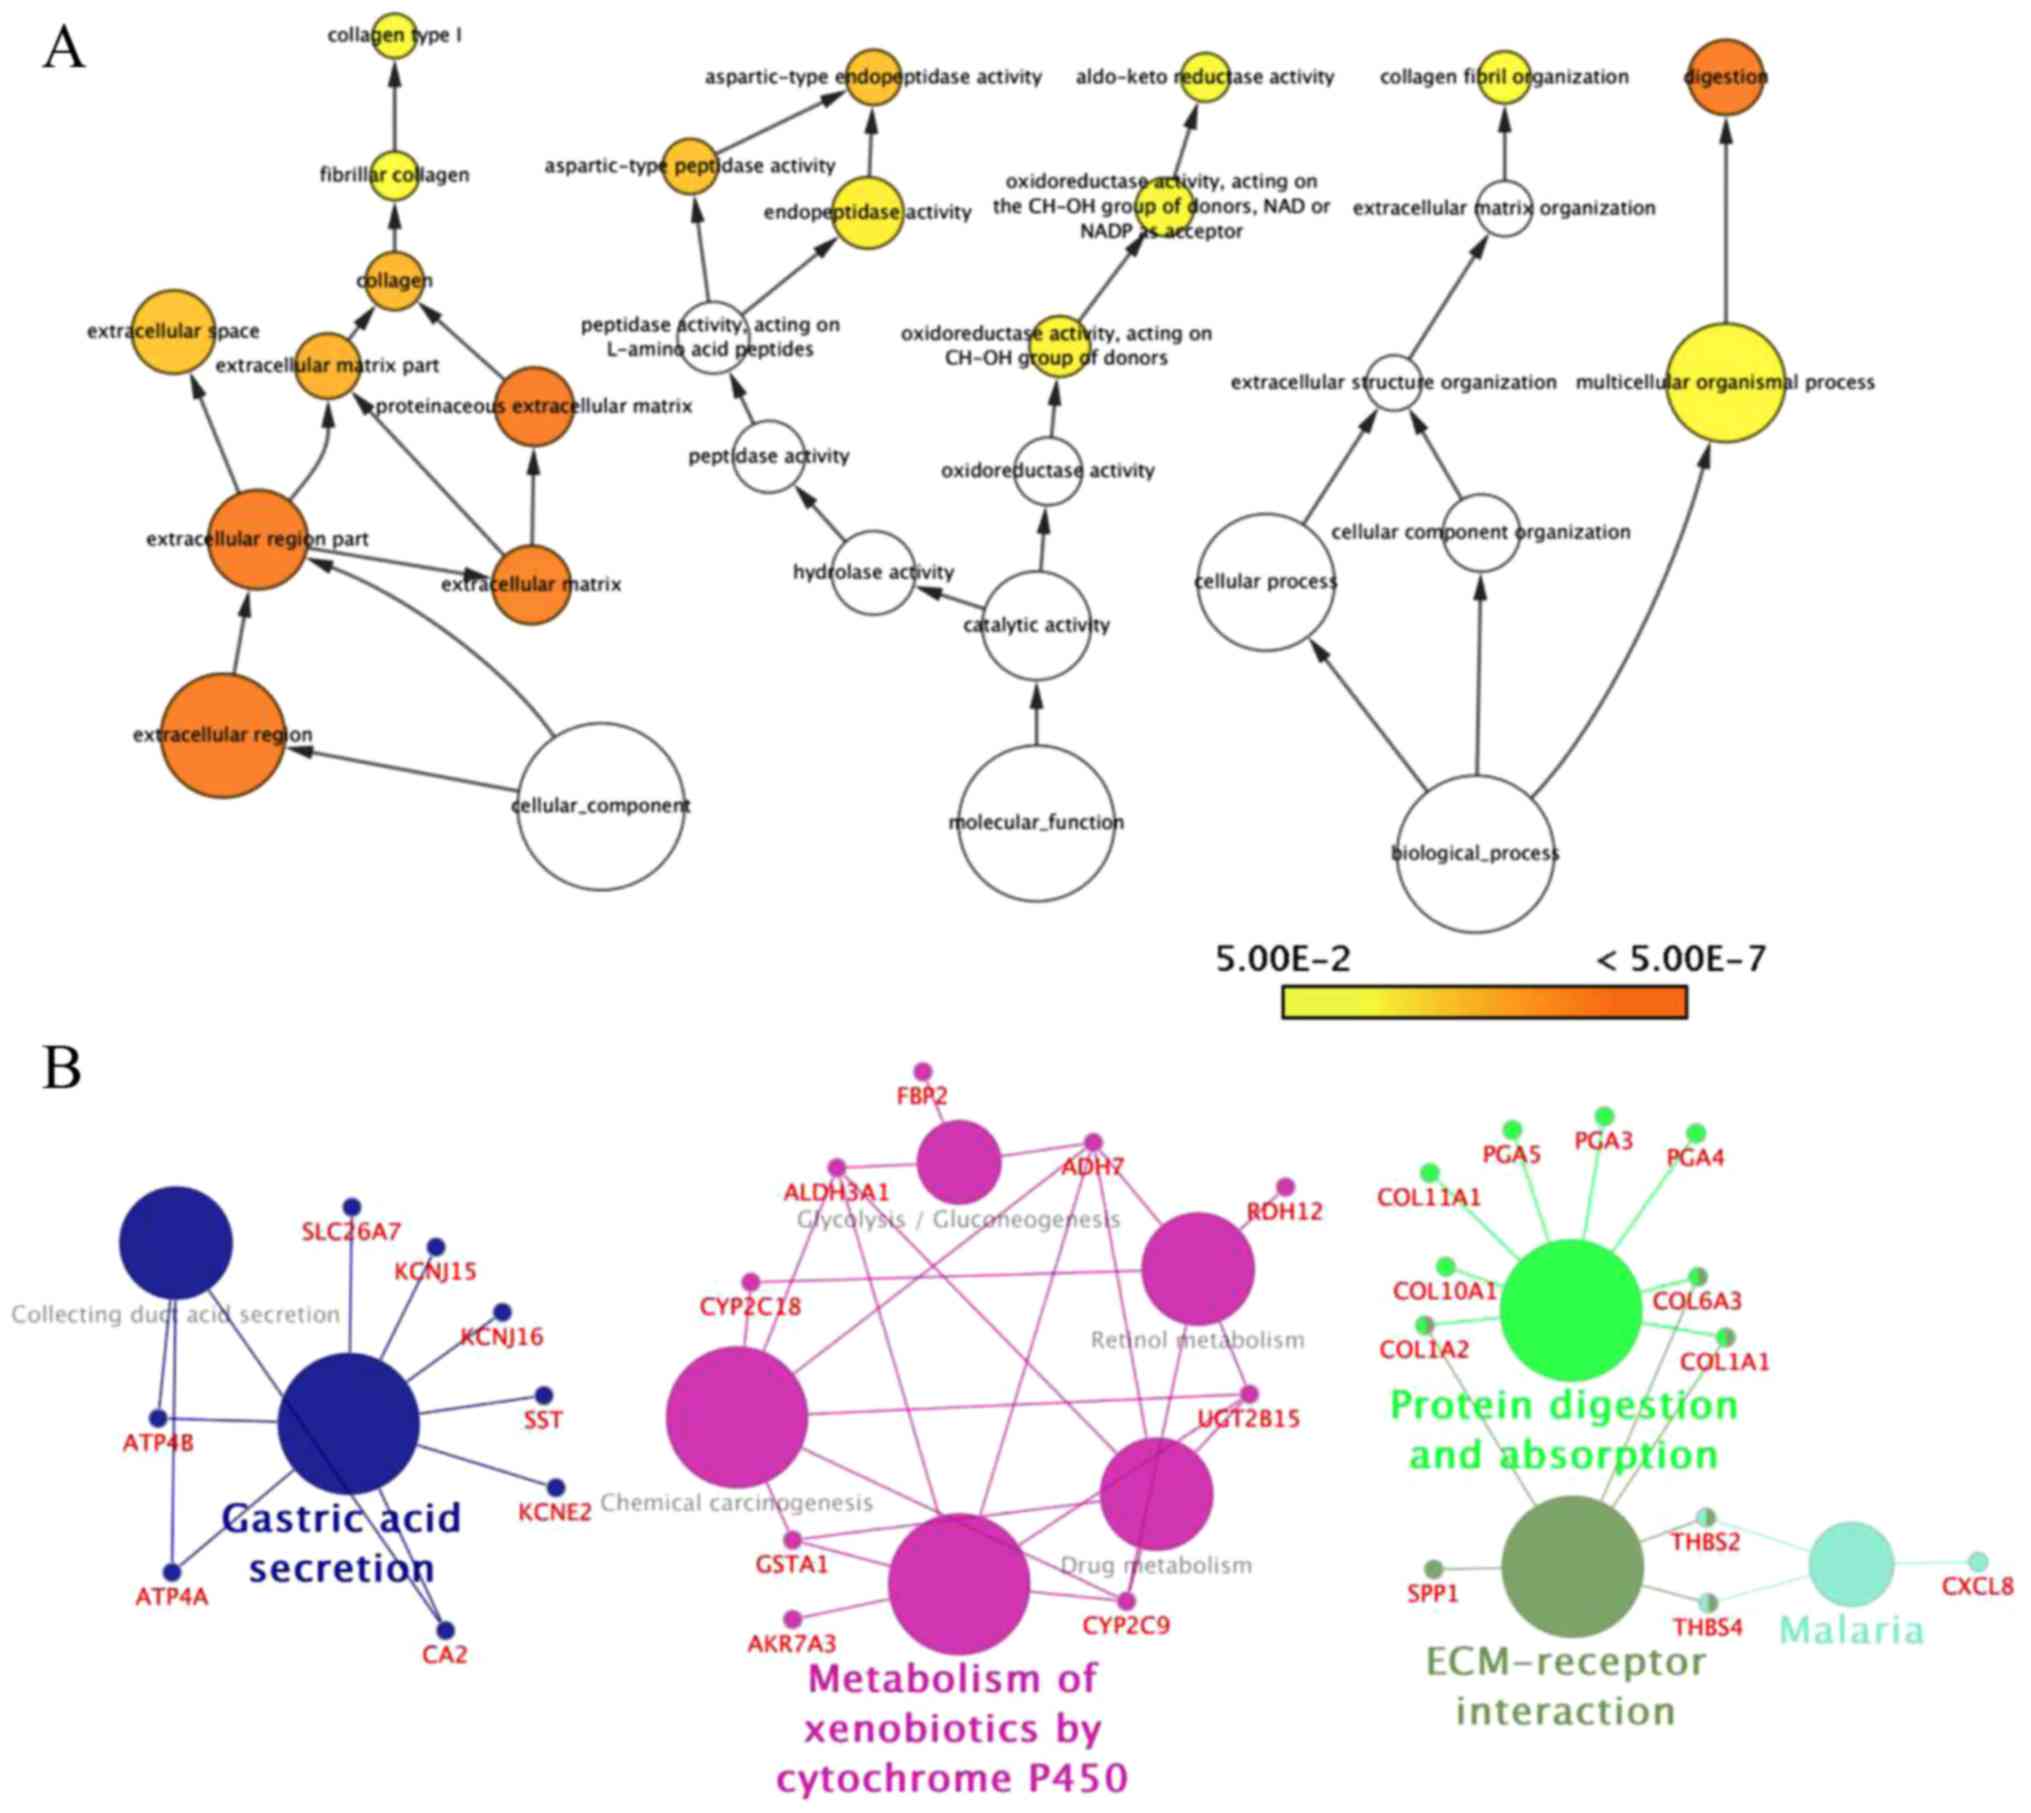
criteria (Fig. 2). These results
revealed enrichment of DEGs in: Cellular process and cellular
component organization within the biological process group;
catalytic activity and hydrolase activity within the molecular
function group; and extracellular region, extracellular matrix and
extracellular region within the cellular component group using Bigo
in Cytoscape (Fig. 3A). Analysis of
the DEG functional and signaling pathway enrichment was conducted
using ClueGo in Cytoscape to reveal that the DEGs are part of
important pathways in GC, including metabolism of xenobiotics by
cytochrome P450, chemical carcinogenesis, drug metabolism, ECM
interaction, and protein digestion and absorption (Fig. 3B).
 | Table I.Overlapping DEGs in the GSE54129,
GSE79973 and GSE56807 datasets. |
Table I.
Overlapping DEGs in the GSE54129,
GSE79973 and GSE56807 datasets.
|
| Genes |
|---|
| Downregulated | INHBA, COL10A1,
FNDC1, FAP, THBS2, CST1, SULF1, SFRP4, SPP1, CEMIP, IGF2BP3,
MIR675///H19, KLK10, ADAMTS2, CTHRC1, COL11A1, ASPN, PDLIM7, BGN,
WISP1, CXCL8, THBS4, COL1A1, COL1A2, MFAP2, ADAMTS12, COL8A1,
TIMP1, RARRES1, COL6A3, THY1 |
| Upregulated | AKR7A3, GATA5, DUOX2,
RASSF6, B4GALNT3, REG1A, SCIN, TCN1, CNTN3, SPINK7, OTC, CTSE,
CYP2C18, ORM2///ORM1, PTPRZ1, SH3RF2, ATP4B, VSTM2A, CYP2C9,
LINC00982, ACER2, RFX6, CA2, FAM3B, CAPN13, ADTRP, SCNN1B,
TRIM74///TRIM73, C6orf58, SST, UGT2B15, TMED6, CLDN18, MFSD4A,
C16orf89, LINC00675, SULT1C, DAZ4///DAZ2///DAZ3///DAZ1, ANXA10,
KCNJ15, UPK1B, CAPN9, HPGD, GATA6-AS1, MAP7D2, VSIG2, SSTR1,
SLC26A7, KCNJ16, RDH12, PSCA, FUT9, PIK3C2G, TPCN2, CA9, KIAA1324,
LINC00261, ADGRG2, SCGB2A1, ALDH3A1, FBP2, MUC5AC, SLC26A9, MAL,
TFF1, ADH7, TFF2, PGC, GSTA1, MSMB, AKR1B10, CXCL17, ESRRG, LTF,
DPCR1, KRT20, PSAPL1, KCNE2, SOSTDC, LIPF, GIF, PGA4///PGA3///PGA5,
ATP4A, GKN1, GKN2, CWH43, VSIG1 |
Validation of the relationship between
expression of UGT2B15 and clinical characteristics in GC using TCGA
data
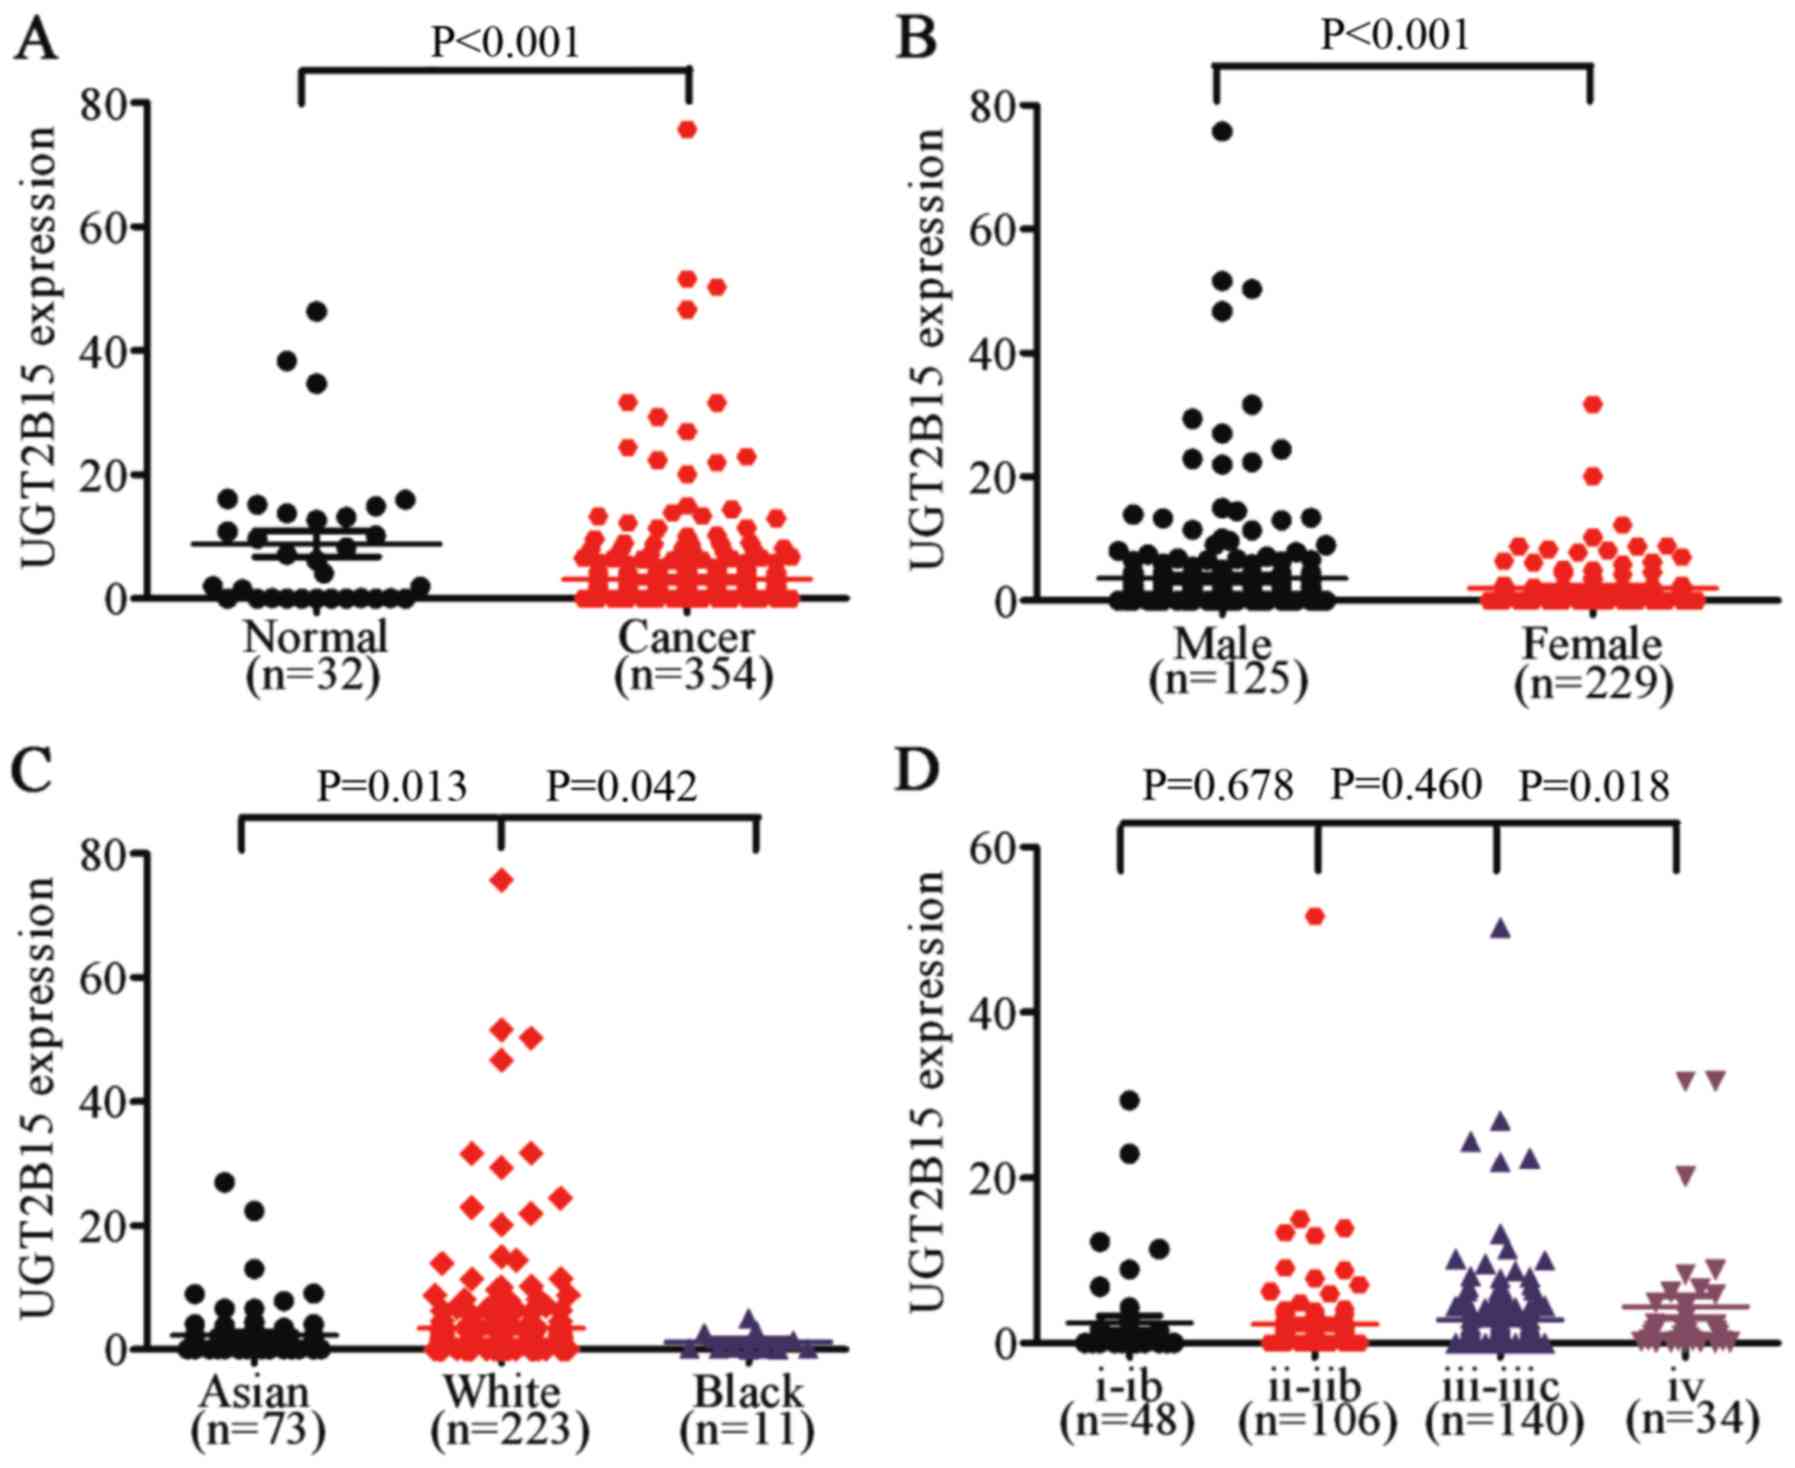
In order to validate the correlation between UGT2B15
expression and clinical characteristics of GC, we downloaded
clinical data and UGT2B15 mRNA expression data from the TCGA
dataset containing 354 GC and 32 normal samples (data not shown).
The results showed that UGT2B15 was upregulated in GC tissue
compared to that found in the non-cancerous gastric tissue
(P<0.001) (Fig. 4A). We further
discovered that UGT2B15 was overexpressed in male GC patients
(P<0.001) compared to female GC patients, and that expression of
UGT2B15 in Caucasian GC patients was significantly higher than that
in Asian or black GC patients (P=0.013 and P=0.042, respectively)
(Fig. 4B and C). We then
demonstrated that UGT2B15 was upregulated in stage IV GC tissues
(P=0.018) (Fig. 4D).
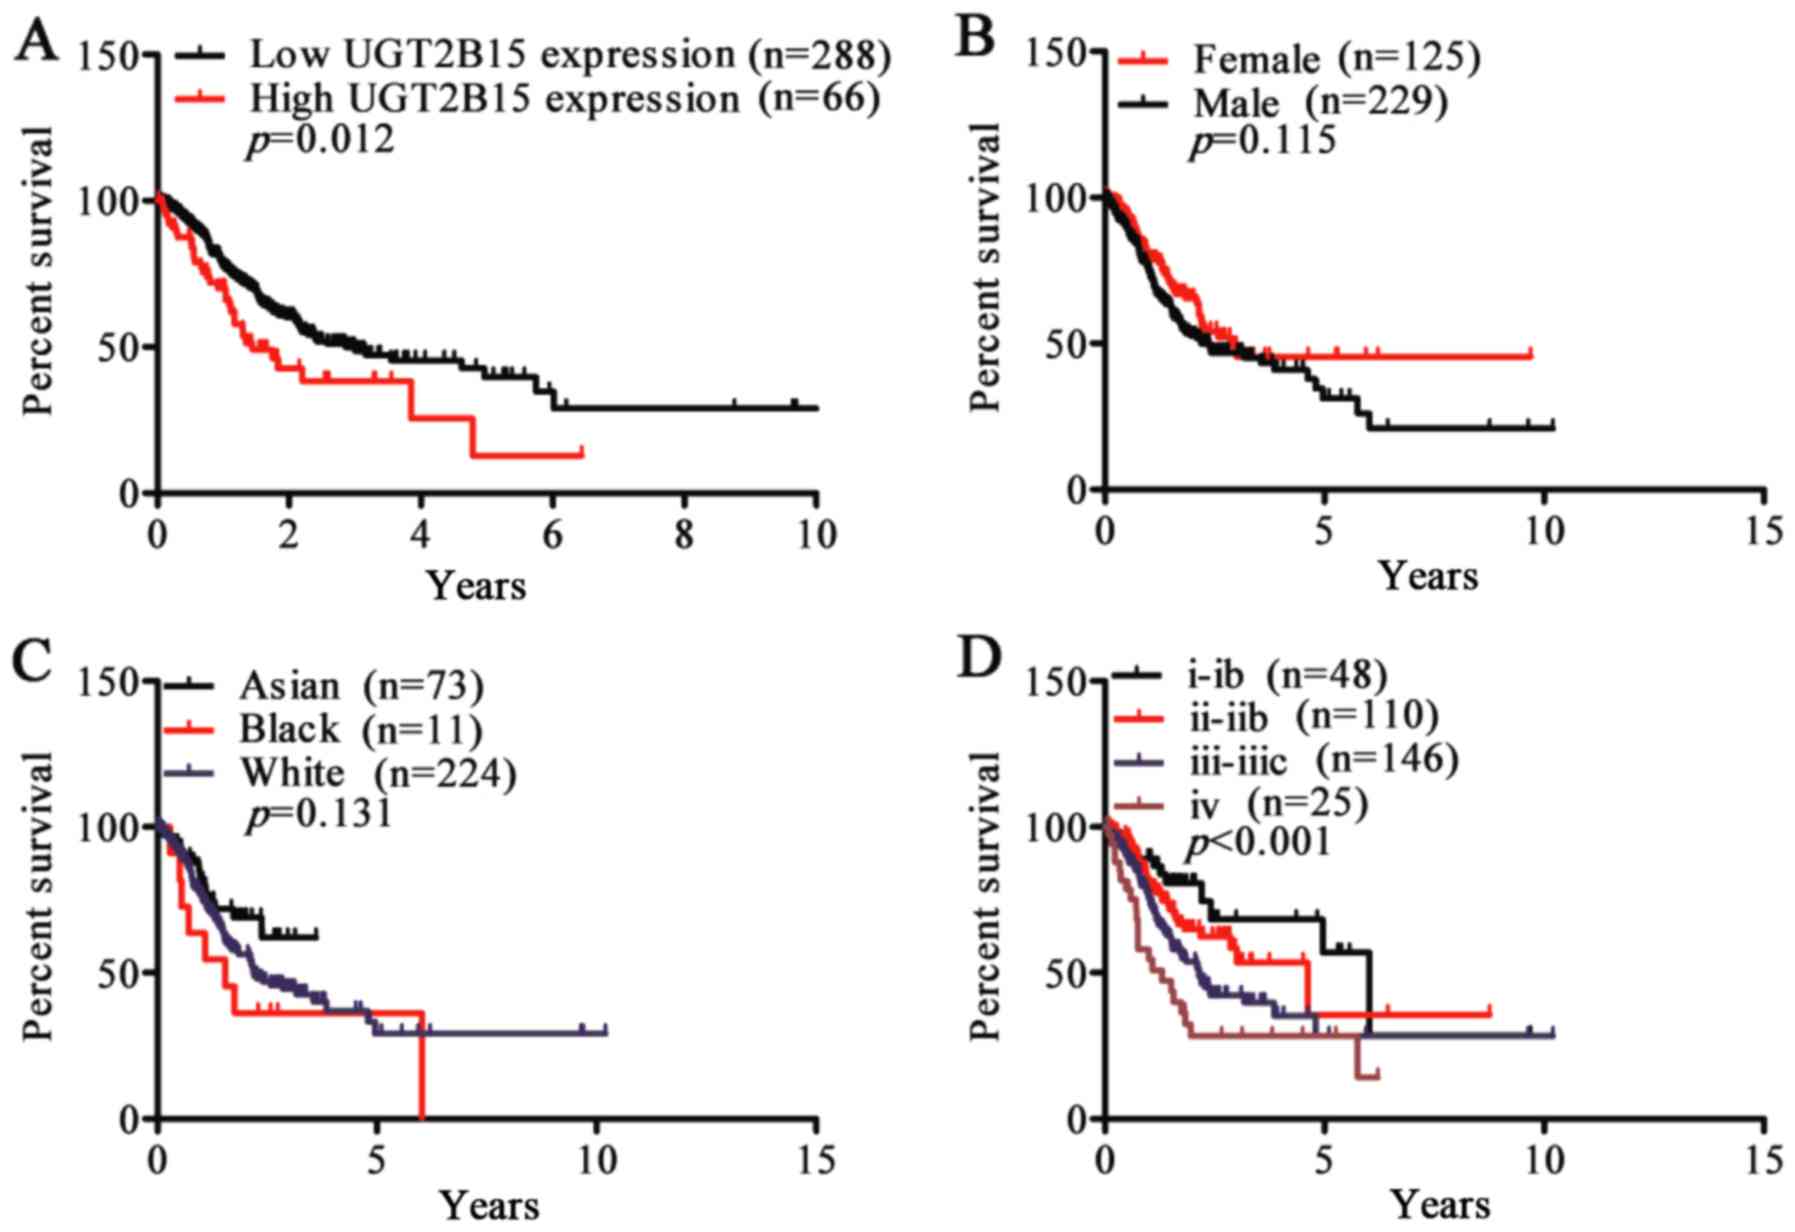
To validate overexpression of UGT2B15 as a
prognostic factor in GC, the following analysis was performed.
Using the mean ratio of relative UGT2B15 expression as the cut-off,
354 GC patients were classified into 2 groups, high-expression
(n=66, >0.7) and low-expression (n=288, <0.7). Kaplan-Meier
survival analysis and log-rank tests showed that patients with
higher UGT2B15 expression had shorter survival time than those with
lower UGT2B15 expression (P=0.012) (Fig
5A). However, although we found significant differences in
UGT2B15 expression among different sex and races, the differences
in survival curves of sex and race were not statistically
significant (P=0.115, P=0.131) (Fig. 5B
and C). Consistent with our results showing higher expression
of UGT2B15 in stage IV disease, patients with stage IV tended to
have poor prognosis (P<0.001) (Fig.
5D).
UGT2B15 positively correlates with
Foxa1
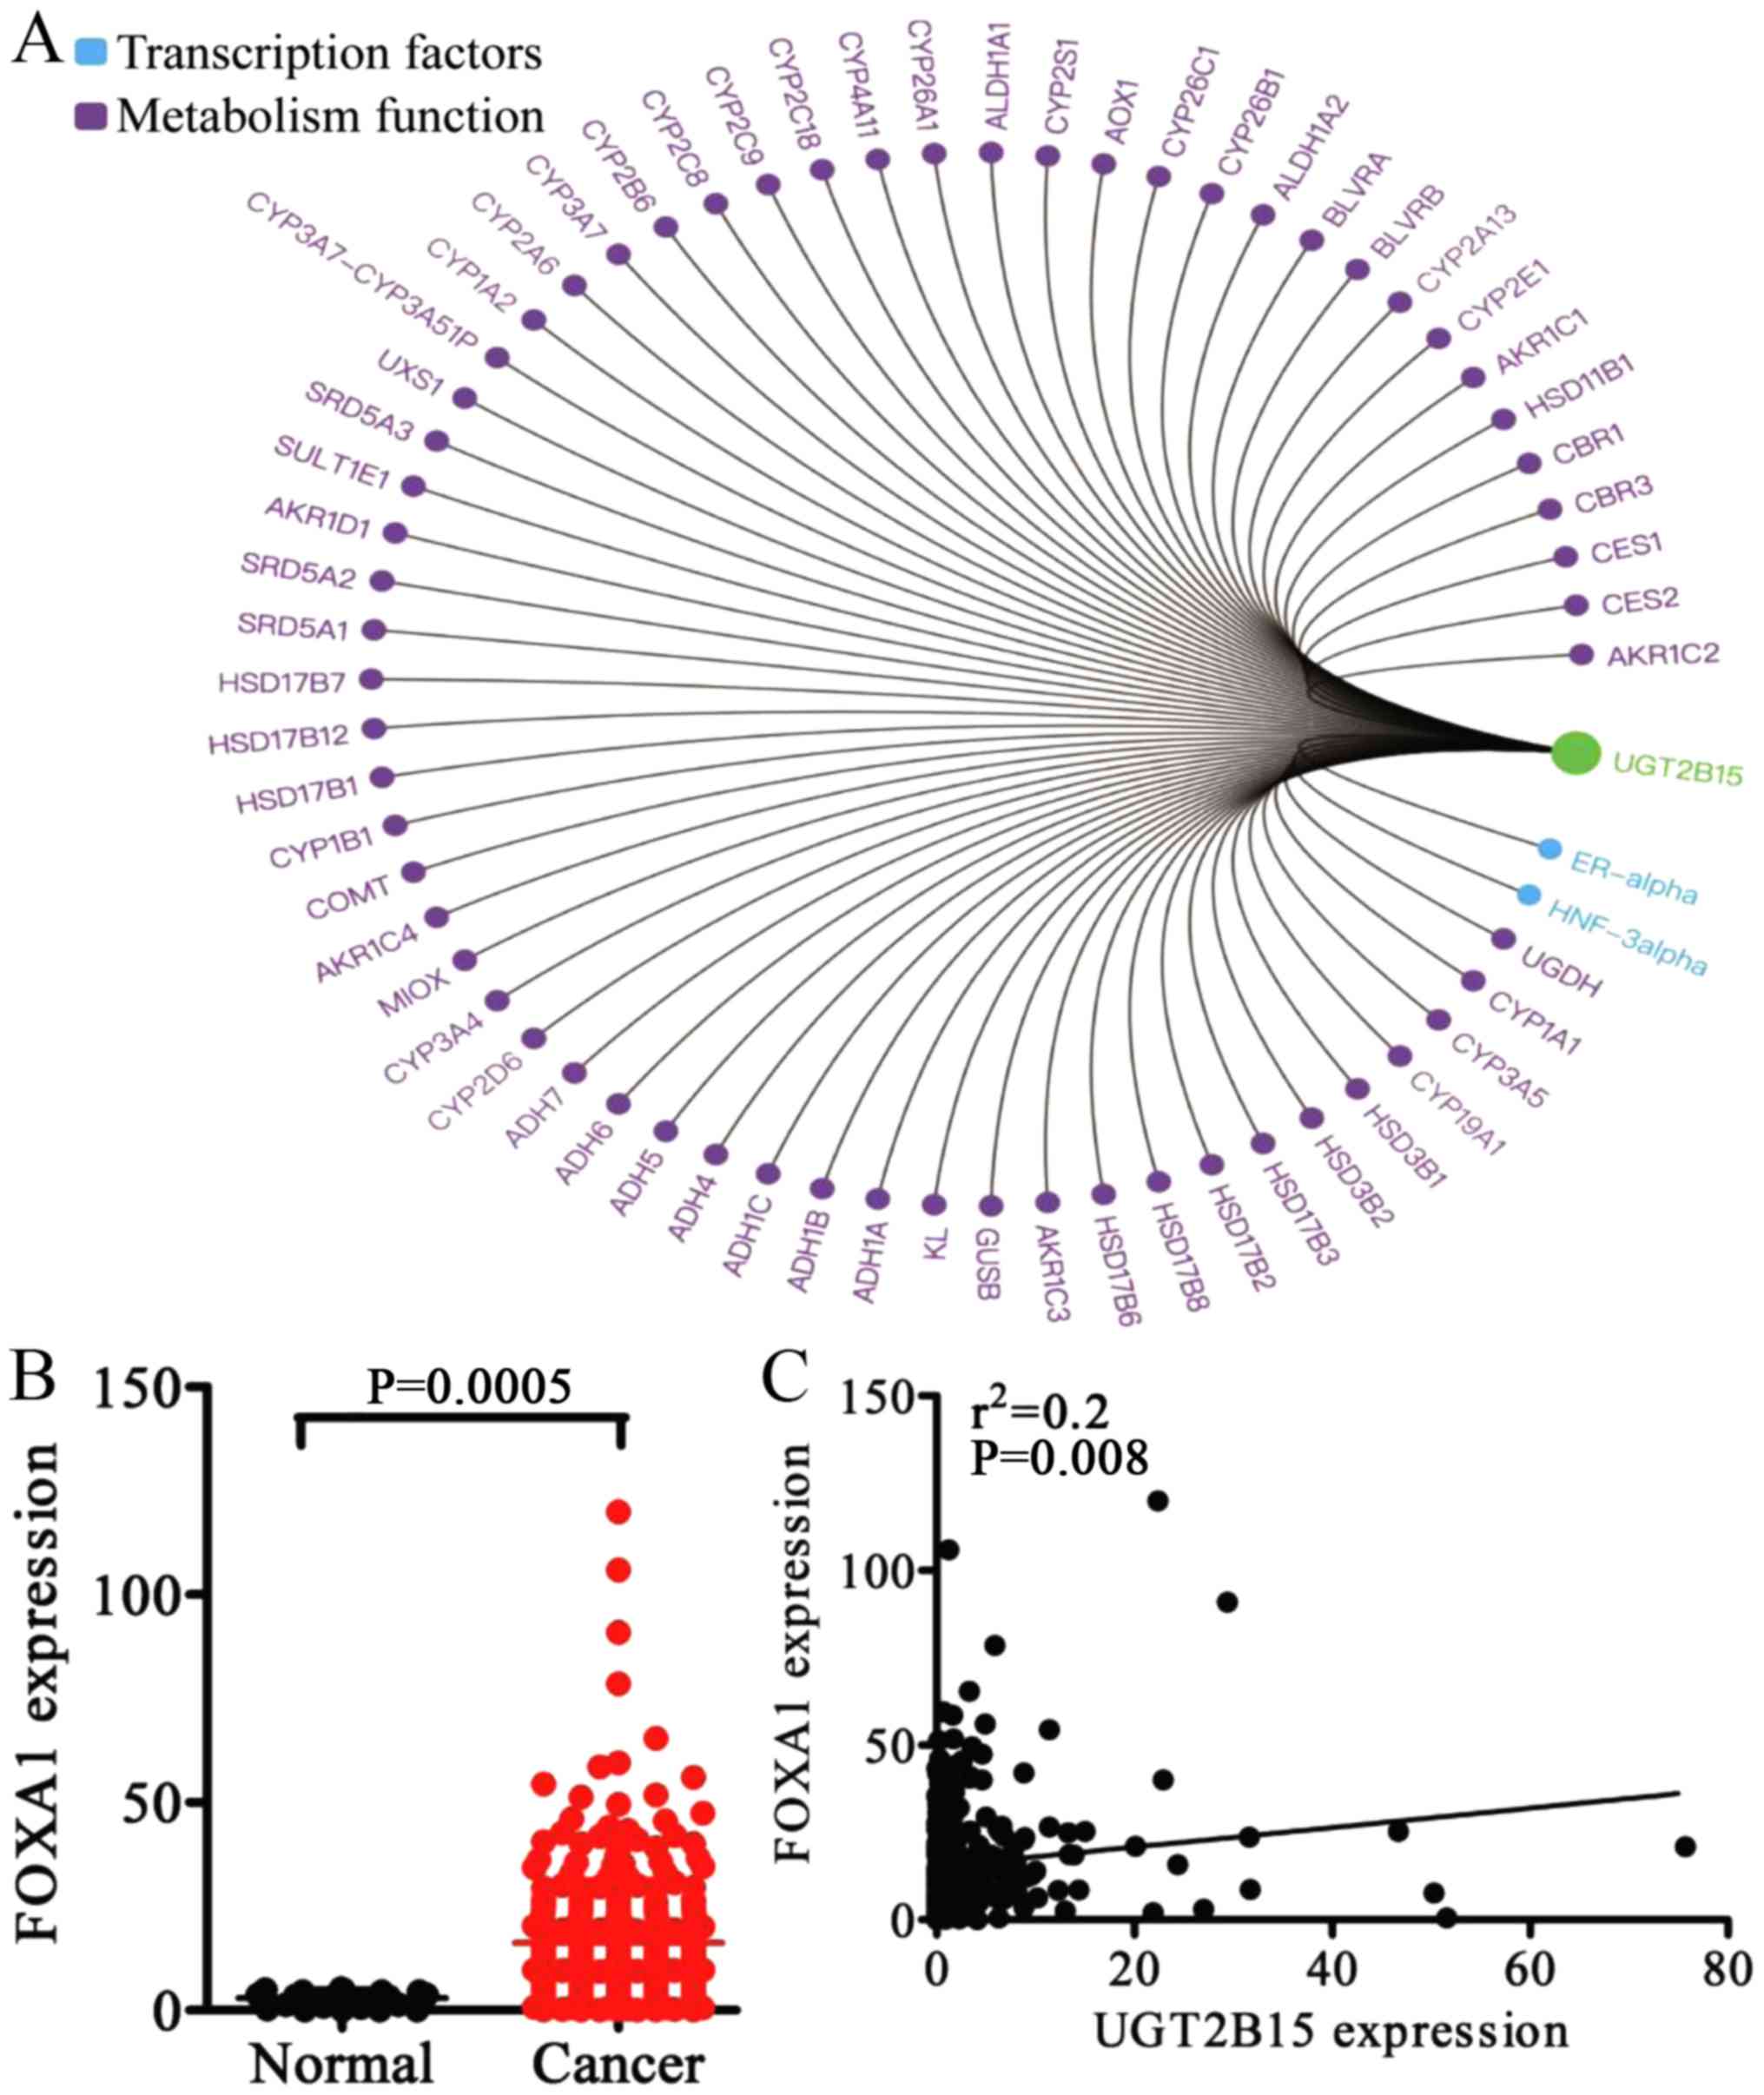
To explore the molecular mechanism of UGT2B15,
Gene-Cloud Biotechnology Information (GCBI) analysis was performed
to predict the function of UGT2B15; this showed that UGT2B15 had
two transcription factors, ER-α and HNF-3a (FOXA1), and numerous
metabolism function genes (Fig.
6A). It has been demonstrated that UGT2B15 regulates ER-α in
breast cancer; however, the regulatory and functional relationships
between UGT2B15 and Foxa1 remain unknown.
Clinical data and FOXA1 mRNA expression data were
obtained from the TCGA dataset, providing 354 GC tissues and 32
non-cancerous gastric tissues (data not shown). Results showed that
FOXA1 was upregulated in GC tissues compared to non-cancerous
gastric tissues (P=0.0005) (Fig.
6B). The Pearson correlation coefficient confirmed that UGT2B15
and FOXA1 were positively correlated in GC tissues (R=0.2, P=0.008)
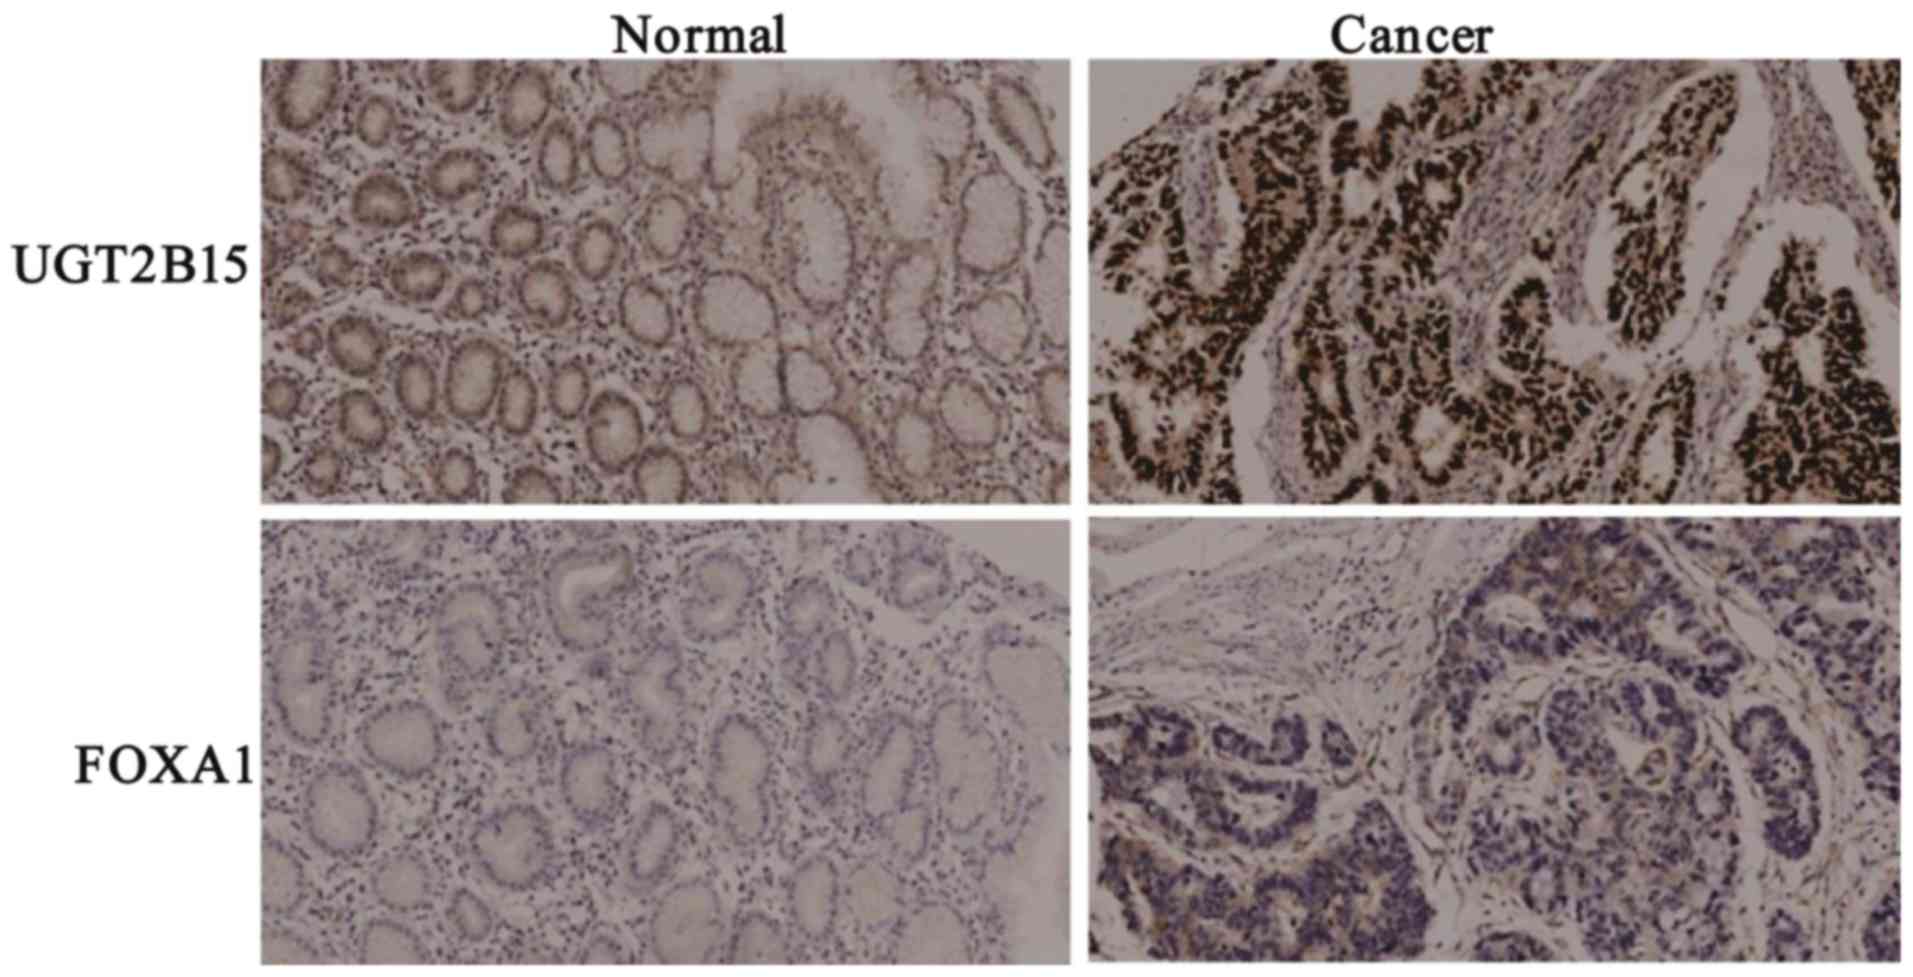
(Fig. 6C). Immunohistochemistry was
performed on 32 pairs of GC and adjacent non-tumorous tissues to
confirm UGT2B15 and Foxa1 protein expression. Our results
demonstrated the upregulation of both UGT2B15 protein and Foxa1
protein in GC tissues (Fig. 7).
Discussion
GC is one of most common malignant tumors worldwide,
particularly in East Asian countries such as China. Most patients
with GC are diagnosed at the advanced stage and present with a
relatively poor prognosis for overall survival. As is well
recognized, GC results from the accumulation of multiple molecular
alterations in cells (1).
Therefore, identification of genes with oncogenic
potential or tumor suppressor activity may be of great value for
diagnosis and treatment. In the present study, we investigated
prognostic and predictive genes based on date available from public
databases, and established and validated one prognostic signature,
UGT2B15.
UGT2B15 is one of several functional members of the
UGT2B subfamily. This protein is expressed primarily in the liver
along with several extra-hepatic tissues, including prostate and
breast cancer, and plays an important role in the glucuronidation
of androgenic steroids (18,19).
Hwang et al discovered polymorphisms of UGT2B15 that
contributed to individual variations in drug and hormone metabolism
in Korean as well as other ethnic populations (20). It has been reported that UGT2B15 may
lead to progression and drug resistance in cancer. In addition, it
has been found that UGT2B15 is downregulated in prostate cancer,
and is negatively correlated with castration-resistant prostate
cancer and lymph node metastases (19). However, Pfeiffer et al
demonstrated UGT2B15 upregulation in prostate cancer that led to
castration resistance (21). It has
also been shown that UGT2B15 can reduce tamoxifen therapeutic
efficacy and contribute to the development of acquired resistance
to tamoxifen treatment via overexpression of UGT2B15 in breast
cancer cells (18). However,
Sutiman et al reported that UGT2B15 appeared to be of minor
importance in breast cancer patients receiving tamoxifen (22). Therefore, the function of UGT2B15 is
unclear in cancer.
In the present study, we first demonstrated UGT2B15
overexpression in GC tissues; moreover, it was upregulated in male,
Caucasian and stage IV GC patients. Furthermore, patients with
overexpressed UGT2B15 or stage IV GC cancer had significantly
poorer overall survival time; however, no significant difference in
overall survival time was detected in different races or sex. GO
analysis and pathway analysis demonstrated UGT2B15 enrichment in
extracellular region, chemical carcinogenesis, and drug metabolism.
These results also suggest that UGT2B15 plays a role in progression
and drug metabolism.
To confirm the biological effects of UGT2B15 in GC,
we discovered that UGT2B15 can regulate transcription factors ER-α
and HNF-3a (Foxa1) using Gene-Cloud Biotechnology information
(GCBI). It has been confirmed that UGT2B15 regulates ER-α in breast
cancer (18); however, the
regulatory and functional relationships between UGT2B15 and Foxa1
remain unknown. We discovered that FOXA1 mRNA was upregulated in
GC, and was positively correlated with expression of UGT2B15 in GC
tissues with TCGA data. It has been demonstrated that FOXA1 acts as
an oncogene and has roles in tumorigenesis, progression, and drug
resistance, in ovarian, breast and GC (23–25).
For example, overexpression of Foxa1 promoted GC cell proliferation
and metastasis, via a mechanism involving Foxa1 activation of the
Hippo-YAP signaling pathway by upregulation of YAP1 in GC (25). However, we demonstrated that UGT2B15
and Foxa1 protein were overexpressed in GC tissues by IHC. This
implies that UGT2B15 regulates Foxa1 expression contributing to the
development of GC through activating the Hippo-YAP signaling
pathway.
In conclusion, this study suggests that UGT2B15 has
an oncogenic role, and may be a promising therapeutic target for GC
treatment. Further investigation is needed to elucidate the
biological mechanisms of UGT2B15 in GC in vivo and in
vitro.
Acknowledgements
The authors thank Mr. He Jie for his technical
support and ‘World of Plainness’ authored by Yao Lu for the
motivation.
Funding
The present study was supported by the Natural
Science Foundation of Hunan Province (no. 2017JJ3270), the Three
Engineering Training Funds in Shenzhen (no. SYLY201718 and
SYJY201801) and the Technical Research and Development Project of
Shenzhen (no. JCYJ20150403101028164).
Availability of data and materials
The datasets used during the present study are
available from the corresponding author upon reasonable
request.
Authors' contributions
YB, JY and DeL conceived and designed the study.
DiL, XC, NW, MY, AL and SW acquired the data. GH, BZ, YY, DiL, HL,
WZ and WX analyzed the data. DiL, PL and CM drafted the manuscript
and were involved in the conception of the study. SP, PC and LJ
performed the statistical analysis. JY and DeL obtained the data.
All authors read and approved the manuscript and agree to be
accountable for all aspects of the research in ensuring that the
accuracy or integrity of any part of the work are appropriately
investigated and resolved.
Ethics approval and consent to
participate
The study was approved by the Shenzhen People's
Hospital Institutional Ethics Committee (Shenzhen, China).
Patient consent for publication
Not applicable.
Competing interests
The authors declare that they have no competing
interests.
References
|
1
|
Torre LA, Bray F, Siegel RL, Ferlay J,
Lortet-Tieulent J and Jemal A: Global cancer statistics, 2012. CA
Cancer J Clin. 65:87–108. 2015. View Article : Google Scholar : PubMed/NCBI
|
|
2
|
Yan C, Zhu M, Huang T, Yu F and Jin G:
Genome-wide association studies identified loci contribute to
phenotypic variance of gastric cancer. Gut. 2017.
|
|
3
|
Huang LY, Wang X, Cui XF, Li H, Zhao J, Wu
CC, Min L, Zhou Z, Wan L, Wang YP, et al: IRTKS is correlated with
progression and survival time of patients with gastric cancer. Gut.
2017.
|
|
4
|
Zhang X and Xu W: Neutrophils diminish
T-cell immunity to foster gastric cancer progression: The role of
GM-CSF/PD-L1/PD-1 signalling pathway. Gut. 66:1878–1880. 2017.
View Article : Google Scholar : PubMed/NCBI
|
|
5
|
Gan L, Meng J, Xu M, Liu M, Qi Y, Tan C,
Wang Y, Zhang P, Weng W, Sheng W, et al: Extracellular matrix
protein 1 promotes cell metastasis and glucose metabolism by
inducing integrin beta4/FAK/SOX2/HIF-1alpha signaling pathway in
gastric cancer. Oncogene. 37:744–755. 2017. View Article : Google Scholar : PubMed/NCBI
|
|
6
|
Brower V: Apatinib in treatment of
refractory gastric cancer. Lancet Oncol. 17:e1372016. View Article : Google Scholar : PubMed/NCBI
|
|
7
|
Bang YJ, Im SA, Lee KW, Cho JY, Song EK,
Lee KH, Kim YH, Park JO, Chun HG, Zang DY, et al: Randomized,
double-blind phase II trial with prospective classification by ATM
protein level to evaluate the efficacy and tolerability of olaparib
plus paclitaxel in patients with recurrent or metastatic gastric
cancer. J Clin Oncol. 33:3858–3865. 2015. View Article : Google Scholar : PubMed/NCBI
|
|
8
|
Reyna DE, Garner TP, Lopez A, Kopp F,
Choudhary GS, Sridharan A, Narayanagari SR, Mitchell K, Dong B,
Bartholdy BA, et al: Direct activation of BAX by BTSA1 overcomes
apoptosis resistance in acute myeloid leukemia. Cancer Cell.
32:490–505. 2017. View Article : Google Scholar : PubMed/NCBI
|
|
9
|
Buttner R, Gosney JR, Skov BG, Adam J,
Motoi N, Bloom KJ, Dietel M, Longshore JW, Lopez-Rios F,
Penault-Llorca F, et al: Programmed death-ligand 1
immunohistochemistry testing: A review of analytical assays and
clinical implementation in non-small-cell lung cancer. J Clin
Oncol. 35:3867–3876. 2017. View Article : Google Scholar : PubMed/NCBI
|
|
10
|
Ge W, Zhao K, Wang X, Li H, Yu M, He M,
Xue X, Zhu Y, Zhang C, Cheng Y, et al: iASPP is an antioxidative
factor and drives cancer growth and drug resistance by competing
with Nrf2 for keap1 binding. Cancer Cell. 32:561–573. 2017.
View Article : Google Scholar : PubMed/NCBI
|
|
11
|
Sidaway P: Breast cancer: LAG3 expression
indicates favourable outcomes. Nat Rev Clin Oncol. 14:7122017.
View Article : Google Scholar
|
|
12
|
Shou Z, Jin X, He X, Zhao Z, Chen Y, Ye M
and Yao J: Overexpression of Musashi-1 protein is associated with
progression and poor prognosis of gastric cancer. Oncol Lett.
13:3556–3566. 2017. View Article : Google Scholar : PubMed/NCBI
|
|
13
|
Shimada Y, Okumura T, Sekine S, Moriyama
M, Sawada S, Matsui K, Yoshioka I, Hojo S, Yoshida T, Nagata T, et
al: Expression analysis of iPS cell-inductive genes in esophageal
squamous cell carcinoma by tissue microarray. Anticancer Res.
32:5507–5514. 2012.PubMed/NCBI
|
|
14
|
Hippo Y, Taniguchi H, Tsutsumi S, Machida
N, Chong JM, Fukayama M, Kodama T and Aburatani H: Global gene
expression analysis of gastric cancer by oligonucleotide
microarrays. Cancer Res. 62:233–240. 2002.PubMed/NCBI
|
|
15
|
Vendrell JA, Thollet A, Nguyen NT, Ghayad
SE, Vinot S, Bieche I, Grisard E, Josserand V, Coll JL, Roux P, et
al: ZNF217 is a marker of poor prognosis in breast cancer that
drives epithelial-mesenchymal transition and invasion. Cancer Res.
72:3593–3606. 2012. View Article : Google Scholar : PubMed/NCBI
|
|
16
|
Sun Y, Zheng S, Torossian A, Speirs CK,
Schleicher S, Giacalone NJ, Carbone DP, Zhao Z and Lu B: Role of
insulin-like growth factor-1 signaling pathway in
cisplatin-resistant lung cancer cells. Int J Radiat Oncol Biol
Phys. 82:e563–572. 2012. View Article : Google Scholar : PubMed/NCBI
|
|
17
|
Budhu A, Forgues M, Ye QH, Jia HL, He P,
Zanetti KA, Kammula US, Chen Y, Qin LX, Tang ZY and Wang XW:
Prediction of venous metastases, recurrence, and prognosis in
hepatocellular carcinoma based on a unique immune response
signature of the liver microenvironment. Cancer Cell. 10:99–111.
2006. View Article : Google Scholar : PubMed/NCBI
|
|
18
|
Hu DG, Selth LA, Tarulli GA, Meech R,
Wijayakumara D, Chanawong A, Russell R, Caldas C, Robinson JL,
Carroll JS, et al: Androgen and estrogen receptors in breast cancer
coregulate human UDP-glucuronosyltransferases 2B15 and 2B17. Cancer
Res. 76:5881–5893. 2016. View Article : Google Scholar : PubMed/NCBI
|
|
19
|
Grosse L, Paquet S, Caron P, Fazli L,
Rennie PS, Belanger A and Barbier O: Androgen glucuronidation: An
unexpected target for androgen deprivation therapy, with prognosis
and diagnostic implications. Cancer Res. 73:6963–6971. 2013.
View Article : Google Scholar : PubMed/NCBI
|
|
20
|
Hwang MS, Lee SJ, Kim WY, Jeong HE and
Shin JG: Genetic variations in UDP-glucuronosyltransferase 2B15 in
a Korean population. Drug Metab Pharmacokinet. 29:105–109. 2013.
View Article : Google Scholar : PubMed/NCBI
|
|
21
|
Pfeiffer MJ, Smit FP, Sedelaar JP and
Schalken JA: Steroidogenic enzymes and stem cell markers are
upregulated during androgen deprivation in prostate cancer. Mol
Med. 17:657–664. 2011. View Article : Google Scholar : PubMed/NCBI
|
|
22
|
Sutiman N, Lim JS, Muerdter TE, Singh O,
Cheung YB, Ng RC, Yap YS, Wong NS, Ang PC, Dent R, et al:
Pharmacogenetics of UGT1A4, UGT2B7 and UGT2B15 and their influence
on Tamoxifen disposition in Asian breast cancer patients. Clin
Pharmacokinet. 55:1239–1250. 2016. View Article : Google Scholar : PubMed/NCBI
|
|
23
|
Wang LL, Xiu YL, Chen X, Sun KX, Chen S,
Wu DD, Liu BL and Zhao Y: The transcription factor FOXA1 induces
epithelial ovarian cancer tumorigenesis and progression. Tumour
Biol. 39:10104283177062102017.PubMed/NCBI
|
|
24
|
Davis DG, Siddiqui MT, Oprea-Ilies G,
Stevens K, Osunkoya AO, Cohen C and Li XB: GATA-3 and FOXA1
expression is useful to differentiate breast carcinoma from other
carcinomas. Hum Pathol. 47:26–31. 2016. View Article : Google Scholar : PubMed/NCBI
|
|
25
|
Ren H, Zhang P, Tang Y, Wu M and Zhang W:
Forkhead box protein A1 is a prognostic predictor and promotes
tumor growth of gastric cancer. Onco Targets Ther. 8:3029–3039.
2015.PubMed/NCBI
|