Introduction
Gastric cancer (GC) is the fifth most common type of
malignancy and the third leading cause of cancer-associated
mortality worldwide (1). Half of
all cases worldwide occur in East Asia (1). The prognosis of GC is generally poor,
particularly in patients with advanced stages of the disease
(1). At present, the routine
treatment for advanced GC involves surgical resection and
perioperative chemotherapy (2).
Immunotherapeutic drugs, particularly immune checkpoint inhibitors,
including anti-programmed death (PD)1 (nivolumab and pembrolizumab)
and anti-cytotoxin T-lymphocyte-associated protein 4 (CTLA4)
(ipilimumab) drugs, were recently approved by the Food and Drug
Administration to treat a number of solid tumor types. Although
there have been successful cases of immune checkpoint inhibitor use
in these tumor types, certain patients have been revealed to be
resistant to therapies targeting CTLA-4 and PD-1 (3). The T-cell immunoglobulin and mucin
domain-containing protein 3 (Tim-3)/galectin 9 (Gal-9) pathway,
which is yet to be entirely characterized, may be a potential site
of immune checkpoint blockade in immunotherapy, which could be used
to overcome drug resistance (3).
Tim-3 was first identified as a molecule expressed
in interferon (IFN)-γ-producing cluster of differentiation
(CD)4+ T helper 1 (Th1) and CD8+ T cytotoxic
1 (Tc1) cells (4). It has been
reported that Tim-3 dysregulation in CD4+ and
CD8+ T cells is associated with tumorigenesis (5). When Tim-3 interacts with its ligand,
Gal-9, the Th1 response is blocked, resulting in the death of
IFN-induced Th1 cells. In a previous study, it was demonstrated
that Tim-3 reduces the antigen-specific T-cell response and
downregulates antitumor immunity in vivo by inhibiting the
Th1 response (6).
Galectins are characterized by their
β-galactoside-binding affinity, and have an evolutionarily
conserved carbohydrate recognition domain (CRD) (7). Galectins are classified according to
their CRD and are subdivided into three groups: Prototype galectins
(galectin-1, −2, −7, −10, −13 and −14), chimera-type galectins
(galectin-3) (each has a single CRD) and tandem-repeat-type
galectins (galectin-4, −8, −9 and −12) (each has two CRDs joined by
a flexible peptide linker). Gal-9 is a tandem-repeat-type galectin
that is known to serve key roles in eosinophil chemoattraction and
activation (8).
Forkhead box (FOX)p3, a member of the forkhead
family, is specifically expressed in Treg cells, including
CD4+ CD25high Treg cells and CD8+
CD25high Treg cells (9).
Treg cells are important factors in the development of immune
suppression and tolerance (10). A
previous study confirmed that high FOXp3 expression in Tregs allows
tumor cells to escape immune surveillance, thereby promoting the
proliferation and development of tumor cells (11).
To assess the association between the Tim-3/Gal-9
pathway and GC prognosis, Gal-9 and Tim-3 expression was measured
in 587 patients with gastric cancer using Gene Expression Omnibus
(GEO) databases and the K-M plotter website. The association
between CD3+, CD8+ and FOXp3+ T
cell infiltration and GC prognosis was also analyzed in the present
study.
Materials and methods
Patients and tissue microarray (TMA)
construction
The primary objective of the present study was to
evaluate the association between immune characteristics,
clinicopathological features and GC prognosis. This was a
retrospective analysis of 587 patients with primary GC who
underwent gastrectomy at the Department of Gastrointestinal
Surgery, Ren Ji Hospital, (School of Medicine, Shanghai Jiao Tong
University, Shanghai, China) between January 2006 and December
2011. The final follow-up date was December 31, 2015 for all cases
examined. The mean age of the patients was 61.6 years (range, 22–89
years), including 401 males and 186 females. A total of 251
cancer-associated mortalities occurred. All patients received
standard treatments, including D2 radical resection [excluding 6
cases with Tumor-Node-Metastasis (TNM) (12) stage IV] and first-line adjuvant
chemotherapy (for patients with advanced GC) according to the
National Comprehensive Cancer Network guidelines (https://www.nccn.org/). Lauren type was divided into
intestinal, diffuse and mixed as previously described (13). The location of the lesion was
classified into top, middle and bottom through linking the
corresponding trisection points of the lesser gastric curvature and
the greater gastric curvature. No patients had received neoadjuvant
chemotherapy or human epidermal growth factor receptor 2 targeted
therapy. A number of patients with advanced GC did not complete the
standard chemotherapy regimen for personal reasons or an inability
to tolerate side effects. There was no difference in the number of
patients not completing the standard chemotherapy regimen between
the Tim-3 high and low expression groups. The following exclusion
criteria were used: i) Recurrent GC following radical surgery; ii)
receipt of previous neoadjuvant chemotherapy or radiotherapy; iii)
the presence of other malignant tumors; and iv) evidence of
autoimmune or immunodeficiency diseases.
Formalin-fixed paraffin-embedded (FFPE) tissue
blocks were collected from the Pathology Department of Ren Ji
Hospital. TNM staging was performed based on the American Joint
Committee on Cancer (7th Edition) staging system
(12). For each case, the diagnosis
was confirmed by two senior pathologists through a review of
H&E-stained slides. Representative FFPE blocks were selected
for construction of the TMA using a tissue arrayer of 5-µm
thickness.
The present study was approved by the Ethics
Committee of Ren Ji Hospital, Shanghai Jiao Tong University School
of Medicine. Written informed consent was obtained from all
enrolled patients prior to their inclusion in the study.
TMA staining, fluorescence-activated
cell sorting (FACS) and evaluation
Immunohistochemistry (IHC) was performed on 5-µm
thick TMA sections with antibodies specific to Tim-3 (dilution,
1:200; cat. no. 45208; Cell Signaling Technology, Inc., Danvers,
MA, USA), Gal-9 (dilution, 1:250; cat. no. ab69630; Abcam,
Cambridge, UK), CD3 (dilution, 1:200; cat. no. GB11014; Wuhan
Goodbio Technology Co., Ltd., Wuhan, China), CD8 (dilution, 1:100;
cat. no. GB11068; Wuhan Goodbio Technology Co., Ltd.) and FOXp3
(dilution, 1:200; cat. no. 98377; Cell Signaling Technology, Inc.).
In brief, tissue sections were deparaffinized, rehydrated in a
graded ethanol series, and incubated with citrate antigen retrieval
solution for 15 min at 95°C and 3% hydrogen peroxide for 30 min at
37°C. Additionally, 1X PBS was used as washing reagent. Tissue
sections were blocked with 10% BSA (Sangon Biotech Co., Ltd.,
Shanghai, China) at room temperature for 1 h. Tissues were
subsequently incubated with primary antibodies at 4°C overnight,
followed by incubation with a horseradish peroxidase-conjugated
rabbit secondary antibody (dilution, 1:20,000; cat. no. 31460;
Thermo Fisher Scientific, Inc., Waltham, MA, USA) at room
temperature for 1 h. Positive staining was visualized using
3,3′-diaminobenzinidene substrate liquid (Gene Tech Biotechnology
Co., Ltd., Shanghai, China) and counterstained with hematoxylin at
room temperature for 10 sec. All sections were observed and images
were captured using an optical microscope (magnification, ×200 and
×400; Zeiss GmbH, Jena, Germany).
In the subsequent analysis, immune cells in vessels,
lymph nodes, lymphatics, necrotic tissue or necrosis-adjacent areas
were excluded. Tim-3 was mainly expressed in immune cells with low
expression in tumor cells, whereas Gal-9 was more highly expressed
in tumor cells. Tumor cell staining was used to evaluate Gal-9
expression. Based on the staining intensity and area, patients were
divided into high and low expression groups. Staining intensity was
defined as follows: Weak staining, 1; medium staining, 2; and
strong staining, 3. The median staining intensity value obtained
was multiplied by the percentage of the tissue area that was
stained. Nikon DR-Si2 cell counting and imaging software (version
4.30.01; Nikon DR-Si2; Nikon Corporation, Tokyo, Japan) was used
for this analysis. A total of 4 randomly selected fields of view
(magnification, ×200; 0.34 mm2) were used to analyze
each case, and the average number of Tim-3+,
CD3+, CD8+ and FOXp3+ cells was
counted. According to the median number of stained immune cells
(Tim-3) or T cells (CD3 and CD8), patients were divided into low
and high infiltration groups as previously described (14). To evaluate Foxp3+ T
cells, positive staining was defined as >5 stained
cells/high-power field (HPF) and negative staining was defined as
≤5 cells/HPF. The results were verified by two senior pathologists
who were blinded to the clinicopathological data of the
patients.
Detection of Tim-3 expression in
CD3+ T cells by FACS staining
Surgical resection of tumor tissues from one male
patient with GC (age, 62 years; TNM stage III) was performed in the
present study. A total of 1 g dissociated tissue was treated with
collagenase IV (cat. no. C5138; Sigma-Aldrich; Merck KGaA,
Darmstadt, Germany) for 90 min at 37°C on a rotating shaker. The
homogenates were filtered through membranes of 48 µm (Beijing
Solarbio Science & Technology Co., Ltd., Beijing, China) to
remove cell mass and fiber agglomerates. Tumor tissue-derived
single cells were obtained by centrifugation (400 × g at room
temperature for 10 min) and suspended in 1X PBS. Subsequently, the
cells were incubated with a mouse anti-human Tim-3 antibody
(PE-CF594; cat. no. 565561; dilution, 1:200; BD Biosciences,
Franklin Lakes, NJ, USA) and a fluorescein
isothiocyanate-conjugated CD3 antibody (cat. no. ab 210316;
dilution, 1:200, Abcam) for 30 min at 4°C in a dark environment.
Following washing in 1X PBS, Tim-3 expression was detected in
CD3+ T cells using a flow cytometer (BD Biosciences).
CD3 was considered to be a molecular marker of T cells in the
present study. FlowJo version 10 software was used for analysis
(FlowJo LLC, Ashland, OR, USA).
Cell culture and reagents
The human gastric cancer AGS, BGC-823, HGC-27,
MGC-803, MKN-45 and SGC-7901 cell lines were all maintained in the
Shanghai Cancer Institute, Ren Ji Hospital. All cells were cultured
in RPMI-1640 medium (Beijing Solarbio Science & Technology Co.,
Ltd.) or F-12 Medium (Gibco; Thermo Fisher Scientific, Inc.)
according to ATCC protocols and supplemented with 10% (v/v) fetal
bovine serum (FBS) and 1% antibiotics (100 µg/ml streptomycin and
100 U/ml penicillin) at 37°C in a humidified incubator at 5%
CO2. The cell medium was replaced every 2–3 days, and 1X
PBS was used for cell washing prior to the medium being replaced.
Cells were collected in the logarithmic growth phase for protein
and RNA extraction.
Reverse transcription-quantitative
polymerase chain reaction (RT-qPCR)
The thermocycling conditions were as follows: 60°C
for 34 sec and 95°C for 15 sec for 40 cycles. Total RNA was
extracted from AGS, BGC-823, HGC-27, MGC-803, MKN-45 and SGC-7901
cells using TRIzol reagent (Thermo Fisher Scientific, Inc.) and
reverse transcribed using a PrimeScript RT-PCR kit (Takara Bio.,
Inc., Otsu, Japan), according to the manufacturer's protocols.
RT-qPCR was performed with SYBR Premix Ex Taq (Takara Bio., Inc.)
using a 7500 Real-time PCR system (Thermo Fisher Scientific, Inc.).
The primer sequences used in the present study were as follows:
Tim-3 forward, 5′-CTGCTGCTACTACTTACAAGGTC-3′ [melting temperature
(Tm)=60.1°C] and reverse, 5′-GCAGGGCAGATAGGCATTCT-3′ (Tm=61.8°C);
Gal-9 forward, 5′-TCTGGGACTATTCAAGGAGGTC-3′ (Tm=60.3°C) and
reverse, 5′-CCACTGGAGCTGAGAACGG-3′ (Tm=62.0°C); and β-actin
forward, 5′-CATGTACGTTGCTATCCAGGC-3′ (Tm=60.8°C) and reverse,
5′-CTCCTTAATGTCACGCACGAT-3′ (Tm=60.2°C). The 2−∆ΔCq
method (15) was used to quantify
relative Tim-3 and Gal-9 expression, which was normalized to
β-actin.
Western blotting
Total protein was extracted using a total protein
extraction buffer (Beyotime Institute of Biotechnology, Haimen,
China) and the protein concentration was measured using a
bicinchoninic acid protein assay kit (Thermo Fisher Scientific,
Inc.). Proteins (30 µg per lane) were separated using 10% SDS-PAGE
and transferred onto a nitrocellulose membrane. Following blocking
with 1% BSA at room temperature for 1 h, the membrane was probed
with Tim-3 (dilution, 1:1,000; cat. no. 45208; Cell Signaling
Technology, Inc.), Gal-9 (dilution, 1:1,000; cat. no. ab69630;
Abcam) or β-actin (dilution, 1:1,000; cat. no. 20536-1-AP;
ProteinTech Group, Inc., Chicago, IL, USA) primary antibodies
overnight at 4°C, and a rabbit immunoglobulin G (H+L) secondary
antibody (dilution, 1:10,000; cat. no. 31460; Thermo Fisher
Scientific, Inc.) at room temperature for 1 h. Proteins were
visualized using the Molecular Imager ChemiDoc XRS+ System (Bio-Rad
Laboratories, CA, USA).
Analysis using K-M plotter
To analyze the association between immune marker
expression and patient prognosis, a number of GEO databases
(https://www.ncbi.nlm.nih.gov/geo/query/acc.cgi)
regarding Tim-3, Gal-9 and CD8A expression levels in GC and the K-M
plotter website (http://kmplot.com/analysis/) (16) were consulted. The following GEO
datasets were used: gse14210 (17),
gse15459 (18), gse22377 (19), gse29272 (20), gse51105 (21) and gse62254 (22).
Statistical analysis
Associations between Tim-3 expression and
clinicopathological factors were analyzed using the χ2
test or Fisher's exact test. Survival analysis was performed using
the Kaplan-Meier method and the log-rank test. Univariate and
multivariate analyses were conducted using the Cox proportional
hazards model to identify prognostic factors. All statistical tests
were two-sided and P<0.05 was considered to indicate a
statistically significant difference. Statistical analyses were
performed using SPSS 13.0 statistical package software (SPSS, Inc.,
Chicago, IL, USA) or GraphPad Prism (GraphPad Software Inc., La
Jolla, CA, USA).
Results
Clinicopathological features of
patients with GC
To study the association between Tim-3 expression
and patient clinicopathological features, patient age, sex, tumor
location, tumor diameter, Lauren type, perineuronal invasion,
blood-vessel invasion and TNM stage were analyzed. Follow-up
information was available for all 587 patients. The follow-up time
ranged between 1 and 117 months following surgery, with a median
follow-up time of 48 months.
Association between patient prognosis
and immune characteristics
For immune characteristic analysis,
immunohistochemical staining was performed on the TMA for immune
checkpoint Tim-3 and Gal-9, as well as T-cell markers, CD3 (tumor
infiltrating lymphocytes, TILs), CD8 (cytotoxic T lymphocytes,
CTLs) and FOXp3 (T regulatory cells, Tregs). Images of Tim-3 and
Gal-9 expression are shown in Fig. 1A
and B. The majority of the GC tissues exhibited cytoplasmic and
extracellular Gal-9 staining. However, few gastric cancer cells
exhibited Tim-3 staining, which is strongly expressed in
infiltrating immune cells. Considerable infiltration of the GC
parenchyma by CD3+ and CD8+ T cells was
evident in the patients with a favorable prognosis The number of
FOXp3+ T cells that infiltrated the tumor parenchyma was
less than that of the other types of T cells (Fig. 1C-E). FACS was performed in order to
detect Tim-3 expression in CD3+ T cells. The results
showed that 16.8% of CD3+ T cells exhibited notable
expression of Tim-3 protein. Therefore, it was demonstrated that
Tim-3 is notably expressed in the tumor-infiltrating lymphocytes of
patients with GC (Fig. 1F).
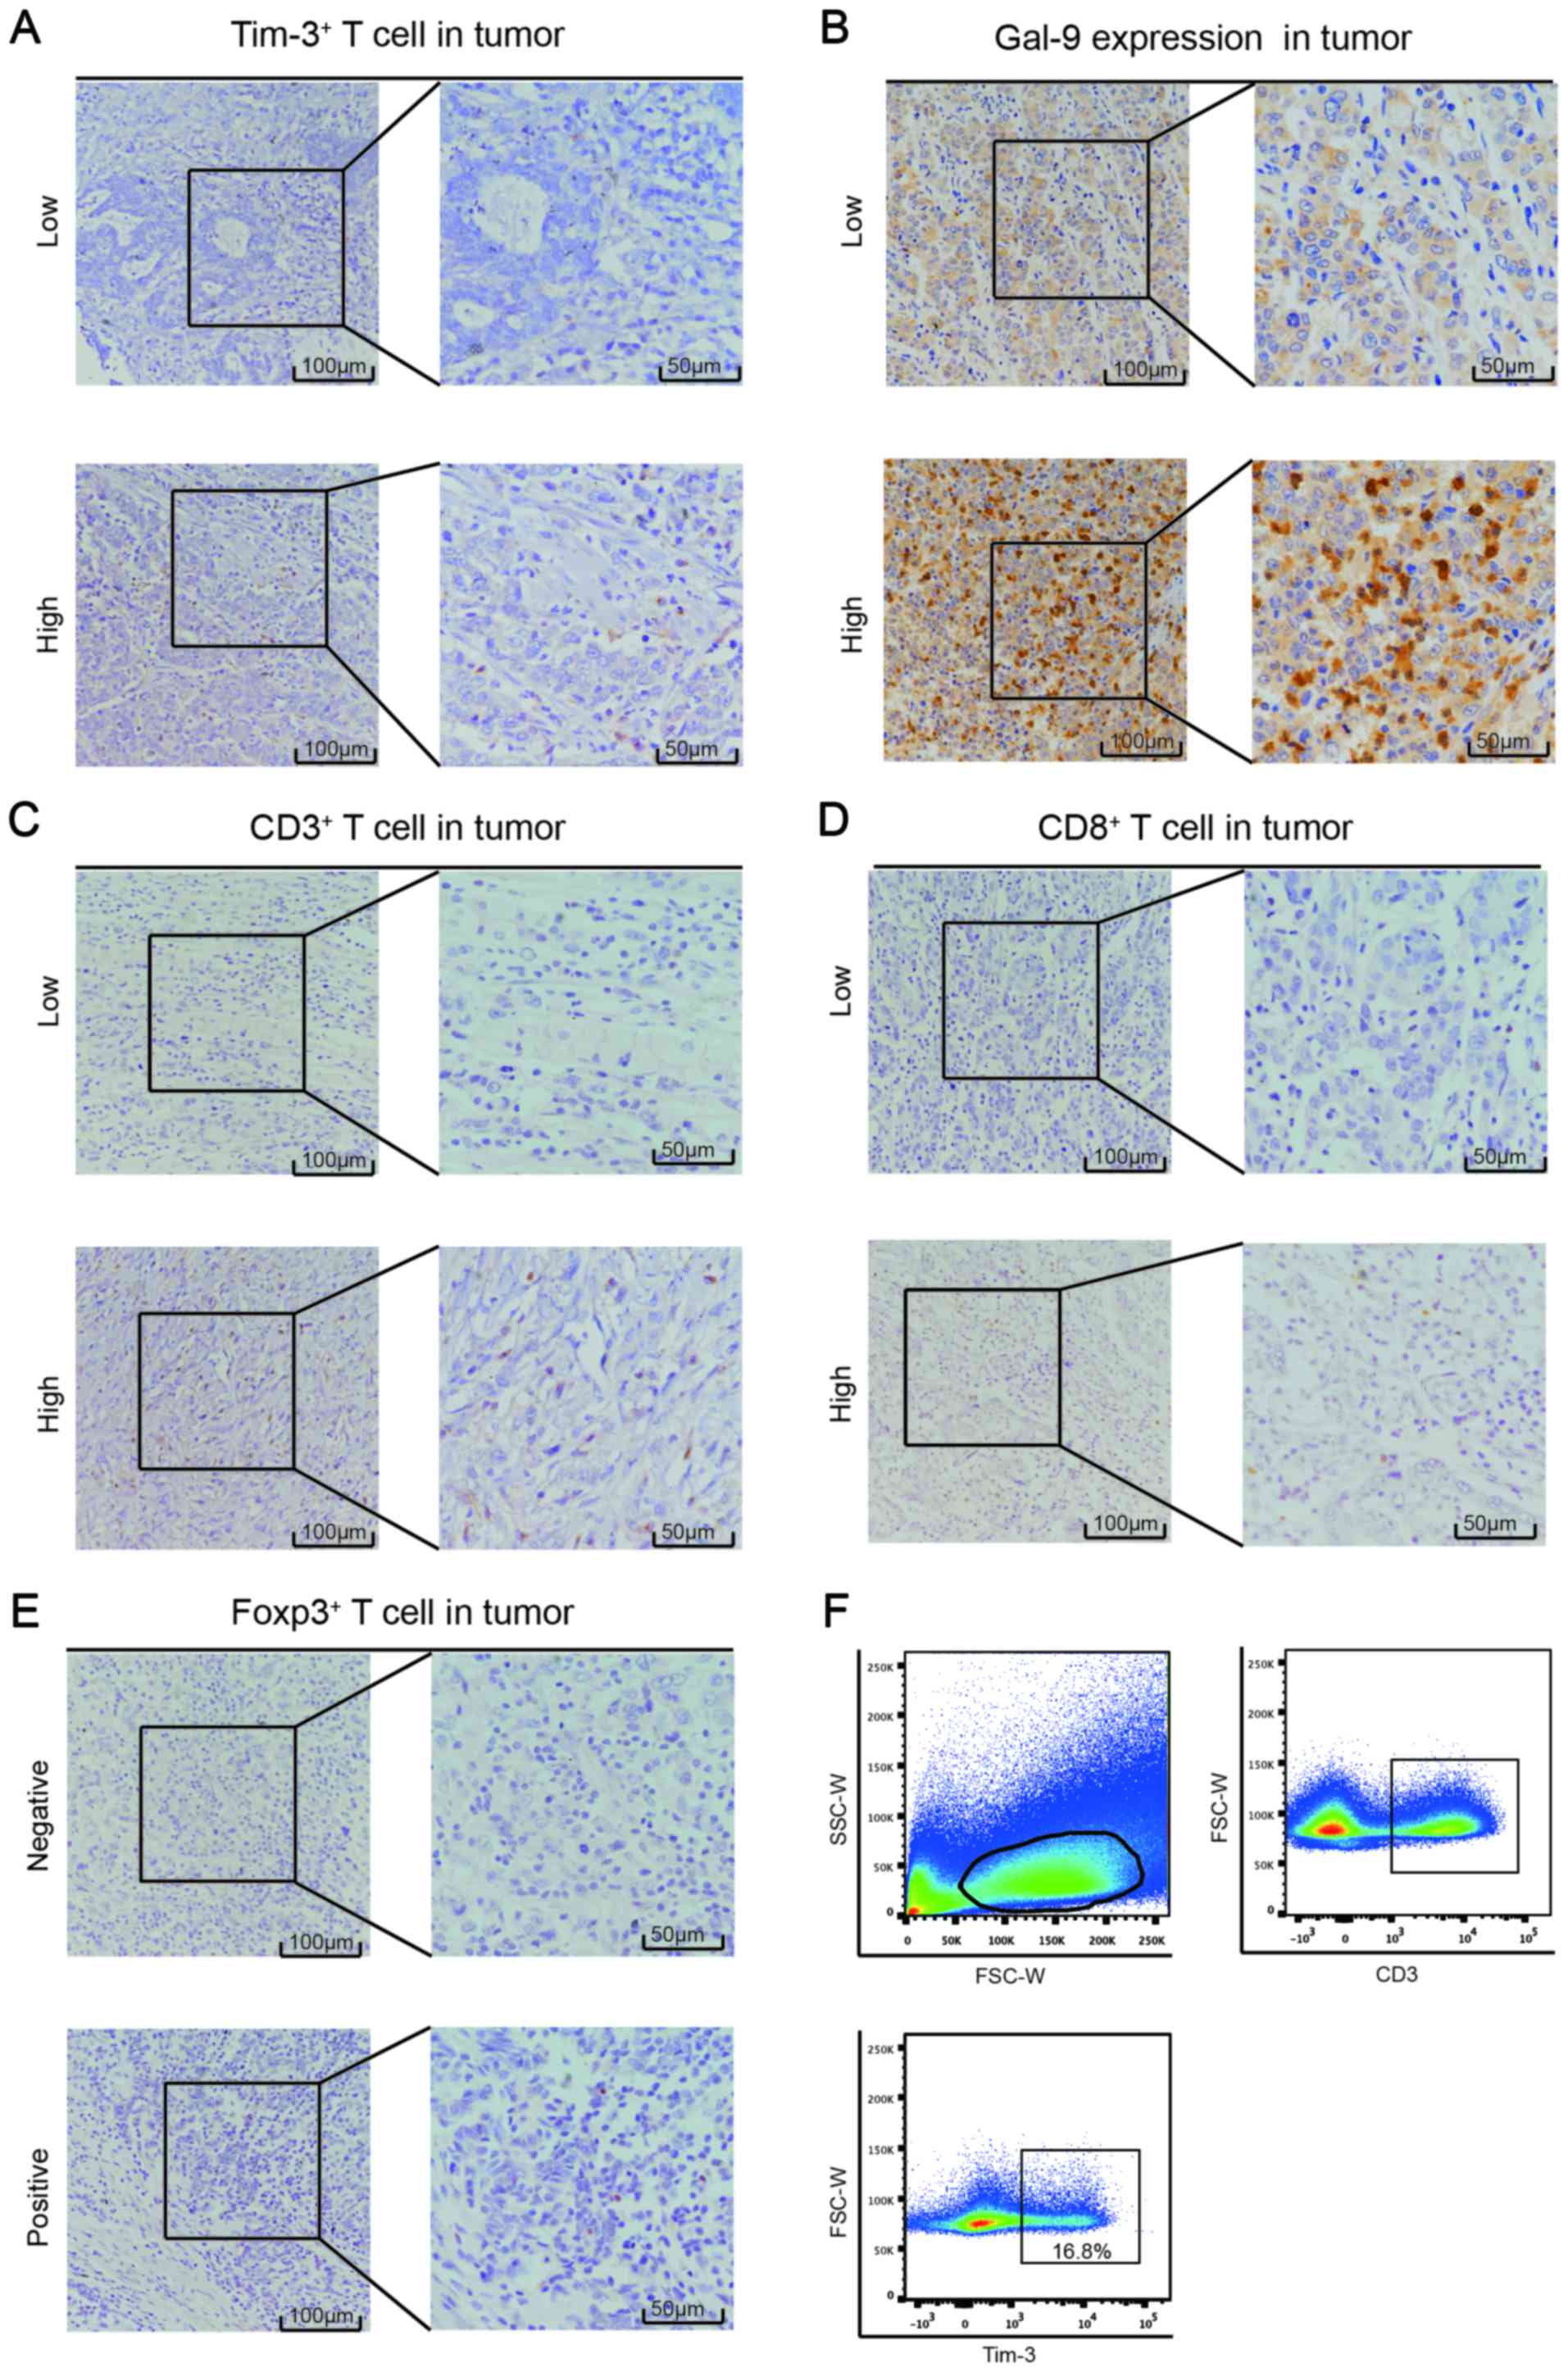 | Figure 1.Tim-3, Gal-9, CD3, CD8 and FOXp3
expression in GC tissues. (A) Immunohistochemical detection of
Tim-3 protein in patient TMAs. Tim-3 staining was observed in
infiltrating immune cells in the tumor parenchyma. Tumor cells are
minimally stained. (B) Immunohistochemical detection of Gal-9
protein using TMA. Gal-9 staining was observed in tumor cells.
Representative examples of (C) CD3+ high and low density, (D) CD8+
high and low density and (E) FOXp3+ positive and negative
immunohistochemical staining in GC parenchyma. Scale bar, 100 µm
(left panel) and 50 µm (right panel). (F) Tim-3 expression in CD3+
T cells as detected using fluorescence-activated cell sorting.
Tim-3, T-cell immunoglobulin and mucin domain-containing protein 3;
Gal-9, galectin 9; CD, cluster of differentiation; FOXp3, forkhead
box p3; GC, gastric cancer; TMAs, tissue microarrays. |
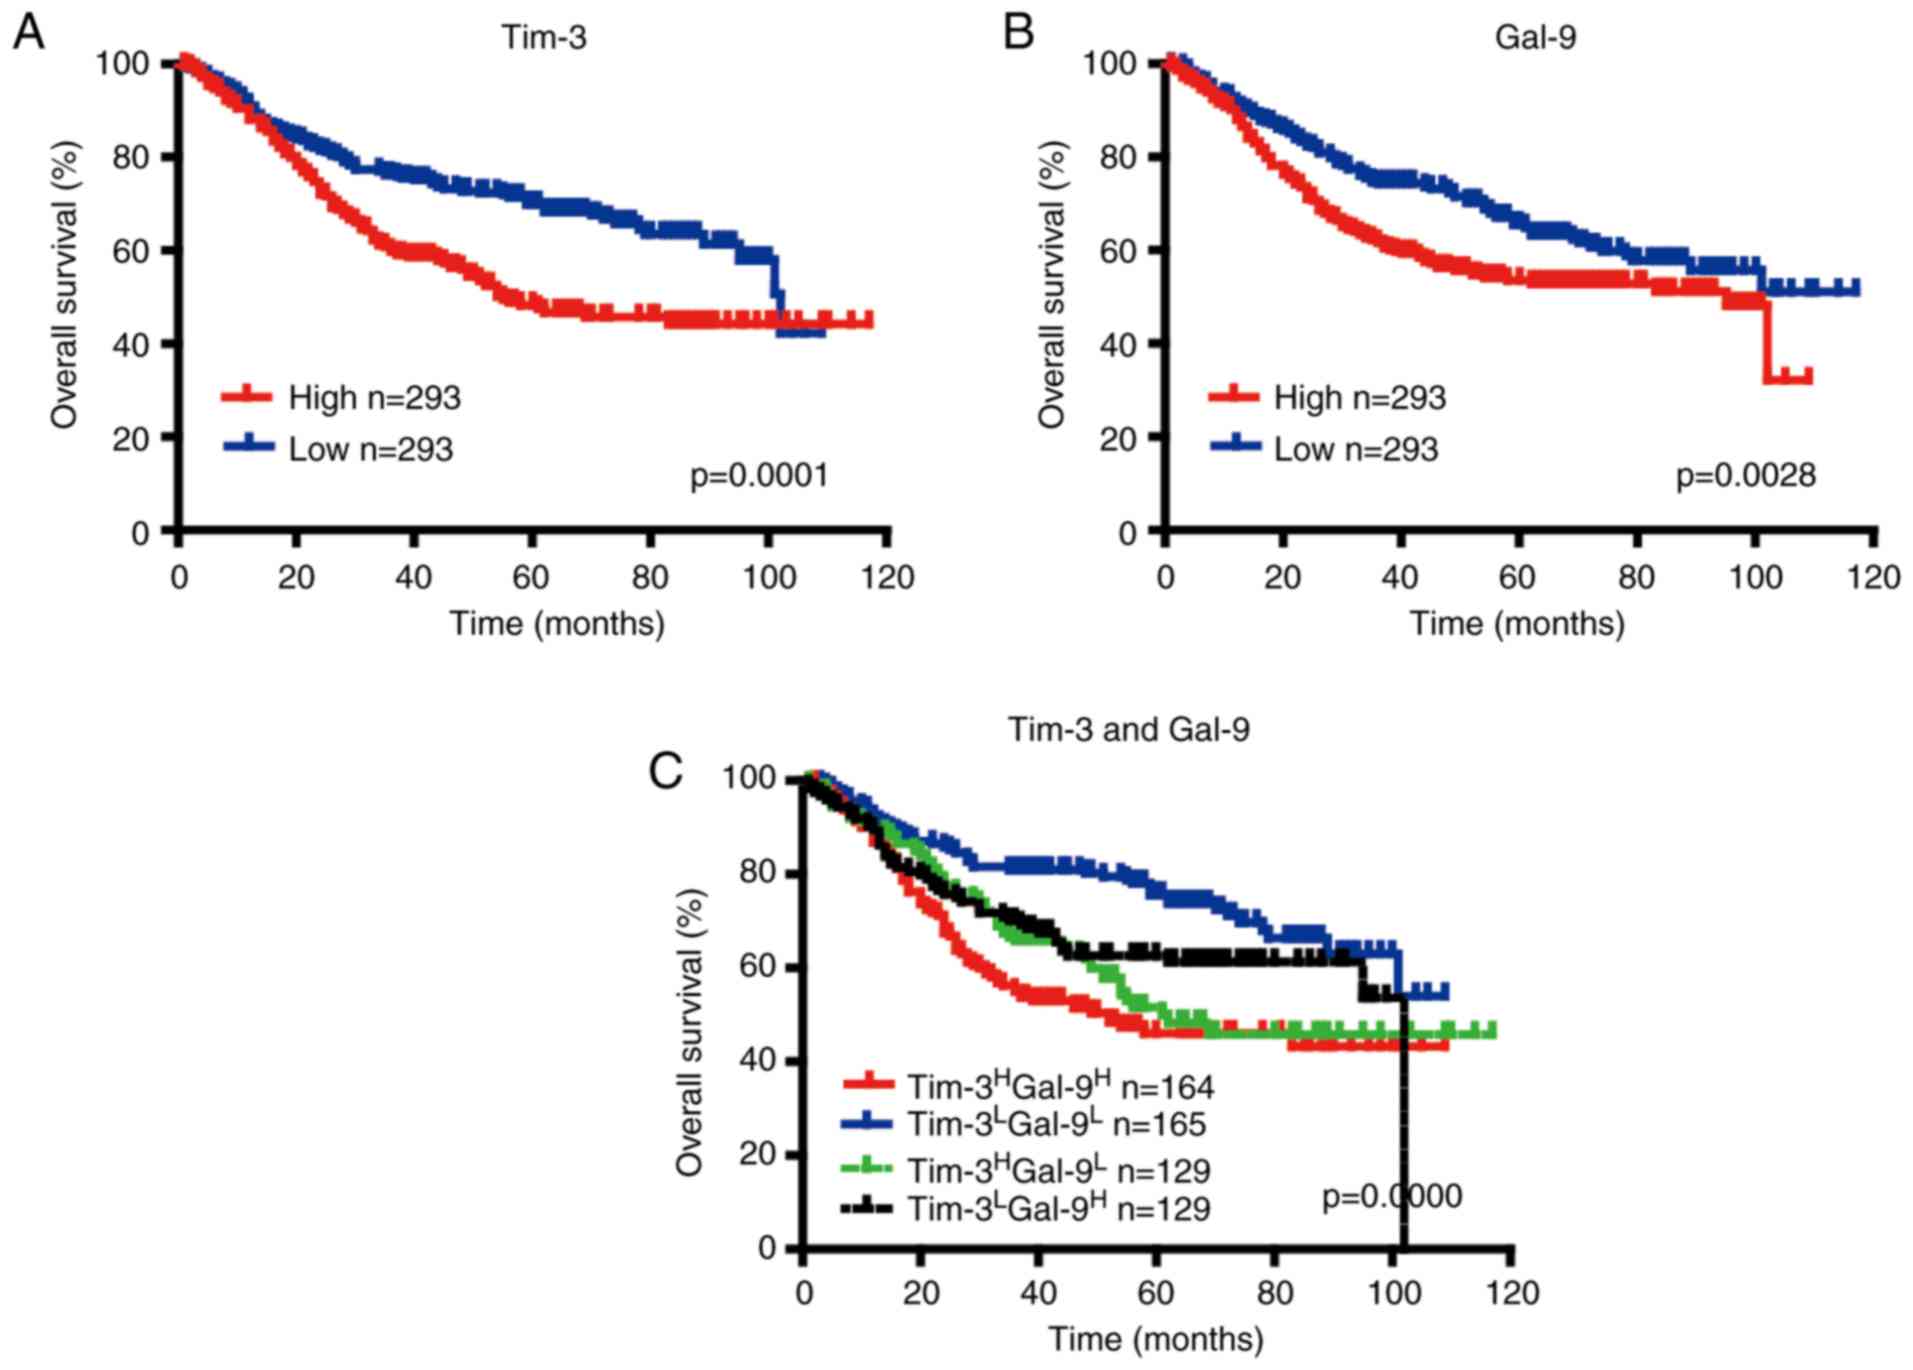
The present study analyzed the association between
Tim-3 expression in immune cells in patients with GC and patient
prognosis. It was revealed that the expression of Tim-3 in immune
cells was significantly associated with patient survival. Increased
Tim-3+ immune cell infiltration into the tumor was
associated with a lower OS rate (P=0.001; Fig. 2A). Gal-9 expression in GC was also
compared with patient prognosis. Patients exhibiting high Gal-9
expression had a relatively poor prognosis and a poorer OS rate
(P=0.0028; Fig. 2B). As Gal-9 is a
ligand of Tim-3, combined analysis involving the expression of the
two factors was performed. Patients with low Tim-3 and Gal-9
expression had a significantly greater OS rate than other patients
(P<0.001; Fig. 2C).
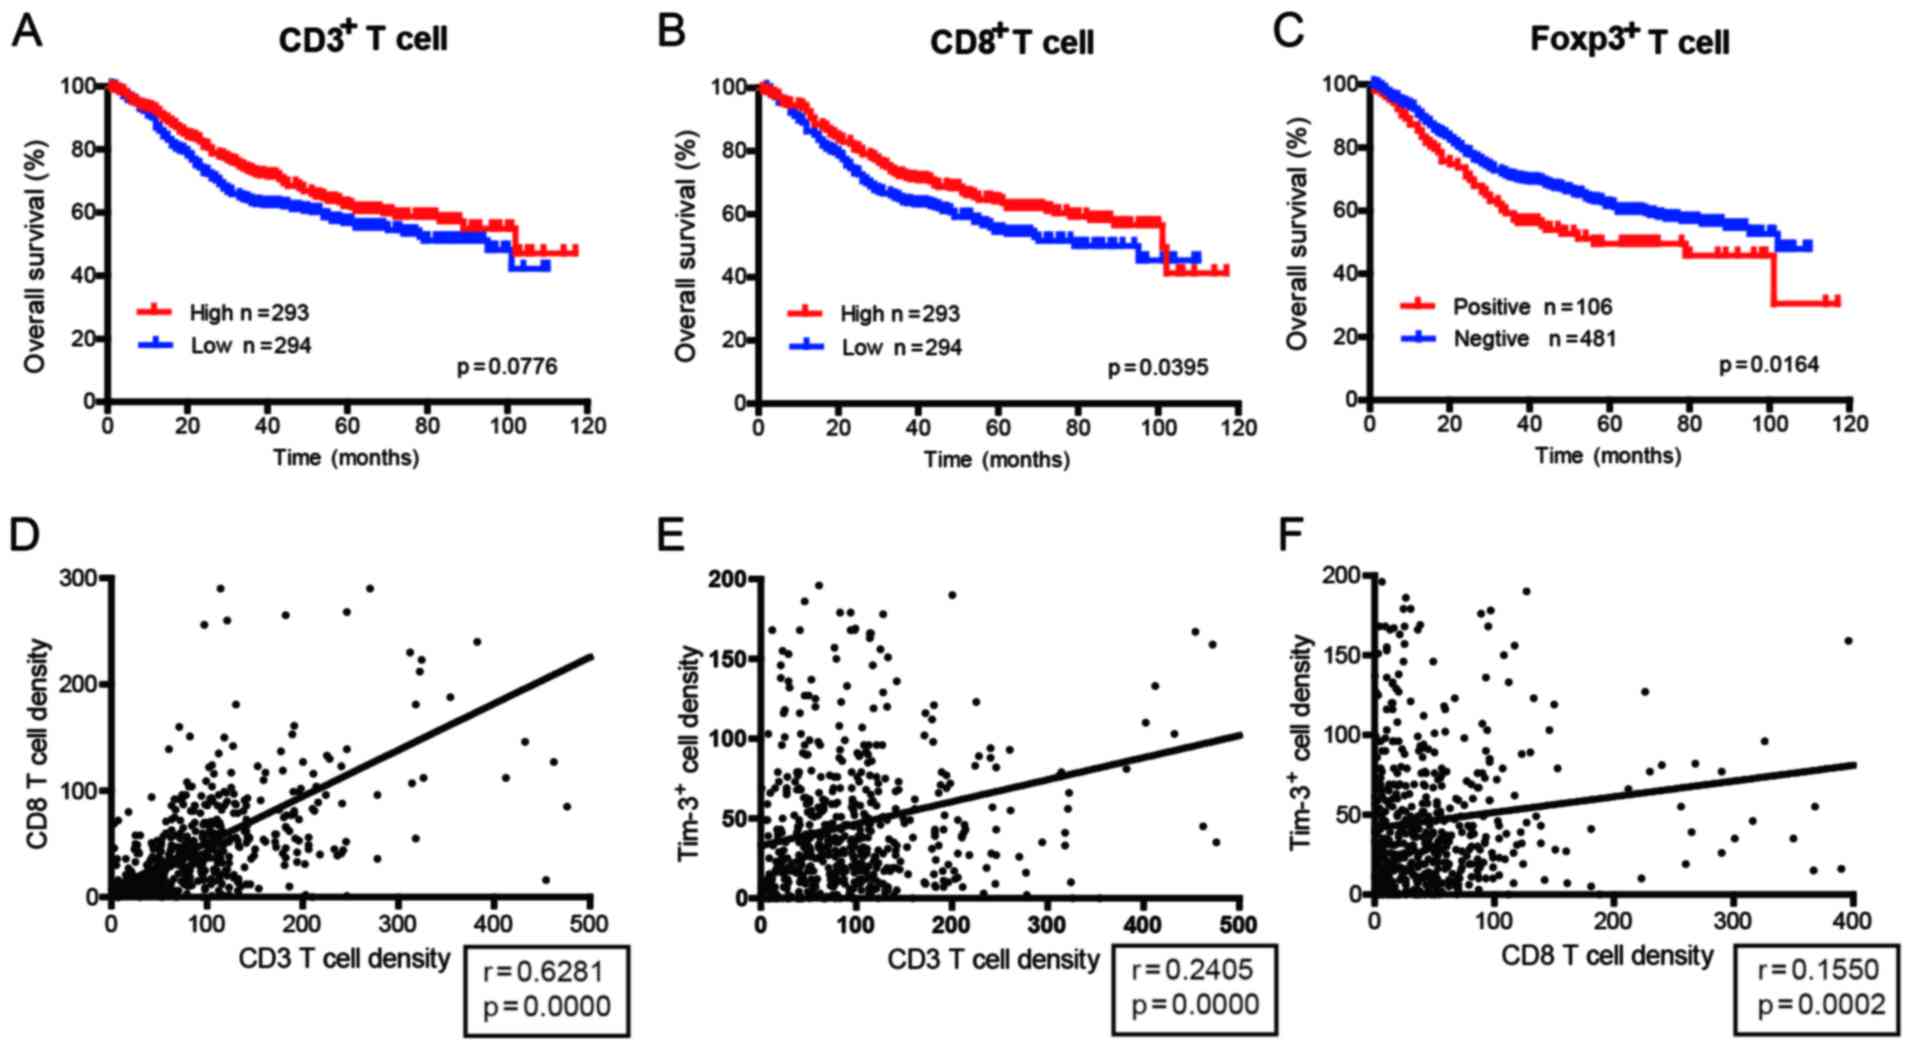
TIL, CTL and Treg infiltration into the tumor
parenchyma was analyzed by measuring the number of CD3+,
CD8+ and FOXp3+ T cells. CD3+
T-cell density in tumor tissues was not associated with OS rate
(P=0.0776; Fig. 3A), while
CD8+ T cell density in tumor tissue was positively
associated with OS rate (P=0.0395; Fig.
3B). However, a high density of FOXp3+ T cells in
tumor tissue was associated with a poorer OS rate (P=0.0164;
Fig. 3C).
Association between patient
clinicopathological parameters and immune characteristics
It was demonstrated that age and tumor diameter were
significantly different in the Tim-3 high and low expression
groups. Tumor location and blood vessel invasion were significantly
different in the Gal-9 high and low expression groups. The Tim-3 or
Gal-9 expression status was positively associated with N stage and
TNM stage (Tables I and II). However, in terms of the association
between TIL, CTL and Tregs density, and patient clinicopathological
parameters, only tumor diameter was significantly different between
the CTL high- and low-density groups (Tables III–V).
 | Table I.Association between tumor Tim-3
expression and clinicopathological parameters in patients with
gastric cancer. |
Table I.
Association between tumor Tim-3
expression and clinicopathological parameters in patients with
gastric cancer.
|
| Tim-3
expression |
|
|---|
|
|
|
|
|---|
| Clinicopathological
feature | Low (n=294) | High (n=293) | P-value |
|---|
| Age, years |
| ≤65
(n=371) | 198 | 173 | 0.0370a |
| >65
(n=216) | 96 | 120 |
|
| Sex |
| Male
(n=401) | 199 | 202 | 0.7439 |
| Female
(n=186) | 95 | 91 |
|
| Tumor location |
| Top
(n=118) | 63 | 55 | 0.7212 |
| Middle
(n=202) | 99 | 103 |
|
| Bottom
(n=267) | 132 | 135 |
|
| Diameter, cm |
| ≤5
(n=375) | 202 | 173 | 0.0148a |
| >5
(n=212) | 92 | 120 |
|
| Pathological Lauren
type |
|
Intestinal (n=194) | 106 | 88 | 0.1715 |
| Diffuse
(n=326) | 152 | 174 |
|
| Mixed
(n=67) | 36 | 31 |
|
| Perineuronal
invasion |
|
Negative (n=518) | 263 | 255 | 0.3617 |
|
Positive (n=69) | 31 | 38 |
|
| Blood vessel
invasion |
|
Negative (n=493) | 253 | 240 | 0.1711 |
|
Positive (n=94) | 41 | 53 |
|
| pT stage |
| T1
(n=94) | 56 | 38 | 0.0795 |
| T2
(n=80) | 44 | 36 |
|
| T3
(n=151) | 66 | 85 |
|
| T4
(n=262) | 128 | 134 |
|
| pN stage |
| N0
(n=234) | 133 | 101 | 0.0478a |
| N1
(n=105) | 50 | 55 |
|
| N2
(n=114) | 54 | 60 |
|
| N3
(n=134) | 57 | 77 |
|
| TNM stage |
| I
(n=137) | 81 | 56 | 0.0221a |
| II
(n=165) | 85 | 80 |
|
| III
(n=279) | 127 | 152 |
|
| IV
(n=6) | 1 | 5 |
|
| Table II.Association between tumor Gal-9
expression and clinicopathological parameters in patients with
gastric cancer. |
Table II.
Association between tumor Gal-9
expression and clinicopathological parameters in patients with
gastric cancer.
|
| Gal-9
expression |
|
|---|
|
|
|
|
|---|
| Clinicopathological
feature | Low (n=294) | High (n=293) | P-value |
|---|
| Age, years |
| ≤65
(n=371) | 194 | 177 | 0.1613 |
| >65
(n=216) | 100 | 116 |
|
| Sex |
| Male
(n=401) | 202 | 199 | 0.8327 |
| Female
(n=186) | 92 | 94 |
|
| Tumor location |
| Top
(n=118) | 72 | 46 | 0.0291a |
| Middle
(n=202) | 95 | 107 |
|
| Bottom
(n=267) | 127 | 140 |
|
| Diameter, cm |
| ≤5
(n=375) | 199 | 176 | 0.0547 |
| >5
(n=212) | 95 | 117 |
|
| Pathological Lauren
type |
|
Intestinal (n=194) | 106 | 88 | 0.0841 |
| Diffuse
(n=326) | 150 | 176 |
|
| Mixed
(n=67) | 38 | 29 |
|
| Perineuronal
invasion |
|
Negative (n=518) | 263 | 255 | 0.3617 |
|
Positive (n=69) | 31 | 38 |
|
| Blood vessel
invasion |
|
Negative (n=493) | 256 | 237 | 0.0410a |
|
Positive (n=94) | 38 | 56 |
|
| pT stage |
| T1
(n=94) | 49 | 45 | 0.3397 |
| T2
(n=80) | 41 | 39 |
|
| T3
(n=151) | 66 | 85 |
|
| T4
(n=262) | 138 | 124 |
|
| pN stage |
| N0
(n=234) | 134 | 100 | 0.0060b |
| N1
(n=105) | 55 | 50 |
|
| N2
(n=114) | 53 | 61 |
|
| N3
(n=134) | 52 | 82 |
|
| TNM stage |
| I
(n=137) | 75 | 62 | 0.0292a |
| II
(n=165) | 94 | 71 |
|
| III
(n=279) | 123 | 156 |
|
| IV
(n=6) | 2 | 4 |
|
| Table III.Association between tumor CD3
expression and clinicopathological parameters in patients with
gastric cancer. |
Table III.
Association between tumor CD3
expression and clinicopathological parameters in patients with
gastric cancer.
|
| CD3 expression |
|
|---|
|
|
|
|
|---|
| Clinicopathological
feature | Low (n=294) | High (n=293) | P-value |
|---|
| Age, years |
| ≤65
(n=371) | 183 | 188 | 0.6298 |
| >65
(n=216) | 111 | 105 |
|
| Sex |
| Male
(n=401) | 203 | 198 | 0.7017 |
| Female
(n=186) | 91 | 95 |
|
| Tumor location |
| Top
(n=118) | 61 | 57 | 0.8201 |
| Middle
(n=202) | 103 | 99 |
|
| Bottom
(n=267) | 130 | 137 |
|
| Diameter, cm |
| ≤5
(n=375) | 181 | 194 | 0.2412 |
| >5
(n=212) | 113 | 99 |
|
| Pathological Lauren
type |
|
Intestinal (n=194) | 106 | 88 | 0.3006 |
| Diffuse
(n=326) | 156 | 170 |
|
| Mixed
(n=67) | 32 | 35 |
|
| Perineuronal
invasion |
|
Negative (n=518) | 256 | 262 | 0.3778 |
|
Positive (n=69) | 38 | 31 |
|
| Blood-vessel
invasion |
|
Negative (n=493) | 245 | 248 | 0.6656 |
|
Positive (n=94) | 49 | 45 |
|
| pT stage |
| T1
(n=94) | 41 | 53 | 0.1804 |
| T2
(n=80) | 37 | 43 |
|
| T3
(n=151) | 72 | 79 |
|
| T4
(n=262) | 144 | 118 |
|
| pN stage |
| N0
(n=234) | 116 | 118 | 0.3688 |
| N1
(n=105) | 48 | 57 |
|
| N2
(n=114) | 65 | 49 |
|
| N3
(n=134) | 65 | 69 |
|
| TNM stage |
| I
(n=137) | 63 | 74 | 0.6838 |
| II
(n=165) | 82 | 83 |
|
| III
(n=279) | 146 | 133 |
|
| IV
(n=6) | 3 | 3 |
|
| Table V.Association between tumor FOXp3
expression and clinicopathological parameters in patients with
gastric cancer. |
Table V.
Association between tumor FOXp3
expression and clinicopathological parameters in patients with
gastric cancer.
|
| FOXp3
expression |
|
|---|
|
|
|
|
|---|
| Clinicopathological
feature | Negative
(n=481) | Positive
(n=106) | P-value |
|---|
| Age, years |
| ≤65
(n=371) | 309 | 62 | 0.2664 |
| >65
(n=216) | 172 | 44 |
|
| Sex |
| Male
(n=401) | 332 | 69 | 0.4313 |
| Female
(n=186) | 149 | 37 |
|
| Tumor location |
| Top
(n=118) | 95 | 23 | 0.7776 |
| Middle
(n=202) | 164 | 38 |
|
| Bottom
(n=267) | 222 | 45 |
|
| Diameter, cm |
| ≤5
(n=375) | 304 | 71 | 0.4634 |
| >5
(n=212) | 177 | 35 |
|
| Pathological Lauren
type |
|
Intestinal (n=194) | 165 | 29 | 0.0785 |
| Diffuse
(n=326) | 257 | 69 |
|
| Mixed
(n=67) | 59 | 8 |
|
| Perineuronal
invasion |
|
Negative (n=518) | 427 | 91 | 0.3974 |
|
Positive (n=69) | 54 | 15 |
|
| Blood-vessel
invasion |
|
Negative (n=493) | 408 | 85 | 0.2389 |
|
Positive (n=94) | 73 | 21 |
|
| pT stage |
| T1
(n=94) | 84 | 10 | 0.1746 |
| T2
(n=80) | 67 | 13 |
|
| T3
(n=151) | 122 | 29 |
|
| T4
(n=262) | 208 | 54 |
|
| pN stage |
| N0
(n=234) | 197 | 37 | 0.7098 |
| N1
(n=105) | 85 | 20 |
|
| N2
(n=114) | 92 | 22 |
|
| N3
(n=134) | 107 | 27 |
|
| TNM stage |
| I
(n=137) | 120 | 17 | 0.1364 |
| II
(n=165) | 133 | 32 |
|
| III
(n=279) | 222 | 57 |
|
| IV
(n=6) | 6 | 0 |
|
Association between biomarker
expression levels
CD3+ T cell density in tumor tissue was
correlated with CD8+ T cell density (r=0.6281,
P<0.0001, Fig. 3D). However,
there was no correlation between Tim-3+ immune cell
density and CD3+ or CD8+ T cell density
(r=0.2405, P<0.0001 and r=0.1550, P=0.0002, respectively;
Fig. 3E and F).
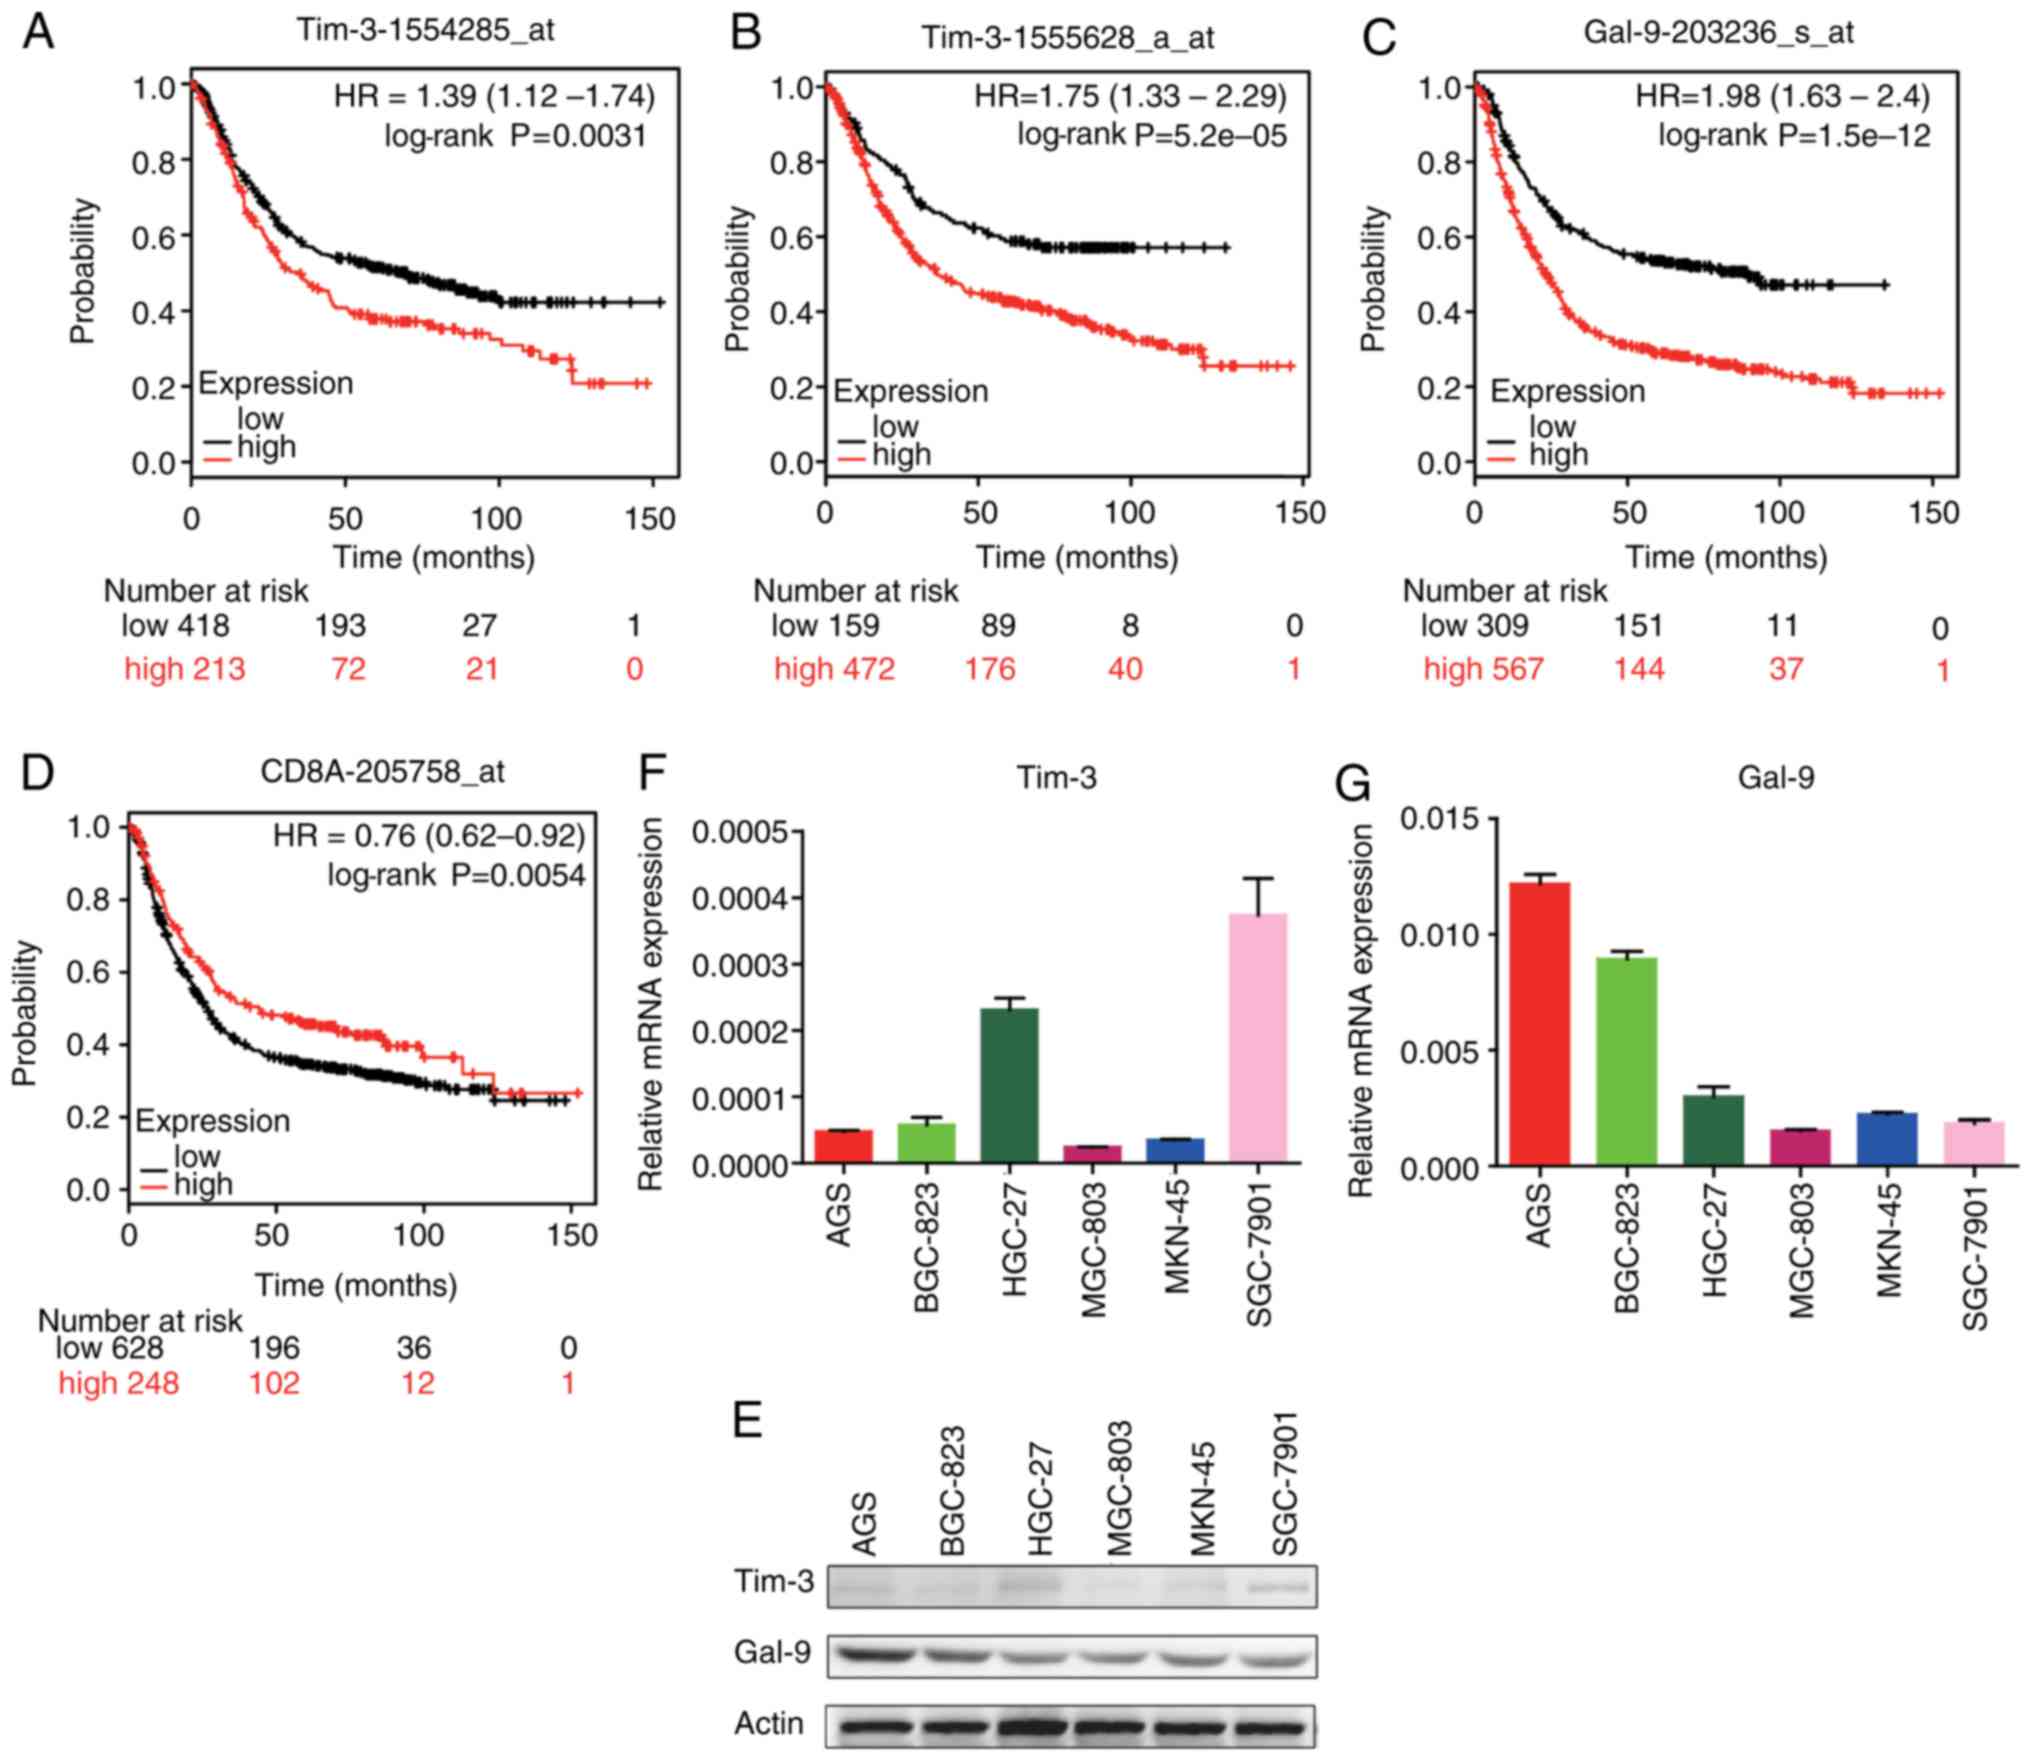
K-M plotter analysis
Tim-3, Gal-9 and CD8A mRNA expression was compared
with patient survival using the following GEO databases on the K-M
plotter website: gse14210, gse15459, gse22377, gse29272, gse51105
and gse62254. High Tim-3 expression in patients with GC was
associated with relatively short survival times (Fig. 4A and B). High Gal-9 expression in
patients with GC was also associated with relatively short survival
times (Fig. 4C). High CD8A
expression was associated with relatively long survival times
(Fig. 4D).
Expression of Tim-3 and Gal-9 in GC
cell lines
To detect Tim-3 and Gal-9 expression in tumor cell
lines, western blotting and RT-qPCR were performed using AGS,
BGC-823, HGC-27, MGC-803, MKN-45 and SGC-7901 cells. GC cells
exhibited low expression levels of Tim-3 but relatively high Gal-9
expression (Fig. 4E-G).
CD8+ T cell density and
Tim-3+ immune cell infiltration are independent
prognostic factors in GC
Table VI shows the
univariate and multivariate analysis of clinicopathological
factors. The univariate analysis revealed that the following
factors were significantly associated with patient postoperative
survival: CD8+ T cell density (P=0.025),
FOXp3+ T cell density (P=0.017), Tim-3+
immune cell density (P<0.0001), Gal-9 expression (P=0.002), age
(P=0.009), tumor diameter (P<0.0001), Lauren type (P=0.001),
perineuronal invasion (P<0.0001), blood vessel invasion
(P<0.0001) and TNM stage (P<0.0001). Multivariate regression
analysis indicated that CD8+ T cell density (P=0.031),
Tim-3+ immune cell density (P=0.012), tumor diameter
(P=0.001), blood vessel invasion (P=0.003) and TNM stage
(P<0.001) were independent prognostic factors in GC.
| Table VI.Univariate and multivariate analysis
of prognostic parameters for the overall survival of patients with
gastric cancer. |
Table VI.
Univariate and multivariate analysis
of prognostic parameters for the overall survival of patients with
gastric cancer.
|
| Univariate
analysis | Multivariate
analysis |
|---|
|
|
|
|
|---|
| Prognostic
parameter | HR | 95% CI | P-value | HR | 95% CI | P-value |
|---|
| Age | 1.397 | 1.087–1.797 | 0.009b | 1.084 | 0.826–1.424 | 0.559 |
| Sex | 1.154 | 0.889–1.499 | 0.281 |
|
|
|
| Tumor location |
|
Top | 1 | Reference |
|
|
|
|
|
Middle | 0.824 | 0.594–1.144 | 0.248 |
|
|
|
|
Bottom | 0.858 | 0.608–1.211 | 0.383 |
|
|
|
| Diameter | 0.358 | 0.279–0.459 |
<0.001b | 0.623 | 0.474–0.818 | 0.001b |
| Lauren type
(intestinal/mixed vs. diffuse) | 1.613 | 1.218–2.137 | 0.001b | 1.120 | 0.837–1.499 | 0.445 |
| Perineuronal
invasion | 0.441 | 0.318–0.612 |
<0.001b | 0.785 | 0.557–1.105 | 0.165 |
| Blood vessel
invasion | 0.370 | 0.277–0.493 |
<0.001b | 0.620 | 0.455–0.846 | 0.003b |
| TNM stage | 0.213 | 0.160–0.283 |
<0.001b | 0.295 | 0.217–0.402 |
<0.001b |
| CD3 | 0.781 | 0.609–1.001 | 0.051 |
|
|
|
| CD8 | 0.753 | 0.587–0.966 | 0.025a | 0.755 | 0.585–0.975 | 0.031a |
| FOXp3 | 1.439 | 1.067–1.941 | 0.017a | 1.176 | 0.887–1.559 | 0.260 |
| Tim-3 | 1.710 | 1.327–2.203 |
<0.001b | 1.395 | 1.078–1.807 | 0.012a |
| Gal-9 | 1.489 | 1.160–1.912 | 0.002b | 1.205 | 0.933–1.556 | 0.153 |
Discussion
At present, the treatment options available for GC
are limited, particularly for patients with advanced stages of
disease (23). In China, early
diagnosis remains problematic and therefore the majority of
patients have advanced GC at the time of diagnosis (23). This is likely because
gastroendoscopy is not performed as regularly in China as in other
developed countries (23). The
current conventional treatments used for GC include surgery and
perioperative chemotherapy (2).
Immunotherapies, particularly immune checkpoint inhibitors, have
great potential as effective treatments for GC in the future and
have been used successfully to treat other solid tumors.
Tim-3 is selectively expressed in IFN-γ-producing
CD4+ Th1 and CD8+ Tc1 cells (4). Previous studies have demonstrated that
Tim-3 is required to induce immune tolerance, as Tim-3-deficient
mice and mice treated with a Tim-3 Ig protein had defects in the
induction of antigen-specific tolerance (24,25).
Tim-3, as an immune checkpoint receptor, limits the duration and
magnitude of the Th1 and Tc1 T-cell response. In the present study,
Tim-3-positive immune cells were demonstrated to infiltrate GC
tissue. GC cells rarely express Tim-3 protein but Tim-3 expression
in tumor cells has been previously reported (26); however, the majority of previous
studies have indicated that Tim-3+ cells are immune
cells, including T cells, macrophages and dendritic cells (27–29).
In the present study, a significant association between
Tim-3+-cell tumor infiltration, and tumor diameter and
TNM stage was observed. Furthermore, the survival of patients
exhibiting high Tim-3+-cell tumor infiltration was
significantly lower than that in those exhibiting low infiltration.
Univariate and multivariate analyses also revealed that
Tim-3+ infiltrating immune cells in tumors were
associated with a poor prognosis. The mechanism behind this
association is not yet fully understood. However, it is possible
that the Tim-3/Gal-9 pathway downregulates T-cell responses by
mediating apoptosis. A recent study revealed a negative regulatory
effect by Tim-3 expression on CD4+ and CD8+ T
cell viability (30). Furthermore,
the Tim-3/Gal-9 pathway contributes toward the suppressive tumor
microenvironment via Treg activation upon TCR activation (31). Expression of the Tim-3 surface
protein by CD8+ T cells provides immune tolerance upon
encounter of cancer cells highly expressing Gal-9.
Gal-9, a galectin protein, regulates the survival,
proliferation and cytokine synthesis of effector helper and
cytotoxic T cells (32). Gal-9 has
recently become a major molecule of interest due to the
identification of its negative influence on the adaptive immune
response. In the present study, Gal-9 was demonstrated to be highly
expressed in GC and subcellularly localized to the extracellular
area and cytoplasm of tumor cells. A significant association
between Gal-9 expression, blood vessel invasion and TNM stage in GC
was observed. Additionally, high expression of Gal-9 was associated
with poor patient survival. Gal-9 and other galectins have been
indicated to be prognostic markers in other types of cancer
(33–35). Tim-3/Gal-9 binding interactions
inhibit Th17 polarization, driving the proliferation of
FOXp3+ Tregs (26).
Tim-3/Gal-9 binding can also induce apoptosis or necrosis in
pro-inflammatory T cell subsets (37). While Gal-9 and other galectins
induce pro-apoptotic features in pro-inflammatory T cell subsets,
they function through Bcl-2 blocking Gal-9-induced apoptosis
(34). In vitro studies
using lung cancer-specific T-cell lines revealed that apoptosis is
induced in Tim-3+ CD8+ T-cell clones
following interaction with Gal-9, which can be inhibited by the
addition of anti-Gal-9 or anti-Tim-3 antibodies. The release of
soluble Gal-9 can therefore negatively regulate T-cell function or
induce apoptosis via Tim-3 (35).
Another study demonstrated that Gal-9 induces Tim-3+
Th1, Th17 and Tc1 T cell apoptosis in hyperimmune conditions
(36). However, the function of
Gal-9 in breast cancer, cervical carcinoma and malignant melanoma
has also been reported, which is in contrast to the results of the
present study (38–40). This may be due to individual
variation in the immune state, including differing Tim-3 protein
expression and cytokine levels. Univariate analysis demonstrated
that Gal-9 overexpression in tumor cells is associated with a poor
prognosis in GC. However, multivariate analysis did not reveal any
statistical significance, suggesting that Gal-9 functions as a
tumorigenesis promoter depending on the immune state of the
patient. High expression of Tim-3 and Gal-9 was associated with a
poor survival in patients with GC.
Regarding CD3+ and CD8+ T cell
infiltration in tumors and survival in patients with GC, previous
studies have reported an association between high CD3+
and CD8+ T cell density and a favorable prognosis
(41,42). The same results were observed in the
present study; the density of CD8+ T cells in GC tumors
was associated with tumor size. Univariate and multivariate
analyses also revealed that high CD8+ T cell
infiltration was associated with a good prognosis. CTLs are also
associated with a good prognosis. In adaptive immunity, CTLs
directly kill tumor cells in the tumor microenvironment. Adaptive
immunity, which is mediated by T cells, has been suggested to serve
a major role in antitumor immunity (42).
Forkhead box protein 3 (FOXp3), a member of the
forkhead transcription factor family, is considered to be a
distinctive molecular marker of regulatory T cells (43). It has been suggested that Tregs can
suppress the majority of immune cells, including CD4+
and CD8+ T cells, B cells, natural killer cells and NK T
cells. Tregs also inhibit the proliferation of effector T cells,
reduce cytokine secretion, promote B-cell anergy, impede antibody
production, inhibit the expression of co-stimulatory and
antigen-presenting molecules, and reduce the ability to stimulate T
cell responses (44). A high
frequency of Tregs is generally considered to be a marker of poor
prognosis in various types of cancer. Tregs may mediate the
suppression of antitumor immunity, which promotes tumor growth. The
present study revealed a high level of Tregs infiltrating the tumor
tissue, which was associated with a poor survival in patients with
GC. A previous study demonstrated that enhanced FOXp3+ T
cells expression was associated with a low OS rate and a poor
prognosis (45). A high density of
Tregs in tumors and peripheral blood is therefore generally
considered to be a marker of a poor prognosis in cancer.
The present study has a number of limitations. The
IHC of the TMA may not completely represent the immune marker
expression. Previous studies have used large areas of tissue for
immunostaining (46). Tim-3 is
mainly expressed in T cells but is also expressed in other immune
cells. Future studies should aim to define the detailed function of
Tim-3 and the immune cells in which it is expressed in GC.
While two previous studies have investigated the
association between Tim-3 expression on T cells and NK cells, and
patient clinicopathological features (47,48).
However, the present study compared its ligand Gal-9 expression and
T-cell infiltration in tumor tissues with patient
clinicopathological features and survival. The large patient sample
size made the conclusions of the present study more robust. The
association between Tim-3 expression and Gal-9 expression was also
discussed in the present study. Tim-3 is primarily expressed by
infiltrating T cells, while Gal-9 is expressed by GC cells. A large
number of TILs and CTLs were revealed to infiltrate GC, and CTL
infiltration was associated with OS. Univariate and multivariate
analyses revealed that Tim-3 expression and CD8+ T cell
density in tumors are associated with GC prognosis and can act as
independent prognostic factors. However, the mechanism by which
Tim-3 functions in GC and its interaction with Gal-9 remain unclear
and require investigation in the future. Finally, the Tim-3/Gal-9
pathway may be a valuable immunotherapy target for the treatment of
GC and other types of solid tumor.
Acknowledgements
The authors would like to thank members of the
Department of Pathology, Ren Ji Hospital, School of Medicine,
Shanghai Jiao Tong University (Shanghai, China) for providing
assistance.
Funding
The present study was supported by the National
Natural Science Foundation of China (grant no. 81272743).
Availability of data and materials
The datasets generated and analyzed during the study
are available in Gene Expression Omnibus (https://www.ncbi.nlm.nih.gov/pubmed) and Kaplan
Meier-Plotter website (http://kmplot.com/analysis/index.php?p=service&cancer=gastric).
Other datasets used in the study are available from the
corresponding author upon reasonable request.
Authors' contributions
HC and GZ conceived and designed the study. YW, EZ
and ZZ performed the experiments. YW wrote the study. HC, GZ, EZ
and ZZ reviewed and edited the manuscript. All authors read and
approved the manuscript and agree to be accountable for all aspects
of the research in ensuring that the accuracy or integrity of any
part of the work are appropriately investigated and resolved.
Ethics approval and consent to
participate
The present study was approved by the Ethics
Committee of Ren Ji Hospital, Shanghai Jiao Tong University School
of Medicine (Shanghai, China). Written informed consent was
obtained from all enrolled patients prior to their inclusion in the
present study.
Patient consent for publication
Not applicable.
Competing interests
The authors declare that they have no competing
interests.
References
|
1
|
Ferlay J, Soerjomataram I, Dikshit R, Eser
S, Mathers C, Rebelo M, Parkin DM, Forman D and Bray F: Cancer
incidence and mortality worldwide: Sources, methods and major
patterns in GLOBOCAN 2012. Int J Cancer. 136:E359–386. 2015.
View Article : Google Scholar : PubMed/NCBI
|
|
2
|
Japanese Gastric Cancer Association:
Japanese gastric cancer treatment guidelines 2014 (ver. 4). Gastric
cancer. 20:1–19. 2017. View Article : Google Scholar
|
|
3
|
Anderson AC: Tim-3: An emerging target in
the cancer immunotherapy landscape. Cancer Immunol Res. 2:393–398.
2014. View Article : Google Scholar : PubMed/NCBI
|
|
4
|
Monney L, Sabatos CA, Gaglia JL, Ryu A,
Waldner H, Chernova T, Manning S, Greenfield EA, Coyle AJ, Sobel
RA, et al: Th1-specific cell surface protein Tim-3 regulates
macrophage activation and severity of an autoimmune disease.
Nature. 415:536–541. 2002. View
Article : Google Scholar : PubMed/NCBI
|
|
5
|
Shin DS and Ribas A: The evolution of
checkpoint blockade as a cancer therapy: What's here, what's next?
Curr Opin Immunol. 33:23–35. 2015. View Article : Google Scholar : PubMed/NCBI
|
|
6
|
Geng H, Zhang GM, Li D, Zhang H, Yuan Y,
Zhu HG, Xiao H, Han LF and Feng ZH: Soluble form of T cell Ig mucin
3 is an inhibitory molecule in T cell-mediated immune response. J
Immunol. 176:1411–1420. 2006. View Article : Google Scholar : PubMed/NCBI
|
|
7
|
Yang J, Zhu L, Cai Y, Suo J and Jin J:
Role of downregulation of galectin-9 in the tumorigenesis of
gastric cancer. Int J Oncol. 45:1313–1320. 2014. View Article : Google Scholar : PubMed/NCBI
|
|
8
|
Takano J, Morishita A, Fujihara S, Iwama
H, Kokado F, Fujikawa K, Fujita K, Chiyo T, Tadokoro T, Sakamoto T,
et al: Galectin-9 suppresses the proliferation of gastric cancer
cells in vitro. Oncol Rep. 35:851–860. 2016. View Article : Google Scholar : PubMed/NCBI
|
|
9
|
Fontenot JD, Rasmussen JP, Williams LM,
Dooley JL, Farr AG and Rudensky AY: Regulatory T cell lineage
specification by the forkhead transcription factor foxp3. Immunity.
22:329–341. 2005. View Article : Google Scholar : PubMed/NCBI
|
|
10
|
Sakaguchi S, Yamaguchi T, Nomura T and Ono
M: Regulatory T cells and immune tolerance. Cell. 133:775–787.
2008. View Article : Google Scholar : PubMed/NCBI
|
|
11
|
Sun X, Feng Z, Wang Y, Qu Y and Gai Y:
Expression of Foxp3 and its prognostic significance in colorectal
cancer. Int J Immunopathol Pharmacol. 30:201–206. 2017. View Article : Google Scholar : PubMed/NCBI
|
|
12
|
Washington K: 7th edition of the AJCC
cancer staging manual: Stomach. Ann Surg Oncol. 17:3077–3079. 2010.
View Article : Google Scholar : PubMed/NCBI
|
|
13
|
Van Cutsem E, Sagaert X, Topal B,
Haustermans K and Prenen H: Gastric cancer. Lancet. 388:2654–2664.
2016. View Article : Google Scholar : PubMed/NCBI
|
|
14
|
Nosho K, Baba Y, Tanaka N, Shima K,
Hayashi M, Meyerhardt JA, Giovannucci E, Dranoff G, Fuchs CS and
Ogino S: Tumour-infiltrating T-cell subsets, molecular changes in
colorectal cancer, and prognosis: Cohort study and literature
review. J Pathol. 222:350–366. 2010. View Article : Google Scholar : PubMed/NCBI
|
|
15
|
Livak KJ and Schmittgen TD: Analysis of
relative gene expression data using real-time quantitative PCR and
the 2−ΔΔCT method. Methods. 25:402–408. 2001. View Article : Google Scholar : PubMed/NCBI
|
|
16
|
Szasz AM, Lanczky A, Nagy Á, Förster S,
Hark K, Green JE, Boussioutas A, Busuttil R, Szabó A and Győrffy B:
Cross-validation of survival associated biomarkers in gastric
cancer using transcriptomic data of 1,065 patients. Oncotarget.
7:49322–49333. 2016. View Article : Google Scholar : PubMed/NCBI
|
|
17
|
Kim HK, Choi IJ, Kim CG, Kim HS, Oshima A,
Michalowski A and Green JE: A gene expression signature of acquired
chemoresistance to cisplatin and fluorouracil combination
chemotherapy in gastric cancer patients. PLoS One. 6:e166942011.
View Article : Google Scholar : PubMed/NCBI
|
|
18
|
Ooi CH, Ivanova T, Wu J, Lee M, Tan IB,
Tao J, Ward L, Koo JH, Gopalakrishnan V, Zhu Y, et al: Oncogenic
pathway combinations predict clinical prognosis in gastric cancer.
PLoS Genetics. 5:e10006762009. View Article : Google Scholar : PubMed/NCBI
|
|
19
|
Forster S, Gretschel S, Jons T, Yashiro M
and Kemmner W: THBS4, a novel stromal molecule of diffuse-type
gastric adenocarcinomas, identified by transcriptome-wide
expression profiling. Mod Pathol. 24:1390–1403. 2011. View Article : Google Scholar : PubMed/NCBI
|
|
20
|
Wang G, Hu N, Yang HH, Wang L, Su H, Wang
C, Clifford R, Dawsey EM, Li JM, Ding T, et al: Comparison of
global gene expression of gastric cardia and noncardia cancers from
a high-risk population in china. PLoS One. 8:e638262013. View Article : Google Scholar : PubMed/NCBI
|
|
21
|
Busuttil RA, George J, Tothill RW,
Ioculano K, Kowalczyk A, Mitchell C, Lade S, Tan P, Haviv I and
Boussioutas A: A signature predicting poor prognosis in gastric and
ovarian cancer represents a coordinated macrophage and stromal
response. Clin Cancer Res. 20:2761–2772. 2014. View Article : Google Scholar : PubMed/NCBI
|
|
22
|
Cristescu R, Lee J, Nebozhyn M, Kim KM,
Ting JC, Wong SS, Liu J, Yue YG, Wang J, Yu K, et al: Molecular
analysis of gastric cancer identifies subtypes associated with
distinct clinical outcomes. Nat Med. 21:449–456. 2015. View Article : Google Scholar : PubMed/NCBI
|
|
23
|
Shen L, Shan YS, Hu HM, Price TJ, Sirohi
B, Yeh KH, Yang YH, Sano T, Yang HK, Zhang X, et al: Management of
gastric cancer in Asia: Resource-stratified guidelines. Lancet
Oncol. 14:e535–e547. 2013. View Article : Google Scholar : PubMed/NCBI
|
|
24
|
Sanchez-Fueyo A, Tian J, Picarella D,
Domenig C, Zheng XX, Sabatos CA, Manlongat N, Bender O, Kamradt T,
Kuchroo VK, et al: Tim-3 inhibits T helper type 1-mediated auto-
and alloimmune responses and promotes immunological tolerance. Nat
Immunol. 4:1093–1101. 2003. View
Article : Google Scholar : PubMed/NCBI
|
|
25
|
Sabatos CA, Chakravarti S, Cha E, Schubart
A, Sánchez-Fueyo A, Zheng XX, Coyle AJ, Strom TB, Freeman GJ and
Kuchroo VK: Interaction of Tim-3 and Tim-3 ligand regulates T
helper type 1 responses and induction of peripheral tolerance. Nat
Immunol. 4:1102–1110. 2003. View
Article : Google Scholar : PubMed/NCBI
|
|
26
|
Jiang J, Jin MS, Kong F, Cao D, Ma HX, Jia
Z, Wang YP, Suo J and Cao X: Decreased galectin-9 and increased
Tim-3 expression are related to poor prognosis in gastric cancer.
PLoS One. 8:e817992013. View Article : Google Scholar : PubMed/NCBI
|
|
27
|
Xu Y, Zhang H, Huang Y, Rui X and Zheng F:
Role of TIM-3 in ovarian cancer. Clin Transl Oncol. 19:1079–1083.
2017. View Article : Google Scholar : PubMed/NCBI
|
|
28
|
Ngiow SF, Teng MW and Smyth MJ: Prospects
for TIM3-targeted antitumor immunotherapy. Cancer Res.
71:6567–6571. 2011. View Article : Google Scholar : PubMed/NCBI
|
|
29
|
da Silva IP, Gallois A, Jimenez-Baranda S,
Khan S, Anderson AC, Kuchroo VK, Osman I and Bhardwaj N: Reversal
of NK-cell exhaustion in advanced melanoma by Tim-3 blockade.
Cancer Immunol Res. 2:410–422. 2014. View Article : Google Scholar : PubMed/NCBI
|
|
30
|
Anderson AC: Tim-3, a negative regulator
of anti-tumor immunity. Curr Opin Immunol. 24:213–216. 2012.
View Article : Google Scholar : PubMed/NCBI
|
|
31
|
Yang X, Jiang X, Chen G, Xiao Y, Geng S,
Kang C, Zhou T, Li Y, Guo X, Xiao H, et al: T cell Ig mucin-3
promotes homeostasis of sepsis by negatively regulating the TLR
response. J Immunol. 190:2068–2079. 2013. View Article : Google Scholar : PubMed/NCBI
|
|
32
|
Liu FT and Rabinovich GA: Galectins as
modulators of tumour progression. Nat Rev Cancer. 5:29–41. 2005.
View Article : Google Scholar : PubMed/NCBI
|
|
33
|
Szoke T, Kayser K, Baumhakel JD, Trojan I,
Furak J, Tiszlavicz L, Horvath A, Szluha K, Gabius HJ and Andre S:
Prognostic significance of endogenous adhesion/growth-regulatory
lectins in lung cancer. Oncology. 69:167–174. 2005. View Article : Google Scholar : PubMed/NCBI
|
|
34
|
Cedeno-Laurent F and Dimitroff CJ:
Galectins and their ligands: Negative regulators of anti-tumor
immunity. Glycoconj J. 29:619–625. 2012. View Article : Google Scholar : PubMed/NCBI
|
|
35
|
Ohue Y, Kurose K, Nozawa R, Isobe M,
Nishio Y, Tanaka T, Doki Y, Hori T, Fukuoka J, Oka M and Nakayama
E: Survival of lung adenocarcinoma patients predicted from
expression of PD-L1, Galectin-9, and XAGE1 (GAGED2a) on tumor cells
and tumor-infiltrating T cells. Cancer Immunol Res. 4:1049–1060.
2016. View Article : Google Scholar : PubMed/NCBI
|
|
36
|
Seki M, Oomizu S, Sakata KM, Sakata A,
Arikawa T, Watanabe K, Ito K, Takeshita K, Niki T, Saita N, et al:
Galectin-9 suppresses the generation of Th17, promotes the
induction of regulatory T cells, and regulates experimental
autoimmune arthritis. Clin Immunol. 127:78–88. 2008. View Article : Google Scholar : PubMed/NCBI
|
|
37
|
Zhu C, Anderson AC, Schubart A, Xiong H,
Imitola J, Khoury SJ, Zheng XX, Strom TB and Kuchroo VK: The Tim-3
ligand galectin-9 negatively regulates T helper type 1 immunity.
Nat Immunol. 6:1245–1252. 2005. View
Article : Google Scholar : PubMed/NCBI
|
|
38
|
Yamauchi A, Kontani K, Kihara M, Nishi N,
Yokomise H and Hirashima M: Galectin-9, a novel prognostic factor
with antimetastatic potential in breast cancer. Breast J. 12 5
Suppl 2:S196–S200. 2006. View Article : Google Scholar : PubMed/NCBI
|
|
39
|
Liang M, Ueno M, Oomizu S, Arikawa T,
Shinonaga R, Zhang S, Yamauchi A and Hirashima M: Galectin-9
expression links to malignant potential of cervical squamous cell
carcinoma. J Cancer Res Clin Oncol. 134:899–907. 2008. View Article : Google Scholar : PubMed/NCBI
|
|
40
|
Kageshita T, Kashio Y, Yamauchi A, Seki M,
Abedin MJ, Nishi N, Shoji H, Nakamura T, Ono T and Hirashima M:
Possible role of galectin-9 in cell aggregation and apoptosis of
human melanoma cell lines and its clinical significance. Int J
Cancer. 99:809–816. 2002. View Article : Google Scholar : PubMed/NCBI
|
|
41
|
Kawazoe A, Kuwata T, Kuboki Y, Shitara K,
Nagatsuma AK, Aizawa M, Yoshino T, Doi T, Ohtsu A and Ochiai A:
Clinicopathological features of programmed death ligand 1
expression with tumor-infiltrating lymphocyte, mismatch repair, and
Epstein-Barr virus status in a large cohort of gastric cancer
patients. Gastric Cancer. 20:407–415. 2017. View Article : Google Scholar : PubMed/NCBI
|
|
42
|
Lee HE, Chae SW, Lee YJ, Kim MA, Lee HS,
Lee BL and Kim WH: Prognostic implications of type and density of
tumour-infiltrating lymphocytes in gastric cancer. Br J Cancer.
99:1704–1711. 2008. View Article : Google Scholar : PubMed/NCBI
|
|
43
|
de Reuver PR, Mehta S, Gill P, Andrici J,
D'Urso L, Clarkson A, Mittal A, Hugh TJ, Samra JS and Gill AJ:
Immunoregulatory forkhead box protein p3-positive lymphocytes are
associated with overall survival in patients with pancreatic
neuroendocrine tumors. J Am Coll Surg. 222:281–287. 2016.
View Article : Google Scholar : PubMed/NCBI
|
|
44
|
Frydrychowicz M, Boruczkowski M,
Kolecka-Bednarczyk A and Dworacki G: The dual role of Treg in
cancer. Scand J Immunol. 86:436–443. 2017. View Article : Google Scholar : PubMed/NCBI
|
|
45
|
Hou J, Yu Z, Xiang R, Li C and Wang L,
Chen S, Li Q, Chen M and Wang L: Correlation between infiltration
of FOXP3+ regulatory T cells and expression of B7-H1 in the tumor
tissues of gastric cancer. Exp Mol Pathol. 96:284–291. 2014.
View Article : Google Scholar : PubMed/NCBI
|
|
46
|
Cimino-Mathews A, Thompson E, Taube JM, Ye
X, Lu Y, Meeker A, Xu H, Sharma R, Lecksell K, Cornish TC, et al:
PD-L1 (B7-H1) expression and the immune tumor microenvironment in
primary and metastatic breast carcinomas. Hum Pathol. 47:52–63.
2016. View Article : Google Scholar : PubMed/NCBI
|
|
47
|
Wang Z, Zhu J, Gu H, Yuan Y, Zhang B, Zhu
D, Zhou J, Zhu Y and Chen W: The clinical significance of abnormal
Tim-3 expression on NK cells from patients with gastric cancer.
Immunol Invest. 44:578–589. 2015. View Article : Google Scholar : PubMed/NCBI
|
|
48
|
Cheng G, Li M, Wu J, Ji M, Fang C, Shi H,
Zhu D, Chen L, Zhao J, Shi L, et al: Expression of Tim-3 in gastric
cancer tissue and its relationship with prognosis. Int J Clin Exp
Pathol. 8:9452–9457. 2015.PubMed/NCBI
|