Introduction
Glioma is one of the most common primary tumors in
brain and it accounts for the majority of central nervous system
oncology cases in adults globally in 2016 (1). In general, glioma infiltrates into the
brain and affects the cerebral hemispheres of patients (1). Though aggressive therapies including
surgery, chemotherapy, and radiotherapy have been developed and
applied widely, glioma remains associated with high recurrence
rates and there are no efficient treatment options (2). The prognosis of glioma patients
remains poor (3). Therefore, the
development of novel treatments, the identification of new
prognostic biomarkers and a clearer understanding of the molecular
mechanisms underlying disease progression are essential and
urgently required.
Long non-coding RNAs (lncRNAs) account for 80% of
non-coding RNAs and are defined as the endogenous cellular RNAs
that are >200 nucleotides in length (4,5). With
the development of biological computing research tools including
lncRNAdb, ChIPBase, LNCipeida and lncRNAtor, the number of lncRNAs
being identified is rapidly increasing. In total, >8,000 lncRNA
genes have been identified within 4 years and the number of human
lncRNAs is estimated to be between 10,000 and 20,000 (6,7). A
previous study revealed that lncRNAs are associated with multiple
critical cellular functions, including transcriptional,
posttranscriptional and epigenetic functions (8). LncRNAs have attracted considerable
attention in cancer, since they may be involved in oncogenic and
tumor suppressive pathways (6). In
the last decade, accumulating evidence demonstrated that the
expression levels of lncRNAs were correlated with the development
and progression of several types of cancer, through affecting the
biological processes including growth, proliferation, metastasis
and invasion (9,10). In addition, the functional roles
that they may serve in tumor prognosis have been also investigated
(11).
The important roles of lncRNAs in gliomas have been
revealed in multiple studies. It was reported that lncRNAs may
regulate cellular proliferation, apoptosis and migration in glioma
(3,12,13).
In addition, aberrant expression of lncRNAs has been linked with
differential treatment responses in patients with glioma and
lncRNAs may be promising as diagnostic and prognostic biomarkers in
glioma (14). Ma et al
(15) reported that lncRNA
metastasis-associated lung adenocarcinoma transcript 1 (MALAT1) may
regulate the progression of glioma, thus serving as a potential
prognostic biomarker. Using univariate Cox regression analysis, the
overexpression of lncRNA AB073614 was identified as a poor
prognostic biomarker in glioma (16). Despite these findings, our
understanding of the prognostic role of lncRNAs in glioma remains
unclear.
In the present study, the lncRNA sequencing
(lncRNA-seq) data and mRNA-seq expression profiles of glioma
samples were downloaded from the TCGA database and the differently
expressed lncRNAs were screened. Furthermore, multivariate Cox
regression analysis was used to establish a risk assessment system
based on the weighted regression coefficient of lncRNA expression.
Subsequently, survival analysis for the risk assessment model was
conducted in training, validation and entire sets. Finally, the
co-expression networks of lncRNAs in the risk assessment model were
constructed and the function enrichment was performed for the genes
associated with these lncRNAs.
Materials and methods
Data and data processing
The lncRNA-seq data and mRNA-seq expression profiles
of glioma samples were downloaded from the TCGA database
(gdc-portal.nci.nih.gov). Glioblastoma
samples were used. A total of 173 glioma samples were obtained.
Following matching the barcodes of lncRNA-seq data and mRNA-seq
expression profiles, 154 glioma samples remained. Finally, 140
samples were selected for analysis following removal of the samples
without survival information and overall survival time <6
months. The lncRNAs were annotated using human genome annotation
GTF format in the GENCODE database (www.gencodegenes.org) (17). These 140 samples were randomly
divided into two groups as the ratio of 1:1, namely training and
validation sets.
Screening differently expressed
lncRNAs
The 70 glioma tissue samples in the training group
were divided into bad prognosis (patients succumbed within 6
months) and good prognosis (patients with a survival time >12
months) groups. Subsequently, the differentially expressed lncRNAs
between these two groups were screened using DEseq 1.16.0
(www.bioconductor.org/packages/release/bioc/html/DESeq.html)
(18) and edgeR 3.8.5 (www.bioconductor.org/packages/release/bioc/html/edgeR.html)
(19) package in R 3.1.0
(www.r-project.org) with the threshold of false
discovery rate (FDR) <0.05 and |log2 fold change|
>0.263. Then, the differently expressed lncRNAs were screened
for prognostic factors (threshold, P<0.05) using the log-rank
test and univariate Cox regression analysis in R 3.1.0.
Establishment of a risk assessment
model
Based on the previously obtained differentially
expressed lncRNAs, multivariate Cox regression analysis was
performed to establish a risk assessment system according to the
regression coefficient weighted lncRNA expression. The risk score
for each patient was based on a linear combination of mRNA
expression values after weighting regression coefficients. The risk
assessment for each patient was scored according to the following
equation: Risk score = βlncRNA1 × exprlncRNA1
+ βlncRNA2 × exprlncRNA2 + ··· +
βlncRNAn × exprlncRNAn, where expr means the
expression level of lncRNA. The β value obtained in the training
set was also used to assess the risk of patients in the validation
set.
Survival analysis for risk assessment
model
The risk score of samples in validation set was
calculated according to the risk assessment system. Subsequently,
the samples were divided into high and low-risk types based on the
median risk score. Finally, Cox regression was performed for
correlation analysis in combination with corresponding clinical
data of samples. Kaplan-Meier survival analysis was performed to
compare the overall survival (OS) rates of patients with high and
low-risk scores. Receiver Operating Characteristic (ROC) curve was
used to evaluate the classification efficiency of the obtained risk
assessment model. Furthermore, the distribution of signature
lncRNAs in training validation and entire sets were analyzed and
displayed. In addition, the Kaplan-Meier survival analysis and ROC
curve were also performed for each of these lncRNAs in the risk
assessment model.
Correlation between risk assessment
model and clinical features
The risk scores of samples in the validation set
were calculated according to the risk assessment system.
Subsequently, the samples were divided into high and low-risk types
based on the median risk score. The correlations between prognosis
and the clinical features, including risk score, age, sex,
chemotherapy and pharmaceutical-therapy, were evaluated using
univariate and multivariate Cox regression analyses.
Subsequently, hierarchical analysis was performed
for the screened clinical features, which were significantly
correlated with prognosis risk. The association between the risk
groups and survival prognosis was analyzed under the same clinical
condition.
Construction of co-expression
network
The mRNA expression data matching the lncRNAs was
identified based on the sample number. The co-expression network of
lncRNA and mRNA was constructed using MEM software (20,21)
with the screening threshold of P<0.05. Then, the interaction
between the mRNAs in the co-expression network was identified using
the STRING (string-db.org) database (22). The interaction pairs with
interaction score above 0.4 were selected. Cystoscope 3.4
(www.cytoscape.org) was used to visualize the
networks (23).
Functional enrichment analysis
To identify the signaling pathways and biological
processes that may be associated with the prognosis of gliomas,
Gene Ontology (GO) analysis and Kyoto Encyclopedia of Genes and
Genomes (KEGG) enrichment analysis were performed for the mRNAs,
which were co-expressed with the lncRNAs in risk assessment model,
by Database for Annotation, Visualization and Integrated Discovery
(david.ncifcrf.gov) (24) with P<0.05.
Statistical analysis
In the present study, the data were presented as the
mean ± standard deviation. An unpaired t-test was used to compare
the difference between two groups using R 3.1.0. P<0.05 was
considered to indicate a statistically significant difference.
Results
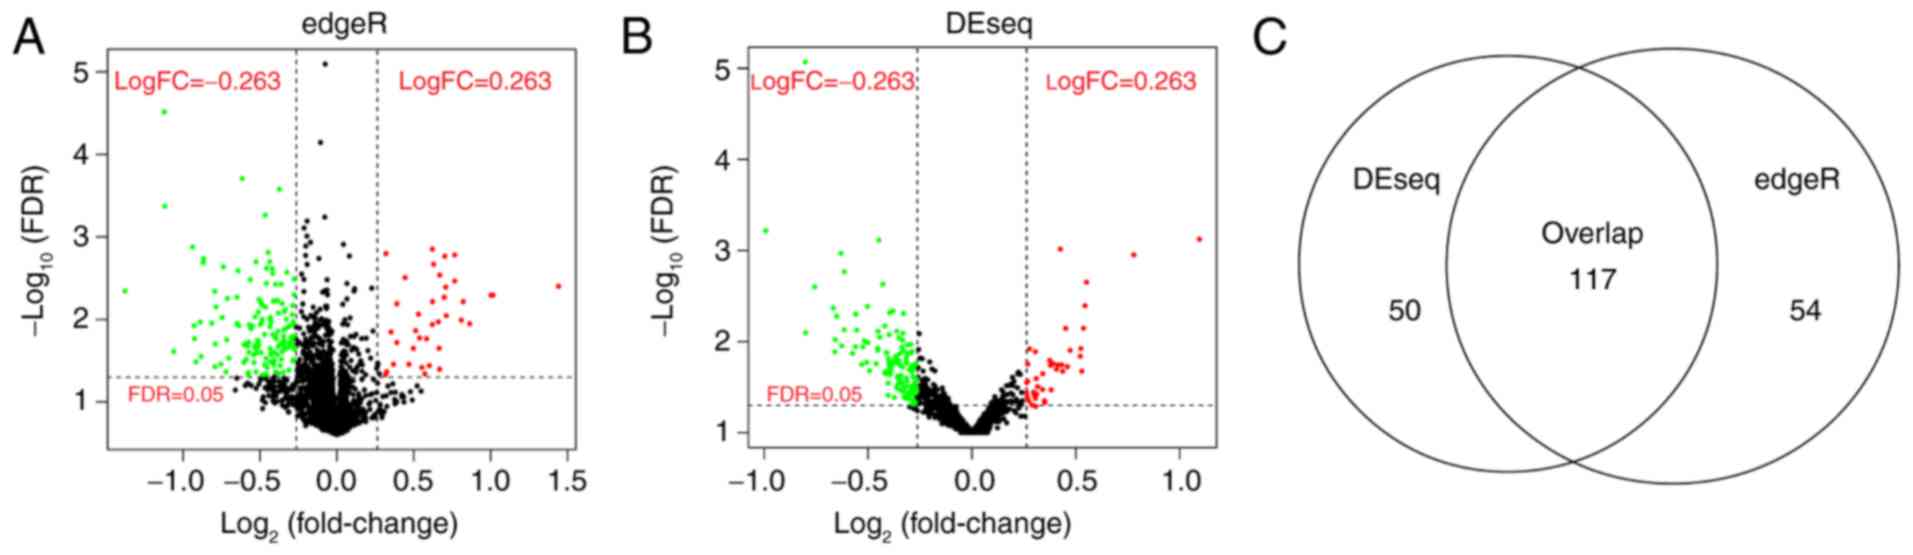
Differentially expressed lncRNAs
The clinical information for the training,
validation and complete sets is provided in Table I. For the training set, a total of
171 differentially expressed lncRNAs were screened using edgeR
(Fig. 1A), whereas 167
significantly differentially expressed lncRNAs were screened using
DEseq between the bad and good prognosis groups (Fig. 1B). The 117 overlapping lncRNAs were
screened for further analysis (Fig.
1C).
 | Table I.Clinical information for training,
validation and complete set. |
Table I.
Clinical information for training,
validation and complete set.
| Clinical
characteristic | Training set
(n=70) | Testing set
(n=70) | Entire set
(n=140) |
|---|
| Age (years, mean ±
SD) | 59.33±11.86 | 60.91±14.43 | 60.12±13.19 |
| Sex
(male/female) | 45/25 | 45/25 | 90/50 |
| Chemotherapy
(yes/no/unknown) | 20/43/7 | 24/36/10 | 44/79/17 |
| Drug therapy
(yes/no/unknown) | 8/55/7 | 11/48/11 | 19/103/18 |
|
Pharmaceutical-therapy
(yes/no/unknown) | 24/42/4 | 30/31/9 | 54/73/13 |
| Radiation-therapy
(yes/no/unknown) | 5/61/4 | 12/49/9 | 17/110/13 |
| Targeted
molecular-therapy (yes/no/unknown) | 9/53/8 | 8/53/9 | 17/106/17 |
| Mortality
(deceased/alive) | 51/19 | 51/19 | 102/38 |
| Overall survival
time, months | 12.35±9.83 | 13.16±11.29 | 12.75±10.55 |
Risk assessment model
In the training set, a total of 117 differentially
expressed lncRNAs were analyzed via univariate Cox regression
analysis and 35 lncRNAs were identified to be significantly
correlated (P<0.05) with prognosis. Subsequently, multivariate
Cox regression analysis was conducted for these 35 lncRNAs and 5 of
them were screened to build the risk assessment model (Table II). The risk score was calculated
using these five lncRNAs as follows: Risk score = (−1.05854) ×
expRP3-503A6 + (−1.03947) × expLINC00940 + (1.017787) ×
expRP11-453M23 + (0.83919) × expAC009411 + (1.095126) ×
expCDRT7.
| Table II.Information on the five lncRNAs
screened to build the risk assessment model. |
Table II.
Information on the five lncRNAs
screened to build the risk assessment model.
| lncRNA | Coefficient | HR | 95% CI | P-value |
|---|
| RP3-503A6 | −1.0585 | 2.8821 | 0.1719–0.7003 | 0.0031 |
| LINC00940 | −1.0395 | 2.8277 | 0.1721–0.7265 | 0.0047 |
| RP11-453M23 | 1.0178 | 0.3614 | 1.3416–5.7070 | 0.0059 |
| AC009411 | 0.8392 | 0.4321 | 1.2657–4.2325 | 0.0064 |
| CDRT7 | 1.0951 | 0.3345 | 1.3582–6.5803 | 0.0065 |
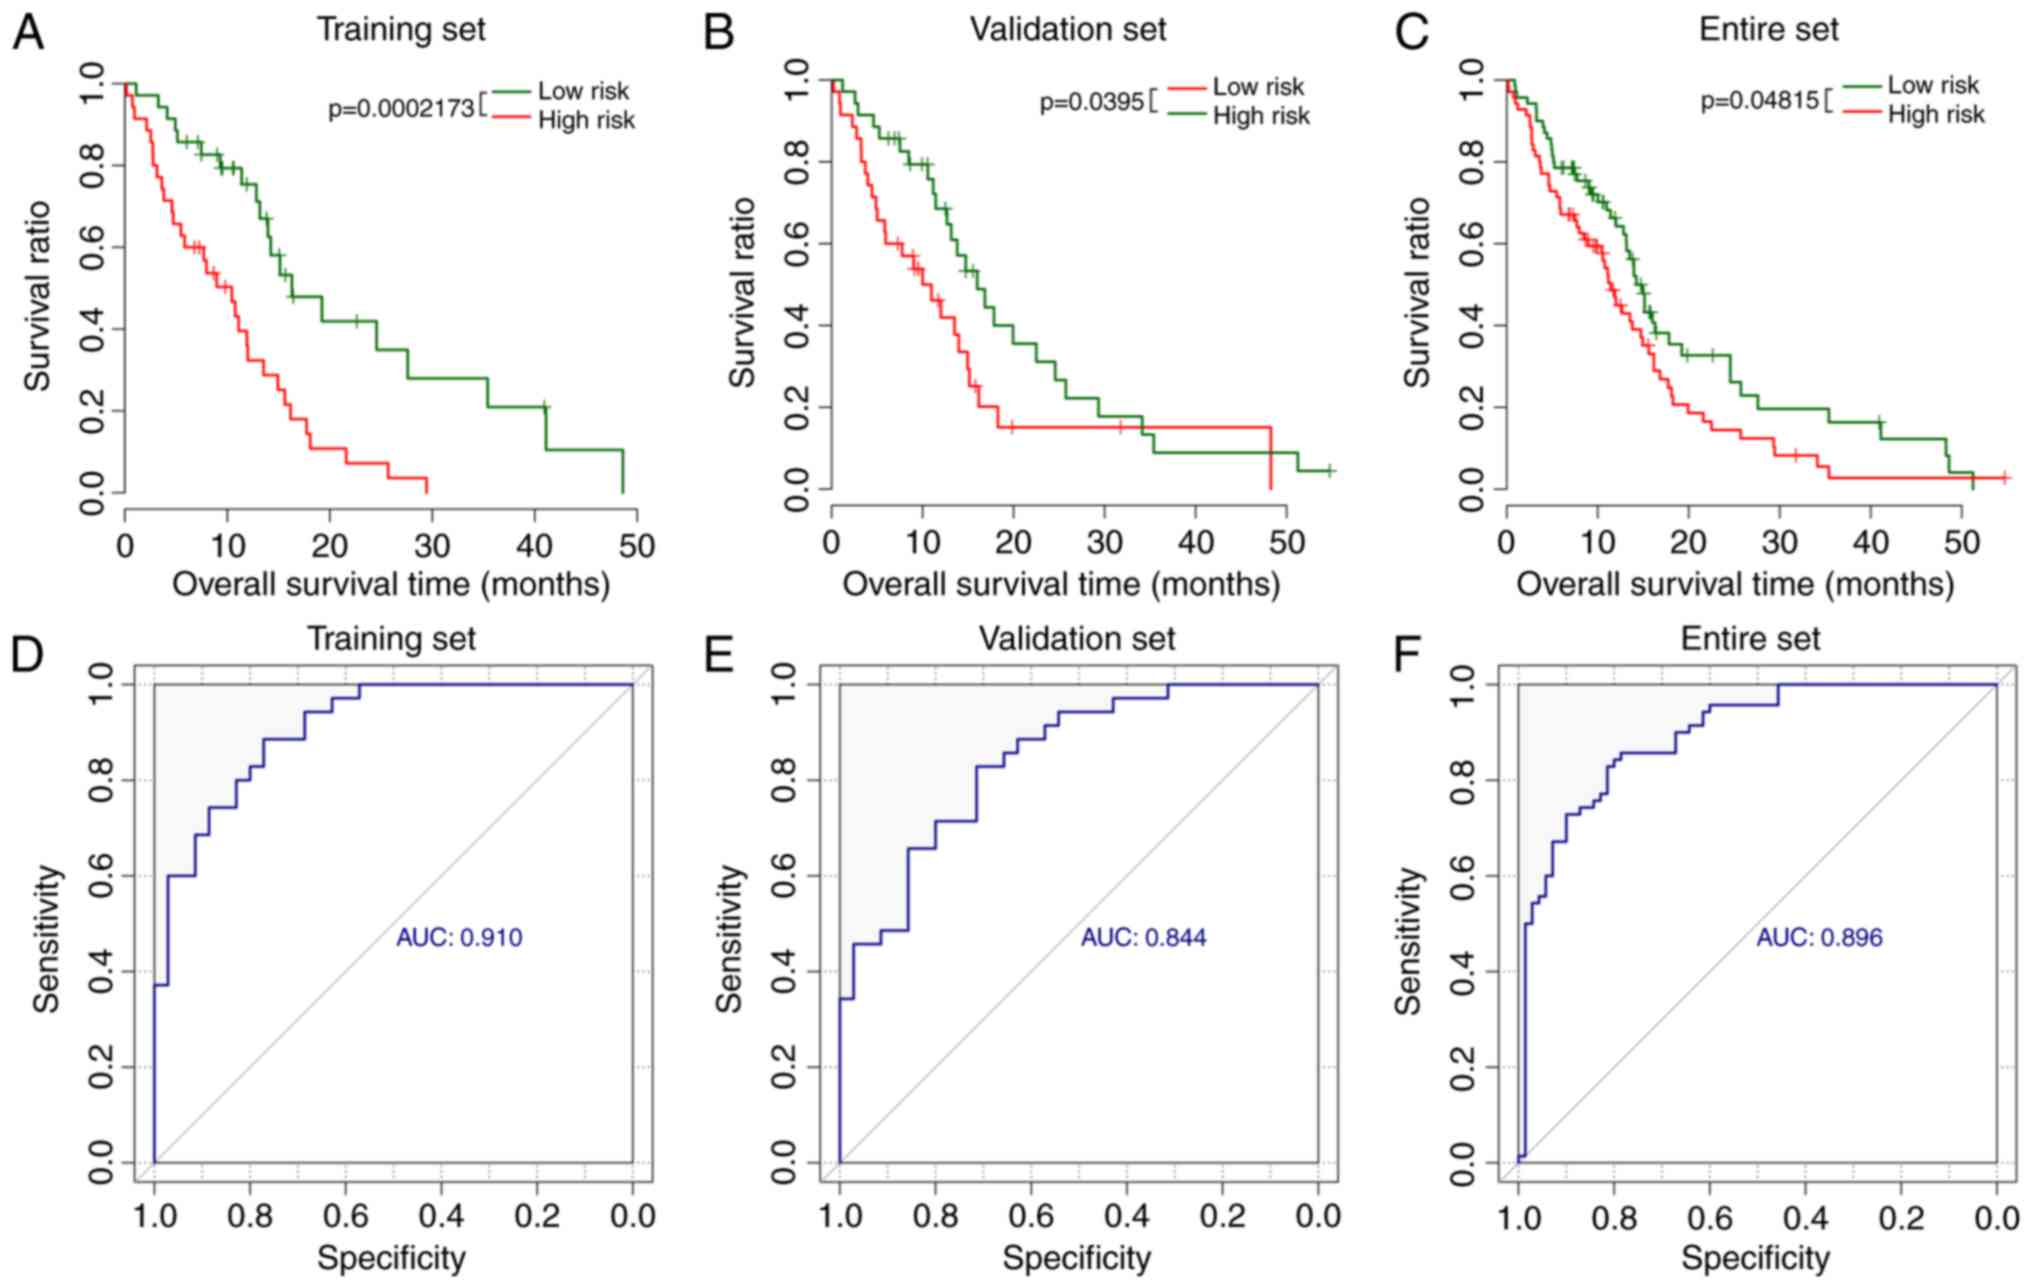
Survival analysis for five lncRNAs in
training, validation and entire sets
For the training set, patients in the low-risk group
were associated with longer survival time compared with the
patients in the high-risk group (15.29±11.29 vs. 9.41±7.13 months;
P=0.0117). Kaplan-Meier analysis confirmed the significant
difference of survival time between low-risk group and high-risk
group (P<0.001; Fig. 2A).
Consistent with the results of the training set, the
patients in the low-risk group exhibited significantly longer
survival time compared with the patients in high-risk group in the
validation and the entire sets (validation set: 16.13±12.84 vs.
10.19±8.69 months, P=0.0273, Fig.
2B; entire set: 15.71±12.01 vs. 9.81±7.89 months,
P=0.0207, Fig. 2C).
Additionally, the area under the curve (AUC) was 0.910, 0.84 and
0.896 for the ROC of these 5 lncRNAs in the training set (Fig. 2D), validation set (Fig. 2E) and entire set (Fig. 2F). The Youden index was 0.600,
0.621, and 0.62 in the training, validation and entire sets,
respectively.
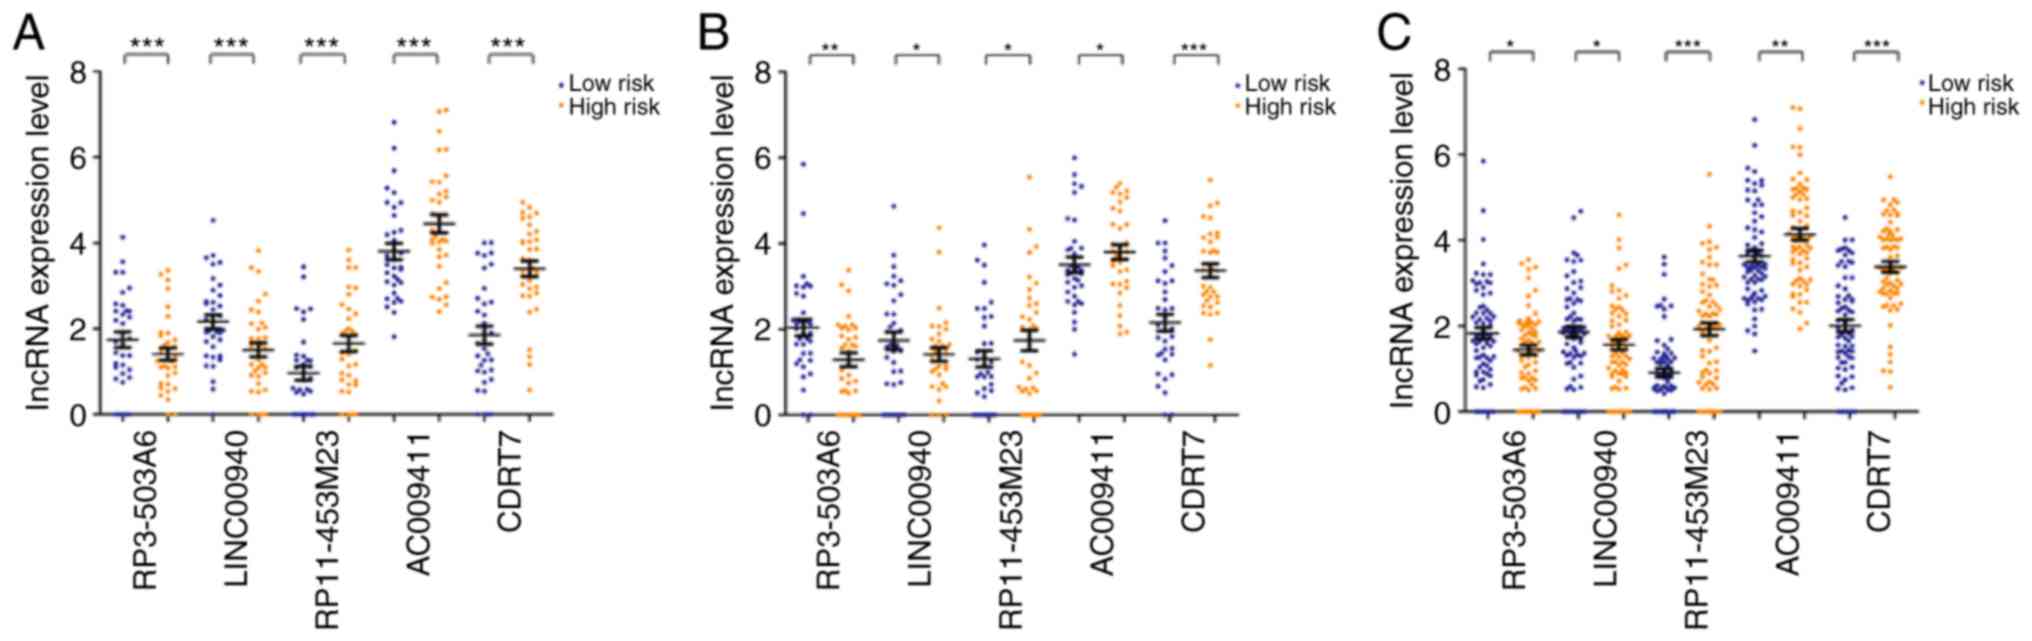
There were significant differences in the expression
levels of these five lncRNAs in training, validation and entire
sets (P<0.05; Fig. 3). The
expression levels of RP11-453M23, AC009411 and CDRT7 were
significantly increased in high-risk groups, whereas the expression
levels of RP3-503A6 and LINC00940 were significantly decreased
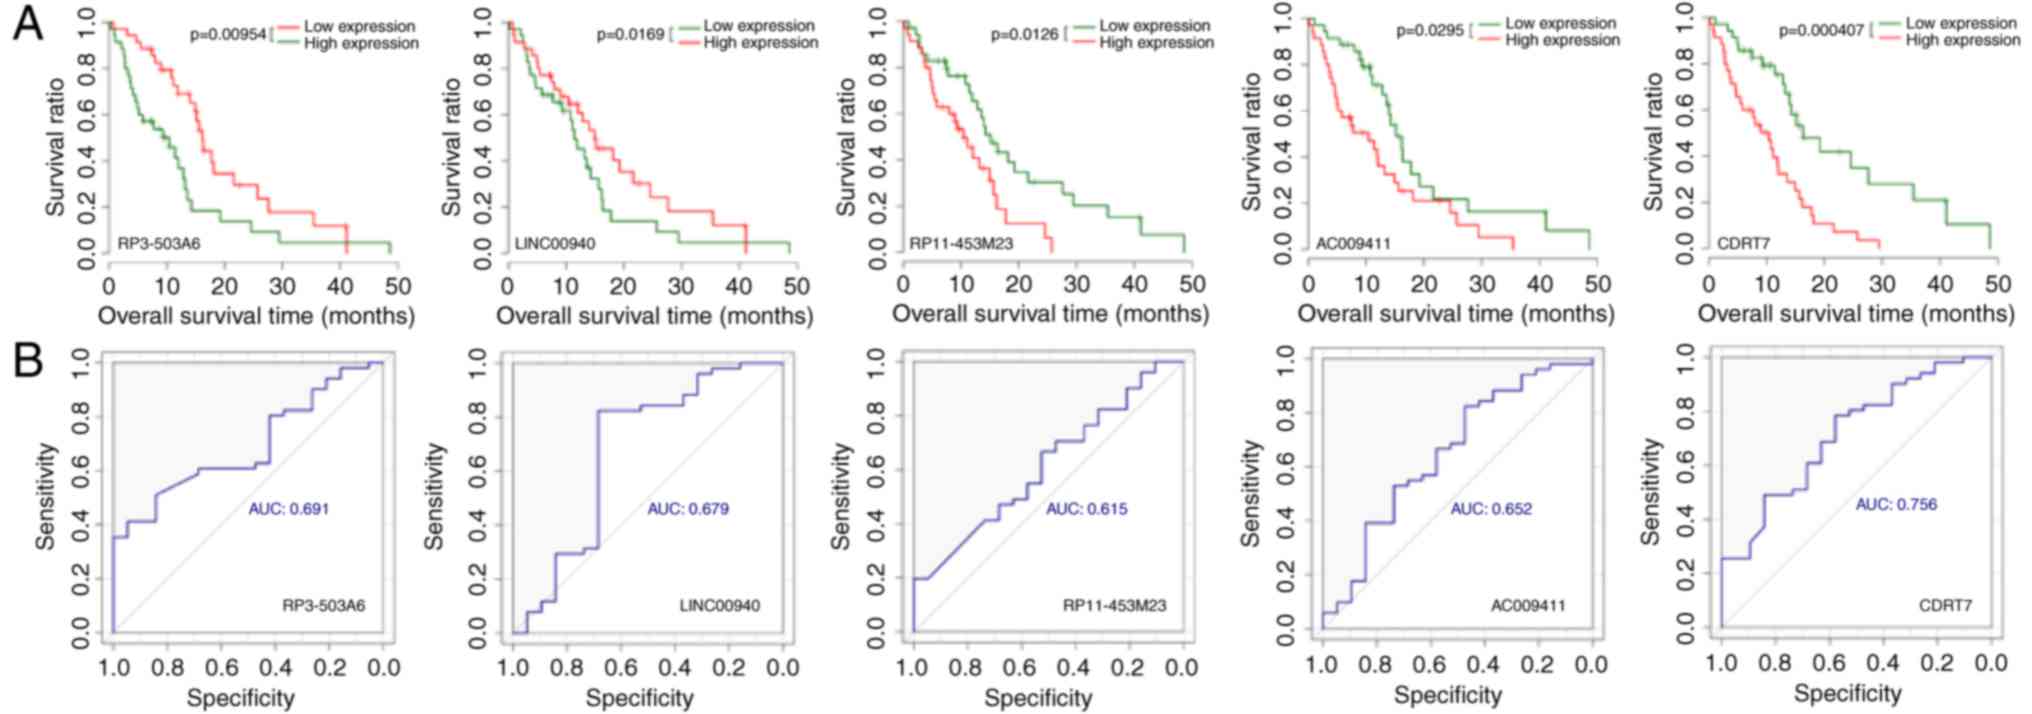
compared with the low-risk group (P<0.05). Consistently, the
results of Kaplan-Meier survival analysis demonstrated that
increased expression of RP3-503A6 and LINC00940 and decreased
expression of RP11-453M23, AC009411 and CDRT7 indicated improved
prognoses (Fig. 4). The AUC values
for ROC curves of RP3-503A6, LINC00940, RP11-453M23, AC009411 and
CDRT7 were 0.691, 0.679, 0.615, 0.652 and 0.716, respectively.
Prognostic factors for glioma
The results obtained from the univariate and
multivariate Cox regression analysis are provided in Tables III–V. In the training, validation and entire
sets, the risk score was significantly associated with the
prognosis of patients and it was an independent prognostic factor.
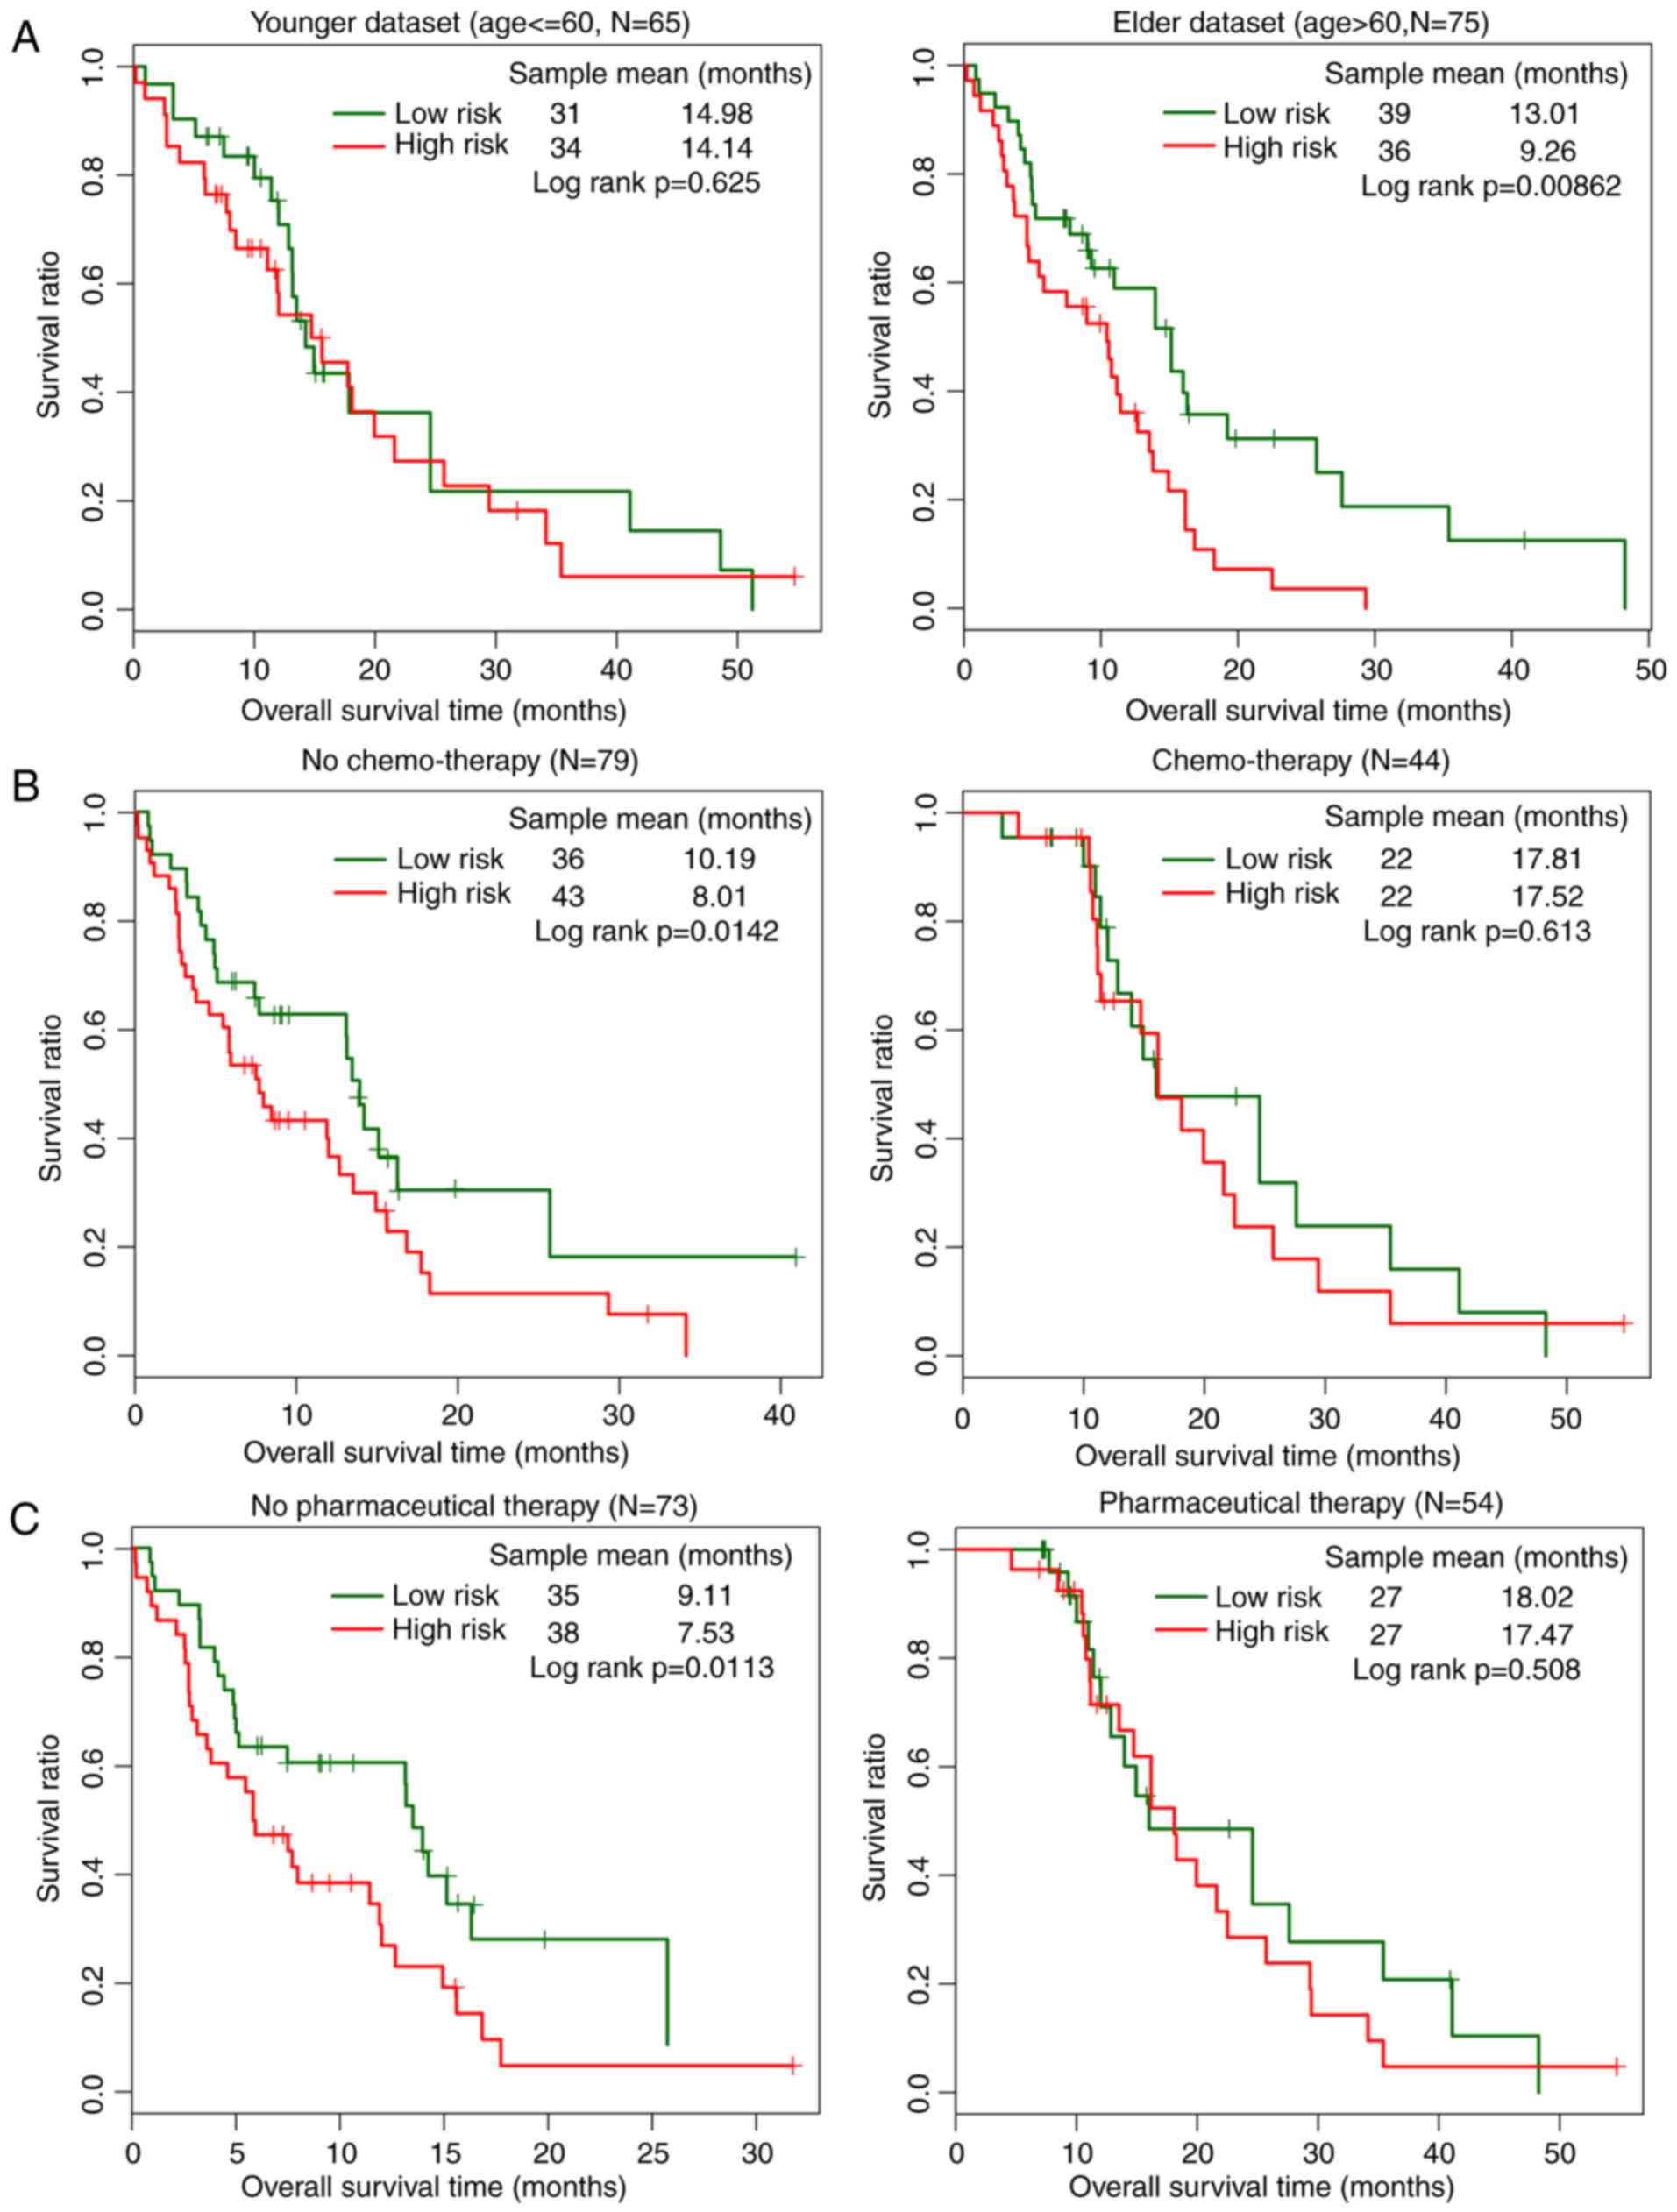
The impact of high and low risk on prognosis under the same
clinical features was also analyzed using hierarchical analysis. It
was demonstrated that the low-risk group had a significantly
improved prognosis compared with the high-risk group in the
subgroups of age >60 years (P=0.00862), no chemotherapy
(P=0.0113) and no pharmaceutical therapy (P=0.0142; Fig. 5). No significant differences of
survival ratio were observed between low-risk and high-risk groups
in the subgroups of age <60 years (P=0.625), chemo-therapy
(P=0.613) and pharmaceutical therapy (P=0.508; Fig. 5).
| Table III.Univariate and multivariate Cox
regression analysis for malignant glioma in training set
(n=70). |
Table III.
Univariate and multivariate Cox
regression analysis for malignant glioma in training set
(n=70).
|
| Univariate
analysis | Multivariate
analysis |
|---|
|
|
|
|
|---|
| Variable | HR | 95% CI | P-value | HR | 95% CI | P-value |
|---|
| Risk score |
|
High/low | 1.283 | 1.116–1.474 | 0.0002 | 1.318 | 1.108–1.568 | 0.0019 |
| Age, years |
|
≤60/>60 | 1.444 | 0.823–2.534 | 0.1978 | 2.123 | 1.088–4.142 | 0.0273 |
| Sex |
|
Male/female | 0.8142 | 0.461–1.438 | 0.4779 | 0.942 | 0.487–1.823 | 0.8590 |
| Chemotherapy |
|
Yes/no | 0.3947 | 0.199–0.781 | 0.0062 | 1.355 | 0.587–1.901 | 0.1280 |
| Pharmaceutical
therapy |
|
Yes/no | 0.223 | 0.0994–0.499 | 0.0003 | 0.381 | 0.261–0.446 | 0.0092 |
| Table V.Univariate and multivariate Cox
regression analysis for malignant glioma in entire set (n=140). |
Table V.
Univariate and multivariate Cox
regression analysis for malignant glioma in entire set (n=140).
|
| Univariate
analysis | Multivariate
analysis |
|---|
|
|
|
|
|---|
| Variable | HR | 95% CI | P-value | HR | 95% CI | P-value |
|---|
| Risk score |
|
High/low | 1.037 | 0.943–1.141 | 0.0482 | 1.447 | 0.918–2.281 | 0.0197 |
| Age, years |
|
≤60/>60 | 1.57 | 1.052–2.344 | 0.0272 | 1.447 | 0.918–2.281 | 0.1120 |
| Sex |
|
Male/female | 0.815 | 0.547–1.215 | 0.3160 | 0.841 | 0.539–1.312 | 0.4460 |
| Chemotherapy |
|
Yes/no | 0.485 | 0.308–0.762 | 0.0017 | 1.414 | 0.641–3.119 | 0.3910 |
| Pharmaceutical
therapy |
|
Yes/no | 0.339 | 0.214–0.539 | <0.0001 | 0.253 | 0.114–0.563 | 0.0008 |
Functional enrichment for co-expressed
mRNAs of signature lncRNAs
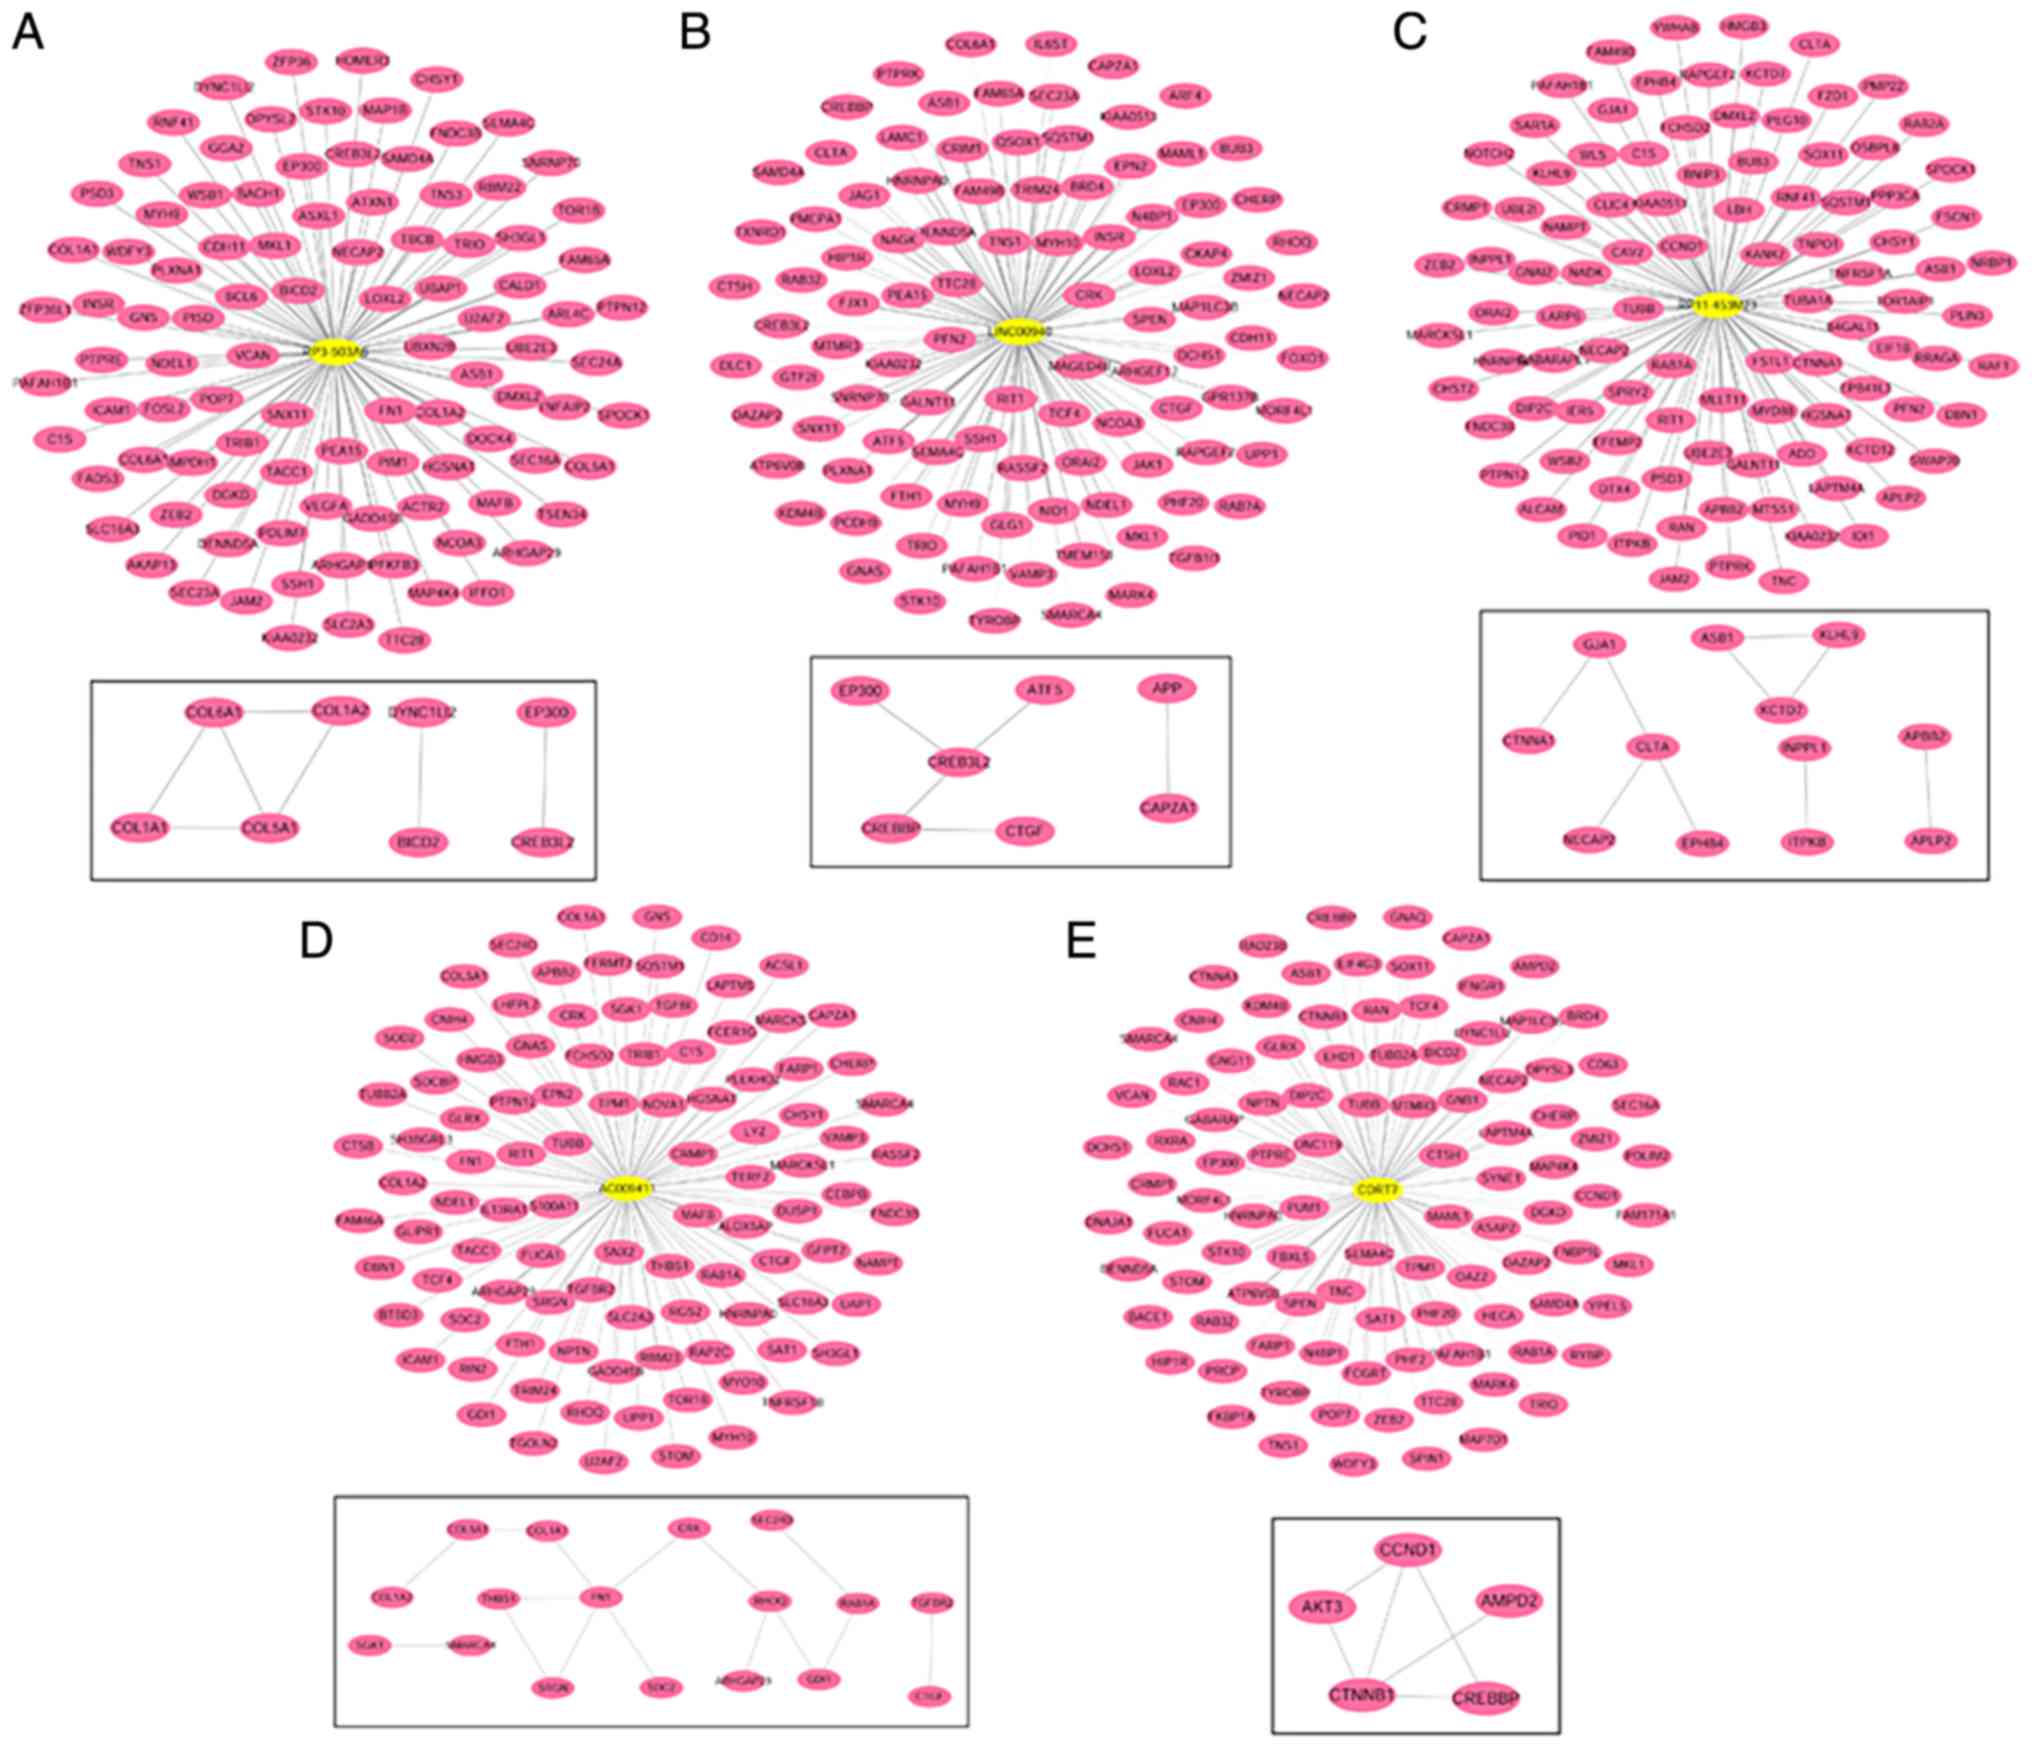
The co-expressed network for each lncRNA is
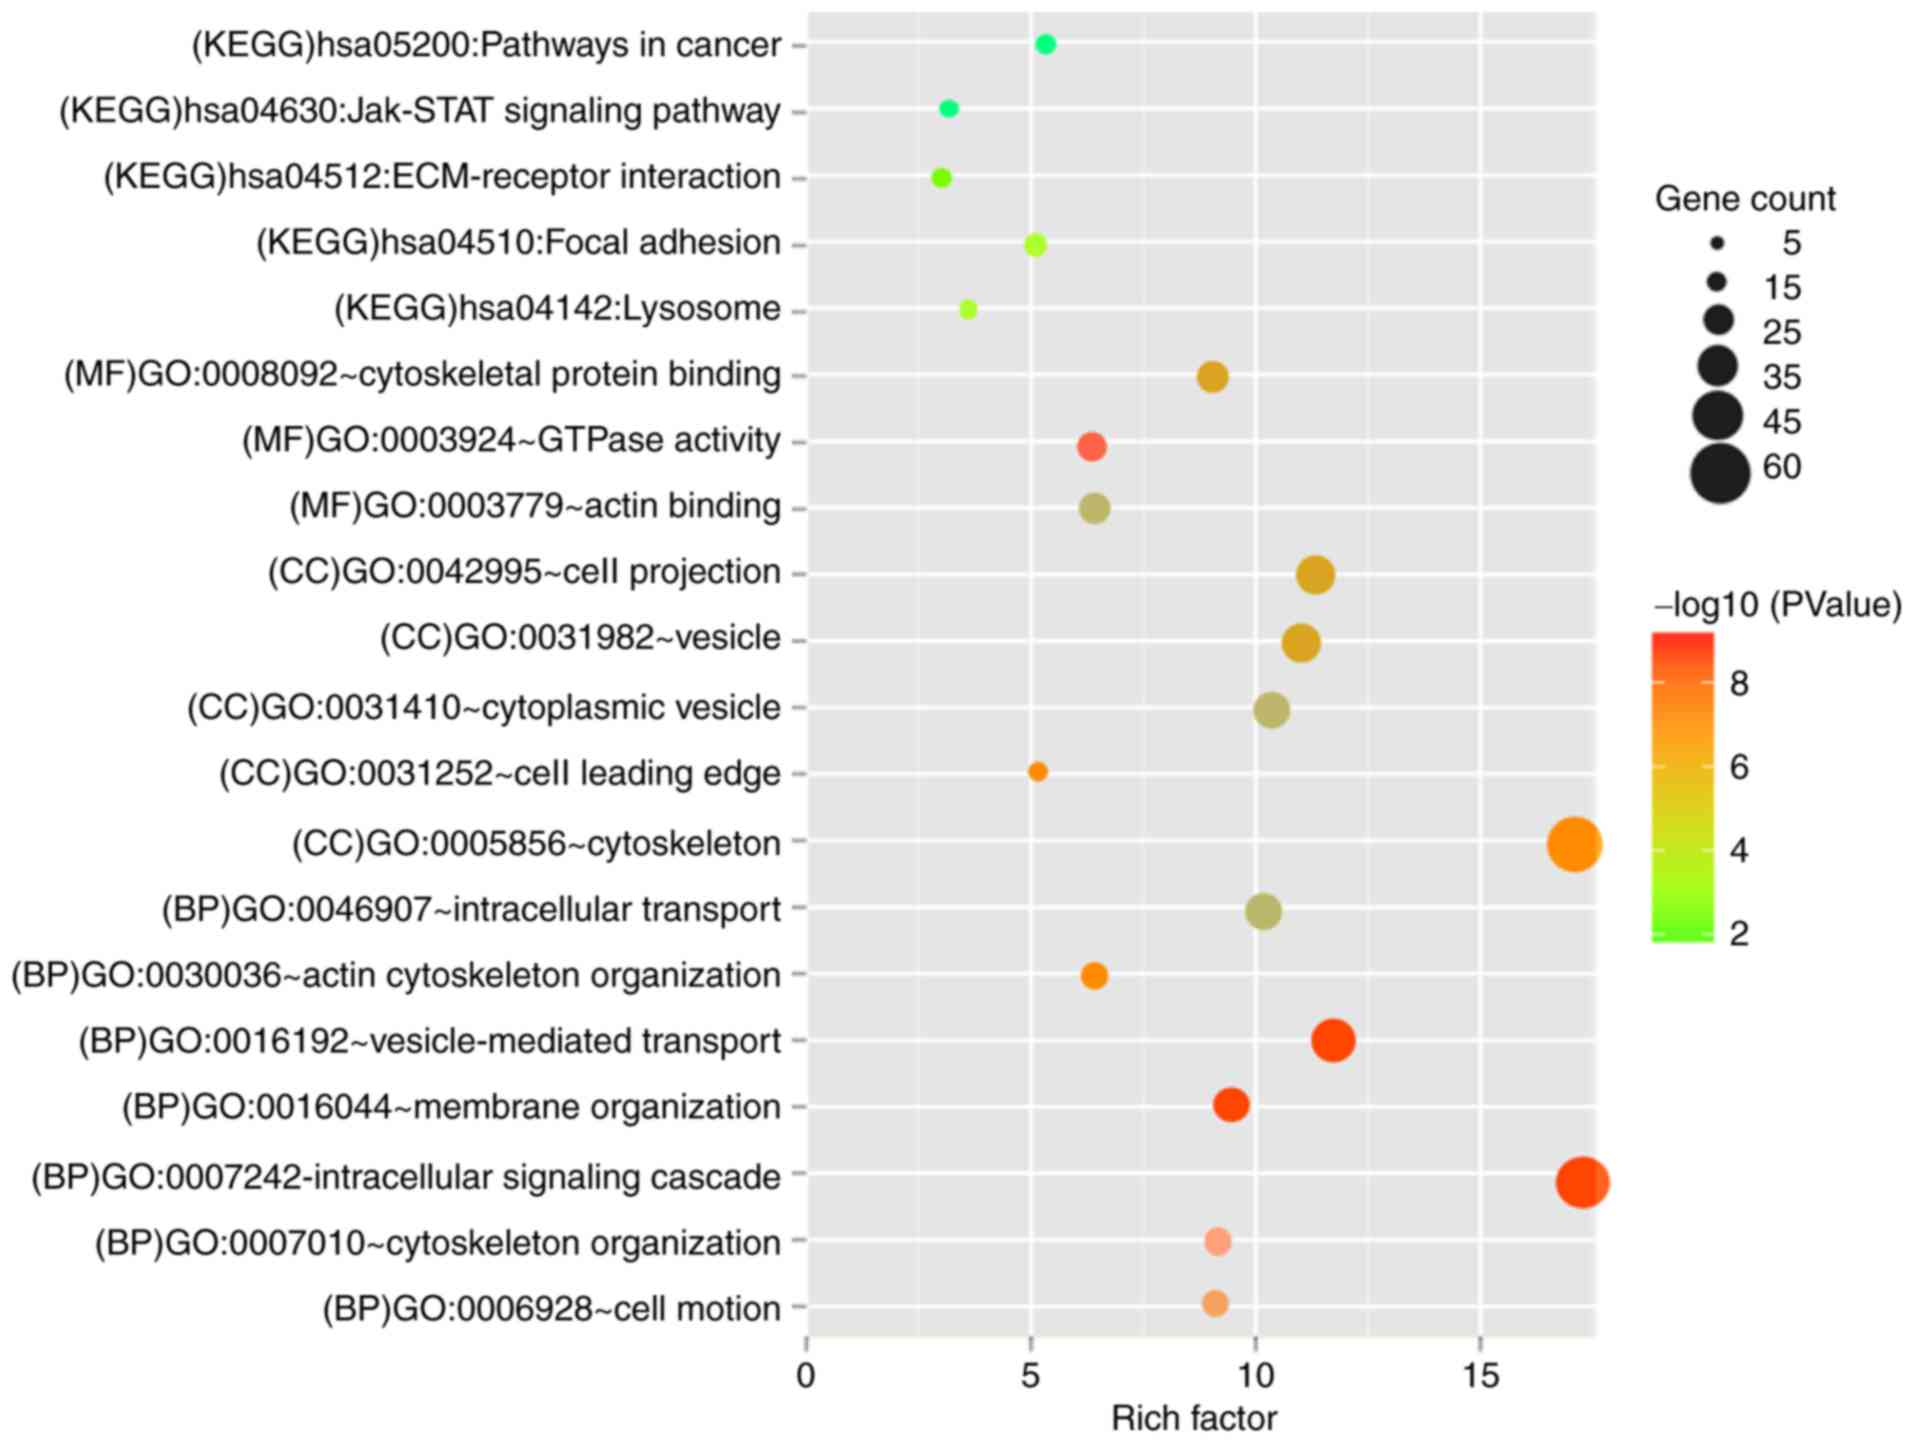
demonstrated in Fig. 6. GO
functional biology processes and KEGG pathways enriched by genes in
the networks are shown in Fig. 7.
The genes were involved in membrane organization, vesicle-mediated
transport, intracellular signaling cascade, cytoskeleton
organization and cell motion biological process (BP) terms. For
cell component (CC) term, cell leading edge, cytoskeleton, cell
projection, vesicle and cytoplasmic vesicle were the significantly
enriched ones. For the molecule function (MF) term, GTPase
activity, cytoskeletal protein binding and actin binding were
important. It was also noted that the genes associated with these
five lncRNAs were mainly enriched in cell adhesion (hsa04510: Focal
adhesion) and Janus kinase (Jak)-signal transducer and activator of
transcription (STAT) signaling pathway (hsa04630: Jak-STAT
signaling pathway).
Discussion
A total of 117 lncRNAs were identified between bad
and good prognosis groups in the training set using edgeR and DEseq
packages. According to univariate and multivariate Cox regression
analyses, five lncRNAs were screened to establish a risk assessment
model. The risk assessment model demonstrated good prognostic
function with increased AUC in training, validation and entire
sets. There were significant differences in the expression levels
of these five lncRNAs in the training, validation and entire set.
Furthermore, risk score calculated using these five lncRNAs was
certified as an independent prognostic factor for glioma. According
to the results of hierarchical analysis, the prognostic function of
the risk assessment model may be useful for patients >60 years
who did not receive chemotherapy and pharmaceutical therapy.
Multiple genes were screened to be co-expressed with
these five lncRNAs and these were mainly involved in cell adhesion,
Jak-STAT signaling pathway, intracellular signaling cascade, cell
motion, cytoskeleton, GTPase activity, cytoskeletal protein binding
and actin binding.
Metastasis accounts for the vast majority of
cancer-associated mortalities and is a result of cancer cells
moving from the primary site (site of the origin of cancer) to a
distant site or other organ (25).
The spatial and temporal reorganization of the cytoskeleton serves
a critical role in the movements and alterations of cell shape
throughout the complex processes of metastasis (26). The importance of
cytoskeleton-associated proteins and pathways involved in glioma
has also been reported in numerous previous studies (27,28).
In addition, increasing evidence revealed that lncRNAs are
associated with the occurrence and development of glioma by
regulating the structure of reorganization of
cytoskeleton-associated proteins and signaling pathways (29,30).
Additionally, the association between metastasis or cytoskeleton
and the prognosis of glioma has also been reported (31,32).
According to our analysis, the biological process of cytoskeleton
organization and actin cytoskeleton organization, the cell
component of cytoskeleton, and the molecular function of
cytoskeletal protein binding were enriched by the genes associated
with the five lncRNAs of the constructed risk assessment model.
Therefore, it may be reasonable to infer that the
cytoskeleton-associated process may be one of the underlying
mechanisms for the prognostic risk assessment model in glioma.
Consistently, the focal adhesion pathway, which is
associated with cell invasion and metastasis, was screened as a
significant pathway enriched by the genes associated with the five
lncRNAs based on the KEGG analysis. Focal adhesions are known as
the large macromolecular assemblies through which regulatory
signals and mechanical forces are transmitted between interacting
cells and the extracellular matrix (ECM) (33). Focal adhesion functions as the
mechanical linkage to the ECM and as a biochemical signaling hub to
concentrate and direct numerous signaling proteins at sites of
integrin binding and clustering (34). Yue et al (35) demonstrated that a cytoskeleton
protein of microtubules ending-binding 2 (EB2) may regulate the
dynamics of focal adhesion through MAP4K4. Importantly,
adhesion to ECM has been demonstrated to contribute to the
resistance to chemotherapy and radiotherapy in tumor cells
(36,37). Therefore, focal adhesion and ECM may
have a prognostic role for tumors (38).
The Jak-STAT signaling pathway is associated with
multiple biological processes, including cell survival, growth,
differentiation and development (39). In the central nervous system, the
Jak-STAT signaling pathway is mainly associated with gene
regulation during development, inflammation, hormone release and
tumorigenesis (39). A previous
study reported that inhibiting the STAT3 signaling pathway resulted
in depressed proliferation and increased apoptosis in various
cancer types including glioma (40). It was speculated that the regulation
of the Jak-STAT signaling pathway may be an important factor for
the prognostic function of the risk assessment model in glioma.
Multiple genes, including metastasis suppressor
protein 1 (MTSS1), drebrin 1 (DBN1), transforming
growth factor β1 induced transcript 1 (TGFB1I1), and cyclin
D1 (CCND1) are associated with cytoskeleton and adhesion or
Jak-STAT signaling pathway-associated processes. MTSS1 is
reported to be associated with the progression and metastasis of
tumor in multiple organ sites, possibly via an interaction with the
actin cytoskeleton (41).
DBN1 serves a role in cell migration, the extension of
neuronal processes and plasticity of dendrites and is overexpressed
during cancer metastasis (42).
TGFB1I1 functions as a molecular adapter for coordinating
various protein-protein interactions associated with focal adhesion
(43). Multidimensional analysis of
gene expression reveals that TGFB1I1-induced EMT contributes
to the malignant progression of astrocytomas (44). The activation of CCND1
affects the prognosis of glioma by promoting cell proliferation,
migration and invasion (45).
Therefore, it was inferred that the lncRNAs in the risk assessment
model may serve critical functions for the prognosis of glioma by
regulating the expression or function of these genes. The prognosis
of glioma patients may be predicted by detecting the expressions of
the five lncRNAs.
To conclude, lncRNAs serve important roles in the
development and progression of tumors and may affect tumor
prognosis. The present study provided a risk assessment model
consisting of five differently expressed lncRNAs, which may help to
assess the prognosis of glioma with increased accuracy, as
suggested by the survival analysis and increased AUC value. The
risk assessment model indicates the cytoskeleton, adhesion and
Jak-STAT signaling pathway may be the most important mechanism in
glioma prognosis. However, as all expression data were downloaded
from only one database, there may be possible bias in the present
study and further studies are required to verify the
conclusions.
Acknowledgements
Not applicable.
Funding
No funding was received.
Availability of data and materials
The datasets used and/or analyzed during the present
study are available from the corresponding author on reasonable
request.
Authors' contributions
CH performed data analyses and wrote the manuscript.
YZ and CL collected the dataset, contributed to data analyses and
manuscript revision. YK conceived and designed the study. All
authors read and approved the final manuscript.
Ethics approval and consent to
participate
In the original creation of the datasets, the local
institutional review boards of all participating centers approved
the trials and informed consent to participate was obtained from
all patients.
Patient consent for publication
Not applicable.
Competing interests
The authors declare that they have no competing
interests.
References
|
1
|
Sampetrean O and Saya H: Modeling
phenotypes of malignant gliomas. Cancer Sci. 109:6–14. 2017.
View Article : Google Scholar : PubMed/NCBI
|
|
2
|
Louis DN: Molecular pathology of malignant
gliomas. Ann Rev Pathol. 1:97–117. 2006. View Article : Google Scholar
|
|
3
|
Wang P, Ren Z and Sun P: Overexpression of
the long non-coding RNA MEG3 impairs in vitro glioma cell
proliferation. J Cell Biochem. 113:1868–1874. 2012. View Article : Google Scholar : PubMed/NCBI
|
|
4
|
Zhao W, Song M, Zhang J, Kuerban M and
Wang H: Combined identification of long non-coding RNA CCAT1 and
HOTAIR in serum as an effective screening for colorectal carcinoma.
Int J Clin Exp Pathol. 8:14131–14140. 2015.PubMed/NCBI
|
|
5
|
Zhou J, Li X, Wu M, Lin C, Guo Y and Tian
B: Knockdown of long noncoding RNA GHET1 inhibits cell
proliferation and invasion of colorectal cancer. Oncol Res.
23:303–309. 2016. View Article : Google Scholar
|
|
6
|
Gibb EA, Brown CJ and Lam WL: The
functional role of long non-coding RNA in human carcinomas. Mol
Cancer. 10:382011. View Article : Google Scholar : PubMed/NCBI
|
|
7
|
Martens-Uzunova ES, Böttcher R, Croce CM,
Jenster G, Visakorpi T and Calin GA: Long noncoding RNA in
prostate, bladder, and kidney cancer. Eur Urol. 65:1140–1151. 2014.
View Article : Google Scholar : PubMed/NCBI
|
|
8
|
Li F, Cao L, Hang D, Wang F and Wang Q:
Long non-coding RNA HOTTIP is up-regulated and associated with poor
prognosis in patients with osteosarcoma. Int J Clin Exp Pathol.
8:11414–11420. 2015.PubMed/NCBI
|
|
9
|
Jariwala N and Sarkar D: Emerging role of
lncRNA in cancer: A potential avenue in molecular medicine. Ann
Transl Med. 4:2862016. View Article : Google Scholar : PubMed/NCBI
|
|
10
|
Wan L, Zhang L, Fan K, Cheng ZX, Sun QC
and Wang JJ: Knockdown of long noncoding RNA PCAT6 inhibits
proliferation and invasion in lung cancer cells. Oncol Res.
24:161–170. 2016. View Article : Google Scholar : PubMed/NCBI
|
|
11
|
Chen S, Wu H, Lv N, Wang H, Wang Y, Tang
Q, Shao H and Sun C: LncRNA CCAT2 predicts poor prognosis
and regulates growth and metastasis in small cell lung cancer.
Biomed Pharmacother. 82:583–588. 2016. View Article : Google Scholar : PubMed/NCBI
|
|
12
|
Bian EB, Li J, Xie YS, Zong G, Li J and
Zhao B: LncRNAs: New players in gliomas, with special emphasis on
the interaction of lncRNAs With EZH2. J Cell Physiol. 230:496–503.
2015. View Article : Google Scholar : PubMed/NCBI
|
|
13
|
Yao J, Zhou B, Zhang J, Geng P, Liu K, Zhu
Y and Zhu W: A new tumor suppressor LncRNA ADAMTS9-AS2 is regulated
by DNMT1 and inhibits migration of glioma cells. Tumour Biol.
35:7935–7944. 2014. View Article : Google Scholar : PubMed/NCBI
|
|
14
|
Zhang XQ and Leung GK: Long non-coding
RNAs in glioma: Functional roles and clinical perspectives.
Neurochem Int. 77:78–85. 2014. View Article : Google Scholar : PubMed/NCBI
|
|
15
|
Ma KX, Wang HJ, Li XR, Li T, Su G, Yang P
and Wu JW: Long noncoding RNA MALAT1 associates with the malignant
status and poor prognosis in glioma. Tumour Biol. 36:3355–3359.
2015. View Article : Google Scholar : PubMed/NCBI
|
|
16
|
Hu L, Lv QL, Chen SH, Sun B, Qu Q, Cheng
L, Guo Y, Zhou HH and Fan L: Up-regulation of long non-coding RNA
AB073614 predicts a poor prognosis in patients with glioma. Int J
Environ Res Public Health. 13:4332016. View Article : Google Scholar : PubMed/NCBI
|
|
17
|
Harrow J, Frankish A, Gonzalez JM,
Tapanari E, Diekhans M, Kokocinski F, Aken BL, Barrell D, Zadissa
A, Searle S, et al: GENCODE: The reference human genome annotation
for The ENCODE Project. Genome Res. 22:1760–1774. 2012. View Article : Google Scholar : PubMed/NCBI
|
|
18
|
Anders S and Huber W: Differential
expression analysis for sequence count data. Genome Biol.
11:R1062010. View Article : Google Scholar : PubMed/NCBI
|
|
19
|
Robinson MD, McCarthy DJ and Smyth GK:
edgeR: A Bioconductor package for differential expression analysis
of digital gene expression data. Bioinformatics. 26:139–140. 2010.
View Article : Google Scholar : PubMed/NCBI
|
|
20
|
Adler P, Kolde R, Kull M, Tkachenko A,
Peterson H, Reimand J and Vilo J: Mining for coexpression across
hundreds of datasets using novel rank aggregation and visualization
methods. Genome Biol. 10:R1392009. View Article : Google Scholar : PubMed/NCBI
|
|
21
|
Kolde R, Laur S, Adler P and Vilo J:
Robust rank aggregation for gene list integration and
meta-analysis. Bioinformatics. 28:573–580. 2012. View Article : Google Scholar : PubMed/NCBI
|
|
22
|
Franceschini A, Szklarczyk D, Frankild S,
Kuhn M, Simonovic M, Roth A, Lin J, Minguez P, Bork P, von Mering
C, et al: STRING v9.1: Protein-protein interaction networks, with
increased coverage and integration. Nucleic Acids Res.
41:D808–D815. 2013. View Article : Google Scholar : PubMed/NCBI
|
|
23
|
Su G, Morris JH, Demchak B and Bader GD:
Biological network exploration with Cytoscape 3. Curr Protoc
Bioinformatics. 47(8.13.11)–24. 2014.PubMed/NCBI
|
|
24
|
da Huang W, Sherman BT and Lempicki RA:
Systematic and integrative analysis of large gene lists using DAVID
bioinformatics resources. Nat Prot. 4:44–57. 2009. View Article : Google Scholar
|
|
25
|
Schroeder A, Heller DA, Winslow MM,
Dahlman JE, Pratt GW, Langer R, Jacks T and Anderson DG: Treating
metastatic cancer with nanotechnology. Nat Rev Cancer. 12:39–50.
2011. View
Article : Google Scholar : PubMed/NCBI
|
|
26
|
Fife CM, McCarroll JA and Kavallaris M:
Movers and shakers: Cell cytoskeleton in cancer metastasis. Br J
Pharmacol. 171:5507–5523. 2014. View Article : Google Scholar : PubMed/NCBI
|
|
27
|
Fujimura A, Michiue H, Cheng Y, Uneda A,
Tani Y, Nishiki T, Ichikawa T, Wei FY, Tomizawa K and Matsui H:
Cyclin G2 promotes hypoxia-driven local invasion of glioblastoma by
orchestrating cytoskeletal dynamics. Neoplasia. 15:1272–1281. 2013.
View Article : Google Scholar : PubMed/NCBI
|
|
28
|
Zheng PP, Sieuwerts AM, Luider TM, van der
Weiden M, Sillevis-Smitt PA and Kros JM: Differential expression of
splicing variants of the human caldesmon gene (CALD1) in
glioma neovascularization versus normal brain microvasculature. Am
J Pathol. 164:2217–2228. 2004. View Article : Google Scholar : PubMed/NCBI
|
|
29
|
Cardama GA, Gonzalez N, Ciarlantini M,
Gandolfi Donadío L, Comin MJ, Alonso DF, Menna PL and Gomez DE:
Proapoptotic and antiinvasive activity of Rac1 small molecule
inhibitors on malignant glioma cells. Onco Targets Ther.
7:2021–2033. 2014.PubMed/NCBI
|
|
30
|
Han J, Liu S, Sun Z, Zhang Y, Zhang F,
Zhang C, Shang D, Yang H, Su F, Xu Y, et al: LncRNAs2Pathways:
Identifying the pathways influenced by a set of lncRNAs of interest
based on a global network propagation method. Sci Rep. 7:465662017.
View Article : Google Scholar : PubMed/NCBI
|
|
31
|
Han MZ, Huang B, Chen AJ, Zhang X, Xu R,
Wang J and Li XG: High expression of RAB43 predicts poor prognosis
and is associated with epithelial-mesenchymal transition in
gliomas. Oncol Rep. 37:903–912. 2017. View Article : Google Scholar : PubMed/NCBI
|
|
32
|
Shan S, Hui G, Hou F, Shi H, Zhou G, Yan
H, Wang L and Liu J: Expression of metastasis-associated protein 3
in human brain glioma related to tumor prognosis. Neurol Sci.
36:1799–1804. 2015. View Article : Google Scholar : PubMed/NCBI
|
|
33
|
Chen CS, Alonso JL, Ostuni E, Whitesides
GM and Ingber DE: Cell shape provides global control of focal
adhesion assembly. Biochem Biophys Res Commun. 307:355–361. 2003.
View Article : Google Scholar : PubMed/NCBI
|
|
34
|
Wehrle-Haller B: Structure and function of
focal adhesions. Curr Opin Cell Biol. 24:116–124. 2012. View Article : Google Scholar : PubMed/NCBI
|
|
35
|
Yue J, Xie M, Gou X, Lee P, Schneider MD
and Wu X: Microtubules regulate focal adhesion dynamics through
MAP4K4. Dev Cell. 31:572–585. 2014. View Article : Google Scholar : PubMed/NCBI
|
|
36
|
Park CC, Zhang H, Pallavicini M, Gray JW,
Baehner F, Park CJ and Bissell MJ: Beta1 integrin inhibitory
antibody induces apoptosis of breast cancer cells, inhibits growth,
and distinguishes malignant from normal phenotype in three
dimensional cultures and in vivo. Cancer Res. 66:1526–1535. 2006.
View Article : Google Scholar : PubMed/NCBI
|
|
37
|
Eke I, Deuse Y, Hehlgans S, Gurtner K,
Krause M, Baumann M, Shevchenko A, Sandfort V and Cordes N:
β1Integrin/FAK/cortactin signaling is essential for
human head and neck cancer resistance to radiotherapy. J Clin
Invest. 122:1529–1540. 2012. View Article : Google Scholar : PubMed/NCBI
|
|
38
|
Shimizu T, Kurozumi K, Ishida J, Ichikawa
T and Date I: Adhesion molecules and the extracellular matrix as
drug targets for glioma. Brain Tumor Pathol. 33:97–106. 2016.
View Article : Google Scholar : PubMed/NCBI
|
|
39
|
Nicolas CS, Amici M, Bortolotto ZA,
Doherty A, Csaba Z, Fafouri A, Dournaud P, Gressens P, Collingridge
GL, et al: The role of JAK-STAT signaling within the CNS. JAKSTAT.
2:e229252013.PubMed/NCBI
|
|
40
|
Gu J, Li G, Sun T, Su Y, Zhang X, Shen J,
Tian Z and Zhang J: Blockage of the STAT3 signaling pathway with a
decoy oligonucleotide suppresses growth of human malignant glioma
cells. J Neurooncol. 89:9–17. 2008. View Article : Google Scholar : PubMed/NCBI
|
|
41
|
Woodings JA, Sharp SJ and Machesky LM:
MIM-B, a putative metastasis suppressor protein, binds to actin and
to protein tyrosine phosphatase delta. Biochem J. 371:463–471.
2003. View Article : Google Scholar : PubMed/NCBI
|
|
42
|
Lin Q, Tan HT, Lim TK, Khoo A, Lim KH and
Chung MC: iTRAQ analysis of colorectal cancer cell lines suggests
Drebrin (DBN1) is overexpressed during liver metastasis.
Proteomics. 14:1434–1443. 2014. View Article : Google Scholar : PubMed/NCBI
|
|
43
|
Wang X, Hu G, Betts C, Harmon EY, Keller
RS, Van De Water L and Zhou J: Transforming growth
factor-β1-induced transcript 1 protein, a novel marker for smooth
muscle contractile phenotype, is regulated by serum response
factor/myocardin protein. J Biol Chem. 286:41589–41599. 2011.
View Article : Google Scholar : PubMed/NCBI
|
|
44
|
Liu Y, Hu H, Wang K, Zhang C, Wang Y, Yao
K, Yang P, Han L, Kang C, Zhang W and Jiang T: Multidimensional
analysis of gene expression reveals TGFB1I1-induced EMT contributes
to malignant progression of astrocytomas. Oncotarget.
5:12593–12606. 2014.PubMed/NCBI
|
|
45
|
Alqudah MA, Agarwal S, Al-Keilani MS,
Sibenaller ZA, Ryken TC and Assem M: NOTCH3 is a prognostic factor
that promotes glioma cell proliferation, migration and invasion via
activation of CCND1 and EGFR. PLoS One. 8:e772992013. View Article : Google Scholar : PubMed/NCBI
|