Introduction
Ovarian cancer is the sixth most frequent cancer
worldwide (1). It is a major cause
of cancer-related deaths among women. Based on global
epidemiological data in 2008, 225,500 women were estimated to be
diagnosed with ovarian cancer and 140,200 succumbed to the disease
(2). In addition, the majority
(>75%) of cases were in advanced stages requiring surgery and
platinum-based chemotherapy. Although the standard treatment
produces a high response rate of 40–60%, the 5-year survival rate
is relatively poor (<25%) and recurrence occurs in >90% of
patients after 18 months (3,4).
Despite advancements in surgical and chemotherapeutic options,
treatment of recurrent ovarian cancer is still a challenge.
A better understanding of the molecular mechanisms
of ovarian cancer could help to develop more effective targeted
therapies that contribute to improved prognosis. Upregulation of
cluster of differentiation 44 (CD44) plays an important role in
metastasis, recurrence, and drug resistance of ovarian cancer.
Thus, CD44 is a potential target for prevention of recurrence in
ovarian cancer (5). Human
epididymis protein 4 (HE4) has been suggested as a serum biomarker
for prognosis of epithelial ovarian cancer. Moreover, HE4 better
predicts recurrence than the common marker carbohydrate antigen 125
(CA125) (6). Increased
platelet-derived growth factor receptor-beta (PDGFR-β) and vascular
endothelial growth factor receptor-2 (VEGFR-2) protein levels have
been revealed to be associated with resistance to platinum-based
chemotherapy and poorer outcome of ovarian cancer patients
(7).
MicroRNAs (miRNAs/miRs) also play significant roles
in the regulation of the disease recurrence. Loss of miR-200 family
members has been revealed to be associated with relapse from early
to advanced stages of epithelial ovarian cancer (8), suggesting that the expression of these
miRNAs could be used as a target for prediction of recurrence.
Moreover, miR-200 overexpression has been revealed to correspond
with an advanced stage of ovarian cancer (9). Long non-coding RNAs (lncRNAs) are
non-protein-coding RNA transcripts that control gene/miRNA
expression and protein functions (10), which have been reported to be
aberrantly expressed in ovarian carcinoma (11). LncRNAs also act as competing
endogenous RNAs (ceRNAs) in the regulation of miRNA expression.
Therefore, there is often a reverse expression between them
(12). Recently, a study identified
a six-lncRNA signature (RUNX1-IT1, MALAT1, H19, HOTAIRM1,
LOC100190986 and AL132709.8) that was correlated with the
recurrence of ovarian cancer (13).
The connection between lncRNAs with mRNAs or miRNAs
in ovarian cancer is unclear. By constructing a functional
lncRNA-mRNA co-expression network, Guo et al identified two
immune-related lncRNA biomarkers (RP11-284N8.3.1 and AC104699.1.1)
in the progression of malignant ovarian cancer (14). Although the biomarkers were reported
to have crucial prognostic value on survival prediction at
different stages of cancer, recurrence of the disease was not
elucidated. Based on the ‘ceRNA hypothesis’, lncRNA-associated
ceRNA networks were identified and ten lncRNA ceRNAs were proposed
as potential candidates for ovarian cancer at different stages
(15). In that study,
miRNA-mediated ceRNA crosstalk between lncRNAs and mRNAs was
evident but no information pertaining to recurrence was
provided.
To provide more clarity concerning recurrence, we
searched RNA-sequencing (RNA-seq) data in The Cancer Genome Atlas
(TCGA) database and the Gene Expression Omnibus (GEO) database,
which contain ovarian cancer samples with information about
recurrence. We also explored potential regulations among lncRNAs,
miRNAs, and mRNAs by establishing an integrated ceRNA network. A
support vector machine (SVM) classifier with candidate feature
genes was constructed to distinguish recurrent with non-recurrent
ovarian cancer. These comprehensive analyses aimed to reveal novel
lncRNA/miRNA/mRNA biomarkers of recurrent ovarian cancer and
uncover the underlying regulatory mechanisms.
Materials and methods
Data resource and pretreatment
Data from TCGA database
The mRNA and miRNA expression profiles relevant to
ovarian cancer were searched in the TCGA (https://gdc-portal.nci.nih.gov/) database. A total of
419 mRNA-sequencing profiles and 493 miRNA-sequencing profiles were
obtained. These profiles were matched according to barcode numbers.
Finally, 391 profiles with matched mRNA-sequencing and
miRNA-sequencing data were generated. According to the clinical
information, these 391 RNA-seq profiles were divided into a
recurrence (n=220) and non-recurrence (n=171) group. The sequencing
platform of all the samples was the HiSeq 2000 system (Illumina,
Inc., San Diego, CA, USA).
All downloaded RNA-seq data were as files in the
*.gene.quantification.txt format. Reads per kilobase of transcript
per million mapped read (RPKM) values of expression of these RNAs
were obtained. Since log2 (x+1) transformation had
previously been performed, these data could be directly used for
analysis in the present study.
Data from GEO database
The mRNA microarray data (accession no. GSE17260)
was downloaded from the GEO database (http://www.ncbi.nlm.nih.gov/geo). This dataset
relevant to ovarian cancer consisted of 110 samples. These were
also classified into a recurrence group (n=76) and non-recurrence
group (n=34). The platform of the microarray data was the 014850
GPL6480 (Agilent Technologies, Inc., Santa Clara, CA, USA).
After downloading raw data from the GEO database,
probe values corresponded to gene expressions based on annotation
files. If more than one probe corresponded to the same gene, their
values were averaged to calculate this gene expression. The
expression of the genes were log2 transformed to reach
an approximately normal distribution. Normalization was performed
with the median method implemented in the Linear Models for
Microarray Analysis (limma, http://www.bioconductor.org/packages/release/bioc/html/limma.html)
package of R (16).
Analysis of the RNA-seq data
The mRNAs, miRNAs, and lncRNAs in 391 RNA-seq
profiles downloaded from the TCGA database were identified
according to 2,775 lncRNAs and 19,004 protein-coding gene
annotation information recorded in the HUGO Gene Nomenclature
Committee (HGNC, http://www.genenames.org/) (17). Low abundant mRNAs, miRNAs, and
lncRNAs with an expressive abundance of <1, <5, and <5,
respectively, were filtered out.
Differentially expressed genes/miRNAs (DEGs/DEMs)
between recurrent and non-recurrent samples were selected using the
edgeR package (version 3.0.1), a software in Bioconductor that
adopts the over-dispersed Poisson model to differentiate biological
and technical sources of variation (18). Notably, the edgeR package uses an
empirical Bayes approach, which reduces overdispersion across
different transcript samples and enhances analysis reliability
(18). Α false discovery rate (FDR)
<0.05 and |fold change (FC)|>1.5 were two criteria for
DEG/DEM selection.
Relationships between DEGs and
clinical features
All the clinical feature information of samples in
the datasets was downloaded. The samples were divided into
different groups based on the following dichotomous variables: Age
at diagnosis (≥60 vs. <60 years), clinical stage (III+IV vs.
I+II), neoplasm histological grade (G3+G4 vs. G1+G2), lymphatic
invasion (Yes vs. No), and venous invasion (Yes vs. No). The
expression of three types of RNAs (mRNAs, miRNAs, and lncRNAs)
associated with different clinical features were selected using the
edgeR package. Likewise, the cut-off values were FDR <0.05 and
|FC|>1.5.
Selection of prognostic mRNAs, miRNAs,
and lncRNAs
The expression of DEG/DEM/differentially expressed
lncRNAs (DEL) between recurrent and non-recurrent samples were
extracted, accompanied with the survival information in each
sample. The single factor Cox analysis using the survfit function
implemented in the R survival package was utilized to perform
prognostic analysis (19). The
mRNAs, miRNAs, and lncRNAs with a threshold P-value <0.05 were
considered as significantly related to the prognosis. The survival
result was expressed as a Kaplan-Meier (KM) curve.
Identification of key feature genes
relevant to recurrence
Construction of protein-protein
interaction network of DEGs
Relationships of the DEGs were explored by
integrating human gene interactions in three protein databases,
BioGRID (version 3.4.140, http://thebiogrid.org/), HPRD (release 9.0, http://www.hprd.org/), and DIP (http://dip.doe-mbi.ucla.edu/). Overlapping
interactions in the three databases were extracted to establish the
protein-protein interaction (PPI) network of the DEGs. Cytoscape
(http://cytoscape.org/) software was used to
visualize the network.
Optimization of feature genes
dependent on network betweenness centrality
After the PPI network of the DEGs was established,
its topological structure was analyzed according to the node's
degree and betweenness centrality (BC) algorithm, using the
following formula:
CB(v)=∑t≠v≠u∈Vσst(v)σst
where σst denotes the shortest path from
s to t, σst (v) stands for the node numbers (v) from s
to t. BC values are 0 to 1, and the closeness of a node's value to
‘1’ is strongly associated with the importance of the node. Based
on this definition, the nodes whose BC values were ranked in the
top 100 were selected as candidate feature genes.
Selection of optimal feature gene
set
Following the identification of candidate DEGs
between recurrent and non-recurrent samples, the unsupervised
clustering method was used to validate the efficacy of the
classification using this feature gene set. In brief, the top 100
candidate feature DEGs underwent the optimal feature combination
selection with the recursive feature elimination (RFE) algorithm
(20). Genes in the most optimal
feature gene set were supposed to be representative, prominent and
could be used for clinical diagnosis.
Construction of a support vector
machine classifier utilizing the feature gene sets
The significant feature gene set was selected by
optimizing the feature of genes. The SVM classifier model was
constructed to classify and distinguish the samples according to
the expression of these feature genes in each sample (21), which were defined as an eigenvalue
of these feature genes. By evaluating the eigenvalue of these
feature genes in each sample, the probability of each sample in a
certain classification was determined. In this way, the recurrent
and non-recurrent ovarian cancer samples were predicted.
Independent validation and assessment
of SVM classifier performance
To confirm the robustness and reproducibility of
this SVM classifier, the dataset of GSE17260 was used as the
validation set. Performance of the SVM classifier was evaluated by
assessing the following indicators: Sensitivity, specificity,
positive predictive value (PPV), negative predictive value (NPV),
and area under the curve (AUC) of the receiver operating
characteristic (ROC) curve.
Prediction of lncRNA/miRNA
network
By integrating miRNAs with lncRNAs information in
miRcode (version 11.0, http://www.mircode.org/) (22) and starBase databases (version 2.0)
(23), potential lncRNA/miRNA
interactions were predicted for DEMs and DELs.
Target prediction of miRNAs
The miRTarBase database (http://mirtarbase.mbc.nctu.edu.tw) provides the newest
and the most comprehensive miRNA-target interactions that have been
experimentally validated (24,25).
In the present study, we used the latest version of the database in
2016 (release 6.0) to search for potential target genes of the
miRNAs. Combining these target genes with DEGs in the PPI network,
a miRNA-target network of the DEGs was constructed and visualized
using Cytoscape software.
Construction of ceRNA regulatory
network
Integrating the lncRNA/miRNA network and
miRNA-target network, a comprehensive ceRNA network, termed the
lncRNA/miRNA/mRNA regulatory network, was constructed.
Functional and pathway enrichment
analysis of genes in the ceRNA network
After establishing the ceRNA network, genes in this
network underwent functional and pathway enrichment analyses,
integrating gene information in the Gene Ontology (GO; http://www.geneontology.org/) and Kyoto Encyclopedia
of Genes and Genome (KEGG; http://www.genome.jp/kegg/pathway.html) databases with
the threshold as P-value <0.05. Fisher's exact test was used, as
indicated in the following formula:
p=1-∑i=0x-1(Mi)(N-MK-i)(NK)
where N denotes total gene numbers in the whole
genome, M represents gene numbers in the pathway, K stands for the
number of DEGs, and p indicates the possibility that at least ‘x’
of ‘K’ DEGs were enriched in a specific function or pathway
category.
Results
Ovarian cancer recurrence-related
mRNAs, miRNAs and lncRNAs
According to annotation information recorded in the
HGNC, a set of 17,895 mRNAs that encodes proteins, 1,046 miRNAs,
and 811 lncRNAs were identified in the 391 RNA-seq profiles
downloaded from the TCGA database. Among these identified RNAs,
those that had low abundance were filtered out. Cut-offs for low
abundant mRNAs, miRNAs, and lncRNAs were expressed with an
abundance <1, <5 and <5, respectively. After removing
these low abundant RNAs, a group of 11,420 mRNAs, 169 miRNAs, and
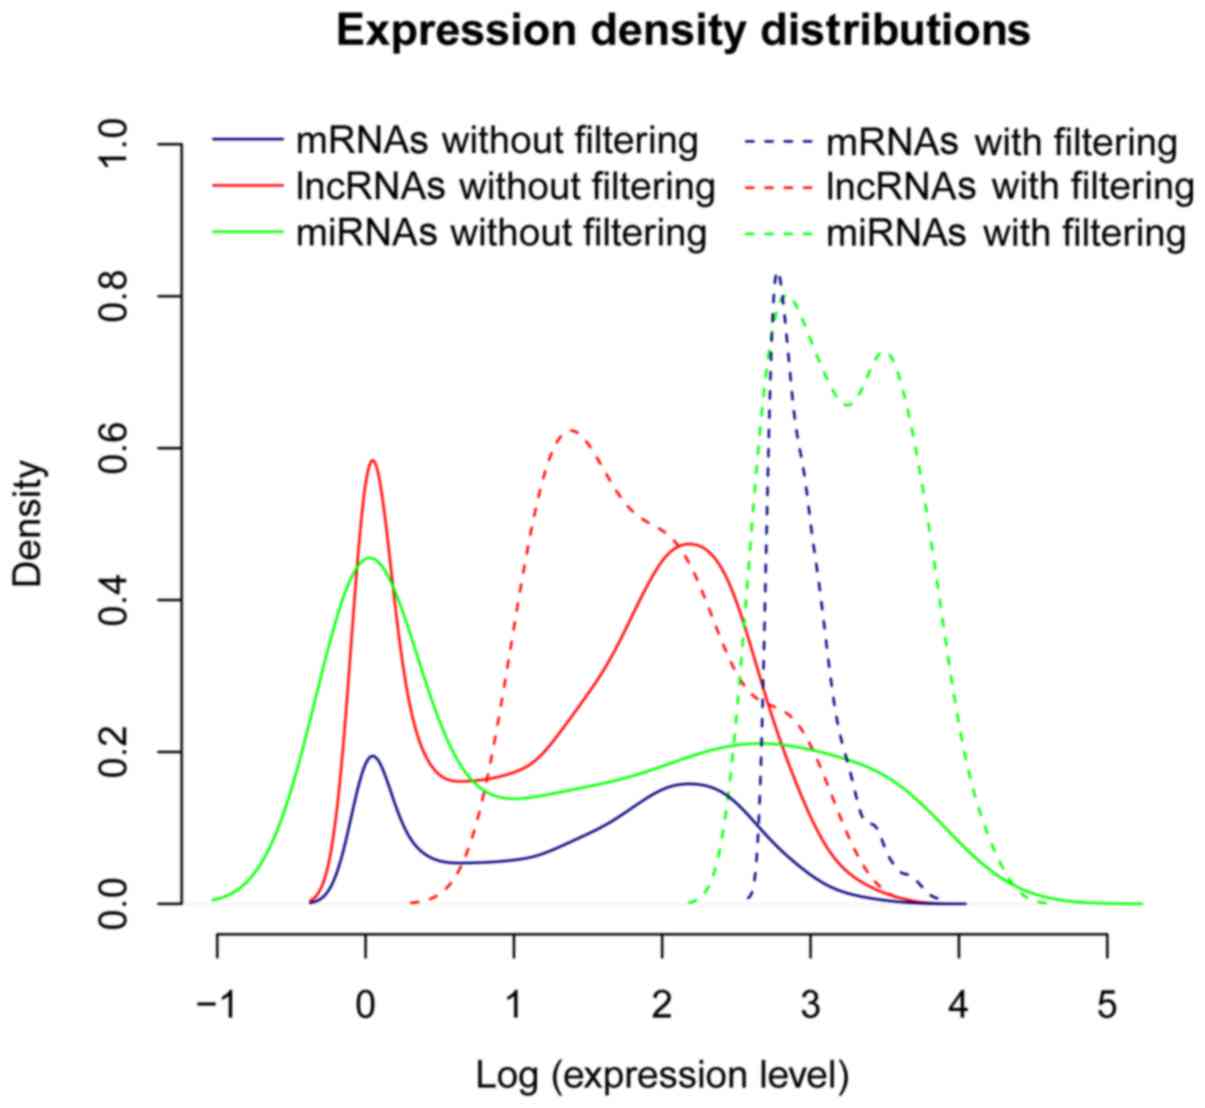
398 lncRNAs remained. The expression distributions revealed that
the peak values of expression density for the mRNAs, miRNAs and
lncRNAs were evidently elevated after eliminating the low abundant
ones (Fig. 1). Among these three
types of RNAs, lncRNAs had an apparently lower expression density
than the others.
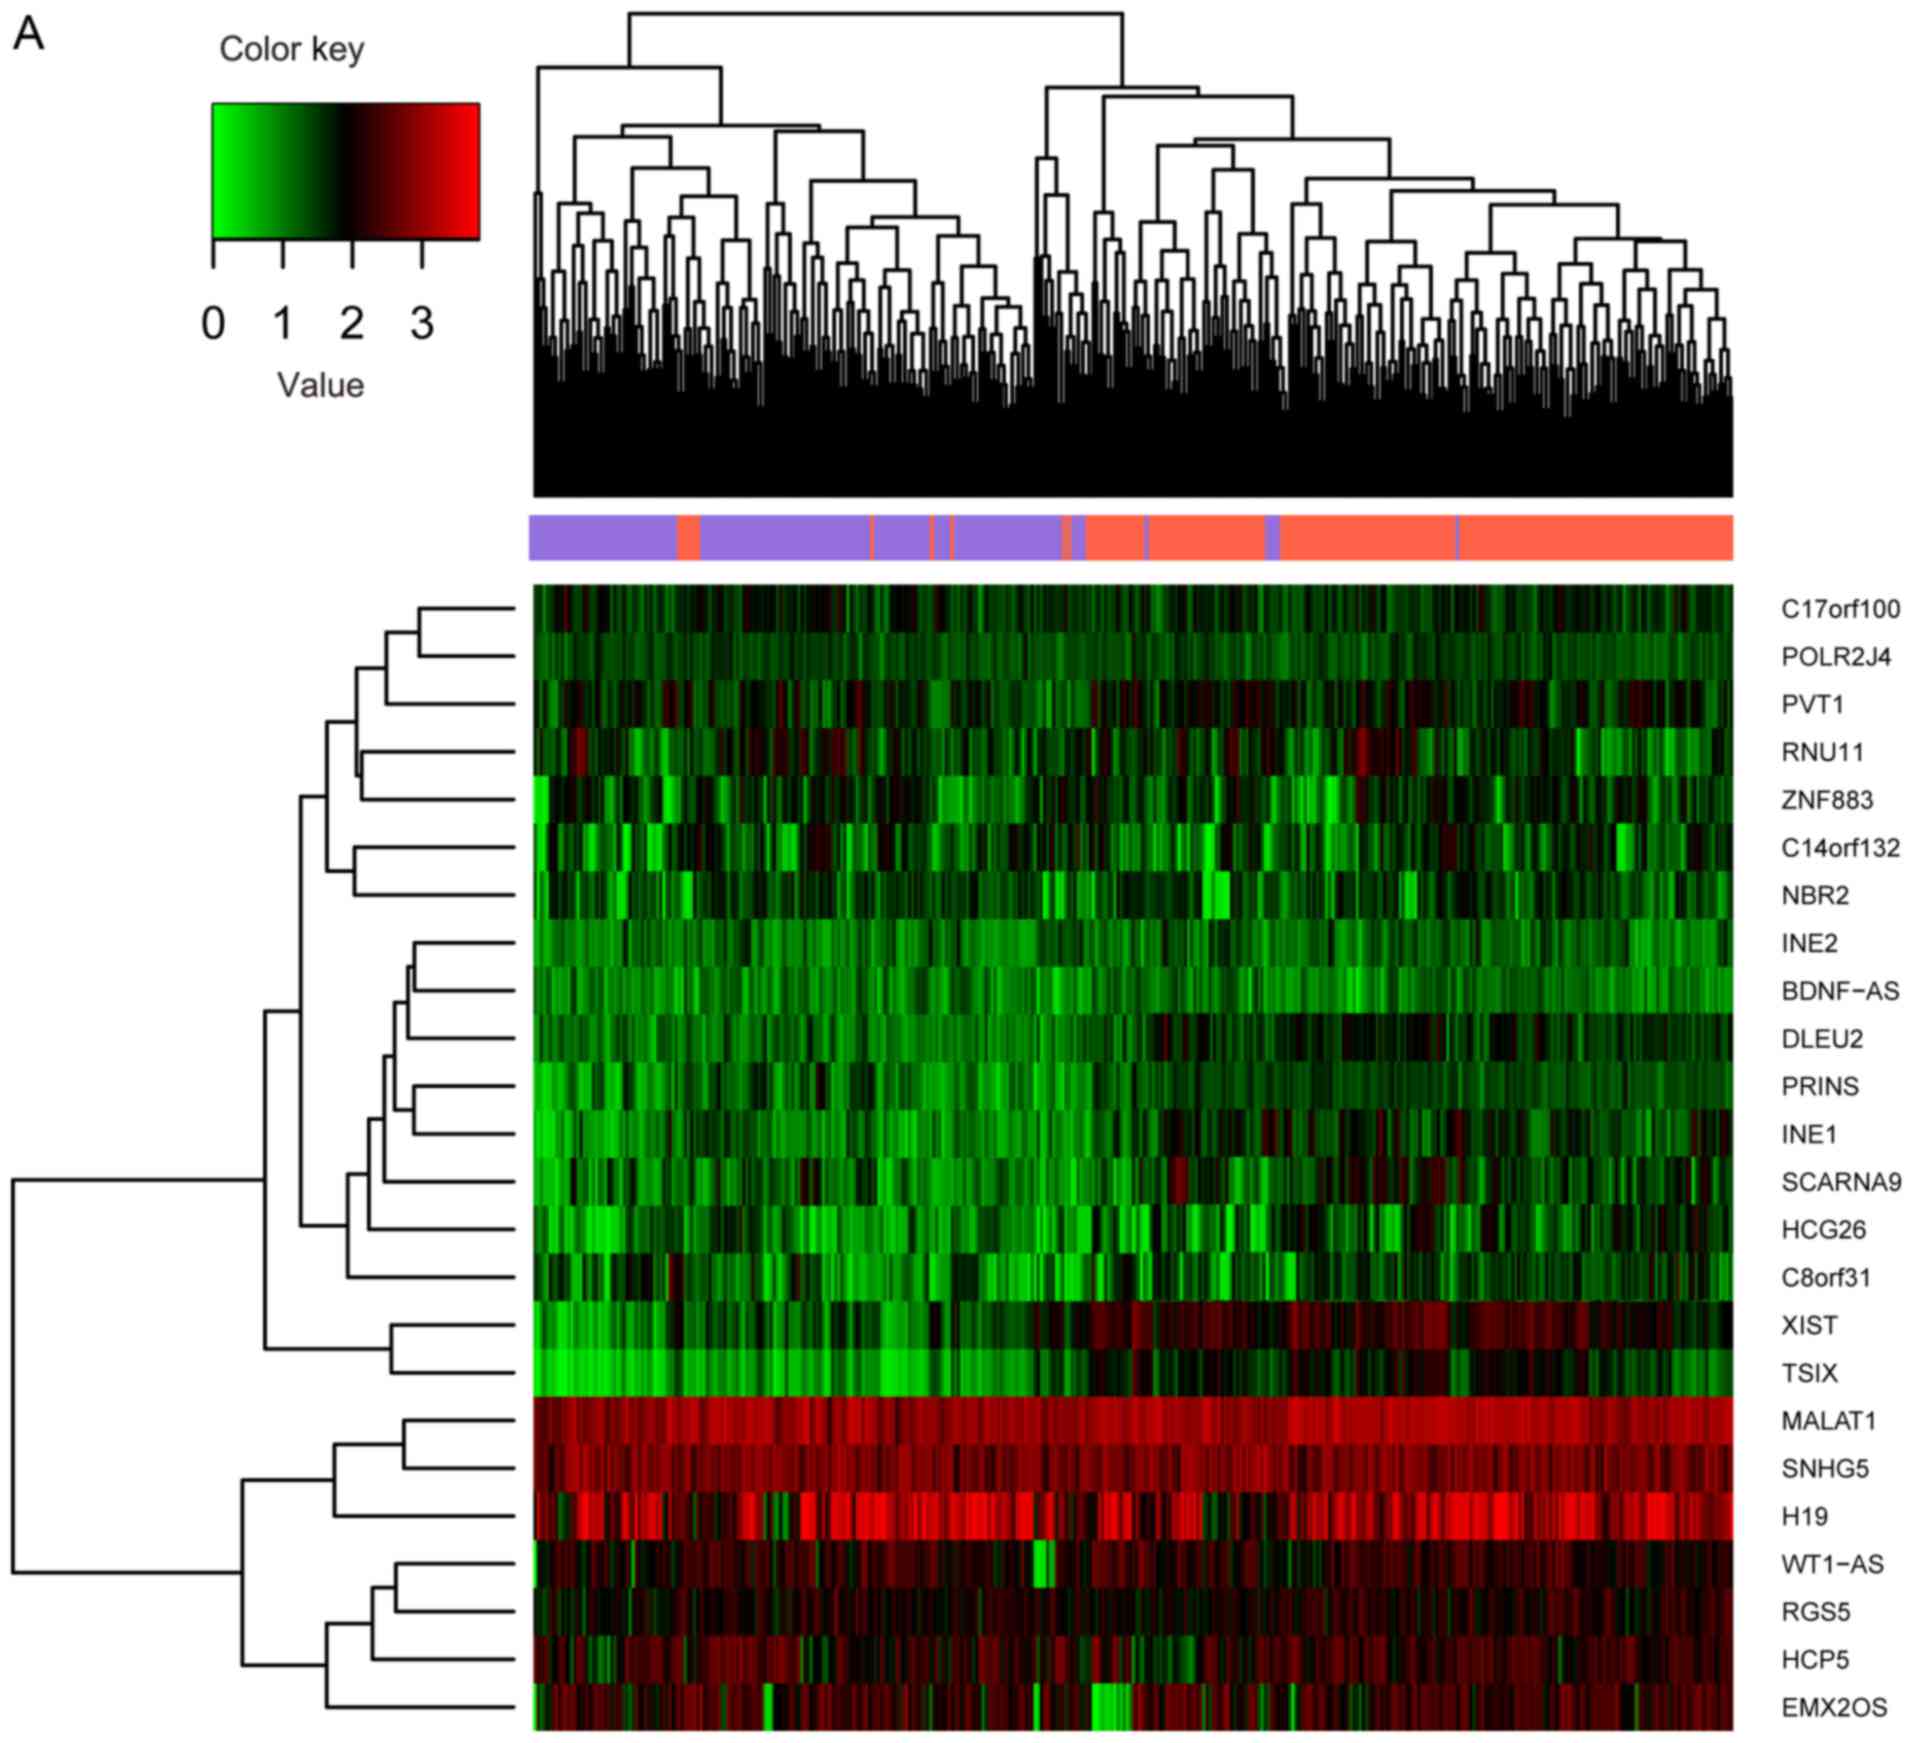
The 391 RNA-seq profiles were divided into recurrent
(n=220) and non-recurrent (n=171) samples based on the clinical
information. A total of 826 significant DEGs, 38 DEMs and 24 DELs
between recurrent (n=220) and non-recurrent (n=171) samples were
selected through differential analysis. Expression differences of
these RNAs in different samples are displayed in the heat map of
the clustering analysis (Fig.
2A-C). The three types of RNAs could clearly distinguish the
recurrent ovarian cancer from the non-recurrent.
Association between recurrence-related
genes and clinical features
Using the five dichotomous variables (age, clinical
stage, neoplasm histological grade, lymphatic invasion, and venous
invasion) correlated with clinical information, the samples were
classified into different groups. Upregulated or downregulated RNAs
(mRNAs, miRNAs, and lncRNAs) between different groups within each
comparison were selected (data not shown). Clinical features that
the recurrence-related genes could reflect were revealed.
Prognosis-related mRNAs, miRNAs, and
lncRNAs
Based on the expression of the DEGs, DEMs, and DELs,
and the survival analysis (e.g. overall survival time and survival
condition) of these RNAs, prognostic mRNAs, miRNAs, and lncRNAs
were identified (Table I). Three
upregulated lncRNAs were associated with prognosis including NBR2
(P=0.003), ZNF883 (P=0.016) and WT1-AS (P=0.014). has-miR-1974
(P=0.004), hsa-miR-155 (P=0.005), hsa-mir-1266 (P=0.006),
hsa-mir-1306 (P=0.009), hsa-mir-935 (P=0.017) and hsa-mir-375
(P=0.028) were related to prognosis. A total of 58 DEGs
(P<0.005) were significantly associated with prognosis.
 | Table I.mRNAs, miRNAs and lncRNAs
significantly related to prognosis. |
Table I.
mRNAs, miRNAs and lncRNAs
significantly related to prognosis.
| RNA | Type | Coef | Exp (coef) | Se (coef) | Z score | P-value | Regulation |
|---|
| NBR2 | lncRNA | −0.193 | 0.825 | 0.102 | −1.880 | 0.003 | Upregulated |
| WT1-AS | lncRNA | −0.070 | 0.932 | 0.064 | −1.100 | 0.014 | Upregulated |
| ZNF883 | lncRNA | 0.191 | 1.210 | 0.080 | 2.400 | 0.016 | Upregulated |
| hsa-miR-1974 | miRNA | −0.076 | 0.927 | 0.042 | −1.810 | 0.004 | Downregulated |
| hsa-miR-155 | miRNA | −0.087 | 0.917 | 0.052 | −1.680 | 0.005 | Upregulated |
| hsa-miR-1266 | miRNA | 0.098 | 1.100 | 0.063 | 1.540 | 0.006 | Downregulated |
| hsa-miR-1306 | miRNA | −0.091 | 0.913 | 0.066 | −1.370 | 0.009 | Upregulated |
| hsa-miR-935 | miRNA | 0.041 | 1.040 | 0.043 | 0.965 | 0.017 | Upregulated |
| hsa-miR-375 | miRNA | −0.018 | 0.982 | 0.031 | −0.582 | 0.028 | Downregulated |
| VEPH1 | mRNA | 0.341 | 1.410 | 0.108 | 3.160 | 0.002 | Downregulated |
| TSHZ3 | mRNA | −0.162 | 0.850 | 0.091 | −1.790 | 0.004 | Upregulated |
| SORBS2 | mRNA | 0.159 | 1.170 | 0.094 | 1.680 | 0.005 | Upregulated |
| NOTUM | mRNA | −0.080 | 0.923 | 0.051 | −1.590 | 0.006 | Downregulated |
| CASC1 | mRNA | 0.116 | 1.120 | 0.075 | 1.560 | 0.006 | Upregulated |
| CCDC65 | mRNA | 0.114 | 1.120 | 0.074 | 1.540 | 0.006 | Upregulated |
| ALDH1A2 | mRNA | −0.063 | 0.939 | 0.043 | −1.480 | 0.007 | Downregulated |
| REM1 | mRNA | −0.109 | 0.897 | 0.075 | −1.450 | 0.008 | Downregulated |
| PHOSPHO1 | mRNA | 0.073 | 1.080 | 0.055 | 1.320 | 0.010 | Downregulated |
| TBX3 | mRNA | −0.097 | 0.908 | 0.073 | −1.320 | 0.010 | Upregulated |
| OXGR1 | mRNA | 0.080 | 1.080 | 0.062 | 1.300 | 0.010 | Upregulated |
| C1orf194 | mRNA | 0.050 | 1.050 | 0.040 | 1.230 | 0.011 | Upregulated |
| INHA | mRNA | 0.098 | 1.100 | 0.082 | 1.190 | 0.012 | Upregulated |
| CLIC6 | mRNA | −0.079 | 0.924 | 0.067 | −1.170 | 0.012 | Upregulated |
| BNC2 | mRNA | 0.124 | 1.130 | 0.107 | 1.160 | 0.013 | Downregulated |
| CST6 | mRNA | −0.080 | 0.923 | 0.070 | −1.150 | 0.013 | Upregulated |
| PLCE1 | mRNA | 0.102 | 1.110 | 0.097 | 1.060 | 0.015 | Upregulated |
| MAT1A | mRNA | −0.080 | 0.923 | 0.078 | −1.020 | 0.016 | Downregulated |
| PHF7 | mRNA | 0.149 | 1.160 | 0.158 | 0.941 | 0.018 | Upregulated |
| HOXA3 | mRNA | −0.054 | 0.948 | 0.059 | −0.911 | 0.018 | Downregulated |
| WDR78 | mRNA | 0.108 | 1.110 | 0.128 | 0.842 | 0.020 | Upregulated |
| ZNF521 | mRNA | −0.052 | 0.949 | 0.062 | −0.847 | 0.020 | Upregulated |
| FAM155B | mRNA | 0.184 | 1.200 | 0.080 | 2.300 | 0.021 | Upregulated |
| SIGLEC14 | mRNA | 0.077 | 1.080 | 0.096 | 0.810 | 0.021 | Downregulated |
| TMEM190 | mRNA | 0.040 | 1.040 | 0.051 | 0.789 | 0.022 | Upregulated |
| LMO3 | mRNA | 0.036 | 1.040 | 0.047 | 0.752 | 0.023 | Downregulated |
| FIGN | mRNA | −0.066 | 0.936 | 0.088 | −0.746 | 0.023 | Downregulated |
| FAM83E | mRNA | 0.047 | 1.050 | 0.063 | 0.741 | 0.023 | Upregulated |
| CLCN5 | mRNA | 0.090 | 1.090 | 0.124 | 0.727 | 0.024 | Downregulated |
| THBS4 | mRNA | −0.048 | 0.953 | 0.067 | −0.721 | 0.024 | Downregulated |
| HOXA5 | mRNA | −0.037 | 0.964 | 0.052 | −0.707 | 0.024 | Downregulated |
| HIST2H2BF | mRNA | 0.066 | 1.070 | 0.099 | 0.668 | 0.025 | Upregulated |
| PRR22 | mRNA | 0.060 | 1.060 | 0.097 | 0.619 | 0.027 | Downregulated |
| KCNH3 | mRNA | 0.036 | 1.040 | 0.062 | 0.575 | 0.029 | Downregulated |
| C16orf74 | mRNA | −0.043 | 0.958 | 0.088 | −0.492 | 0.031 | Upregulated |
| TGFA | mRNA | −0.034 | 0.967 | 0.072 | −0.475 | 0.032 | Upregulated |
| BHLHA15 | mRNA | 0.043 | 1.040 | 0.090 | 0.475 | 0.032 | Downregulated |
| FOXA2 | mRNA | −0.026 | 0.974 | 0.057 | −0.461 | 0.032 | Upregulated |
| NRL | mRNA | 0.093 | 1.100 | 0.204 | 0.456 | 0.033 | Downregulated |
| GEM | mRNA | −0.184 | 0.832 | 0.087 | −2.120 | 0.034 | Upregulated |
| FA2H | mRNA | −0.040 | 0.961 | 0.104 | −0.386 | 0.035 | Upregulated |
| ACAP1 | mRNA | 0.044 | 1.040 | 0.118 | 0.371 | 0.036 | Downregulated |
| SHC2 | mRNA | −0.026 | 0.975 | 0.072 | −0.354 | 0.036 | Upregulated |
| KRT16 | mRNA | 0.018 | 1.020 | 0.051 | 0.355 | 0.036 | Upregulated |
| TTC36 | mRNA | −0.039 | 0.962 | 0.113 | −0.345 | 0.037 | Downregulated |
| RBM11 | mRNA | 0.040 | 1.040 | 0.116 | 0.342 | 0.037 | Downregulated |
| ZNF569 | mRNA | −0.301 | 0.740 | 0.144 | −2.090 | 0.037 | Downregulated |
| LMTK3 | mRNA | 0.168 | 1.180 | 0.081 | 2.080 | 0.037 | Upregulated |
| ADAMDEC1 | mRNA | 0.018 | 1.020 | 0.060 | 0.306 | 0.038 | Downregulated |
| MACROD2 | mRNA | 0.022 | 1.020 | 0.076 | 0.292 | 0.039 | Downregulated |
| ZNF597 | mRNA | 0.031 | 1.030 | 0.102 | 0.298 | 0.039 | Upregulated |
| CD8A | mRNA | 0.018 | 1.020 | 0.071 | 0.249 | 0.040 | Downregulated |
| AGAP2 | mRNA | −0.033 | 0.968 | 0.137 | −0.238 | 0.041 | Downregulated |
| PRG4 | mRNA | 0.009 | 1.010 | 0.090 | 0.102 | 0.046 | Downregulated |
| GAL3ST3 | mRNA | −0.005 | 0.995 | 0.045 | −0.101 | 0.046 | Downregulated |
| CSPG5 | mRNA | −0.008 | 0.992 | 0.087 | −0.095 | 0.046 | Downregulated |
| SLAMF7 | mRNA | −0.004 | 0.996 | 0.057 | −0.078 | 0.047 | Downregulated |
| SP5 | mRNA | −0.002 | 0.998 | 0.052 | −0.043 | 0.049 | Downregulated |
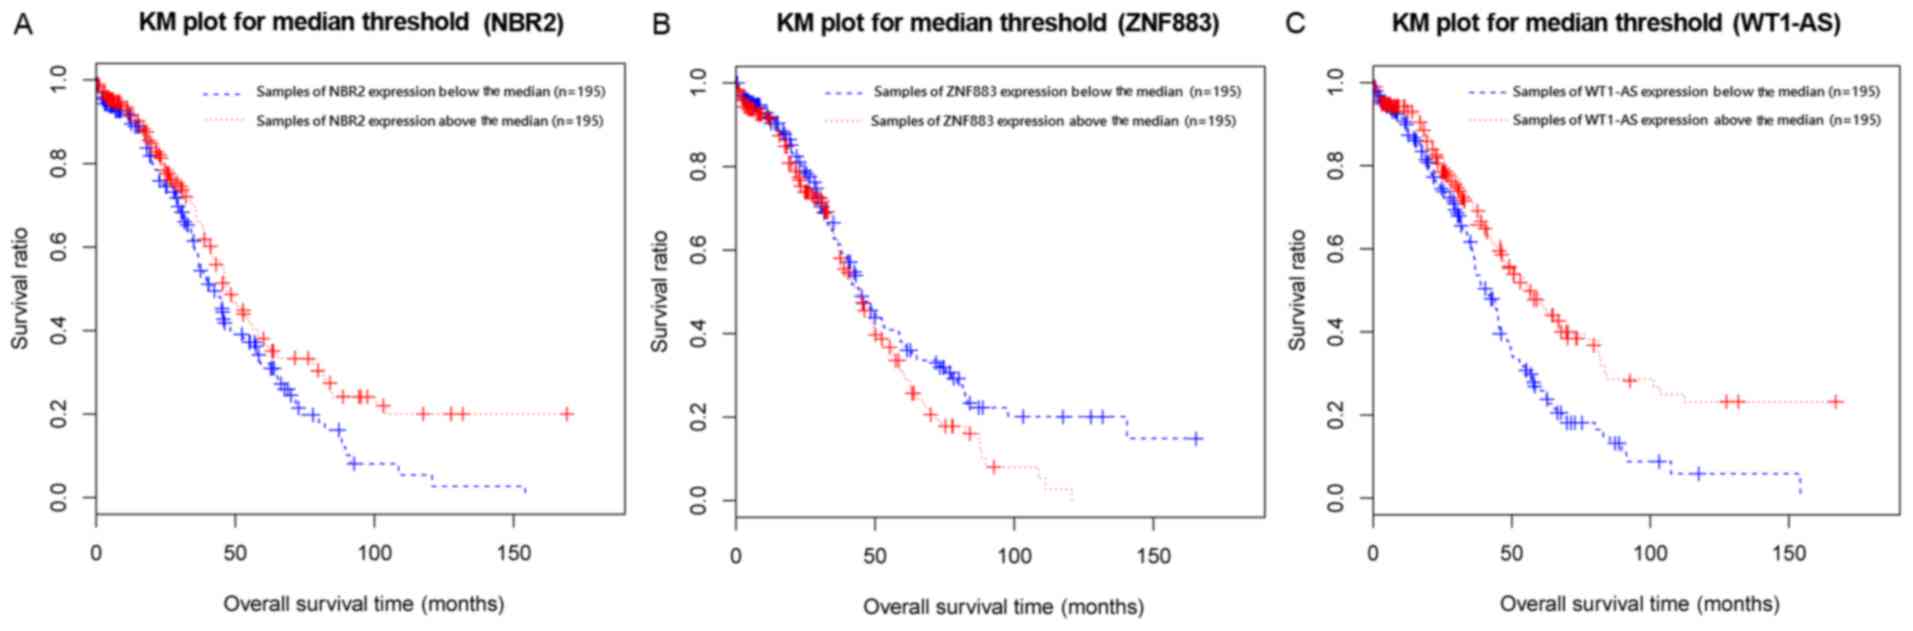
The median expression value of NBR2, ZNF883, or
WT1-AS was used as the cut-off criterion for dividing the samples
into two groups (below the median and above the median) based on
the expression levels of these lncRNAs in the samples. KM survival
analysis indicated the survival ratios of the below median and
above median groups that were separated by the expression levels of
NBR2 (P=0.0417), ZNF883 (P=0.0446), or WT1-AS (P=0.0131) were
significantly different (Fig.
3A-C). This result indicated that these three lncRNAs could be
used as prognostic predictors of recurrent ovarian cancer,
particularly WT1-AS, since it had the lowest P-value.
Features of mRNAs related to
recurrence
PPI network of the DEGs
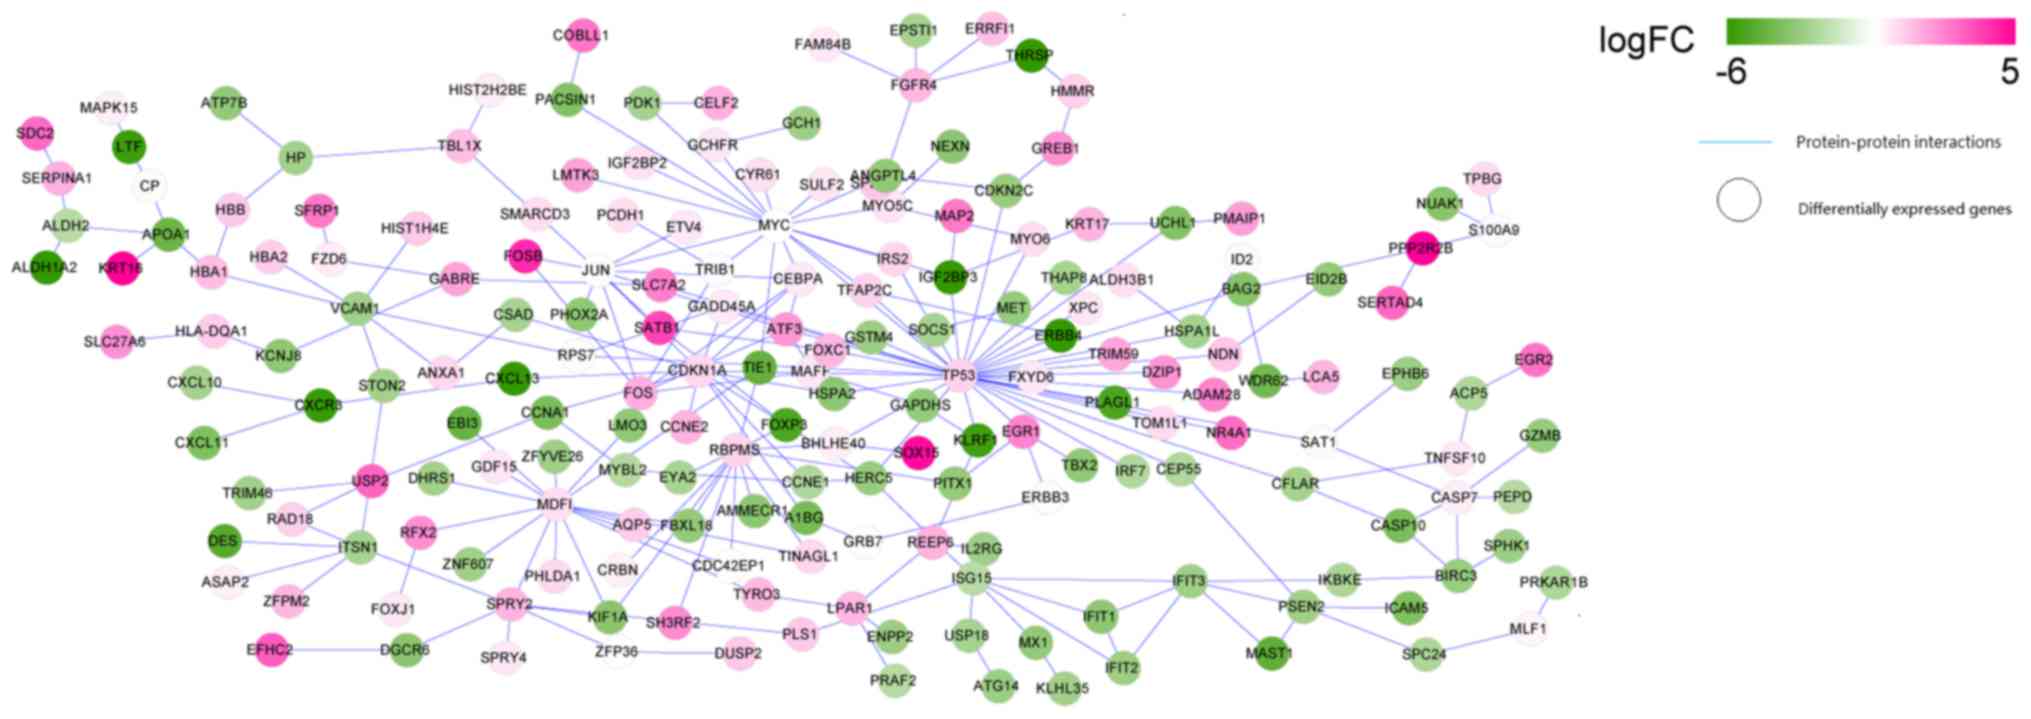
The search of the three protein databases identified
protein interaction information for the DEGs. A total of 169, 221
and 234 protein interactions were identified from BioGRID, HPRD and
DIP databases, respectively. Then, 299 overlapped interactions in
three databases were extracted to establish the PPI network of the
DEGs. As presented in Fig. 4, the
network consisted of 234 nodes (the proteins encoded by the DEGs)
and 299 edges (the protein interactions). Five predominant nodes in
the PPI network were TP53 (degree=35), CDKN1A (degree=20), MYC
(degree=17), MDFI (degree=16), and RBPMS (degree=13).
Verification of the SVM
classifiers
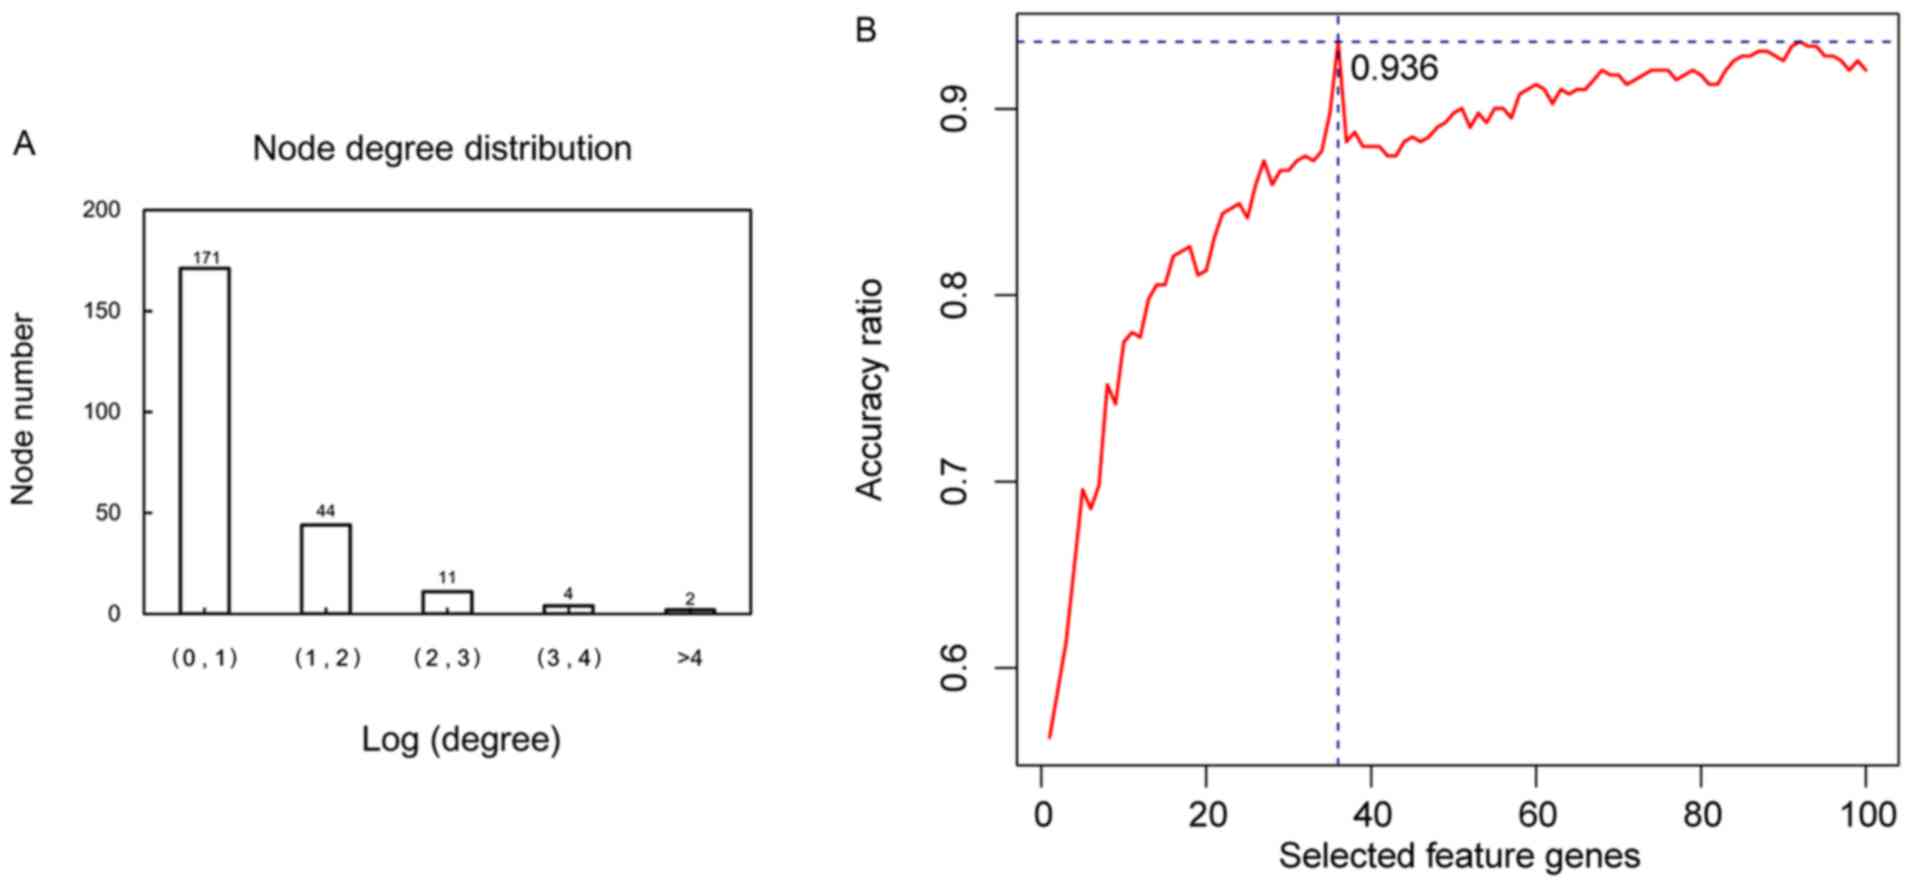
The node degree distribution of the genes in the PPI
network was analyzed (Fig. 5A). The
top 100 gene nodes in the PPI network ranked by their BC values
were selected. The best prediction accuracy was up to 93.6% when
the SVM classifier consisted of 36 specific feature genes (Fig. 5B) using the recursive feature
elimination algorithm. These 36 specific feature genes (e.g. TP53,
MYC, CDKN1A, RBPMS and JUN) are shown in Table II. This gene set was considered the
optimal combination.
| Table II.Gene list of 36 feature genes in the
optimal gene set identified by support vector machine
classifier. |
Table II.
Gene list of 36 feature genes in the
optimal gene set identified by support vector machine
classifier.
| Gene | BC | Degree | logFC | P-value | FDR | Gene | BC | Degree | logFC | P-value | FDR |
|---|
| TP53 | 0.8549 | 36 | 1.1154 | 0.0034 | 0.0261 | GABRE | 0.2513 | 3 | 1.5580 | 0.0039 | 0.0303 |
| LIPH | 0.8000 | 3 | 2.1783 | 0.0035 | 0.0265 | KLRF1 | 0.2485 | 3 | −2.9154 | 0.0022 | 0.0166 |
| TNNT1 | 0.7000 | 2 | 0.8604 | 0.0049 | 0.0380 | SAT1 | 0.2477 | 3 | 0.5964 | 0.0062 | 0.0475 |
| MYC | 0.4611 | 17 | 0.6524 | 0.0064 | 0.0492 | SMARCD3 | 0.2354 | 2 | 0.9899 | 0.0042 | 0.0326 |
| VCAM1 | 0.3527 | 6 | −1.0917 | 0.0054 | 0.0414 | PLS1 | 0.2336 | 2 | 1.1975 | 0.0047 | 0.0364 |
| CDKN1A | 0.3446 | 12 | 1.0392 | 0.0044 | 0.0338 | EGR1 | 0.2312 | 4 | 1.8583 | 0.0005 | 0.0040 |
| RPS7 | 0.3278 | 3 | 0.6217 | 0.0064 | 0.0489 | SPC24 | 0.2207 | 2 | −0.8575 | 0.0061 | 0.0472 |
| HBA1 | 0.3031 | 3 | 1.3074 | 0.0040 | 0.0305 | HP | 0.2148 | 3 | −1.0778 | 0.0048 | 0.0368 |
| TIE1 | 0.3000 | 3 | −2.2494 | 0.0020 | 0.0150 | UCHL1 | 0.2140 | 3 | −1.6059 | 0.0013 | 0.0097 |
| JUN | 0.2881 | 10 | 0.6921 | 0.0057 | 0.0439 | SOCS1 | 0.2133 | 3 | −0.9843 | 0.0057 | 0.0437 |
| RBPMS | 0.2856 | 12 | 1.0742 | 0.0049 | 0.0377 | DGCR6 | 0.2104 | 2 | −1.4870 | 0.0046 | 0.0356 |
| APOA1 | 0.2813 | 4 | −2.0866 | 0.0003 | 0.0025 | FZD6 | 0.2104 | 2 | 0.8516 | 0.0056 | 0.0435 |
| HERC5 | 0.2803 | 4 | −1.2422 | 0.0046 | 0.0353 | RAD18 | 0.2086 | 2 | 1.1321 | 0.0054 | 0.0413 |
| BAG2 | 0.2712 | 3 | −1.5688 | 0.0030 | 0.0231 | HBB | 0.2080 | 2 | 1.1753 | 0.0037 | 0.0286 |
| BHLHE40 | 0.2651 | 3 | 0.8275 | 0.0051 | 0.0389 | SATB1 | 0.2075 | 3 | 2.4843 | 0.0014 | 0.0111 |
| CEP55 | 0.2538 | 2 | −0.8150 | 0.0064 | 0.0493 | FOXC1 | 0.2075 | 2 | 1.3750 | 0.0041 | 0.0314 |
| PSEN2 | 0.2534 | 5 | −1.1137 | 0.0049 | 0.0377 | PITX1 | 0.2055 | 2 | −1.3033 | 0.0045 | 0.0343 |
| ANGPTL4 | 0.2518 | 3 | −1.3853 | 0.0039 | 0.0298 | ANXA1 | 0.2047 | 2 | 1.0398 | 0.0030 | 0.0233 |
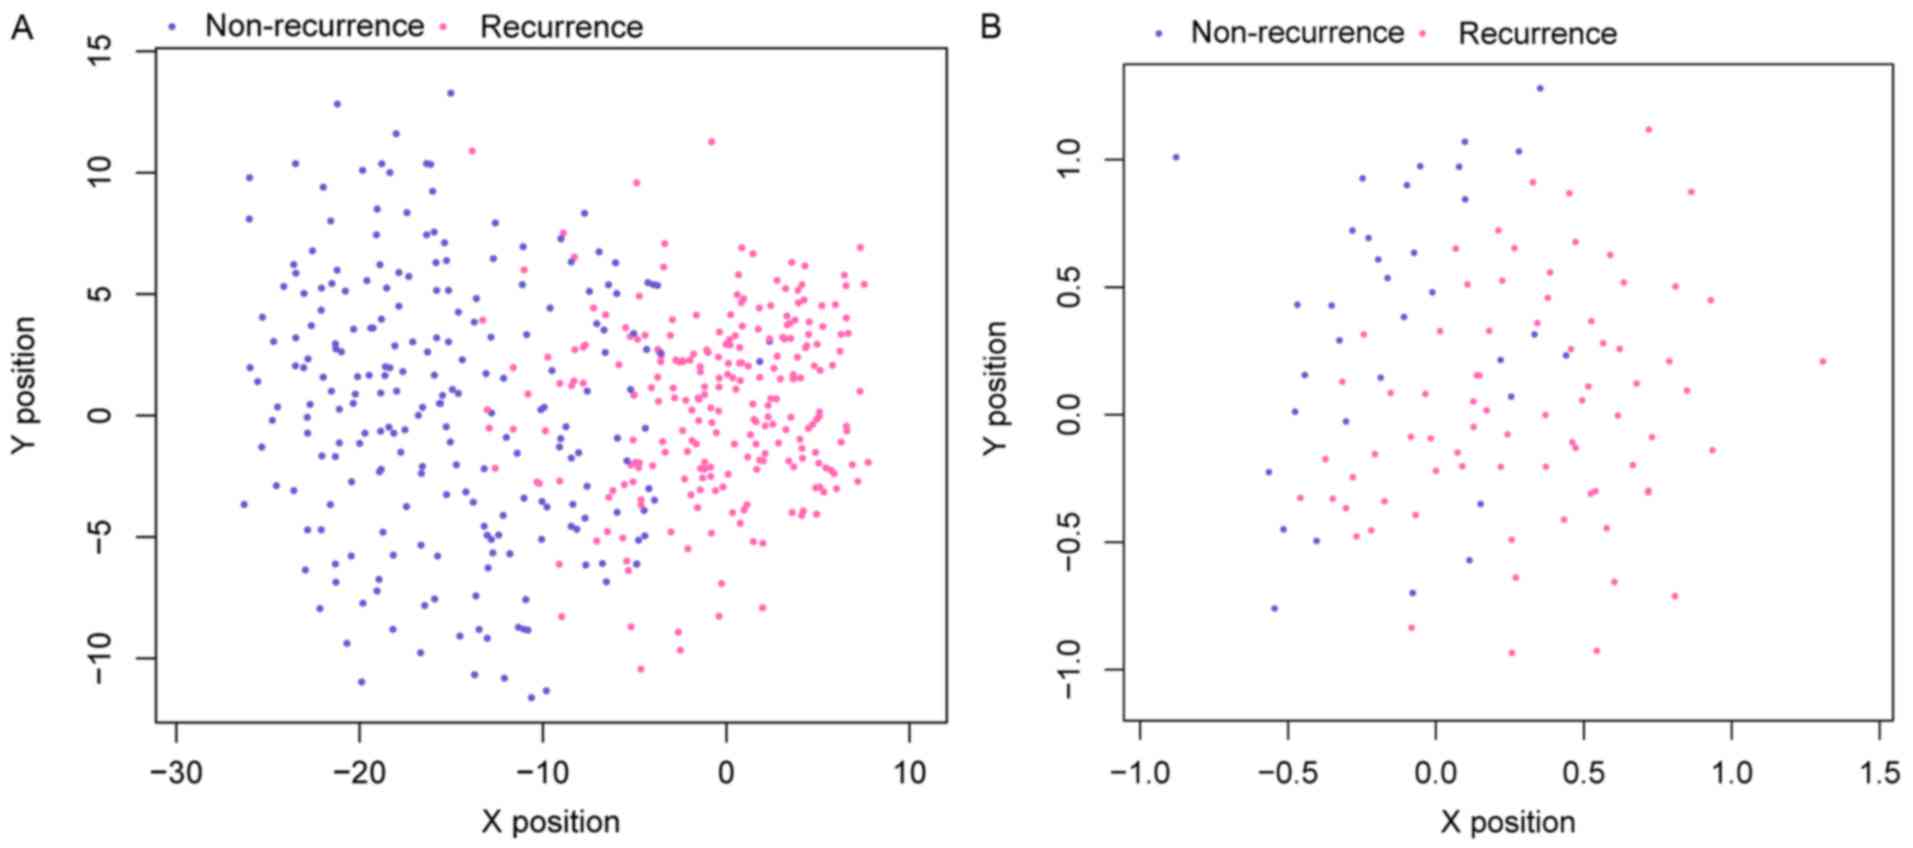
Data in the GSE17260 after normalization were used
to validate the accuracy of the SVM classifier of the 36 feature
genes. This SVM classifier could precisely distinguish 70 recurrent
samples from 31 non-recurrent samples with an accuracy of
91.8%.
Scatter plots of sample classifications in
validation dataset and data in TCGA are presented in Fig. 6. The findings indicated a good
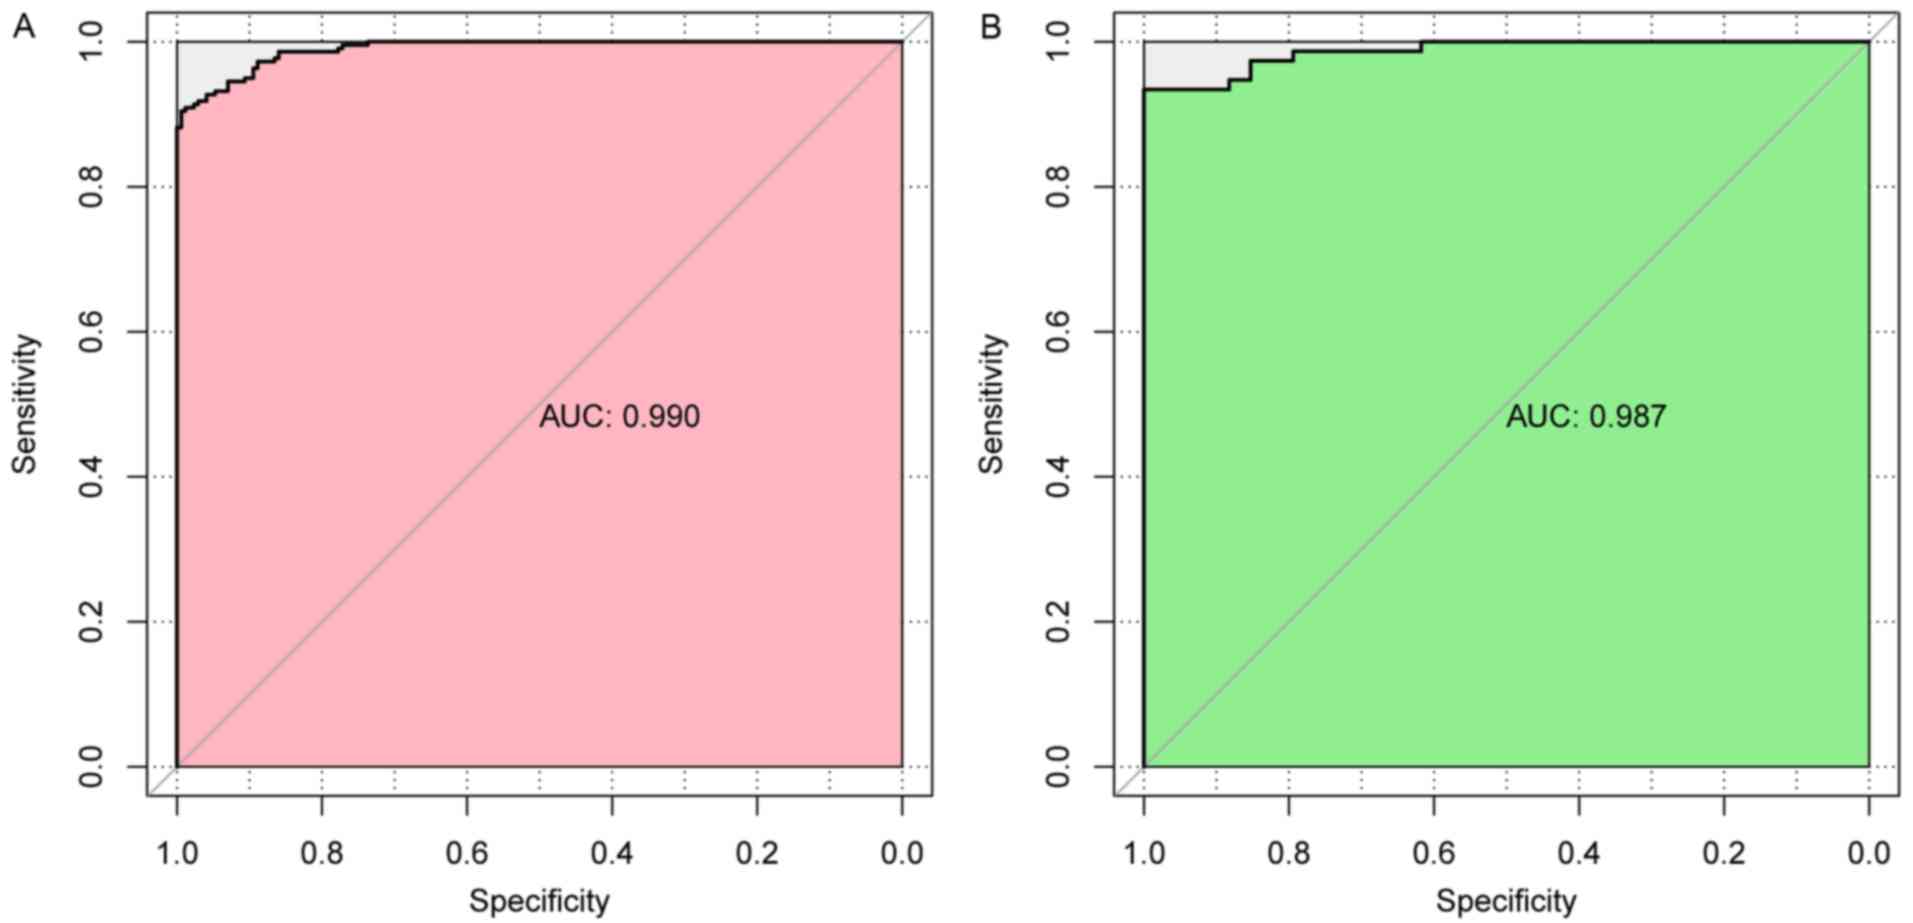
classification result. In addition, evaluation of the performance
of this SVM classifier using five indicators (sensitivity,
specificity, PPV, NPV, and AUC) further indicated that it had a
high correct rate on classification (0.936 or 0.918), and most of
the indicators had a high value of over 0.9 (Table III and Fig. 7).
| Table III.Performance evaluation of the SVM
classifier in training dataset and validation dataset. |
Table III.
Performance evaluation of the SVM
classifier in training dataset and validation dataset.
| Datasets | No. samples | Correct rate | Sensitivity | Specificity | PPV | NPV | AUC |
|---|
| TCGA | 391 | 0.936 | 0.897 | 0.942 | 0.923 | 0.921 | 0.990 |
| GSE13601 | 110 | 0.918 | 0.912 | 0.921 | 0.800 | 0.959 | 0.987 |
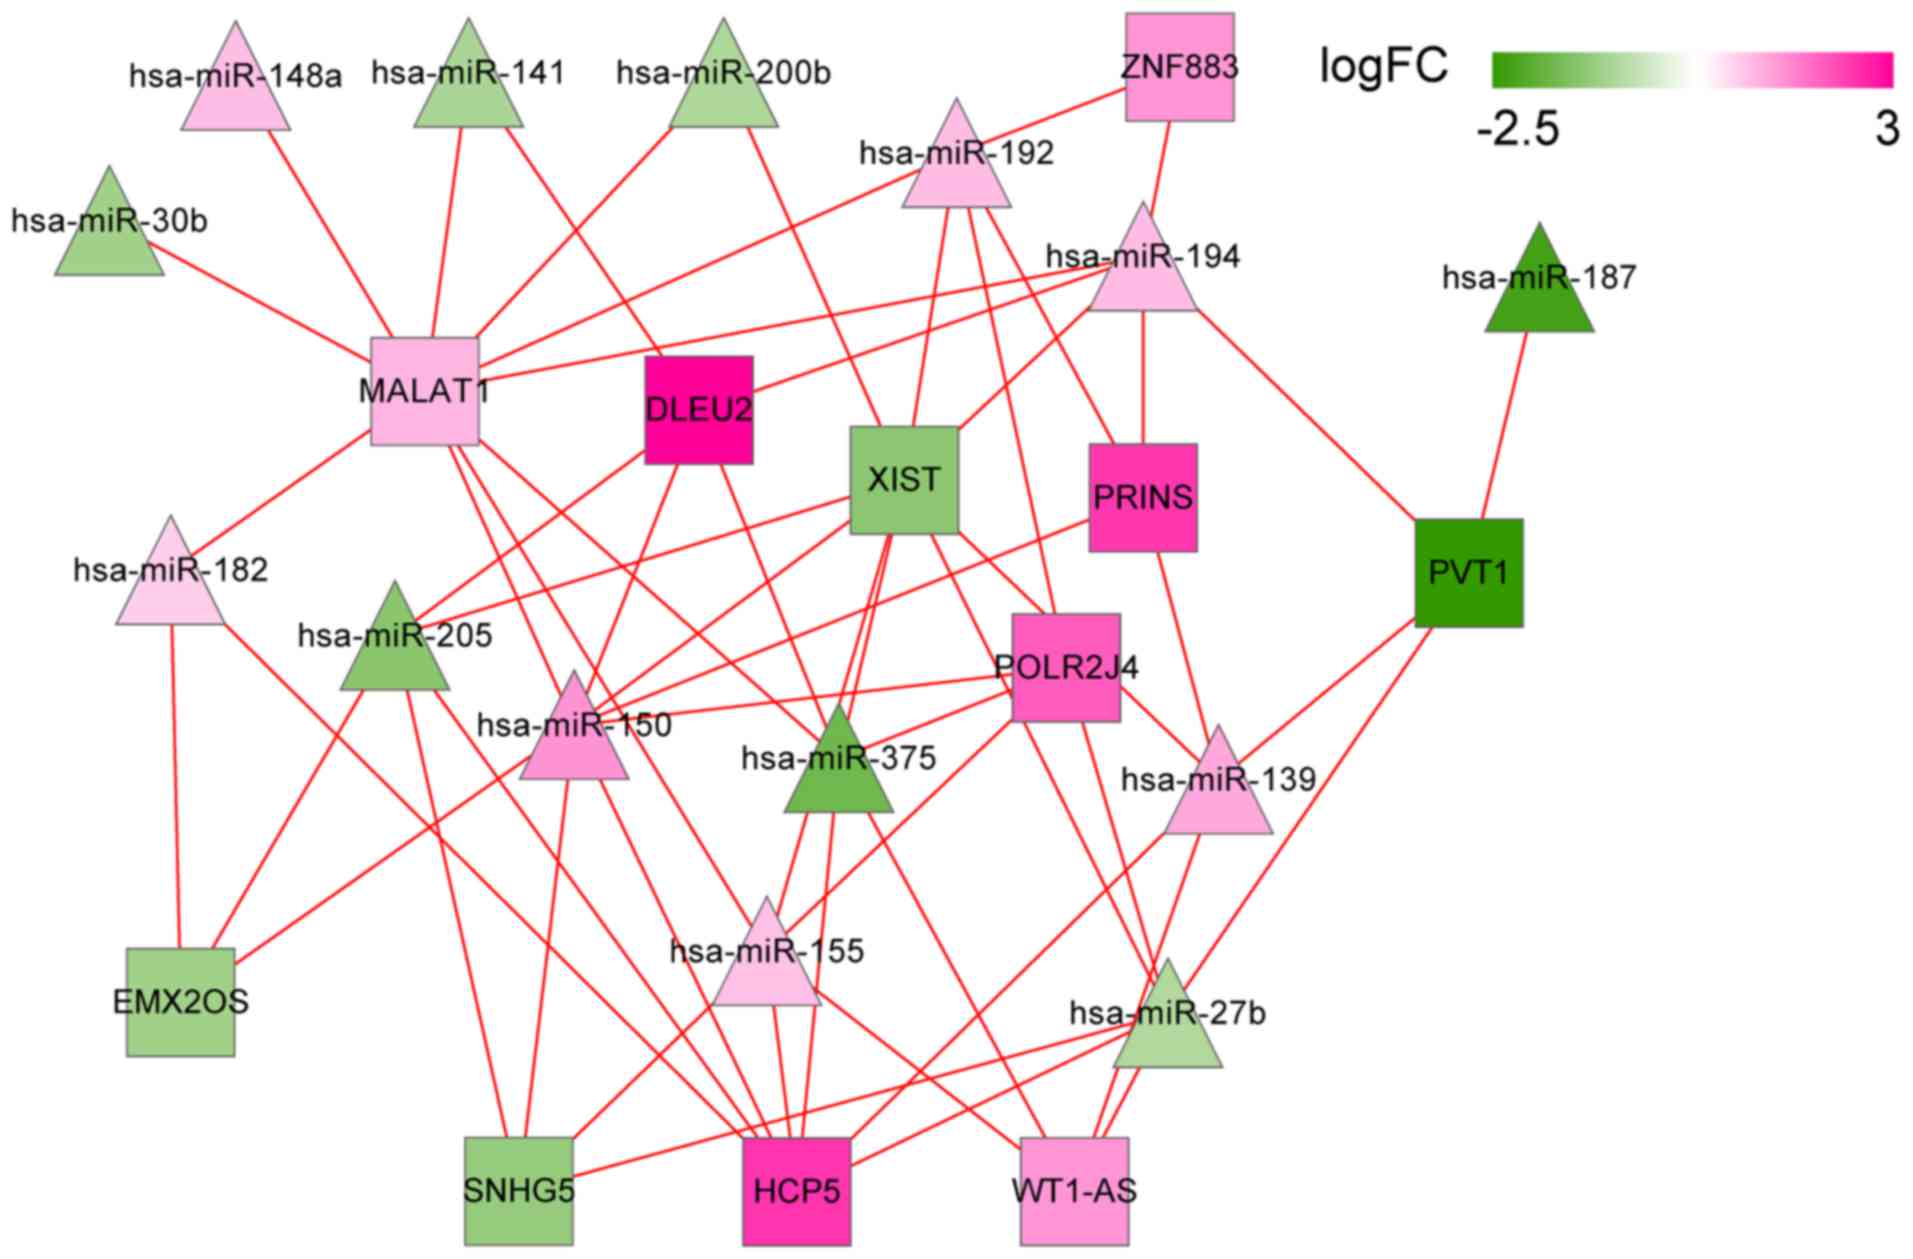
Predicted lncRNA/miRNA regulatory
network
Using miRcode and starBase databases, a group of 469
and 396 lncRNA/miRNA interactions were identified in the two
databases, respectively. Then, 562 overlapped interactions were
extracted. Combining them with the DEMs and DELs, a set of 58
lncRNA/miRNA interactions were finally selected to construct the
lncRNA/miRNA regulatory network. The network contained 11 DELs and
14 DEMs, such as DLEU2 (interplayed miRNAs: hsa-miR-141,
hsa-miR-150 and hsa-miR-375), MALAT1 (interplayed miRNAs:
hsa-miR-141, hsa-miR-150 and hsa-miR-375), and WT1-AS (interplayed
miRNAs: hsa-miR-375, hsa-miR-155 and hsa-miR-27b; Fig. 8).
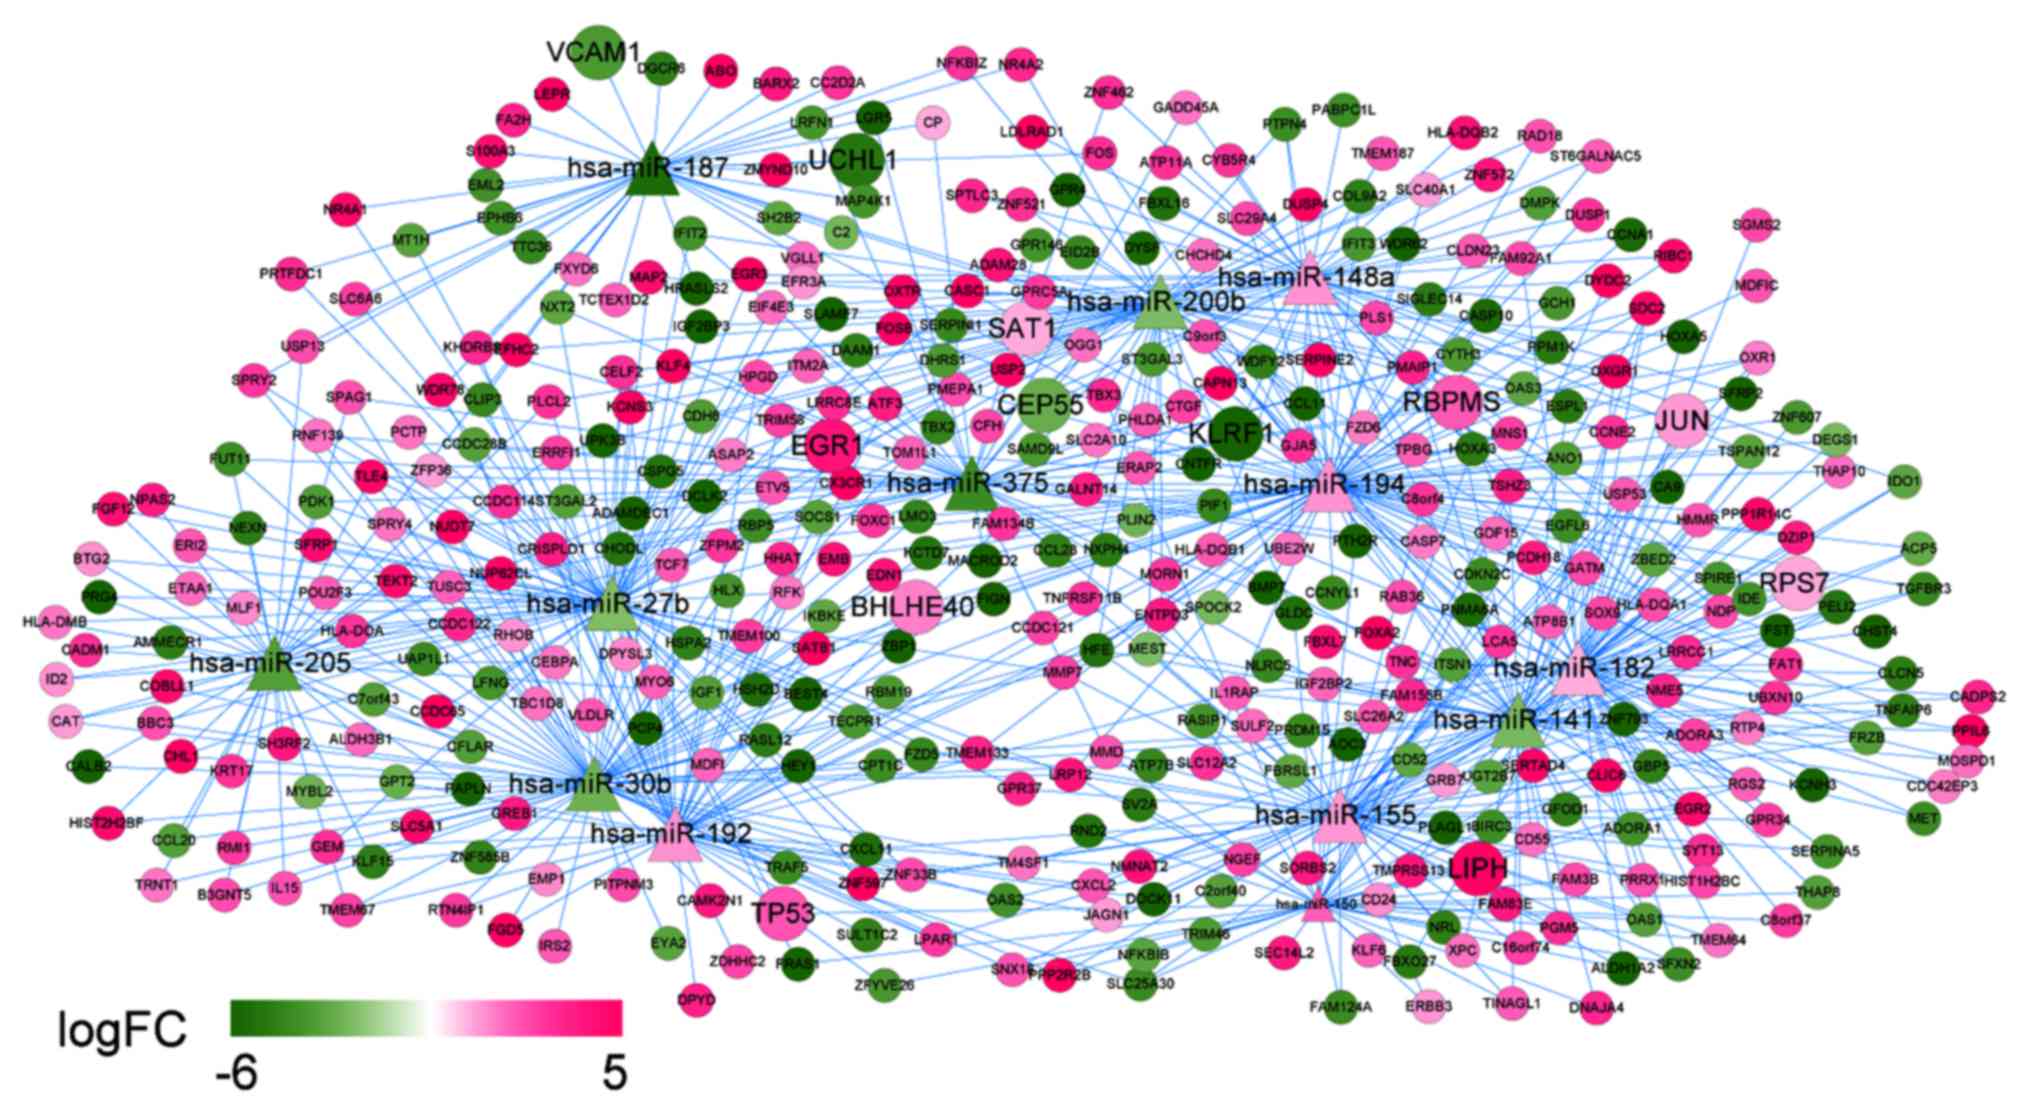
Predicted target genes of miRNAs
The 14 DEMs regulated by the DELs were mapped into
the miRTarBase database to explore their target genes, accompanied
with the DEGs. The predicted miRNA-target gene regulation network
comprised of 426 nodes (13 miRNAs since hsa-miR-139 did not get any
target information, and 413 mRNAs) and 743 interactions. In this
network (Fig. 9), several nodes and
interactions involving the feature genes in the optimal gene set
that was identified by support vector machine classifier may be
important, such as hsa-miR-375 (target genes: FOXC1, RBPMS and
CCL28), hsa-miR-27b (target genes: TP53, PCTP, TOM1L1), and
hsa-miR-141 (target genes: RBPMS, TINAGL1, and CCNE2).
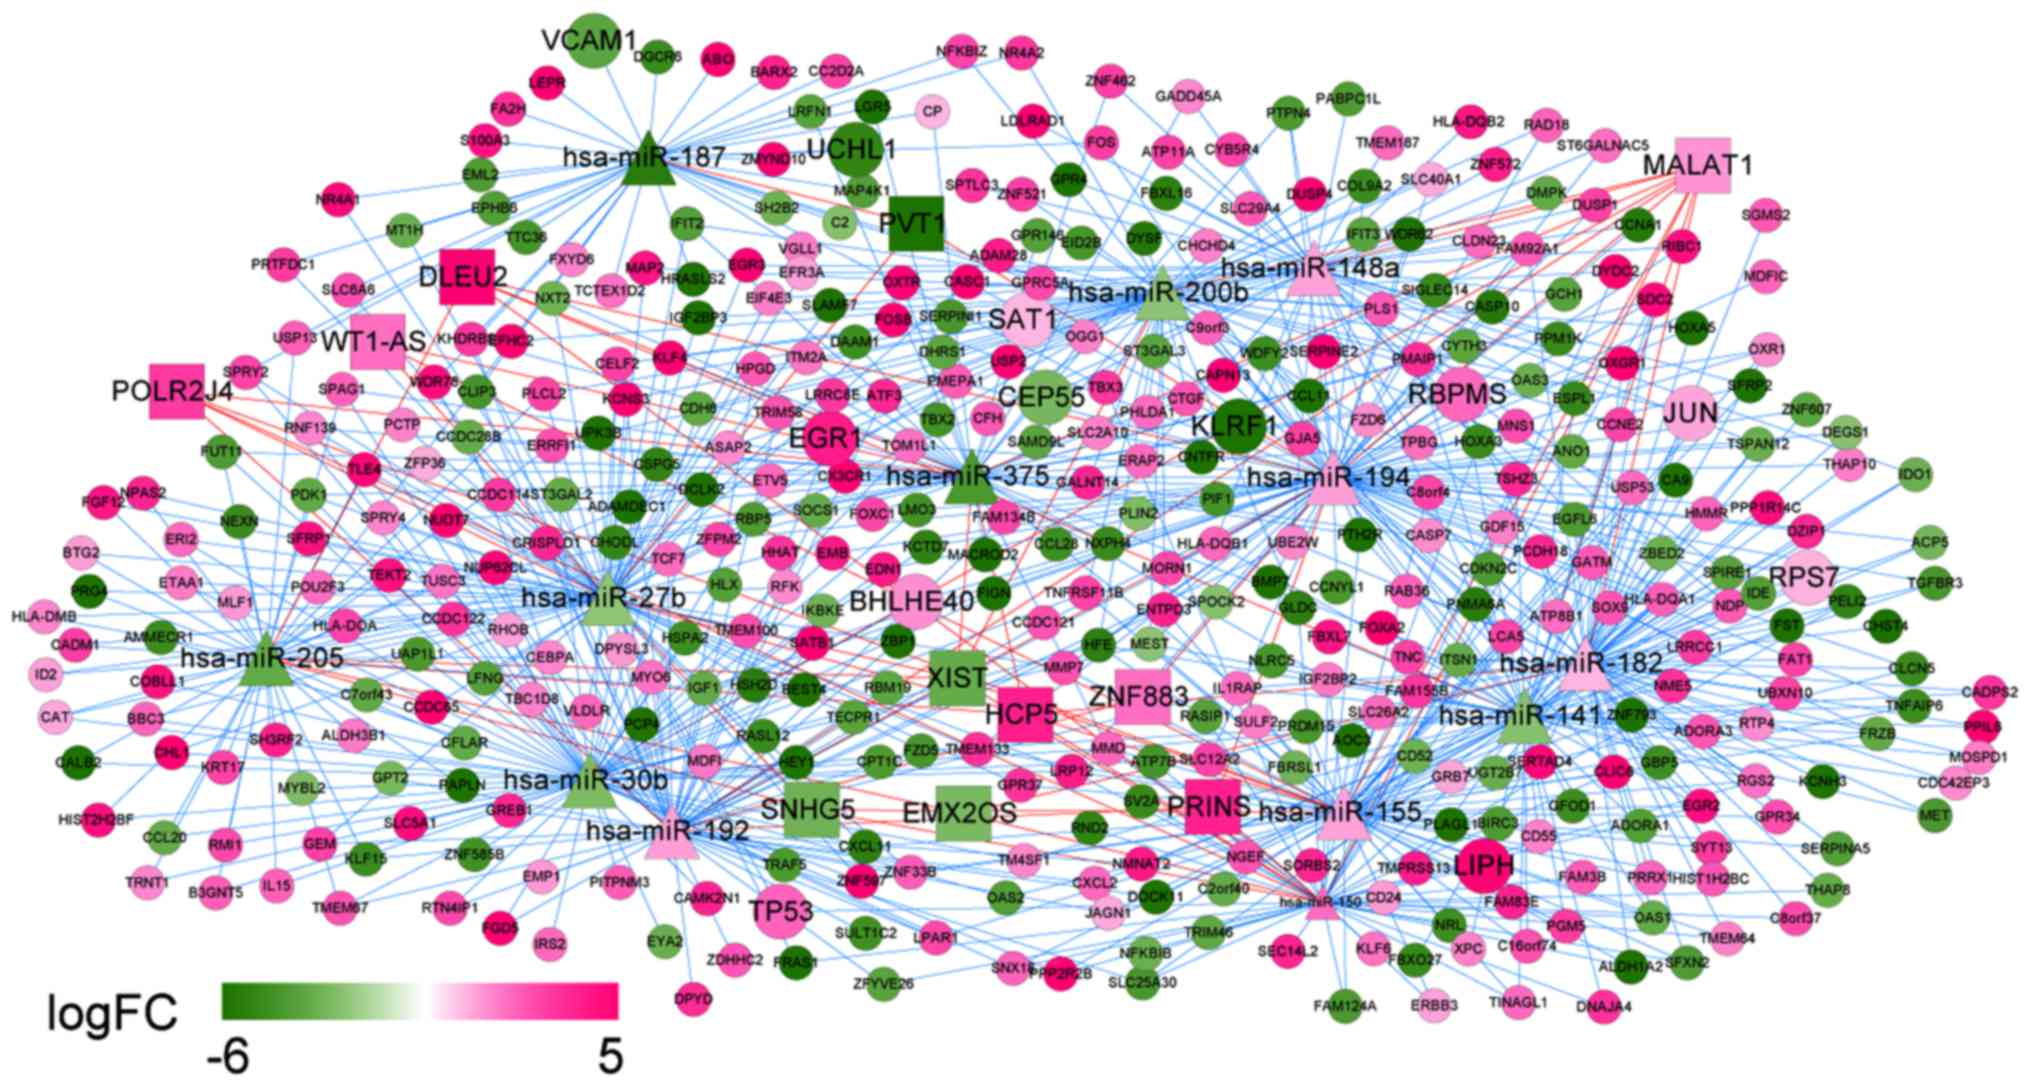
Construction of ceRNA network
Integrated ceRNA network
Integrating the lncRNA/miRNA interactions with the
miRNA/mRNA interactions, a ceRNA network was constructed. The
network was comprised of 437 nodes and 795 interactions. WT1-AS was
a prognosis-related lncRNA with the best performance and
hsa-miR-375 was also identified to be a prognosis-related miRNA.
TP53 and RBPMS were the feature genes in the optimal gene set that
were identified by the SVM classifier. In this integrated ceRNA
network, two regulations ‘WT1-AS-hsa-miR-375-RBPMS’ and
‘WT1-AS-hsa-miR-27b-TP53’ may play important roles (Fig. 10).
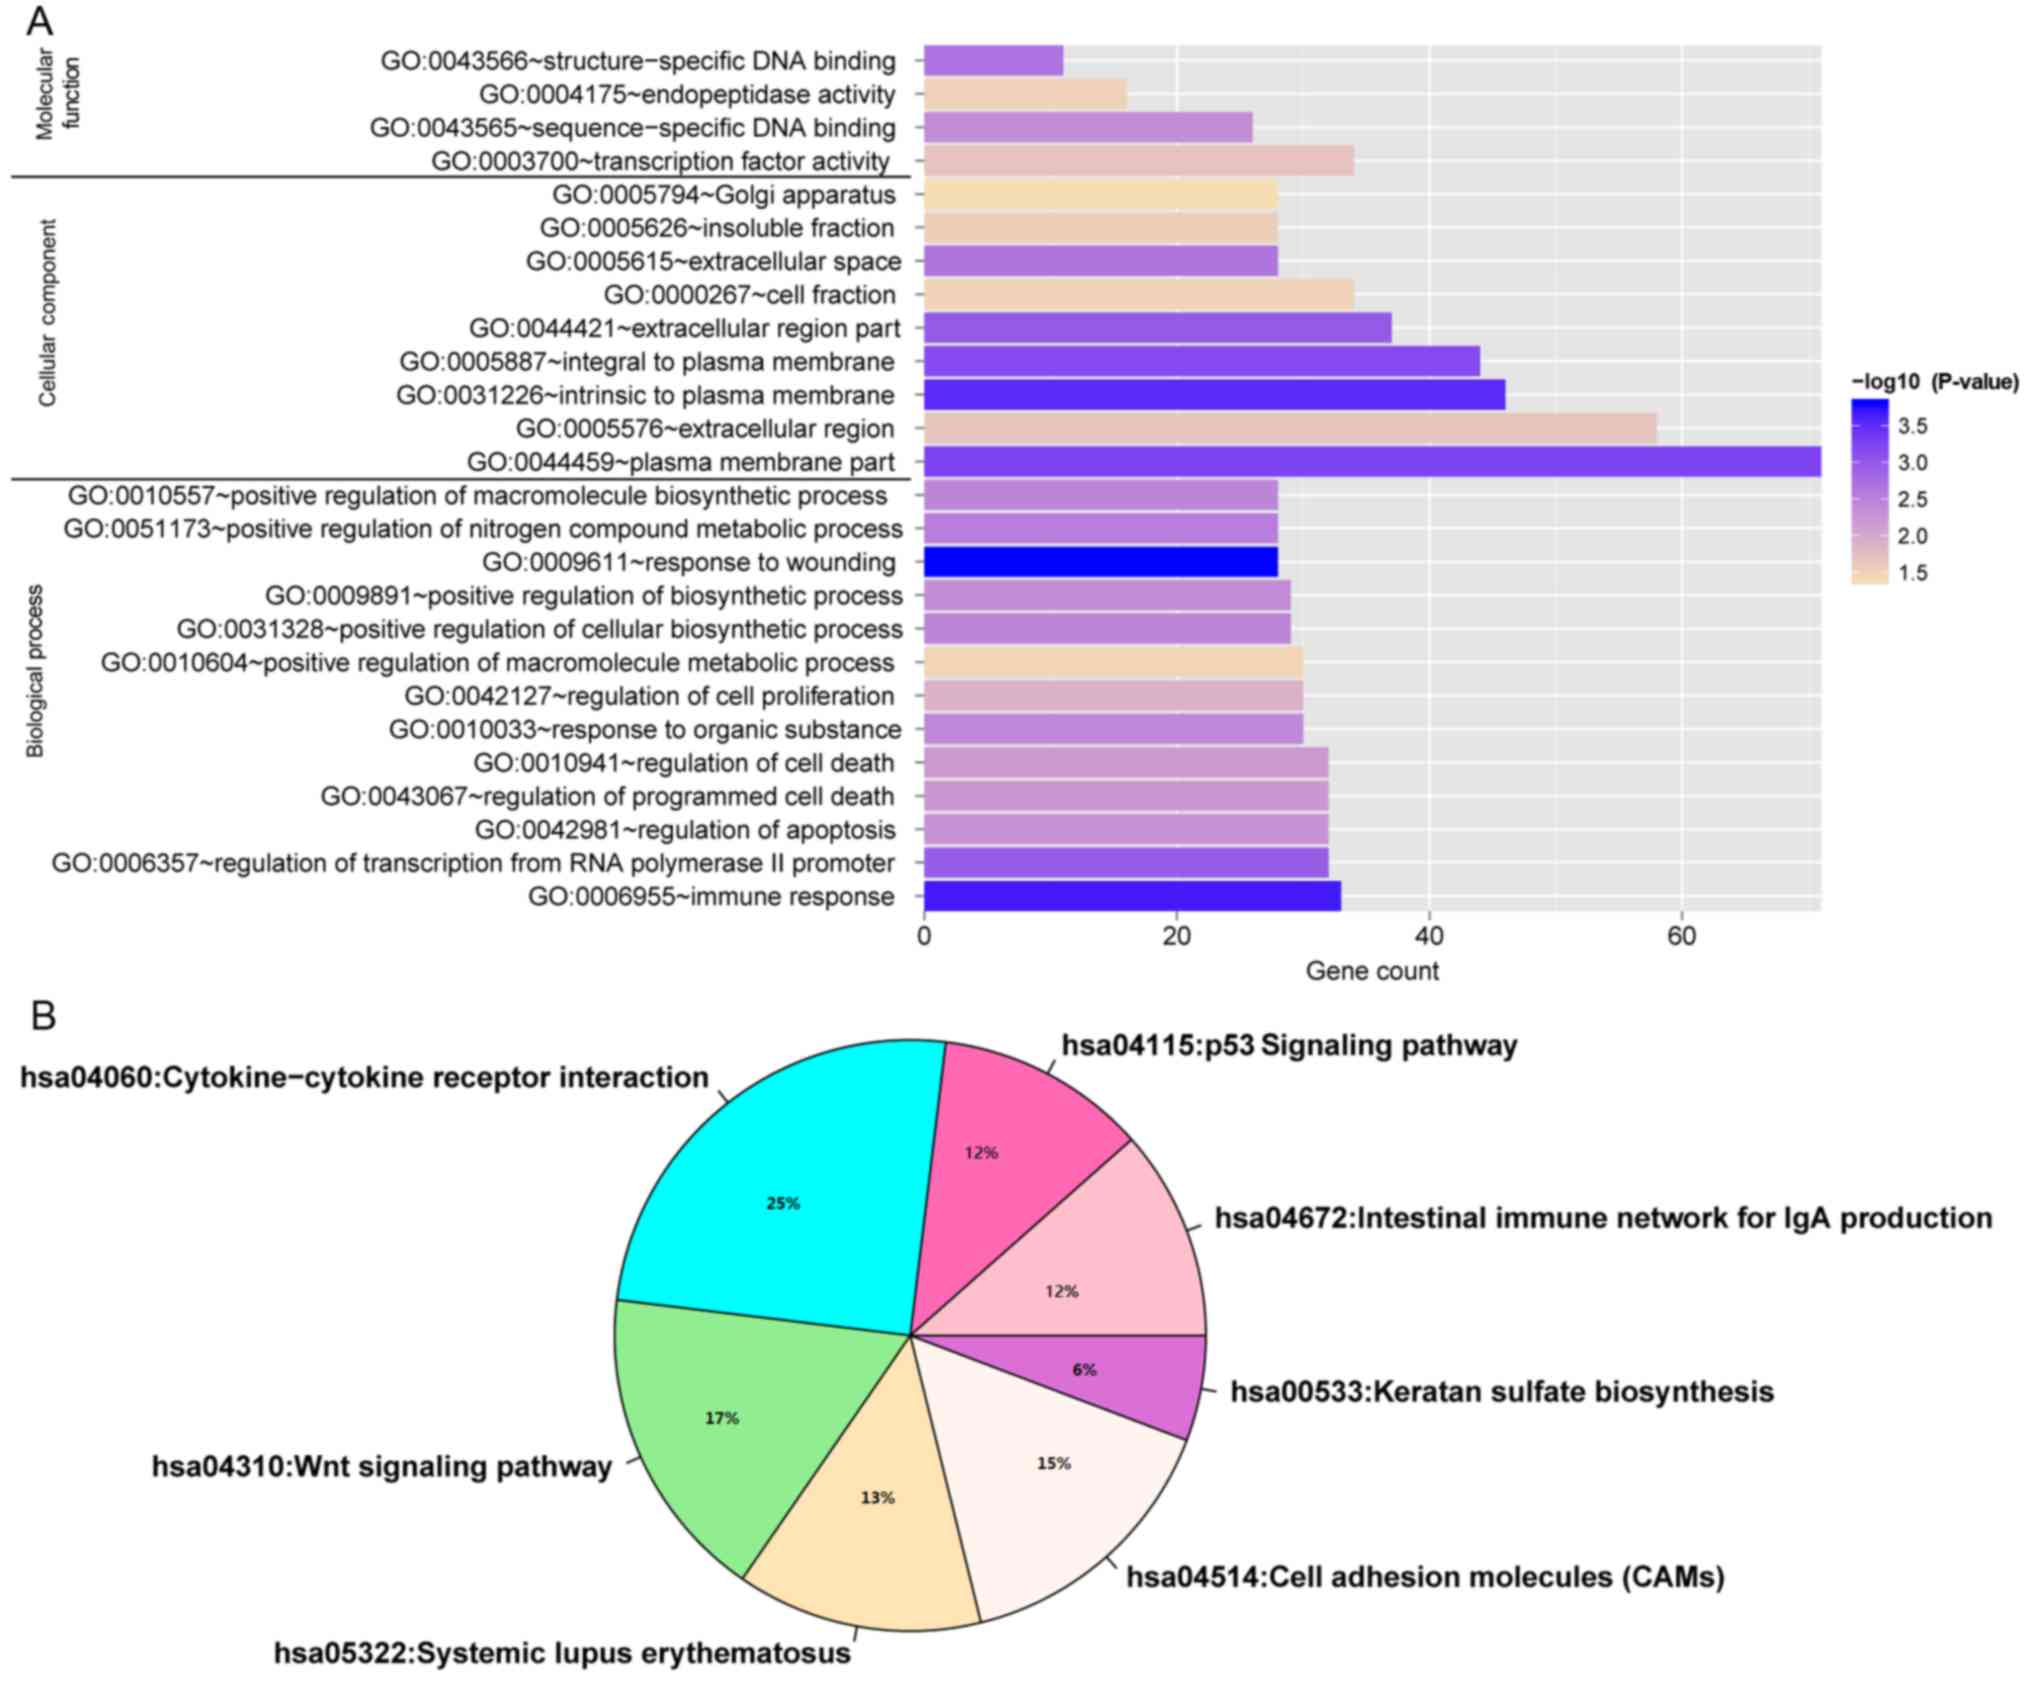
Enrichment analysis of target genes in
the ceRNA network
Enrichment analysis results indicated that target
genes in this ceRNA network were significantly enriched in 26 GO
functional categories (P<0.05; Fig.
11A) and seven KEGG pathway categories (P<0.05; Fig. 11B), including ‘immune response’,
‘response to wounding’, ‘intestinal immune network for IgA
production’, ‘p53 signaling pathway’, ‘cytokine-cytokine receptor
interaction’, and ‘Wnt signaling pathway’.
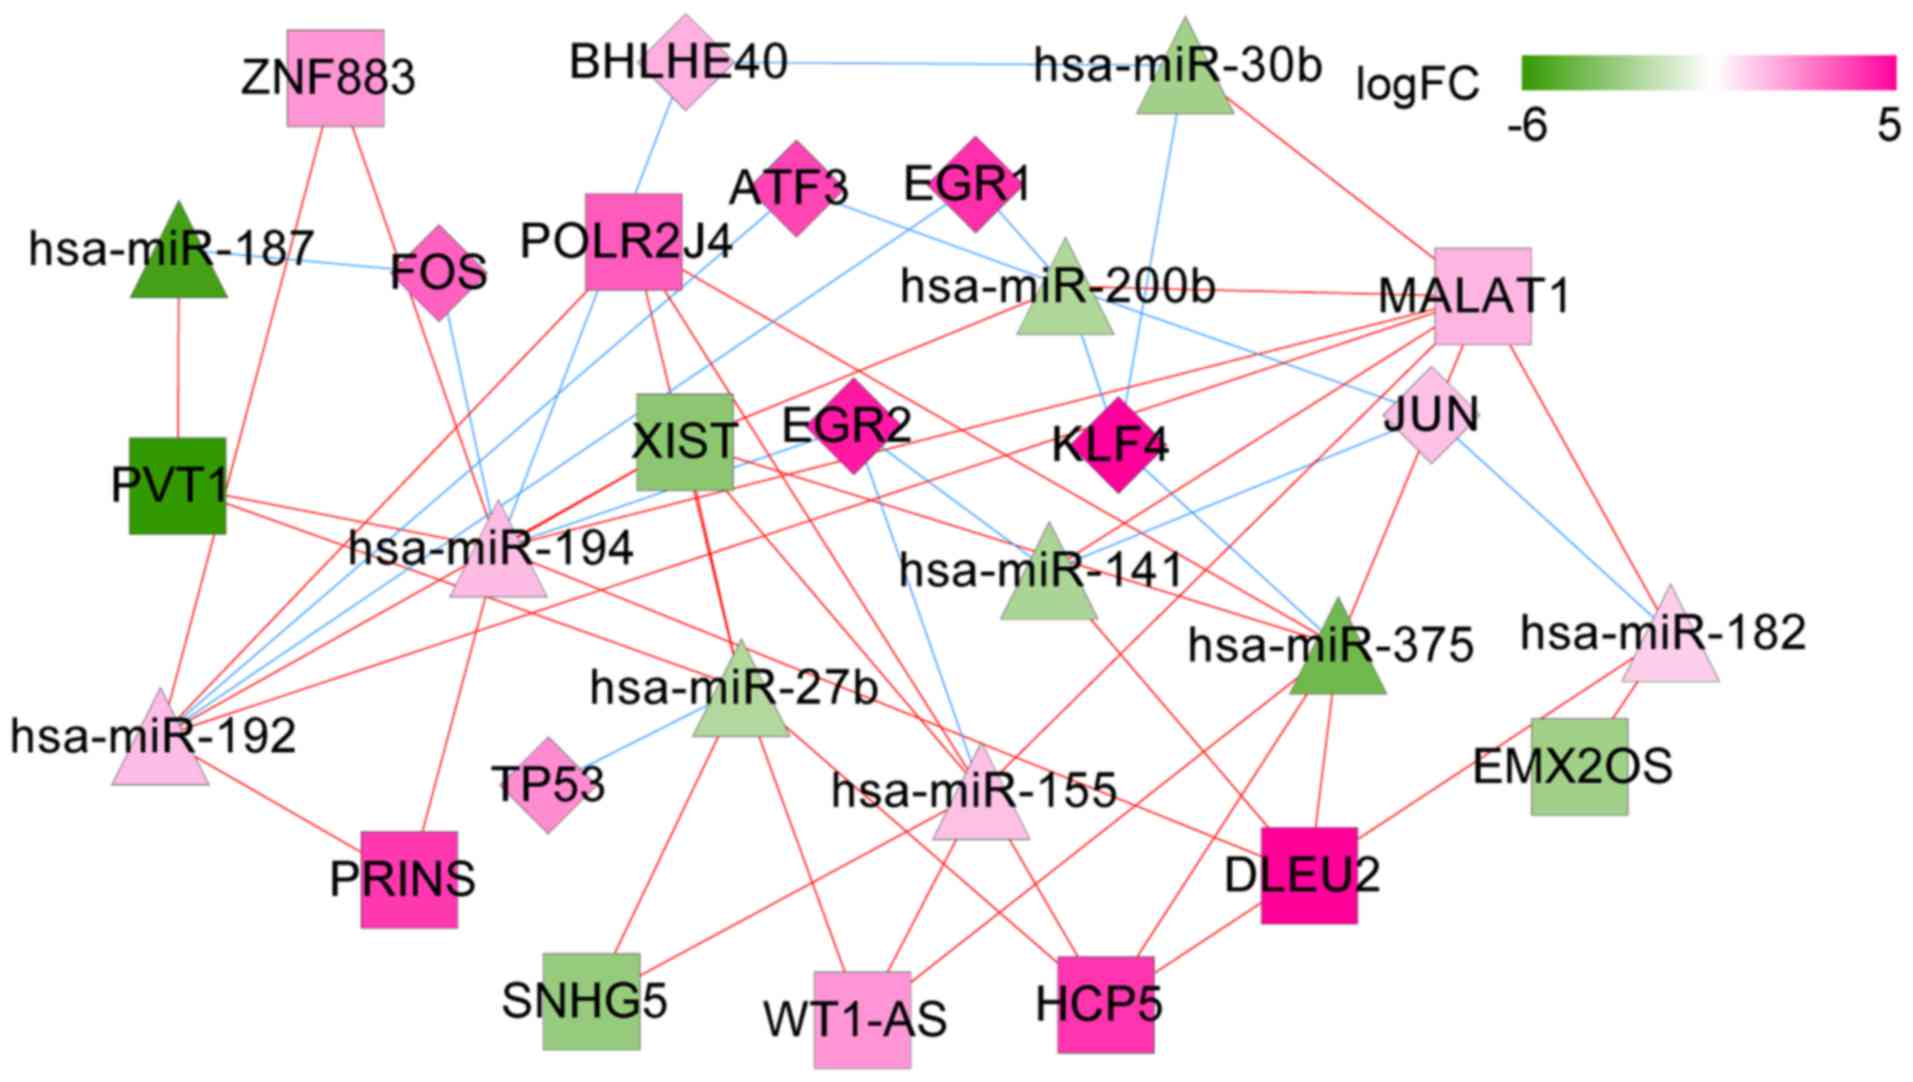
ceRNA network of transcription
factors
To further detect regulations from transcription
factors (TFs), two TF databases, Transcription Regulatory Regions
Database (TRRD, http://wwwmgs.bionet.nsc.ru/mgs/gnw/trrd/) and JASPAR
(http://jaspar.genereg.net/) were used.
Integrating the TF information with the above ceRNA network, a sub
ceRNA network relevant to TFs was extracted. In this subnetwork,
eight important TFs were highlighted: KLF4, FOS, TP53, JUN, EGR1,
EGR2, BHLHE40, and ATF3. In addition, TP53 was targeted by
hsa-miR-27b and EGR2 was targeted by hsa-miR-141 (Fig. 12).
Discussion
In the present study, by analyzing the RNA-seq data
in the GSE17260 dataset and the TCGA database, the optimal gene set
containing 36 feature genes that could clearly distinguish
recurrent with non-recurrent ovarian cancer was identified,
including TP53 and RBPMS. These genes were also
highlighted in the PPI network. We only identified three lncRNAs
related to recurrent ovarian cancer: NBR2, ZNF883, and WT1-AS.
Three predominant miRNAs with their target genes were also
predicted: hsa-miR-375 (target: RBPMS), hsa-miR-27b (target: TP53),
and hsa-miR-141 (target: RBPMS). Notably,
‘WT1-AS-hsa-miR-375-RBPMS’ and ‘WT1-AS-hsa-miR-27b-TP53’
interactions were striking in the ceRNA network.
The tumor suppressor tumor protein p53 (TP53) is
mutated in the early stage of high-grade serous ovarian cancer,
thus this gene mutation could act as a predictor for initiation of
the disease (26). Notably, the
TP53 mutation-regulated genomic instability induces the evolution
of recurrence in epithelial ovarian cancer (27), indicating the close correlation
between this gene expression and recurrence in ovarian cancer.
The protein encoded by RNA binding protein with
multiple splicing (RBPMS) is a member of the RNA recognition
motif family. It functions as a co-activator of transcriptional
activity. Inhibition of miR-21-3p was revealed to significantly
decrease proliferation and invasion in ovarian cancer, and
RBPMS was confirmed as a target gene of miR-21-3p via
luciferase reporter assays (28).
For Korean patients with serous ovarian cancer at stage IIIC,
RBPMS is a member of 27 genes located in chromosome
8p21.1-p12 regions with copy number loss, and it is enriched in
‘cellular macromolecule metabolic process’ involved in disease
progression (29). However, no
signs have indicated the relationship between this gene and
recurrence in ovarian cancer.
EYA2 is identified as an oncogene in cervical
carcinogenesis, while hsa-miR-375 is a tumor suppressor. EYA2 can
also promote tumor growth of ovarian cancer (30). Considering the closeness of cervical
cancer with ovarian cancer, hsa-miR-375 may also function as a
tumor suppressor in ovarian cancer. Notably, hsa-miR-375 was
revealed to be differentially expressed in ovarian serous carcinoma
at stage I, and thus is a potential candidate miRNA signature for
disease prediction (31).
Alteration of hsa-miR-375 was highly correlated with recurrence in
gastric cancer after surgery (32).
However, the relationship between this miRNA and recurrence in
ovarian cancer has not been reported.
hsa-miR-141 is a member of miR-200 family that has
been revealed to be overexpressed in various cancer types, such as
ovarian cancer, pancreatic ductal adenocarcinoma, and colorectal
cancer (33). hsa-miR-141-5p is one
of the ten miRNA signatures that may predict ovarian cancer
development (34). High expression
of hsa-miR-141 was related to poor prognosis of the disease
(35). The collective data
indicated the important role of hsa-miR-141 in ovarian cancer
progression. Several miR-200 family members have been implicated in
the correlation with recurrence. For instance, miR-429 was
increased in metastatic ovarian cancer cells, and it was revealed
to be a candidate therapeutic target that could reduce ovarian
cancer metastasis and tumor recurrence (36). Another family member, miR-200b, was
significantly associated with ovarian cancer recurrence (37). Whether the miR-200 family member
hsa-miR-141 is involved in the recurrence of ovarian cancer is
still unclear.
Based on our results, both of hsa-miR-375 and
hsa-miR-141 were involved in different regulation networks,
indicating that they participate in the process of ovarian cancer
recurrence, or that their dysregulation accounts for the disease
recurrence. Notably, RBPMS was the predicted target of both
hsa-miR-375 and hsa-miR-141, indicating that these two miRNAs
function by targeting this gene. The targeting relationships
require validation by luciferase reporter assays.
Reportedly, the expression of miR-27 was associated
with metastasis of ovarian cancer (38), and miR-27a and miR-27b were
implicated in the control of drug resistance in ovarian cancer
(39). No clues at present have
linked miR-27 to recurrence in ovarian cancer. However, in our
study, hsa-miR-27b was identified as an important miRNA for
recurrent ovarian cancer, indicating it may be a novel signature.
In human embryonal carcinoma cells, overexpressed miR-27 resulted
in an increase of TP53 (40). Additionally, the TP53 gene
transcript contains miR-27 binding sites (41). These indicate potential targeting
regulations between miR-27 and TP53. Based on our study,
TP53 was the predicted downstream target gene of
hsa-miR-27b.
The Wilms tumor 1 (WT1) gene is frequently expressed
in epithelial ovarian cancer (42).
The lncRNA WT1 Antisense RNA (WT1-AS) encoded gene is located
upstream of WT1. The two genes are bi-directionally
transcribed from the same promoter region. Reportedly, interaction
between WT1-AS and WT1 sense RNA resulted in the upregulation of
the WT1 protein (43). In acute
myeloid leukemia, alternative splicing of WT1-AS was reported
(44). In gastric cancer,
downregulation of WT1-AS promoted tumor cell proliferation and
invasion (45). However, no
correlations were indicated in ovarian cancer. Our results
indicated that this lncRNA is a critical lncRNA in the ceRNA
network, and the interactions of ‘WT1-AS-hsa-miR-375-RBPMS’ and
‘WT1-AS-hsa-miR-27b-TP53’ indicated that WT1-AS is a biomarker for
prognosis of ovarian cancer recurrence, and participates in the
aforementioned regulations during the process.
Despite the fact that our results provide many
potential biomarkers and relevant regulations for ovarian cancer
recurrence, there are several limitations in the study. The
expression of these important genes, miRNAs and lncRNAs, as well as
the predictive targeting relationships require further
validation.
In conclusion, several biomarkers for ovarian cancer
recurrence were identified. These included TP53, RBPMS,
hsa-miR-375, hsa-miR-141, hsa-miR-27b, and WT1-AS. The interactions
of ‘WT1-AS-hsa-miR-375-RBPMS’ and ‘WT1-AS-hsa-miR-27b-TP53’ may be
potential regulatory mechanisms during this process.
Acknowledgements
Not applicable.
Funding
No funding was received.
Availability of data and materials
The datasets analyzed during the current study are
available from the corresponding author upon reasonable
request.
Authors' contributions
XW and LH performed data analyses and wrote the
manuscript. LZ and LW significantly contributed in data analyses
and manuscript revision. LMZ conceived and designed the study. All
authors read and approved the manuscript and agree to be
accountable for all aspects of the research in ensuring that the
accuracy or integrity of any part of the work are appropriately
investigated and resolved.
Ethics approval and consent to
participate
In the original article of the datasets, the trials
were approved by the local institutional review boards of all
participating centers, and informed consent was obtained from all
patients.
Patient consent for publication
Not applicable.
Competing interests
The authors declare that they have no competing
interests.
References
|
1
|
Diaz-Gil D, Fintelmann FJ, Molaei S, Elmi
A, Hedgire SS and Harisinghani MG: Prediction of 5-year survival in
advanced-stage ovarian cancer patients based on computed tomography
peritoneal carcinomatosis index. Abdom Radiol. 41:2196–2202. 2016.
View Article : Google Scholar
|
|
2
|
Lowe KA, Chia VM, Taylor A, O'Malley C,
Kelsh M, Mohamed M, Mowat FS and Goff B: An international
assessment of ovarian cancer incidence and mortality. Gynecol
Oncol. 130:107–114. 2013. View Article : Google Scholar : PubMed/NCBI
|
|
3
|
Kehoe S, Hook J, Nankivell M, Jayson GC,
Kitchener H, Lopes T, Luesley D, Perren T, Bannoo S, Mascarenhas M,
et al: Primary chemotherapy versus primary surgery for newly
diagnosed advanced ovarian cancer (CHORUS): An open-label,
randomised, controlled, non-inferiority trial. Lancet. 386:249–257.
2015. View Article : Google Scholar : PubMed/NCBI
|
|
4
|
Schmid BC and Oehler MK: New perspectives
in ovarian cancer treatment. Maturitas. 77:128–136. 2014.
View Article : Google Scholar : PubMed/NCBI
|
|
5
|
Gao Y, Foster R, Yang X, Feng Y, Shen JK,
Mankin HJ, Hornicek FJ, Amiji MM and Duan Z: Up-regulation of CD44
in the development of metastasis, recurrence and drug resistance of
ovarian cancer. Oncotarget. 6:9313–9326. 2015. View Article : Google Scholar : PubMed/NCBI
|
|
6
|
Chen WT, Gao X, Han XD, Zheng H, Guo L and
Lu RQ: HE4 as a serum biomarker for ROMA prediction and prognosis
of epithelial ovarian cancer. Asian Pac J Cancer Prev. 15:101–105.
2014. View Article : Google Scholar : PubMed/NCBI
|
|
7
|
Avril S, Dincer Y, Malinowsky K, Wolff C,
Gündisch S, Hapfelmeier A, Boxberg M, Bronger H, Becker KF and
Schmalfeldt B: Increased PDGFR-beta and VEGFR-2 protein levels are
associated with resistance to platinum-based chemotherapy and
adverse outcome of ovarian cancer patients. Oncotarget.
8:97851–97861. 2017. View Article : Google Scholar : PubMed/NCBI
|
|
8
|
Meng X, Muller V, Milde-Langosch K,
Trillsch F, Pantel K and Schwarzenbach H: Circulating cell-free
miR-373, miR-200a, miR-200b and miR-200c in patients with
epithelial ovarian cancer. Adv Exp Med Biol. 924:3–8. 2016.
View Article : Google Scholar : PubMed/NCBI
|
|
9
|
Koutsaki M, Libra M, Spandidos DA and
Zaravinos A: The miR-200 family in ovarian cancer. Oncotarget.
8:66629–66640. 2017. View Article : Google Scholar : PubMed/NCBI
|
|
10
|
Ulitsky I: Evolution to the rescue: Using
comparative genomics to understand long non-coding RNAs. Nat Rev
Genet. 17:601–614. 2016. View Article : Google Scholar : PubMed/NCBI
|
|
11
|
Luo P, Liu XF, Wang YC, Li ND, Liao SJ, Yu
MX, Liang CZ and Tu JC: Prognostic value of abnormally expressed
lncRNAs in ovarian carcinoma: A systematic review and
meta-analysis. Oncotarget. 8:23927–23936. 2017.PubMed/NCBI
|
|
12
|
Wang P, Liu YH, Yao YL, Li Z, Li ZQ, Ma J
and Xue YX: Long non-coding RNA CASC2 suppresses malignancy in
human gliomas by miR-21. Cell Signal. 27:275–282. 2015. View Article : Google Scholar : PubMed/NCBI
|
|
13
|
Yang K, Hou Y, Li A, Li Z, Wang W, Xie H,
Rong Z, Lou G and Li K: Identification of a six-lncRNA signature
associated with recurrence of ovarian cancer. Sci Rep. 7:7522017.
View Article : Google Scholar : PubMed/NCBI
|
|
14
|
Guo Q, Cheng Y, Liang T, He Y, Ren C, Sun
L and Zhang G: Comprehensive analysis of lncRNA-mRNA co-expression
patterns identifies immune-associated lncRNA biomarkers in ovarian
cancer malignant progression. Sci Rep. 5:176832015. View Article : Google Scholar : PubMed/NCBI
|
|
15
|
Zhou M, Wang X, Shi H, Cheng L, Wang Z,
Zhao H, Yang L and Sun J: Characterization of long non-coding
RNA-associated ceRNA network to reveal potential prognostic lncRNA
biomarkers in human ovarian cancer. Oncotarget. 7:12598–12611.
2016.PubMed/NCBI
|
|
16
|
Carvalho B, Bengtsson H, Speed TP and
Irizarry RA: Exploration, normalization, and genotype calls of
high-density oligonucleotide SNP array data. Biostatistics.
8:485–499. 2007. View Article : Google Scholar : PubMed/NCBI
|
|
17
|
Eyre TA, Ducluzeau F, Sneddon TP, Povey S,
Bruford EA and Lush MJ: The HUGO gene nomenclature database, 2006
updates. Nucleic Acids Res. 34:D319–D321. 2006. View Article : Google Scholar : PubMed/NCBI
|
|
18
|
Chen Y, Lun ATL and Smyth GK: Differential
expression analysis of complex RNA-seq experiments using edgeR.
Springer International Publishing; Springer, Cham: pp. 51–74.
2014
|
|
19
|
Yue S: Clinical trial data analysis using
R. J Statistical Software. 43:2011.
|
|
20
|
Baur B and Bozdag S: A feature selection
algorithm to compute gene centric methylation from probe level
methylation data. PLoS One. 11:e01489772016. View Article : Google Scholar : PubMed/NCBI
|
|
21
|
Mavroforakis ME and Theodoridis S: A
geometric approach to support vector machine (SVM) classification.
IEEE Trans Neural Netw. 17:671–682. 2006. View Article : Google Scholar : PubMed/NCBI
|
|
22
|
Jeggari A, Marks DS and Larsson E:
miRcode: A map of putative microRNA target sites in the long
non-coding transcriptome. Bioinformatics. 28:2062–2063. 2012.
View Article : Google Scholar : PubMed/NCBI
|
|
23
|
Li JH, Liu S, Zhou H, Qu LH and Yang JH:
starBase v2.0: Decoding miRNA-ceRNA, miRNA-ncRNA and protein-RNA
interaction networks from large-scale CLIP-Seq data. Nucleic Acids
Res. 42:D92–D97. 2014. View Article : Google Scholar : PubMed/NCBI
|
|
24
|
Chou CH, Chang NW, Shrestha S, Hsu SD, Lin
YL, Lee WH, Yang CD, Hong HC, Wei TY, Tu SJ, et al: miRTarBase
2016: Updates to the experimentally validated miRNA-target
interactions database. Nucleic Acids Res. 44:D239–D247. 2016.
View Article : Google Scholar : PubMed/NCBI
|
|
25
|
Hsu SD, Lin FM, Wu WY, Liang C, Huang WC,
Chan WL, Tsai WT, Chen GZ, Lee CJ, Chiu CM, et al: miRTarBase: A
database curates experimentally validated microRNA-target
interactions. Nucleic Acids Res. 39:D163–D169. 2011. View Article : Google Scholar : PubMed/NCBI
|
|
26
|
Chien J, Sicotte H, Fan JB, Humphray S,
Cunningham JM, Kalli KR, Oberg AL, Hart SN, Li Y, Davila JI, et al:
TP53 mutations, tetraploidy and homologous recombination
repair defects in early stage high-grade serous ovarian cancer.
Nucleic Acids Res. 43:6945–6958. 2015. View Article : Google Scholar : PubMed/NCBI
|
|
27
|
Zhang M, Zhuang G, Sun X, Shen Y, Wang W,
Li Q and Di W: TP53 mutation-mediated genomic instability induces
the evolution of chemoresistance and recurrence in epithelial
ovarian cancer. Diagn Pathol. 12:162017. View Article : Google Scholar : PubMed/NCBI
|
|
28
|
Báezvega PM, Vargas Echevarría IM,
Valiyeva F, Encarnación-Rosado J, Roman A, Flores J,
Marcos-Martínez MJ and Vivas-Mejía PE: Targeting miR-21-3p inhibits
proliferation and invasion of ovarian cancer cells. Oncotarget.
7:36321–36337. 2016.PubMed/NCBI
|
|
29
|
Kwon JY, Seo YR and Ahn WS: Recognition of
potential predictive markers for diagnosis in Korean serous ovarian
cancer patients at stage IIIc using array comparative genomic
hybridization with high resolution. Mol Cell Toxicol. 7:77–86.
2011. View Article : Google Scholar
|
|
30
|
Bierkens M, Krijgsman O, Wilting SM, Bosch
L, Jaspers A, Meijer GA, Meijer CJ, Snijders PJ, Ylstra B and
Steenbergen RD: Focal aberrations indicate EYA2 and hsa-miR-375 as
oncogene and tumor suppressor in cervical carcinogenesis. Genes
Chromosomes Cancer. 52:56–68. 2013. View Article : Google Scholar : PubMed/NCBI
|
|
31
|
Yu X, Zhang X, Bi T, Ding Y, Zhao J, Wang
C, Jia T, Han D, Guo G, Wang B, et al: MiRNA expression signature
for potentially predicting the prognosis of ovarian serous
carcinoma. Tumour Biol. 34:3501–3508. 2013. View Article : Google Scholar : PubMed/NCBI
|
|
32
|
Zhang X, Yan Z, Zhang J, Gong L, Li W, Cui
J, Liu Y, Gao Z, Li J, Shen L and Lu Y: Combination of hsa-miR-375
and hsa-miR-142-5p as a predictor for recurrence risk in gastric
cancer patients following surgical resection. Ann Oncol.
22:2257–2266. 2011. View Article : Google Scholar : PubMed/NCBI
|
|
33
|
Xu L, Li Q, Xu D, Wang Q, An Y, Du Q,
Zhang J, Zhu Y and Miao Y: hsa-miR-141 downregulates TM4SF1 to
inhibit pancreatic cancer cell invasion and migration. Int J Oncol.
44:459–466. 2014. View Article : Google Scholar : PubMed/NCBI
|
|
34
|
Wang L, Zhu MJ, Ren AM, Wu HF, Han WM, Tan
RY and Tu RQ: A ten-microRNA signature identified from a
genome-wide microRNA expression profiling in human epithelial
ovarian cancer. PLoS One. 9:e964722014. View Article : Google Scholar : PubMed/NCBI
|
|
35
|
Waltering KK, Porkka KP, Jalava SE,
Urbanucci A, Kohonen PJ, Latonen LM, Kallioniemi OP, Jenster G and
Visakorpi T: Androgen regulation of micro-RNAs in prostate cancer.
Prostate. 71:604–614. 2011. View Article : Google Scholar : PubMed/NCBI
|
|
36
|
Chen J, Wang L, Matyunina LV, Hill CG and
McDonald JF: Overexpression of miR-429 induces
mesenchymal-to-epithelial transition (MET) in metastatic ovarian
cancer cells. Gynecol Oncol. 121:200–205. 2011. View Article : Google Scholar : PubMed/NCBI
|
|
37
|
Hu X, Macdonald DM, Huettner PC, Feng Z,
El Naqa IM, Schwarz JK, Mutch DG, Grigsby PW, Powell SN and Wang X:
A miR-200 microRNA cluster as prognostic marker in advanced ovarian
cancer. Gynecol Oncol. 114:457–464. 2009. View Article : Google Scholar : PubMed/NCBI
|
|
38
|
Park YT, Jeong JY, Lee MJ, Kim KI, Kim TH,
Kwon YD, Lee C, Kim OJ and An HJ: MicroRNAs overexpressed in
ovarian ALDH1-positive cells are associated with chemoresistance. J
Ovarian Res. 6:182013. View Article : Google Scholar : PubMed/NCBI
|
|
39
|
Li Z, Hu S, Wang J, Cai J, Xiao L, Yu L
and Wang Z: MiR-27a modulates MDR1/P-glycoprotein expression by
targeting HIPK2 in human ovarian cancer cells. Gynecol Oncol.
119:125–130. 2010. View Article : Google Scholar : PubMed/NCBI
|
|
40
|
Fuchs H, Theuser M, Wruck W and Adjaye J:
miR-27 negatively regulates pluripotency-associated genes in human
embryonal carcinoma cells. PLoS One. 9:e1116372014. View Article : Google Scholar : PubMed/NCBI
|
|
41
|
Halytskiy V: Shifts in microRNA expression
pattern can facilitate the cancer cell stemness. Eur J Cancer.
50:1742014. View Article : Google Scholar
|
|
42
|
Hylander B, Repasky E, Shrikant P,
Intengan M, Beck A, Driscoll D, Singhal P, Lele S and Odunsi K:
Expression of Wilms tumor gene (WT1) in epithelial ovarian cancer.
Gynecol Oncol. 101:12–17. 2006. View Article : Google Scholar : PubMed/NCBI
|
|
43
|
Dallosso AR, Hancock AL, Malik S, Salpekar
A, King-Underwood L, Pritchard-Jones K, Peters J, Moorwood K, Ward
A, Malik KT and Brown KW: Alternately spliced WT1 antisense
transcripts interact with WT1 sense RNA and show epigenetic
and splicing defects in cancer. RNA. 13:2287–2299. 2007. View Article : Google Scholar : PubMed/NCBI
|
|
44
|
Garzon R, Volinia S, Papaioannou D,
Nicolet D, Kohlschmidt J, Yan PS, Mrózek K, Bucci D, Carroll AJ,
Baer MR, et al: Expression and prognostic impact of lncRNAs in
acute myeloid leukemia. Proc Natl Acad Sci USA. 111:18679–18684.
2014. View Article : Google Scholar : PubMed/NCBI
|
|
45
|
Du T, Zhang B, Zhang S, Jiang X, Zheng P,
Li J, Yan M, Zhu Z and Liu B: Decreased expression of long
non-coding RNA WT1-AS promotes cell proliferation and invasion in
gastric cancer. Biochim Biophys Acta. 1862:12–19. 2016. View Article : Google Scholar : PubMed/NCBI
|