Introduction
Lung adenocarcinoma (LUAC) is the leading cause of
cancer-associated mortality worldwide and is one major subtype of
non-small cell lung cancer, defined by distinct pathological
characteristics, including mixed subtype, acinar, papillary and
lepidic patterns, and the solid predominant subtype with mucin
production (1,2). As the most common type of lung cancer,
accounting for 40% of all non-small cell lung cancer cases as
determined by the World Health Organization in 2012, the incidence
of LUAC is on the rise mainly in women and non-smokers (3,4). The
5-year overall survival rate is ~15%, but has not improved in
recent years. Since approximately two-thirds of LUAC patients are
diagnosed at advanced cancer stages, and local or distant tumor
recurrence can frequently present following surgical resection, the
prognosis is poor for the majority of patients. Therefore,
identifying LUAC at earlier pathological stages can greatly reduce
overall mortality rates. Given that adenocarcinoma is more
difficult to detect by clinical approaches, including bronchoscopy,
sputum cytology and computed tomography, the major obstacle in LUAC
management is the lack of an adequate method for its early
detection and prognosis.
Non-coding RNAs (ncRNAs) have become increasingly
relevant targets of study due to their specialized and well-adapted
biological roles in tumor development (5). Generally, ncRNAs can be divided into
two major classes based on their size: Small ncRNAs and long ncRNAs
(lncRNAs). Small ncRNAs consist of several subtypes, including
microRNAs (miRNAs/miRs), ribosomal RNAs, small nucleolar RNAs and
transfer ribonucleic acids (6). An
ever-increasing body of evidence demonstrates the key role of
miRNAs in tumor biology contributing to tumorigenesis by modulating
oncogenic and tumor suppressor pathways (7–9).
However, research on lncRNAs is in its infancy compared with miRNA
research. Importantly, lncRNAs have been implicated in several
biological processes from pluripotency to immune responses, and are
predicted to be involved in more complex mechanisms such as tumor
regulation (10,11). One of the best-studied lncRNAs,
X-inactive specific transcript, is involved in the development of
several cancer types through recruitment of chromatin-modifying
complexes to inactivate an entire chromosome in the majority of
cells (12).
Since ncRNAs serve various important roles in tumor
development, interactions between miRNAs and lncRNAs have become an
area of focus for the identification of putative ncRNA biomarkers
for tumor prognosis. As our understanding of the transcriptome
space has expanded and the development of RNA-sequencing technology
has taken place, a novel hypothesis known as the competing
endogenous RNA (ceRNA) hypothesis has emerged in recent years
(13,14). One lncRNA, hepatocellular carcinoma
upregulated lncRNA, has been shown to be one of the most clearly
overexpressed ncRNAs in hepatocellular carcinoma, and contains
miR-372-binding sites to reduce miR-372 expression and activity
(15). Another lncRNA and ceRNA,
papillary thyroid carcinoma susceptibility candidate 3, has been
identified to be downregulated in thyroid cancer and mediates the
expression of miR-574-5p (16). In
addition to lncRNA ceRNAs, certain miRNAs and mRNAs also have ceRNA
capacity. Several lncRNA ceRNAs have been found to be involved in
the diagnosis and prognosis of patients with lung tumors (17,18).
Nevertheless, the prognostic value of lncRNA ceRNAs in LUAC has not
yet been fully investigated.
In the current study, to identify LUAC-specific
lncRNAs involved in ceRNA crosstalk, RNA-sequencing data and
clinical data were obtained from The Cancer Genome Atlas (TCGA)
database and an lncRNA-mRNA-miRNA ceRNA network was constructed.
Combined with survival analysis, analyses of these data identified
a 9-lncRNA signature (LASiglnc-9) with prognostic value to predict
overall survival in patients with LUAC.
Materials and methods
Data source and patient
information
All RNA expression data and patient clinical data
were obtained from TCGA Data Portal (https://portal.gdc.cancer.gov), which is open-access
and publicly available. LUAC-related RNA-sequencing data were
downloaded with the key words ‘lung adenocarcinoma’ and ‘RNA-seq’.
A total of 594 LUAC patients were included and sample exclusion
criteria were follows: i) Patients who were not histologically
diagnosed with LUAC; ii) patients who suffered from one or more
malignancies besides LUAC; and iii) samples without complete data.
Gene expression profiles for 535 tumor samples and 59 adjacent
non-tumor samples, and miRNA expression data for 521 LUAC samples
and 46 adjacent normal samples were obtained. In addition, clinical
data for 482 LUAC patients, including 260 male and 222 female
patients, were also downloaded from TCGA Data Coordinating Center.
There were 170 patients with lymphatic metastasis and 312 patients
with non-lymphatic metastasis. Additionally, 164 patients presented
with distant organ metastases and 318 patients presented with
non-distant metastasis. Patients were classified as stage I–II
(well and moderately differentiated LUAC, n=377) and stage III–IV
(poorly differentiated LUAC, n=105) according to guidelines from
the Union for International Cancer Control (19).
Differential expression analysis of
LUAC data
To determine the differential expression of mRNAs,
lncRNAs and miRNAs between tumor and adjacent normal tissues in
LUAC samples, a Bioconductor package edgeR (version 3.6) (20) was used for the gene differential
expression analysis. A P-value of <0.01 and |logFC|>2 were
set as the cut-off criteria. Volcano plots were drawn using gplots
package (version 3.0.1; http://cran.r-project.org/web/packages/gplots/index.html).
Heatmaps were constructed using pheatmap package (version 1.0.8;
http://cran.r-project.org/web/packages/pheatmap/index.html).
ceRNA network construction and
functional annotation
Considering the important role of interactions
between lncRNAs, mRNAs and miRNAs in tumorigenesis and development,
the ceRNA networks of LUAC were constructed based on three steps:
i) LUAC-specific lncRNAs with an absolute P-value of <0.01 and
|logFC|>2 were retained; ii) miRcode online tool (http://www.mircode.org) was applied to predict
potential target miRNAs of differentially expressed lncRNAs and to
predict lncRNA-miRNA interactions; and iii) potential mRNAs
targeted by miRNAs were retrieved from miRDB (http://www.mirdb.org/index.html), miRTarBase
(http://mirtarbase.mbc.nctu.edu.tw/php/index.php) and
TargetScan (http://www.targetscan.org/vert_71/). Finally, miRNAs
that are negatively regulated by lncRNAs and mRNAs were selected to
construct the ceRNA network. To visualize the lncRNA-mRNA-miRNA
ceRNA network, cytoscape v3.5.1 (21) was used for network construction. To
further study the biological roles of differentially expressed
mRNAs targeted by lncRNAs and miRNAs in the ceRNA network, the
Database for Annotation, Visualization and Integrated Discovery
(DAVID, http://david.abcc.ncifcrf.gov/) was used. Kyoto
Encyclopedia of Genes and Genomes (KEGG) and Gene Ontology (GO)
biological processes were annotated at significance levels of
P<0.05.
Survival analysis
Kaplan-Meier survival analysis and a log-rank test
were used to evaluate the association between expression levels of
differentially expressed mRNAs, lncRNAs and miRNAs in the ceRNA
network and the overall survival of the patients. To obtain more
detail on the role of lncRNAs in LUAC, the univariate Cox's
proportional hazards regression model with a significant level set
at 0.01 was applied to analyze differentially expressed lncRNAs and
mRNAs from the ceRNA network that were associated with overall
survival. Next, the selected differentially expressed mRNAs and
lncRNAs were fit into a multivariate Cox regression analysis to
build the lncRNA-based prognostic signature and lncRNA-mRNA-based
prognostic signature. The prognostic risk score for predicting
overall survival was calculated using the following formula: Risk
score = exp1*β1 +
exp2*β2+…+ expn*βn,
where exp indicates expression level and β is the regression
coefficient. The linear combination of expression levels of
LUAC-specific mRNAs or lncRNAs with estimated regression
coefficients was obtained from the aforementioned multivariate Cox
regression analysis (22). LUAC
patients were divided into high-risk and low-risk groups using the
median risk score (0.959 for the LASiglnc-9 signature; 0.923 for
the LASiglnc2-m3 signature). The time-dependent receiver operating
characteristic (ROC) curves were drawn using the R package
‘survival-ROC’ to compare the specificity and sensitivity of the
risk prediction of the survival rate for specific lncRNAs and mRNAs
in the model. Meanwhile, univariate and multivariate Cox's analyses
were applied for prognostic prediction of risk score and clinical
features, including age, gender, stage of pathology and
Tumor-Node-Metastasis (TNM) staging system (23). Hazard ratios (HRs) and 95%
confidence intervals (CIs) were assessed using the Cox regression
model. All statistical analyses were conducted with R software
(version 3.4.1).
Results
Identification of differentially
expressed RNAs in LUAC from RNA-seq data
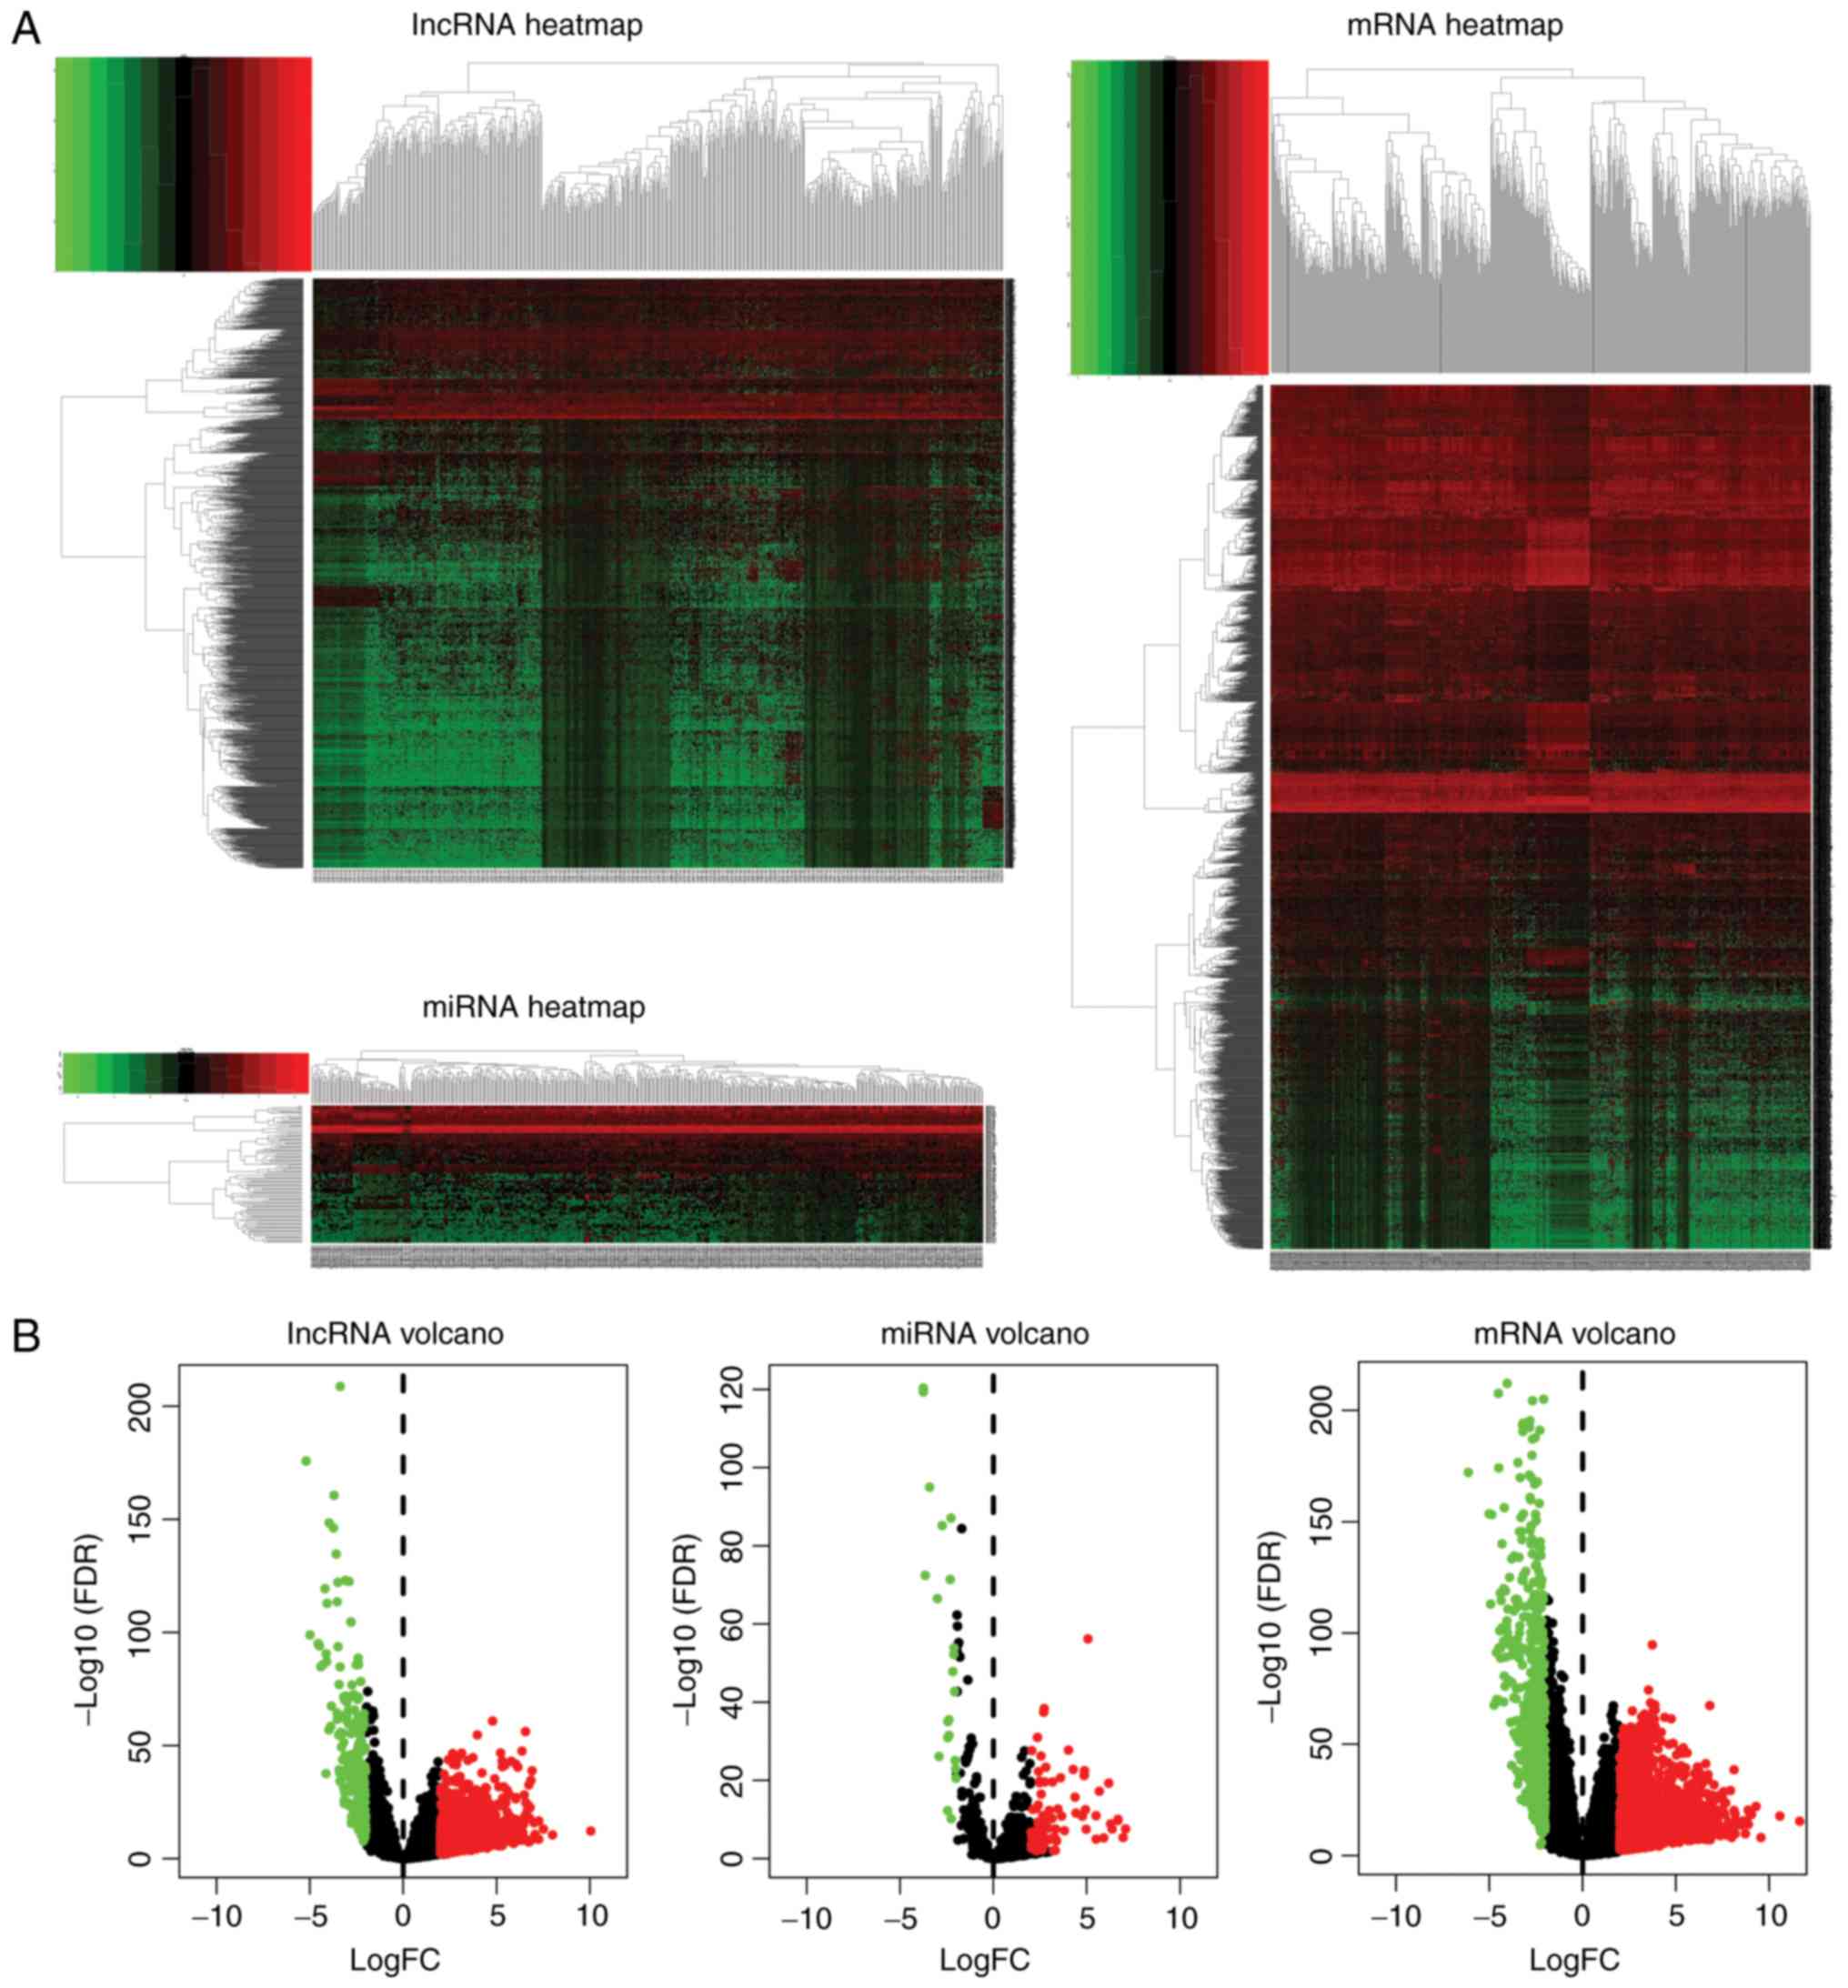
In the present study, RNA-seq data, including gene
and miRNA expression data, was retrieved from TCGA data portal for
the purpose of finding biomarkers associated with tumor prognosis.
Compared with adjacent normal samples, the LUAC samples contained a
total of 2,507 differentially expressed mRNAs (1,977 upregulated
and 527 downregulated mRNAs), 1,633 differentially expressed
lncRNAs (1,425 upregulated and 208 downregulated lncRNAs) and 113
differentially expressed miRNAs (88 upregulated and 23
downregulated miRNAs). The differentially expressed lncRNAs, miRNAs
and mRNAs showed clear separation in the heat maps (Fig. 1A) and volcano plots (Fig. 1B).
miRNA target prediction and ceRNA
network
To predict the lncRNAs targeted by miRNAs, the
miRcode online tool was used and 134 lncRNAs, including 115
upregulated and 19 downregulated lncRNAs, were selected to build
the ceRNA network (Table I). Next,
the miRDB, miRTarBase and TargetScan online tools were used to
predict mRNAs targeted by miRNAs. The targeting associations
between 21 miRNAs (17 upregulated and 4 downregulated miRNAs;
Table II) and 34 mRNAs (25
upregulated and 9 downregulated mRNAs; Table III) were obtained and selected for
ceRNA network construction.
 | Table I.Differentially expressed lncRNAs in
competing endogenous RNA network of lung adenocarcinoma. |
Table I.
Differentially expressed lncRNAs in
competing endogenous RNA network of lung adenocarcinoma.
| lncRNA | logFC | P-value | FDR |
|---|
| DSCAM-AS1 | 8.00 |
4.74×10⁻¹² |
2.80×10⁻¹¹ |
| AL160271.1 | 6.91 |
5.96×10⁻¹⁰ |
2.64×10⁻⁹ |
| HOTAIR | 6.77 |
8.85×10⁻²⁰ |
1.28×10⁻¹⁸ |
| AC061975.6 | 6.53 |
5.32×10⁻²¹ |
8.45×10⁻²⁰ |
| CLDN10-AS1 | 6.494 |
2.04×10⁻³⁰ |
6.67×10⁻²⁹ |
| POU6F2-AS2 | 6.18 |
1.27×10⁻¹⁴ |
1.02×10⁻¹³ |
| RMRP | 5.91 |
4.63×10⁻⁸ |
1.58×10⁻⁷ |
| NOVA1-AS1 | 5.84 |
1.20×10⁻¹⁶ |
1.23×10⁻¹⁵ |
| MUC2 | 5.81 |
4.96×10⁻¹⁴ |
3.74×10⁻¹³ |
| LINC00392 | 5.80 |
1.09×10⁻⁸ |
4.04×10⁻⁸ |
| AC020907.1 | 5.79 |
9.50×10−46 |
7.61×10−44 |
| ERVMER61-1 | 5.70 |
2.43×10⁻¹⁰ |
1.13×10⁻⁹ |
| UCA1 | 5.69 |
6.01×10⁻²¹ |
9.50×10⁻²⁰ |
| LINC00491 | 5.60 |
3.86×10⁻¹⁵ |
3.34×10⁻¹⁴ |
| LINC00501 | 5.28 |
1.00×10⁻¹⁷ |
1.15×10⁻¹⁶ |
| LINC00221 | 5.19 |
6.98×10⁻¹⁰ |
3.06×10⁻⁹ |
| AL513123.1 | 5.17 |
1.40×10⁻¹⁵ |
1.29×10⁻¹⁴ |
| NAALADL2-AS2 | 5.07 |
1.22×10⁻¹⁶ |
1.25×10⁻¹⁵ |
| MIR137HG | 4.97 |
5.03×10⁻¹⁵ |
4.30×10⁻¹⁴ |
| LINC00393 | 4.80 |
3.61×10⁻¹⁵ |
1.43×10⁻⁸ |
| ERVH48-1 | 4.74 |
4.28×10⁻¹⁶ |
4.12×10⁻¹⁵ |
| AL356133.2 | 4.72 |
1.42×10⁻⁹ |
6.02×10⁻⁹ |
| LINC00518 | 4.48 |
9.96×10⁻¹⁴ |
7.17×10⁻¹³ |
| DLX6-AS1 | 4.44 |
3.14×10⁻¹⁶ |
3.07×10⁻¹⁵ |
| LINC00460 | 4.43 |
9.38×10⁻¹⁹ |
1.22×10⁻¹⁷ |
| LINC00355 | 4.36 |
4.32×10⁻¹⁰ |
1.95×10⁻⁹ |
| LINC00466 | 4.29 |
1.57×10⁻¹⁶ |
1.58×10⁻¹⁵ |
| LINC00483 | 4.25 |
7.95×10⁻¹³ |
5.15×10⁻¹² |
| POU6F2-AS1 | 4.16 |
2.36×10⁻¹² |
1.44×10⁻¹¹ |
| LINC00461 | 4.04 |
7.80×10⁻²⁴ |
1.59×10⁻²² |
| AC087269.1 | 3.81 |
9.38×10⁻²² |
1.59×10⁻²⁰ |
| AC084262.1 | 3.74 |
1.64×10⁻¹⁸ |
2.07×10⁻¹⁷ |
| AC010145.1 | 3.73 |
1.07×10⁻⁵ |
2.58×10⁻⁵ |
| LINC00473 | 3.65 |
6.95×10⁻⁸ |
2.32×10⁻⁷ |
| MYCNOS | 3.62 |
9.13×10⁻¹² |
5.17×10⁻¹¹ |
| LINC00160 | 3.58 |
7.19×10⁻²¹ |
1.13×10⁻¹⁹ |
| HOTTIP | 3.56 |
1.13×10⁻⁷ |
3.65×10⁻⁷ |
| AC080129.1 | 3.48 |
1.78×10⁻⁹ |
7.43×10⁻⁹ |
| AC006372.1 | 3.43 |
2.63×10⁻⁷ |
8.13×10⁻⁷ |
| LINC00525 | 3.42 |
1.30×10⁻²³ |
2.55×10⁻²² |
| LINC00524 | 3.41 |
1.04×10⁻¹⁰ |
5.14×10⁻¹⁰ |
| WASIR2 | 3.40 |
2.06×10⁻³⁵ |
9.20×10⁻³⁴ |
| H19 | 3.35 |
3.20×10⁻¹¹ |
1.68×10⁻¹⁰ |
| AC022148.1 | 3.34 |
2.47×10⁻¹³ |
1.71×10⁻¹² |
| LINC00200 | 3.33 |
5.05×10⁻⁵ |
1.10×10⁻⁴ |
| KIF25-AS1 | 3.32 |
1.98×10⁻¹⁰ |
9.34×10⁻¹⁰ |
| LINC00536 | 3.30 |
4.92×10⁻¹¹ |
2.51×10⁻¹⁰ |
| LINC00308 | 3.21 |
1.15×10⁻⁷ |
3.74×10⁻⁷ |
| FER1L6-AS1 | 3.21 |
4.93×10⁻⁵ |
1.08×10⁻⁴ |
| SAMSN1-AS1 | 3.18 |
1.87×10⁻¹¹ |
1.02×10⁻¹⁰ |
| AC026320.1 | 3.16 |
2.03×10⁻⁶ |
5.53×10⁻⁶ |
| ABCA9-AS1 | 3.16 |
5.38×10⁻¹⁰ |
2.40×10⁻⁹ |
| STEAP2-AS1 | 3.14 |
2.57×10⁻¹⁹ |
3.58×10⁻¹⁸ |
| LINC00470 | 3.08 |
2.05×10⁻⁸ |
7.33×10⁻⁸ |
| C20orf197 | 3.04 |
7.90×10⁻¹⁹ |
1.03×10⁻¹⁷ |
| GRM7-AS3 | 3.03 |
6.73×10⁻⁷ |
1.96×10⁻⁶ |
| LSAMP-AS1 | 3.02 |
6.99×10⁻⁸ |
2.33×10⁻⁷ |
| AL354707.1 | 2.98 |
2.42×10⁻²⁹ |
7.35×10⁻²⁸ |
| FNDC1-IT1 | 2.96 |
2.65×10⁻¹⁴ |
2.06×10⁻¹³ |
| C2orf48 | 2.94 |
1.70×10⁻²⁸ |
4.95×10⁻²⁷ |
| LINC00488 | 2.94 |
4.10×10⁻⁵ |
9.08×10⁻⁵ |
| CACNA1C-IT3 | 2.91 |
2.60×10⁻⁵ |
5.93×10⁻⁵ |
| CHODL-AS1 | 2.90 |
3.14×10⁻⁷ |
9.61×10⁻⁷ |
| LINC00051 | 2.90 |
1.61×10⁻⁶ |
4.42×10⁻⁶ |
| AP002478.1 | 2.87 |
1.54×10⁻⁹ |
6.49×10⁻⁹ |
| AC112721.1 | 2.85 |
1.18×10⁻¹⁴ |
9.56×10⁻¹⁴ |
| LINC00337 | 2.85 |
9.70×10⁻²² |
1.64×10⁻²⁰ |
| AP000553.1 | 2.82 |
2.69×10⁻²⁸ |
7.68×10⁻²⁷ |
| TDRG1 | 2.77 |
6.14×10⁻⁶ |
1.55×10⁻⁵ |
| E2F3-IT1 | 2.76 |
2.17×10⁻⁶ |
5.87×10⁻⁶ |
| AL021395.1 | 2.70 |
8.27×10⁻⁶ |
1.75×10⁻⁴ |
| PVT1 | 2.66 |
3.20×10−49 |
3.03×10−47 |
| TBL1XR1-AS1 | 2.66 |
1.99×10⁻⁹ |
8.25×10⁻⁹ |
| HNF1A-AS1 | 2.65 |
1.65×10⁻¹⁰ |
7.91×10⁻¹⁰ |
| AL139002.1 | 2.65 |
6.36×10⁻⁴ |
1.16×10⁻³ |
| LINC00319 | 2.62 |
1.46×10⁻⁹ |
6.19×10⁻⁹ |
| DPYD-AS2 | 2.57 |
2.80×10⁻⁵ |
6.35×10⁻⁵ |
| DSCR10 | 2.54 |
5.21×10⁻⁵ |
1.14×10⁻⁴ |
| IGF2-AS | 2.54 |
2.15×10⁻⁶ |
5.82×10⁻⁶ |
| LINC00440 | 2.48 |
9.96×10⁻⁵ |
2.08×10⁻⁴ |
| LPP-AS1 | 2.45 |
2.82×10⁻⁴ |
5.46×10⁻⁴ |
| VCAN-AS1 | 2.45 |
1.41×10⁻⁸ |
5.15×10⁻⁸ |
| LINC00519 | 2.45 |
7.77×10⁻¹⁶ |
7.32×10⁻¹⁵ |
| AL353803.1 | 2.41 |
1.09×10⁻⁸ |
4.04×10⁻⁸ |
| IL20RB-AS1 | 2.40 |
8.01×10⁻⁷ |
2.31×10⁻⁶ |
| ARHGEF3-AS1 | 2.39 |
1.13×10⁻⁴ |
2.34×10⁻⁴ |
| CHL1-AS1 | 2.38 |
1.43×10⁻¹⁰ |
6.93×10⁻¹⁰ |
| ATG10-AS1 | 2.37 |
6.38×10⁻⁴ |
1.17×10⁻³ |
| EGOT | 2.33 |
4.72×10⁻¹⁵ |
4.05×10⁻¹⁴ |
| C11orf44 | 2.33 |
2.95×10⁻⁷ |
9.05×10⁻⁷ |
| SOX21-AS1 | 2.29 |
1.91×10⁻¹⁰ |
9.02×10⁻¹⁰ |
| GRM5-AS1 | 2.27 |
4.77×10⁻⁹ |
1.86×10⁻⁸ |
| U52111.1 | 2.26 |
7.60×10⁻²⁶ |
1.82×10⁻²⁴ |
| AC007731.1 | 2.25 |
5.46×10⁻⁵ |
1.19×10⁻⁴ |
| AC012640.1 | 2.23 |
6.87×10⁻¹⁷ |
7.26×10⁻¹⁶ |
| FOXP1-IT1 | 2.23 |
4.71×10⁻⁷ |
1.40×10⁻⁶ |
| AL117190.1 | 2.22 |
5.40×10⁻⁸ |
1.83×10⁻⁷ |
| C1orf220 | 2.19 |
7.28×10−40 |
4.06×10−38 |
| AC092535.1 | 2.18 |
1.18×10⁻¹² |
7.50×10⁻¹² |
| LINC00485 | 2.15 |
1.02×10⁻⁴ |
2.12×10⁻⁴ |
| LINC00330 | 2.14 |
6.66×10⁻⁹ |
2.55×10⁻⁸ |
| AL391152.1 | 2.14 |
5.84×10⁻⁸ |
1.97×10⁻⁷ |
| ZBTB20-AS3 | 2.10 |
3.01×10⁻³ |
4.95×10⁻³ |
| SYNPR-AS1 | 2.08 |
2.06×10⁻¹³ |
1.44×10⁻¹² |
| AL139385.1 | 2.07 |
4.99×10⁻¹³ |
3.31×10⁻¹² |
| AC110921.1 | 2.07 |
1.13×10⁻⁴ |
2.33×10⁻⁴ |
| MEG3 | 2.06 |
1.96×10⁻¹⁰ |
9.25×10⁻¹⁰ |
| HECW1-IT1 | 2.04 |
9.40×10⁻⁴ |
1.67×10⁻³ |
| ANO1-AS2 | 2.03 |
2.62×10⁻⁵ |
5.96×10⁻⁵ |
| ARHGAP26-AS1 | 2.02 |
1.51×10⁻⁷ |
4.80×10⁻⁷ |
| LINC00184 | 2.01 |
7.45×10⁻¹¹ |
3.74×10⁻¹⁰ |
| AL365356.1 | 2.01 |
1.74×10⁻⁷ |
5.48×10⁻⁷ |
| C10orf91 | 2.01 |
2.52×10⁻¹³ |
1.74×10⁻¹² |
| AC016773.1 | 2.01 |
3.08×10⁻³¹ |
1.06×10⁻²⁹ |
| AP000525.1 | 2.00 |
6.49×10⁻¹² |
3.75×10⁻¹¹ |
| HHATL-AS1 | −2.00 |
6.24×10⁻¹⁴ |
4.62×10⁻¹³ |
| AGAP11 | −2.07 |
1.06×10⁻³⁵ |
4.79×10⁻³⁴ |
| RMST | −2.10 |
2.26×10⁻¹⁷ |
2.51×10⁻¹⁶ |
| AC025431.1 | −2.12 |
2.42×10⁻¹⁵ |
2.15×10⁻¹⁴ |
| C5orf64 | −2.12 |
1.67×10−40 |
9.91×10−39 |
| TTTY16 | −2.14 |
3.44×10⁻⁹ |
1.37×10⁻⁸ |
| LINC00472 | −2.17 |
3.92×10−44 |
2.89×10−42 |
| AC004832.1 | −2.20 |
8.05×10⁻²² |
1.37×10⁻²⁰ |
| MED4-AS1 | −2.28 |
6.93×10−63 |
1.04×10−60 |
| SRGAP3-AS2 | −2.30 |
2.17×10⁻¹⁴ |
1.70×10⁻¹³ |
| LINC00211 | −2.31 |
2.04×10−36 |
9.54×10⁻³⁵ |
| MYO16-AS1 | −2.36 |
5.18×10⁻¹⁷ |
5.57×10⁻¹⁶ |
| AP003064.2 | −2.46 |
9.03×10⁻²⁷ |
2.33×10⁻²⁵ |
| ADAMTS9-AS1 | −2.77 |
4.41×10−75 |
1.20×10−72 |
| NAV2-AS2 | −2.78 |
8.94×10−44 |
6.27×10−42 |
| AC105206.1 | −2.96 |
5.33×10⁻²⁷ |
1.41×10⁻²⁵ |
| AL109754.1 | −2.96 |
2.39×10−43 |
1.63×10−41 |
| AP000438.1 | −3.01 |
2.80×10−72 |
6.44×10−70 |
| LINC00163 | −3.43 |
2.89×10−80 |
9.25×10−78 |
| Table II.Differentially expressed miRNAs in
the competing endogenous RNA network of lung adenocarcinoma. |
Table II.
Differentially expressed miRNAs in
the competing endogenous RNA network of lung adenocarcinoma.
| miRNA | logFC | P-value | FDR |
|---|
| hsa-mir-372 | 7.08 |
5.63×10⁻⁹ |
2.36×10⁻⁸ |
| hsa-mir-122 | 5.91 |
1.51×10⁻⁶ |
4.54×10⁻⁶ |
| hsa-mir-373 | 5.50 |
3.48×10⁻⁶ |
9.72×10⁻⁶ |
| hsa-mir-210 | 5.07 |
1.11×10−58 |
6.33×10−57 |
| hsa-mir-137 | 4.42 |
3.31×10⁻¹³ |
2.06×10⁻¹² |
| hsa-mir-31 | 4.37 |
2.23×10⁻¹⁷ |
1.81×10⁻¹⁶ |
| hsa-mir-301b | 3.60 |
1.99×10⁻²² |
2.06×10⁻²¹ |
| hsa-mir-215 | 2.95 |
3.54×10⁻⁹ |
1.52×10⁻⁸ |
| hsa-mir-192 | 2.81 |
5.71×10⁻¹¹ |
2.98×10⁻¹⁰ |
| hsa-mir-205 | 2.73 |
6.86×10⁻⁹ |
2.78×10⁻⁸ |
| hsa-mir-96 | 2.72 |
1.42×10−40 |
3.74×10−39 |
| hsa-mir-489 | 2.55 |
1.06×10⁻⁷ |
3.76×10⁻⁷ |
| hsa-mir-503 | 2.48 |
1.45×10⁻²¹ |
1.43×10⁻²⁰ |
| hsa-mir-216b | 2.44 |
1.53×10⁻⁵ |
4.05×10⁻⁵ |
| hsa-mir-187 | 2.38 |
8.58×10⁻¹¹ |
4.38×10⁻¹⁰ |
| hsa-mir-183 | 2.36 |
4.29×10⁻³³ |
9.46×10⁻³² |
| hsa-mir-182 | 2.05 |
1.31×10⁻²⁹ |
2.25×10⁻²⁸ |
| hsa-mir-195 | −2.27 |
4.49×10−90 |
7.68×10−88 |
| hsa-mir-143 | −2.75 |
4.79×10−88 |
6.56×10−86 |
| hsa-mir-184 | −2.91 |
4.74×10⁻²⁸ |
7.20×10⁻²⁷ |
| hsa-mir-144 | −3.42 |
4.43×10−98 |
1.01×10−95 |
| Table III.Differentially expressed mRNA in the
competing endogenous RNA network of lung adenocarcinoma. |
Table III.
Differentially expressed mRNA in the
competing endogenous RNA network of lung adenocarcinoma.
| mRNA | logFC | P-value | FDR |
|---|
| HOXC13 | 6.96 |
1.73×10⁻²² |
1.34×10⁻²¹ |
| SALL1 | 5.81 |
6.30×10⁻¹⁷ |
3.21×10⁻¹⁶ |
| HOXA10 | 4.22 |
4.90×10⁻²² |
3.67×10⁻²¹ |
| NPTX1 | 3.76 |
4.78×10⁻¹⁶ |
2.26×10⁻¹⁵ |
| PSAT1 | 3.52 |
3.76×10−48 |
1.06×10−46 |
| ELAVL2 | 3.47 |
1.09×10⁻¹⁵ |
5.03×10⁻¹⁵ |
| PBK | 3.41 |
3.11×10−43 |
7.08×10−42 |
| CCNE1 | 3.31 |
1.55×10−42 |
3.43×10−41 |
| CEP55 | 3.28 |
1.30×10−55 |
5.03×10−54 |
| SLC7A11 | 3.09 |
2.38×10⁻²³ |
1.96×10⁻²² |
| CCNB1 | 3.00 |
8.18×10−55 |
3.01×10−53 |
| RET | 2.97 |
1.80×10⁻¹³ |
6.93×10⁻¹³ |
| COL1A1 | 2.91 |
9.49×10⁻³² |
1.27×10⁻³⁰ |
| E2F7 | 2.76 |
3.91×10⁻³¹ |
5.04×10⁻³⁰ |
| CLSPN | 2.75 |
4.81×10−40 |
9.63×10−39 |
| TBX18 | 2.69 |
2.39×10⁻¹⁰ |
7.10×10⁻¹⁰ |
| KCNQ5 | 2.65 |
4.31×10⁻²⁰ |
2.80×10⁻¹⁹ |
| KIF23 | 2.61 |
6.02×10−43 |
1.35×10−41 |
| CBX2 | 2.52 |
1.99×10⁻²⁵ |
1.86×10⁻²⁴ |
| CDC25A | 2.37 |
1.98×10−37 |
3.51×10−36 |
| CHEK1 | 2.26 |
1.69×10−43 |
3.89×10−42 |
| MCM4 | 2.24 |
4.41×10−47 |
1.17×10−45 |
| COL5A2 | 2.20 |
5.53×10⁻²⁸ |
6.09×10⁻²⁷ |
| PFKP | 2.17 |
2.44×10⁻³³ |
3.57×10⁻³² |
| MIXL1 | 2.00 |
5.19×10⁻¹⁷ |
2.66×10⁻¹⁶ |
| PROK2 | −2.02 |
1.49×10⁻²⁴ |
1.32×10⁻²³ |
| SLC1A1 | −2.17 |
1.86×10−50 |
5.75×10−49 |
| OSCAR | −2.20 |
3.65×10−67 |
2.25×10−65 |
| BDNF | −2.31 |
2.27×10⁻³² |
3.15×10⁻³¹ |
| TGFBR3 | −2.53 |
1.67×10−87 |
1.77×10−85 |
| SELE | −2.90 |
2.85×10−63 |
1.50×10−61 |
| RS1 | −3.70 |
1.04×10−94 |
1.30×10−92 |
| TMEM100 | −4.31 |
1.71×10−143 |
7.55×10−141 |
| SERTM1 | −4.74 |
3.04×10−70 |
2.05×10−68 |
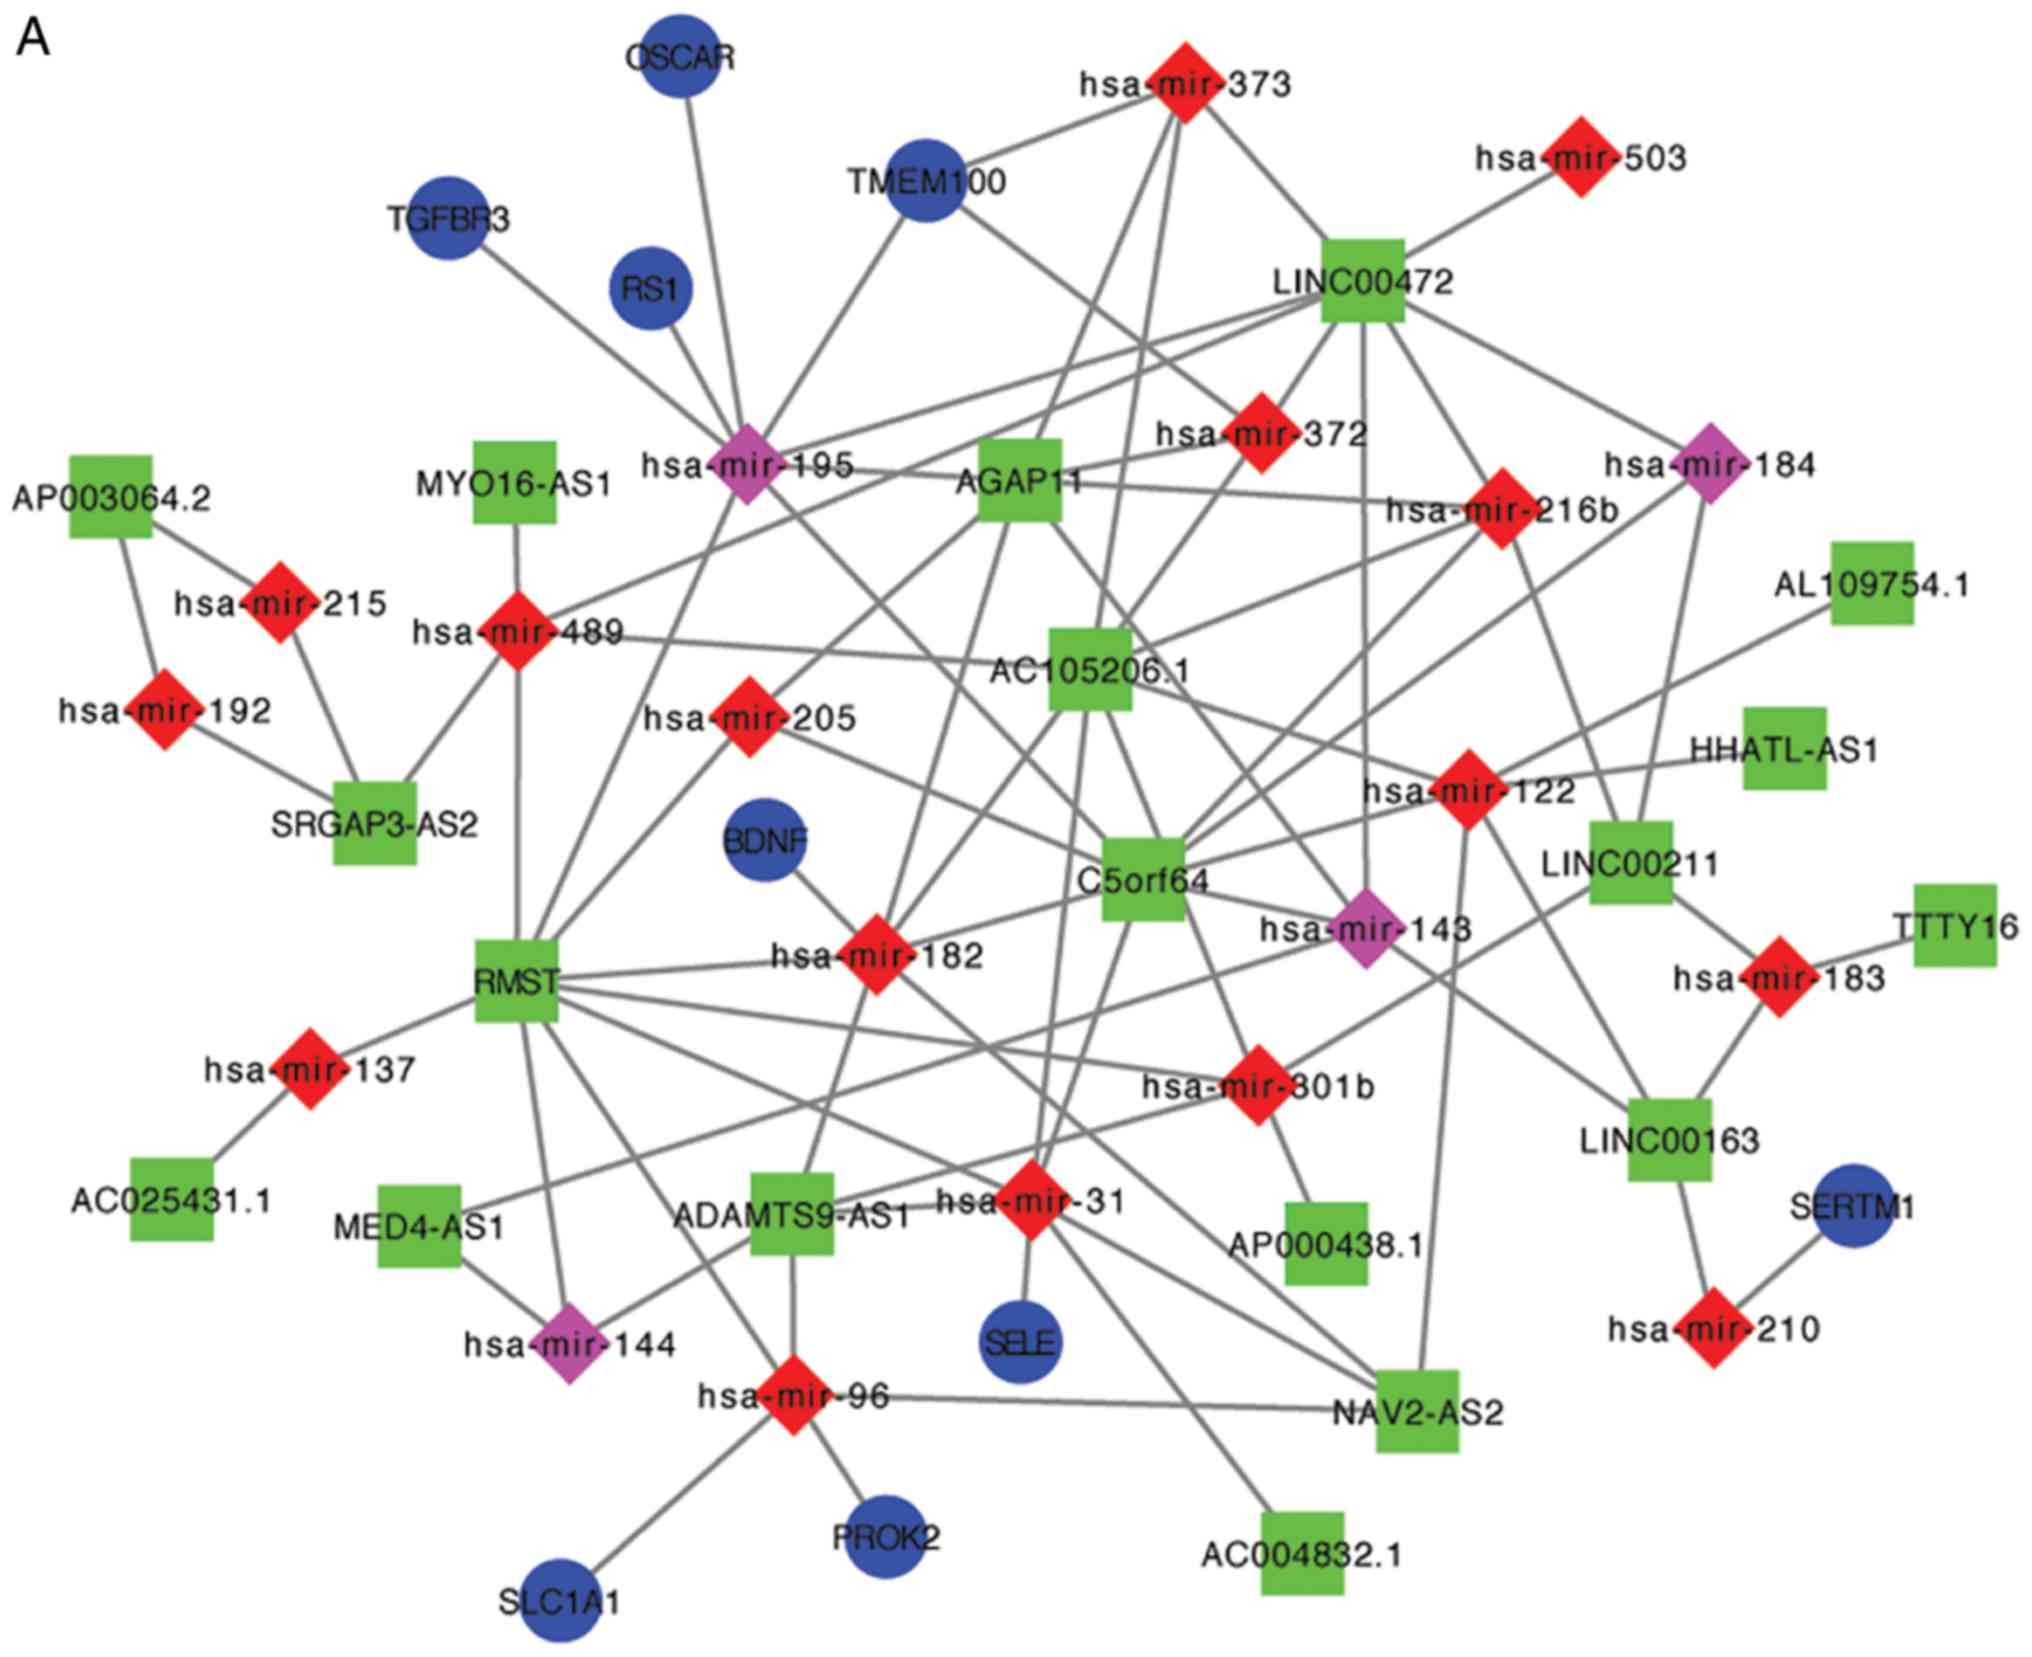
Subsequently, the interactions between 21 miRNAs and
134 lncRNAs were assessed, as well as those between 11 miRNAs and
34 mRNAs (data not shown). Based on these targeting associations,
the lncRNA-miRNA-mRNA ceRNA network was constructed using Cytoscape
version 3.5.1. According to the expression levels of differentially
expressed mRNAs, lncRNAs and miRNAs, two ceRNA networks, namely
overexpression and underexpression networks, were constructed
(Fig. 2).
Functional enrichment analysis
To further predict putative disease
prognosis-related biomarkers and the biological processes and
pathways to which they belong, functional enrichment analysis of
lncRNAs in the ceRNA networks was performed for GO terms and KEGG
pathways. Differentially expressed mRNAs targeted by lncRNAs in the
ceRNA networks were analyzed using the DAVID database. In total,
2,507 differentially expressed mRNAs were identified, including
1,977 upregulated and 527 downregulated mRNAs from LUAC tissues,
when compared with adjacent normal samples based on P-values of
<0.01 and |logFC|>2. Functional annotation indicated that
upregulated mRNAs were involved in 23 GO terms, most significantly
in ‘DNA replication’, ‘G1/S transition of the mitotic cell cycle’
and ‘cell cycle regulation’. These genes were mainly enriched in
‘cell cycle’ and ‘p53 signaling pathways’. By contrast,
downregulated genes were found to be associated with GO terms of
‘BMP signaling pathway’, ‘integral component of membrane’,
‘extracellular region’ and ‘perinuclear region of cytoplasm’
(Table IV).
| Table IV.Gene ontology and KEGG pathway
analysis of differentially expressed mRNA in the competing
endogenous RNA network of lung adenocarcinoma. |
Table IV.
Gene ontology and KEGG pathway
analysis of differentially expressed mRNA in the competing
endogenous RNA network of lung adenocarcinoma.
| Category | Term | Count | % | P-value | Genes |
|---|
| Upregulated |
|
BP_Direct | GO:0006260~DNA
replication | 4.00 | 0.09 | 0.00 | CLSPN, CHEK1, MCM4,
CDC25A |
|
| GO:0000082~G1/S
transition of mitotic cell cycle | 3.00 | 0.07 | 0.01 | CCNE1, MCM4,
CDC25A |
|
|
GO:0051726~regulation of cell cycle | 3.00 | 0.07 | 0.01 | CCNB1, CCNE1,
CDC25A |
|
| GO:0001501~skeletal
system development | 3.00 | 0.07 | 0.02 | HOXA10, COL1A1,
COL5A2 |
|
| GO:0000086~G2/M
transition of mitotic cell cycle | 3.00 | 0.07 | 0.02 | CCNB1, CHEK1,
CDC25A |
|
| GO:0031572~G2 DNA
damage checkpoint | 2.00 | 0.05 | 0.03 | CLSPN, CHEK1 |
|
| GO:0045893~positive
regulation of transcription, DNA-templated | 4.00 | 0.09 | 0.04 | CCNE1, RET, SALL1,
COL1A1 |
|
| GO:0006997~nucleus
organization | 2.00 | 0.05 | 0.04 | CHEK1, CEP55 |
|
| GO:0000281~mitotic
cytokinesis | 2.00 | 0.05 | 0.04 | KIF23, CEP55 |
|
| GO:0000077~DNA
damage checkpoint | 2.00 | 0.05 | 0.04 | CLSPN, CHEK1 |
|
| GO:0006270~DNA
replication initiation | 2.00 | 0.05 | 0.04 | CCNE1, MCM4 |
|
| GO:0045944~positive
regulation of transcription from RNA polymerase II promoter | 5.00 | 0.12 | 0.05 | HOXC13, E2F7,
SALL1, HOXA10, MIXL1 |
|
| GO:0007067~mitotic
nuclear division | 3.00 | 0.07 | 0.05 | PBK, CEP55,
CDC25A |
|
|
GO:0048565~digestive tract
development | 2.00 | 0.05 | 0.05 | CCNB1, MIXL1 |
|
CC_Direct |
GO:0005654~nucleoplasm | 11.00 | 0.25 | 0.00 | KIF23, CCNB1,
CLSPN, CCNE1, E2F7, SALL1, CHEK1, ELAVL2, CBX2, MCM4, CDC25A |
|
|
GO:0005634~nucleus | 15.00 | 0.35 | 0.00 | KIF23, E2F7, PFKP,
CHEK1, CBX2, PBK, MCM4, MIXL1, CDC25A, CCNB1, CCNE1, HOXC13, SALL1,
HOXA10, TBX18 |
|
|
GO:0005813~centrosome | 4.00 | 0.09 | 0.02 | KIF23, CCNB1,
CHEK1, CEP55 |
|
|
GO:0000792~heterochromatin | 2.00 | 0.05 | 0.03 | SALL1, CBX2 |
|
MF_Direct | GO:0005515~protein
binding | 20.00 | 0.46 | 0.01 | KIF23, CLSPN, RET,
E2F7, ELAVL2, CHEK1, CBX2, PBK, CEP55, MCM4, CDC25A, SLC7A11,
CCNB1, CCNE1, KCNQ5, HOXC13, SALL1, HOXA10, COL1A1, TBX18 |
|
| GO:0003677~DNA
binding | 7.00 | 0.16 | 0.03 | CLSPN, HOXC13,
E2F7, SALL1, CBX2, MCM4, TBX18 |
|
|
GO:0043565~sequence-specific DNA
binding | 4.00 | 0.09 | 0.04 | HOXC13, SALL1,
HOXA10, MIXL1 |
|
|
GO:0001077~transcriptional activator
activity, RNA polymerase II core promoter proximal region
sequence-specific binding | 3.00 | 0.07 | 0.04 | HOXC13, HOXA10,
MIXL1 |
|
| GO:0016301~kinase
activity | 3.00 | 0.07 | 0.05 | CCNE1, RET,
CHEK1 |
|
KEGG_Pathway | hsa04110:Cell
cycle | 5.00 | 0.12 | 0.00 | CCNB1, CCNE1,
CHEK1, MCM4, CDC25A |
|
| hsa04115:p53
signaling pathway | 3.00 | 0.07 | 0.00 | CCNB1, CCNE1,
CHEK1 |
| Downregulated |
|
BP_Direct | GO:0030509~BMP
signaling pathway | 2.00 | 0.13 | 0.03 | TGFBR3,
TMEM100 |
|
CC_Direct | GO:0016021~integral
component of membrane | 7.00 | 0.46 | 0.01 | BDNF, SERTM1,
OSCAR, TGFBR3, TMEM100, SLC1A1, SELE |
|
|
GO:0005576~extracellular region | 4.00 | 0.26 | 0.03 | PROK2, BDNF, OSCAR,
TGFBR3 |
|
|
GO:0048471~perinuclear region of
cytoplasm | 3.00 | 0.20 | 0.03 | BDNF, TMEM100,
SELE |
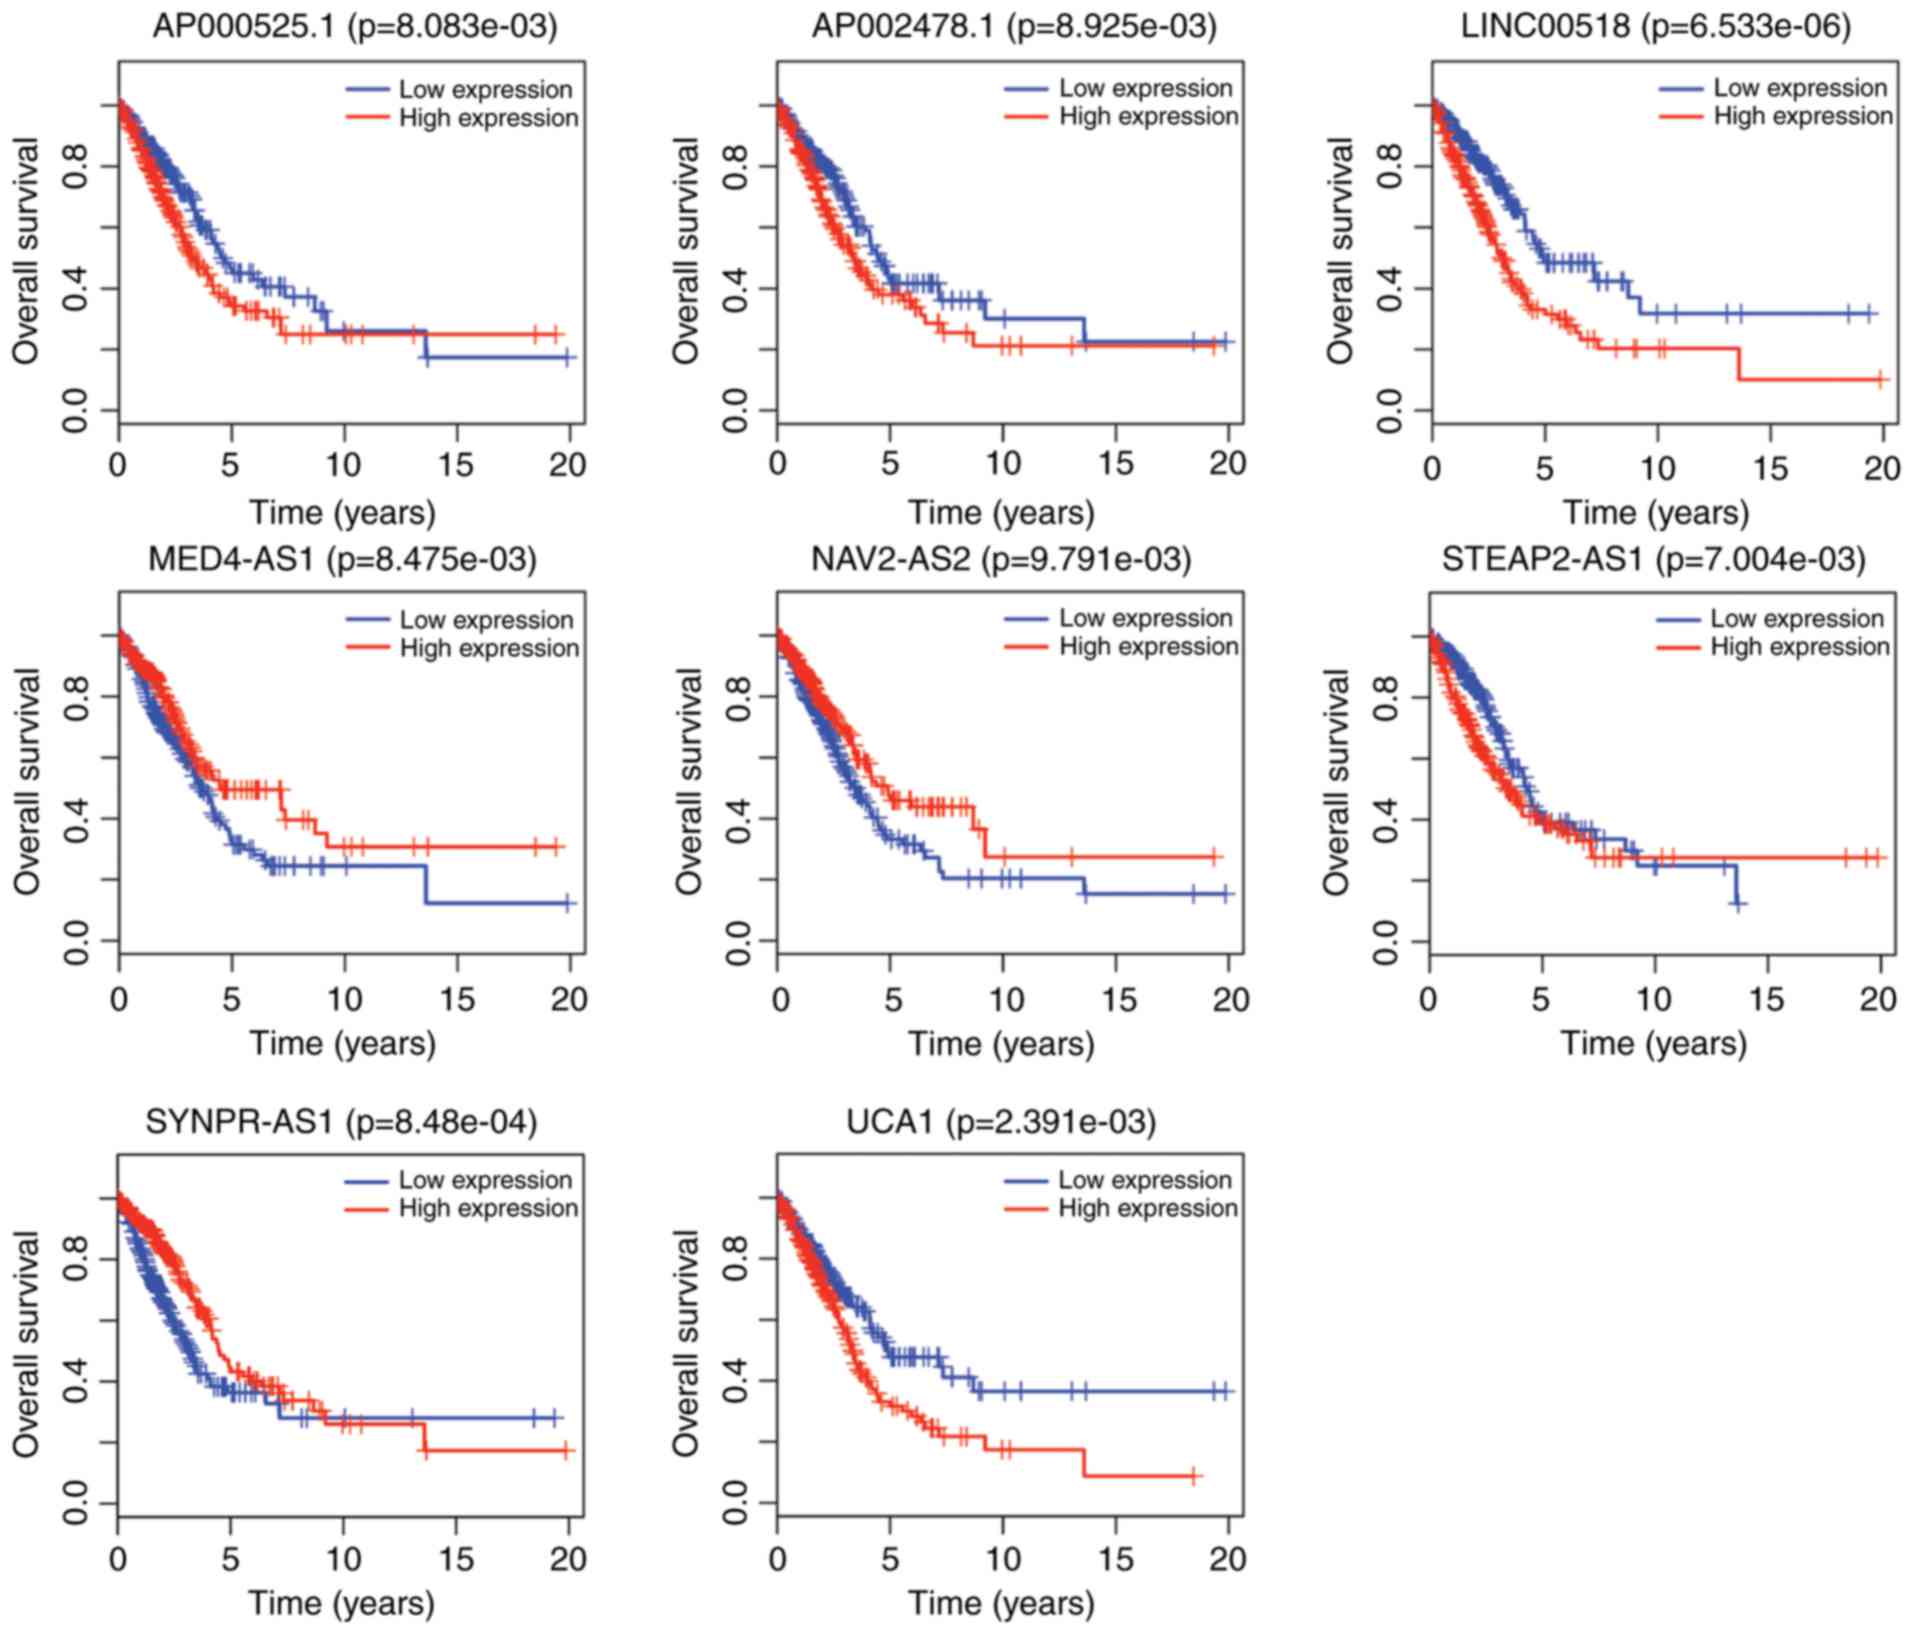
Determination and analysis of
predictive prognostic signature
Since the selected differentially expressed mRNAs,
lncRNAs and miRNAs in the ceRNA network exhibited distinct
expression patterns in patients with LUAC, these coding and
non-coding ceRNAs were analyzed using Kaplan-Meier and log-rank
test methods to predict the prognosis of such patients. A total of
8 differentially expressed lncRNA ceRNAs were identified, including
AP000525.1, AP002478.1, LINC00518, MED4-antisense 1 (AS1),
NAV2-AS2, STEAP2-AS1, SYNPR-AS1 and urothelial cancer-associated 1,
as well as 9 differentially expressed mRNA ceRNAs, including cyclin
B1 (CCNB1), centrosomal protein 55 (CEP55),
checkpoint kinase 1 (CHEK1), E2F transcription factor 7
(E2F7), kinesin family member 23 (KIF23),
minichromosome maintenance complex component 4, PDZ binding kinase,
phosphofructokinase platelet and retinoschisin 1 (RS1),
which were associated with overall survival (Figs. 3 and 4). Subsequent to univariate Cox's
proportional hazards regression model analysis for differentially
expressed lncRNAs in the ceRNA networks, 19 lncRNAs were selected
to have a significant prognostic value (data not shown), but 22
lncRNAs and mRNAs from the ceRNA networks were identified by
integrated univariate Cox's model analysis as aberrantly expressed
lncRNAs and mRNAs (data not shown). Based on the criterion of a
P-value of <0.01, the selected lncRNA and mRNA ceRNAs were used
to build lncRNA- or lncRNA-mRNA-based prognostic signatures using a
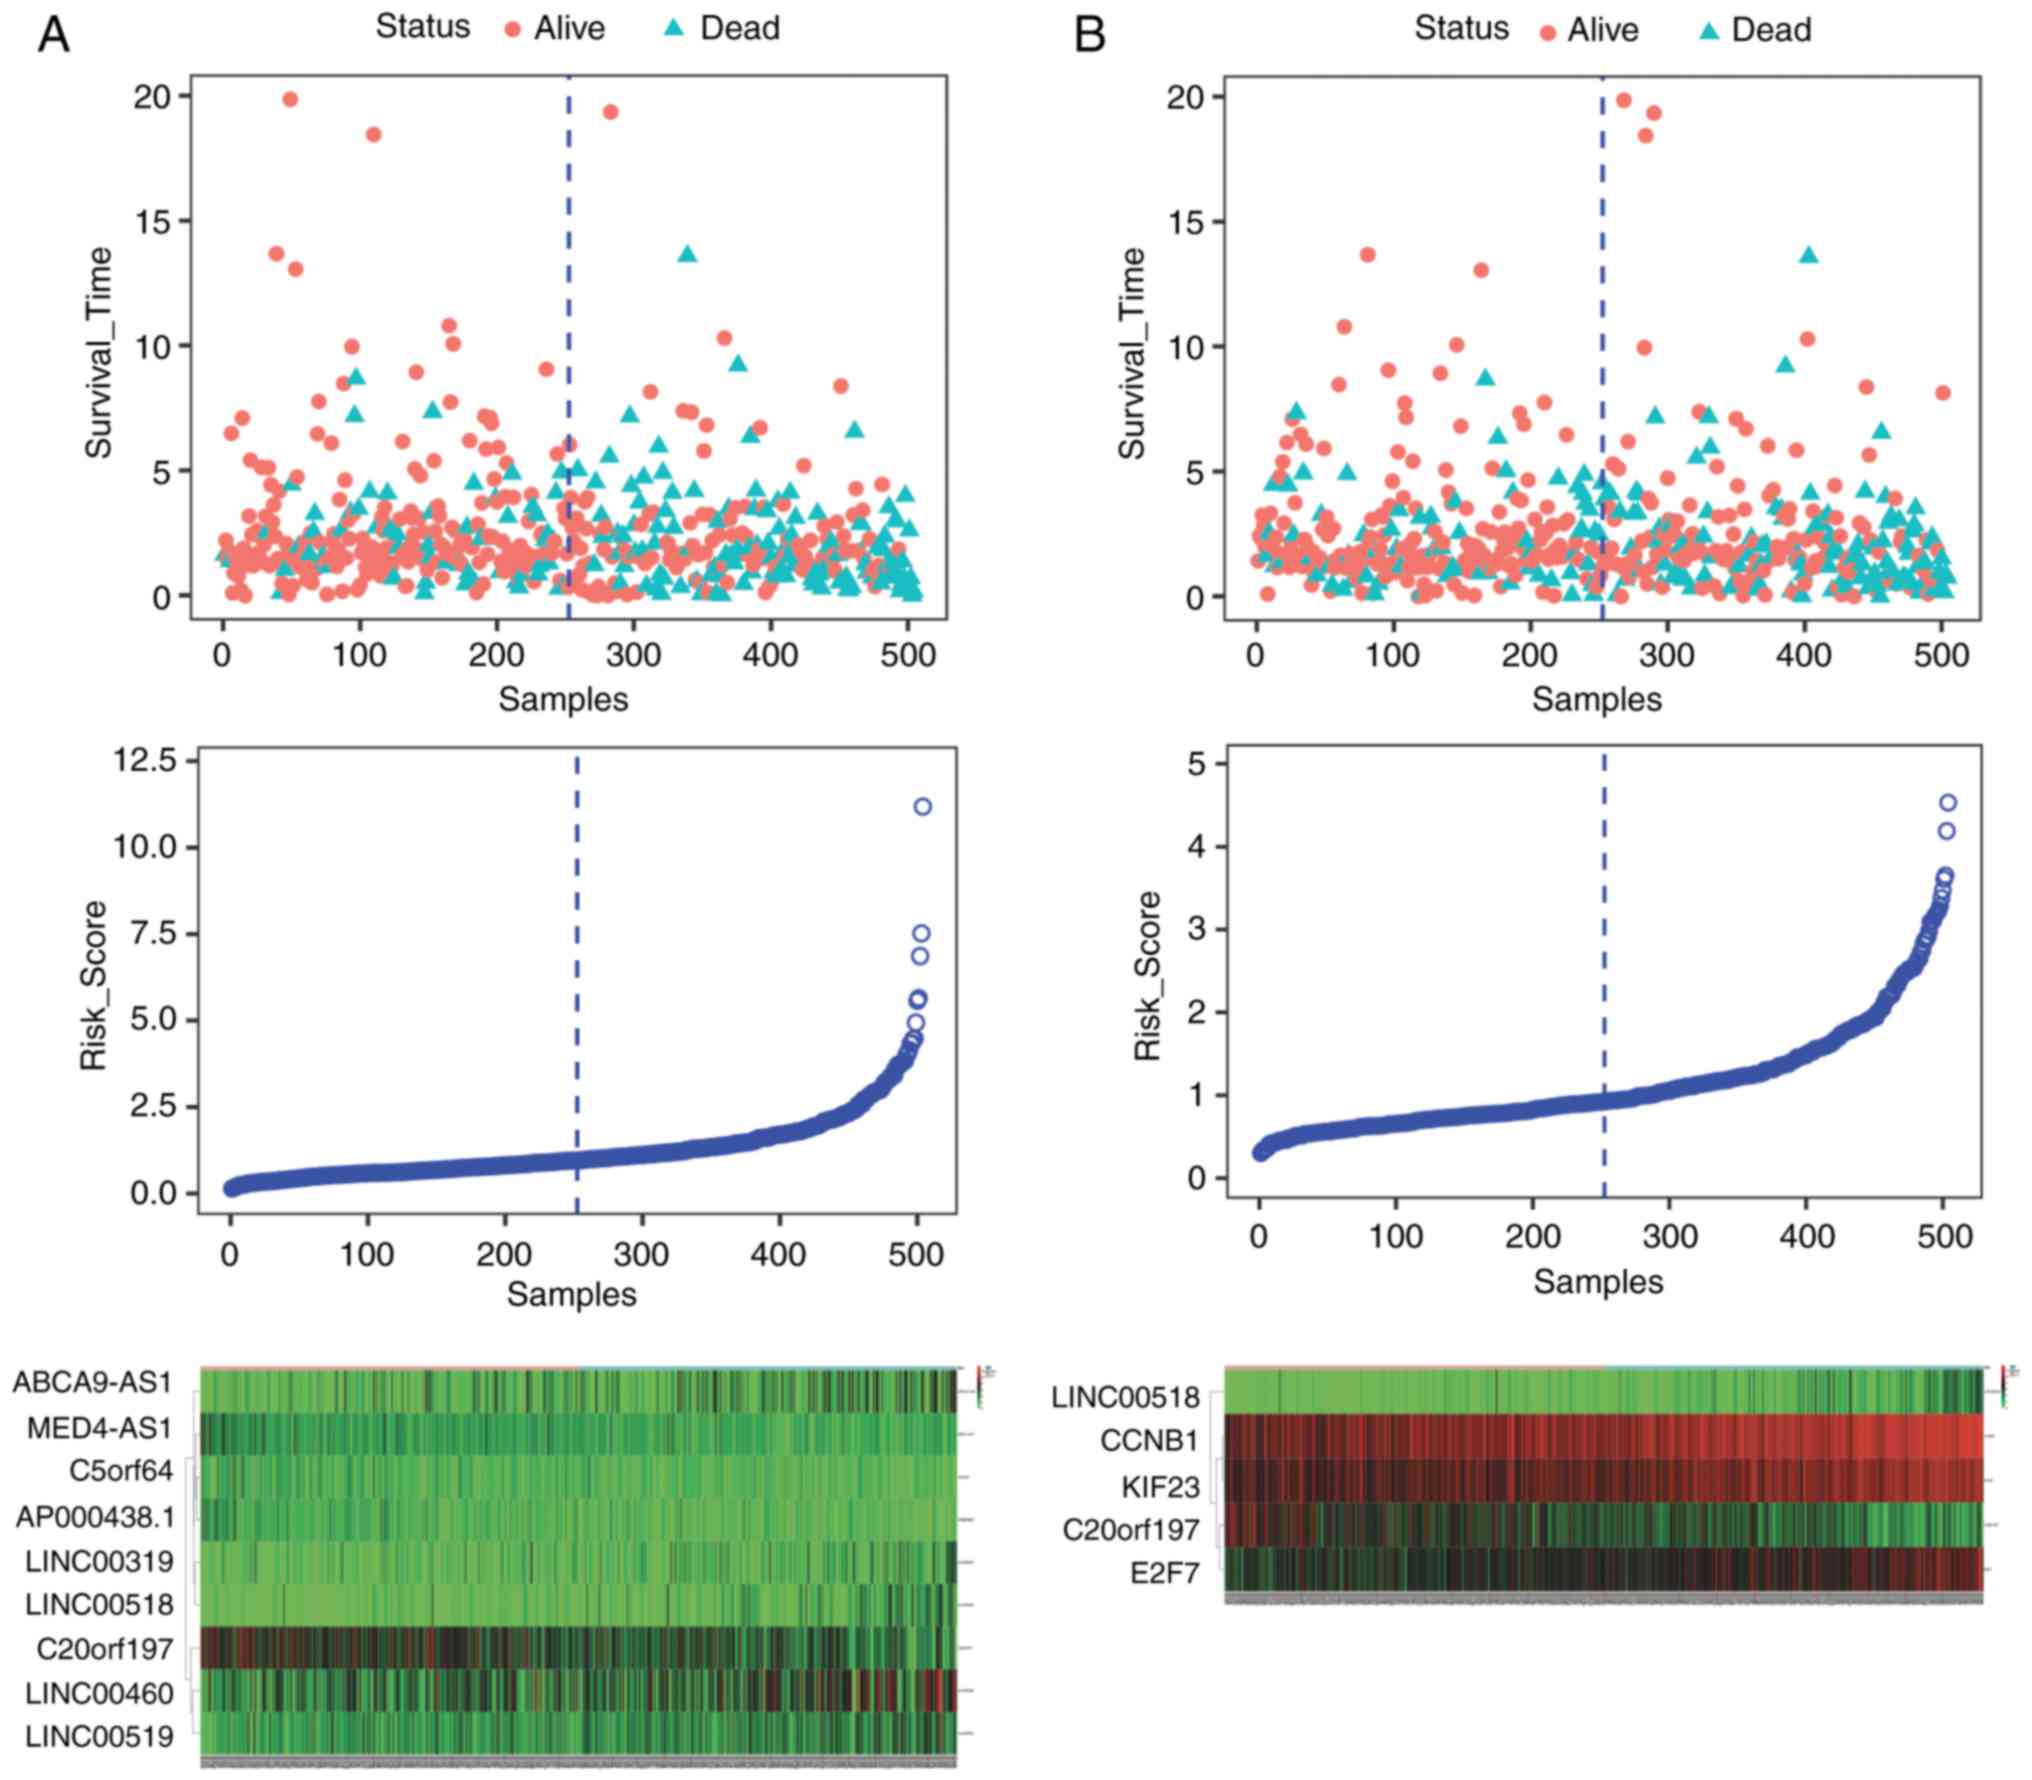
multivariate Cox's regression model. The results showed that 9
lncRNA ceRNAs were included in a lncRNA-based prognostic signature
(termed LASiglnc-9), and two lncRNA and three mRNA ceRNAs were
included in a lncRNA-mRNA-based prognostic signature (termed
LASiglnc2-m3) (Fig. 5). The
prognostic risk score for predicting overall survival was
calculated as: exp1*β1 +
exp2*β2+…+expn*βn. The
median was used as the cutoff of risk score, and LUAC patients were
divided into high-risk and low-risk groups based on this
categorization (Fig. 5).
Differentially expressed lncRNAs and mRNAs included in the two
models are shown in Fig. 5, these
include ABCA9-AS1, MED4-AS1, C5orf64, AP000438.1, LINC00319,
LINC00518, C20orf197, LINC00460, LINC00519, CCNB1, KIF23 and
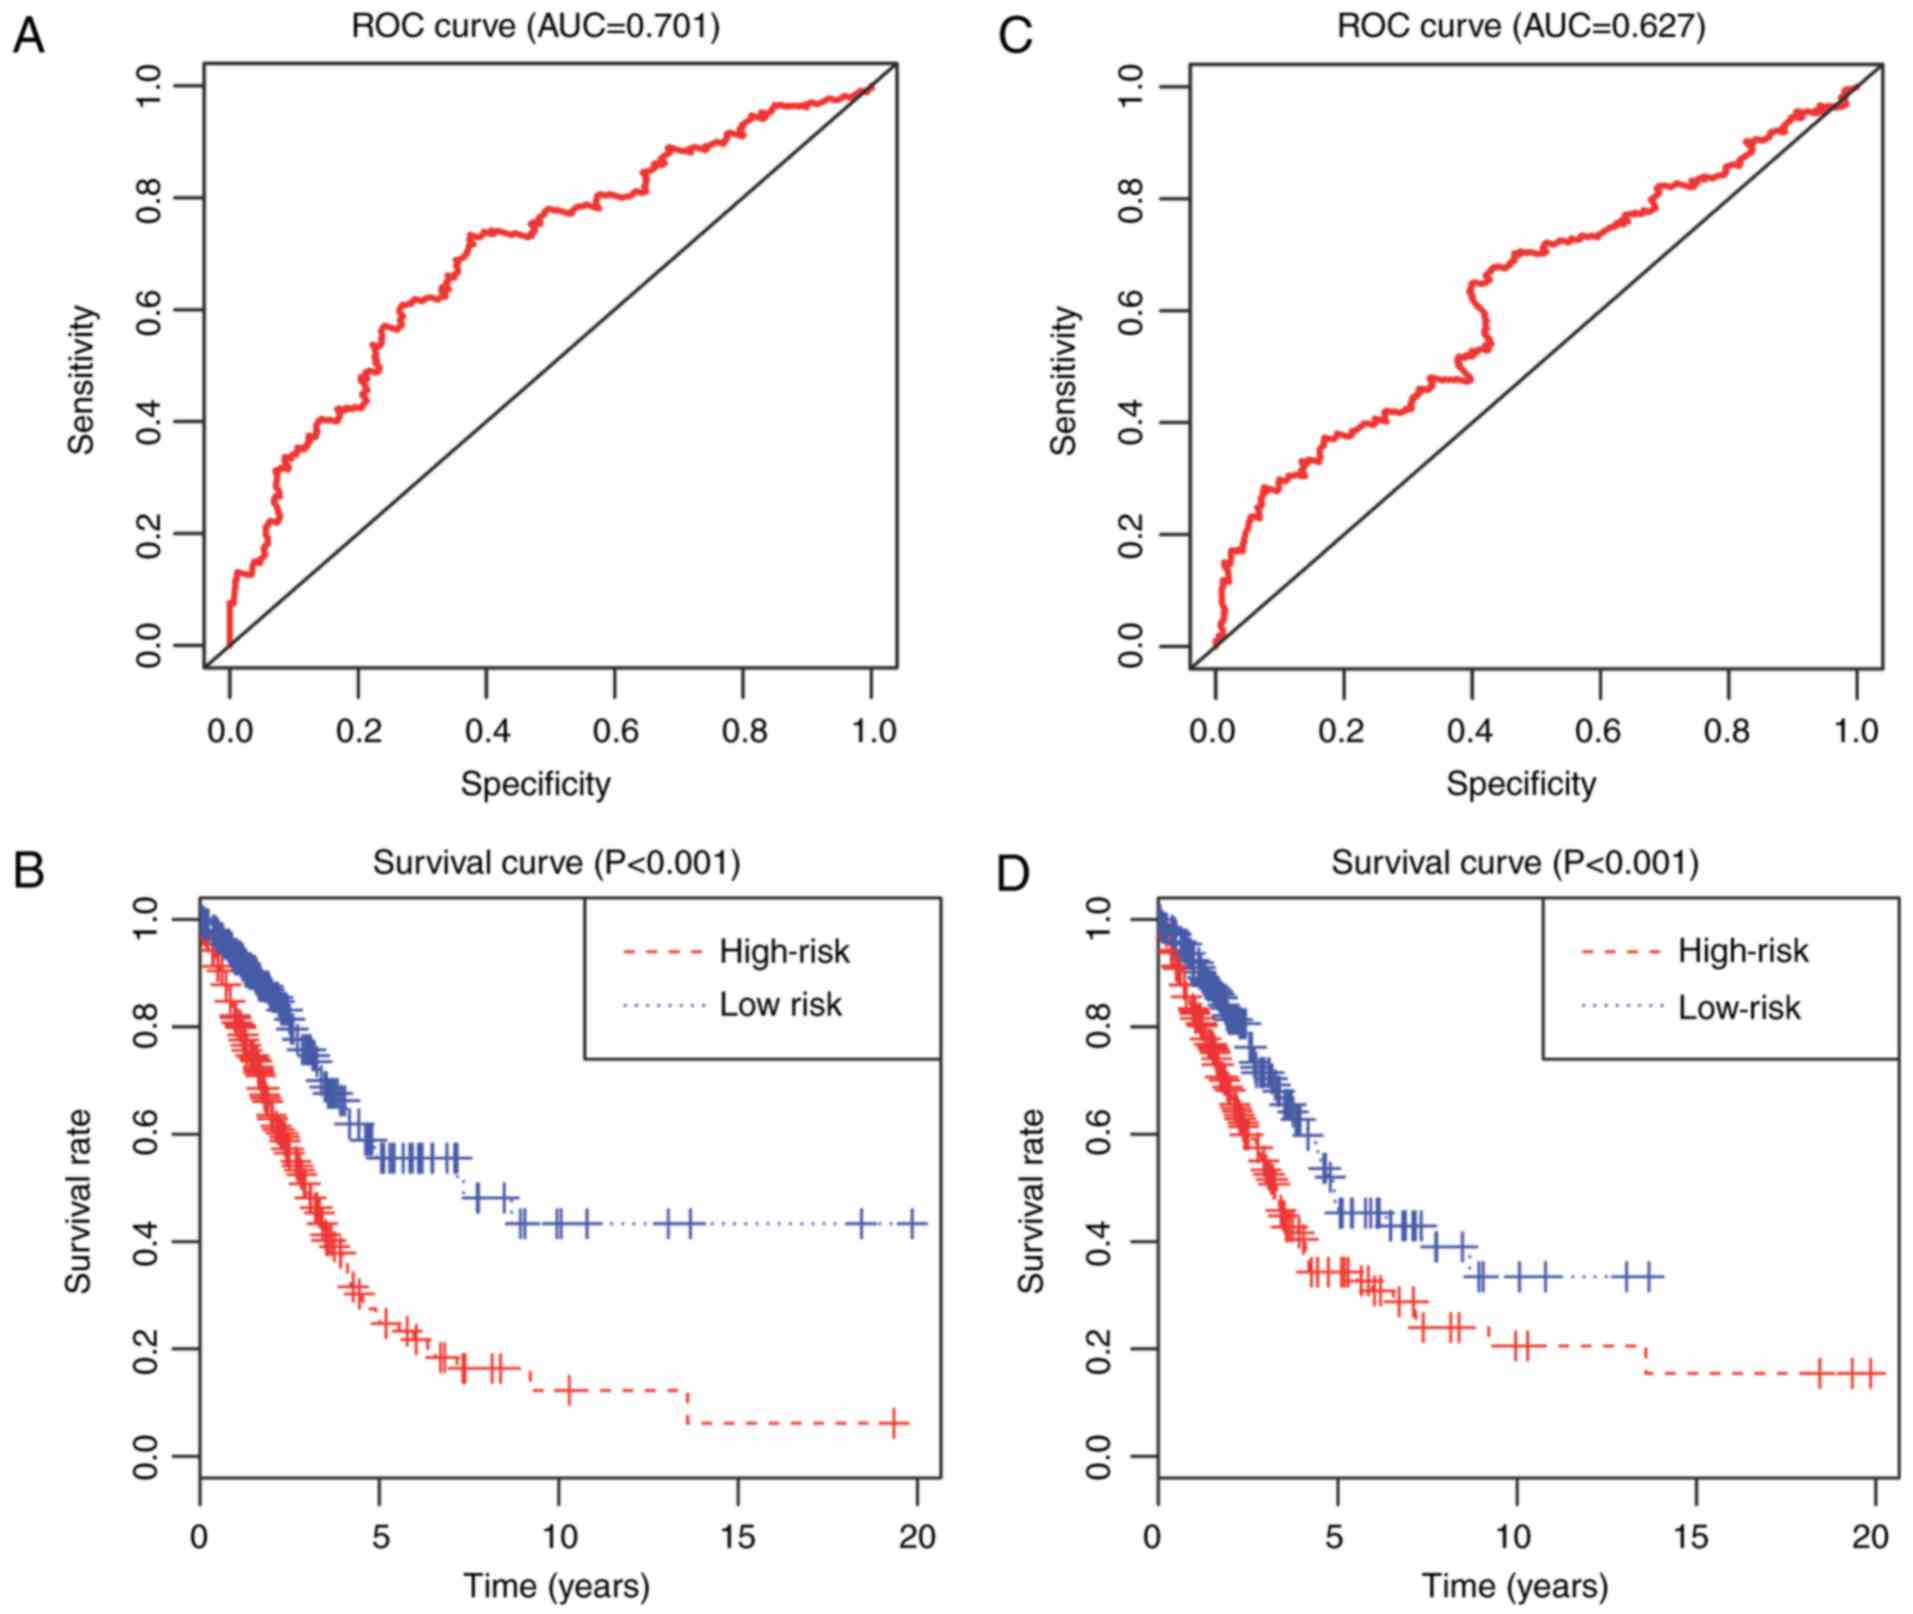
E2F7. The time-dependent ROC curves analysis for LASiglnc-9
achieved an area under the curve (AUC) of 0.701 for the 5-year
survival of LUAC patients (Fig. 6A)
and the survival rate of the low-risk group was higher than that of
high-risk group (P<0.001; Fig.
6B). The time-dependent ROC curve analysis of LASiglnc2-m3
achieved an AUC of 0.627 (Fig. 6C)
and the survival rate was similar to that of LASiglnc-9 (Fig. 6D). These results suggest that the
accuracy of LASiglnc-9 is higher than that of LASiglnc2-m3 for
predicting LUAC prognosis functioned as ceRNAs.
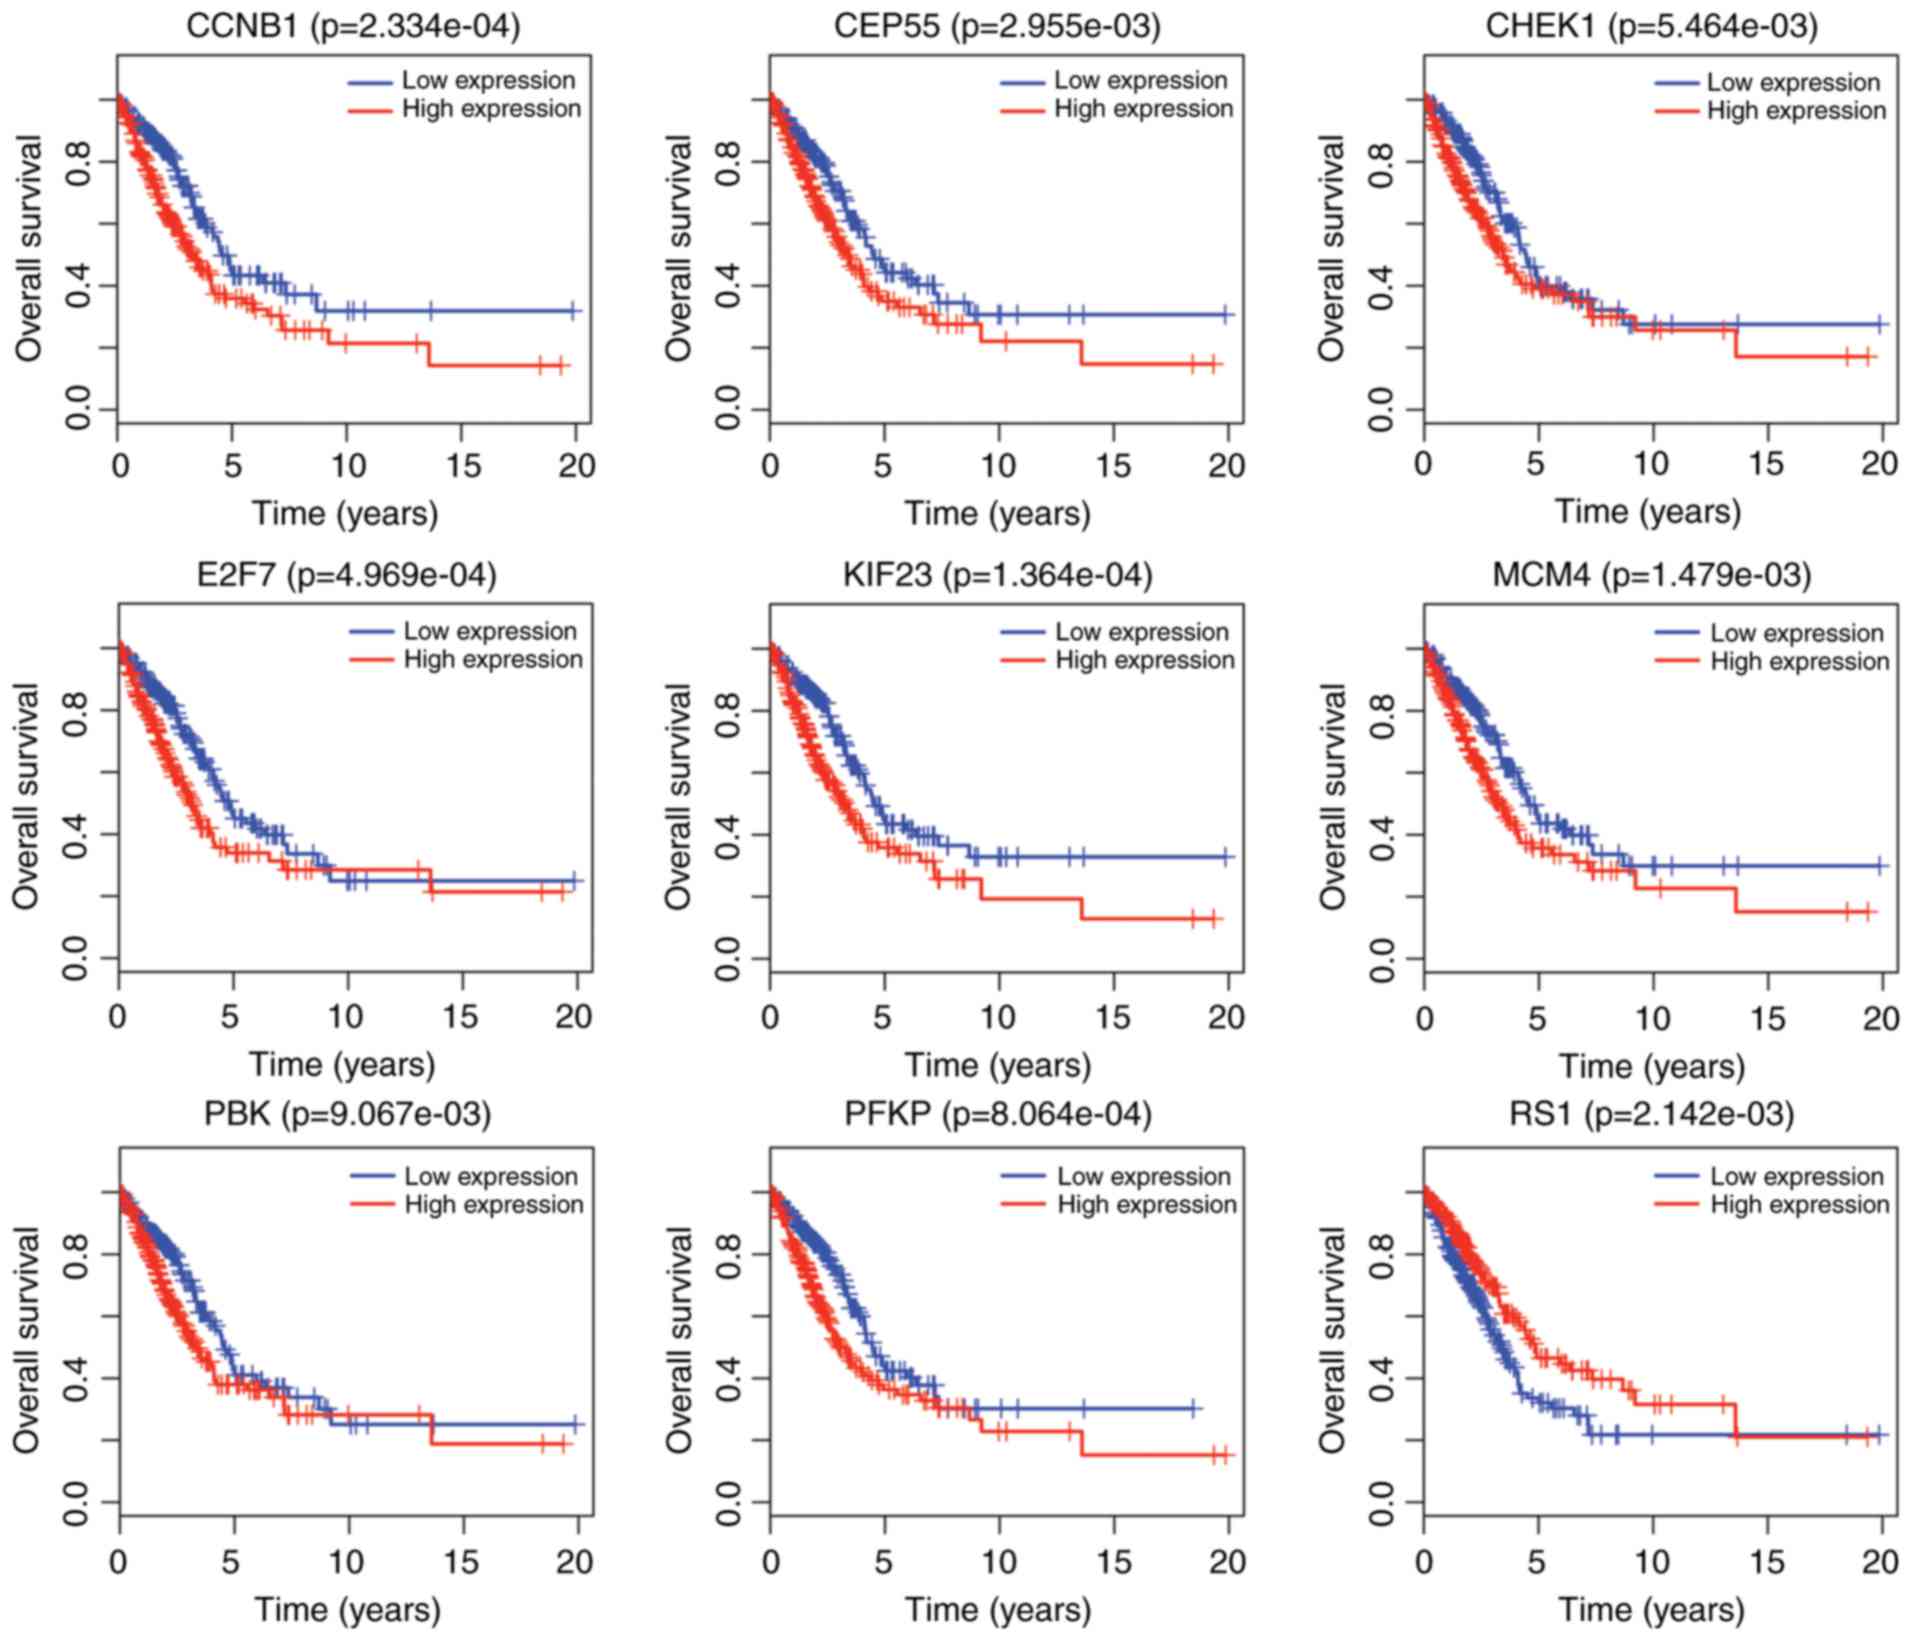 | Figure 4.Kaplan-Meier survival curves for 9
mRNAs associated with overall survival of lung adenocarcinoma.
Horizontal axis, overall survival time in years; vertical axis,
survival function. CCNB1, cyclin B1; CEP55,
centrosomal protein 55; CHEK1, checkpoint kinase 1;
E2F7, E2F transcription factor 7; KIF23, kinesin
family member 23; MCM4, minichromosome maintenance complex
component 4; PBK, PDZ binding kinase; PFKP,
phosphofructokinase platelet; RS1, retinoschisin 1. |
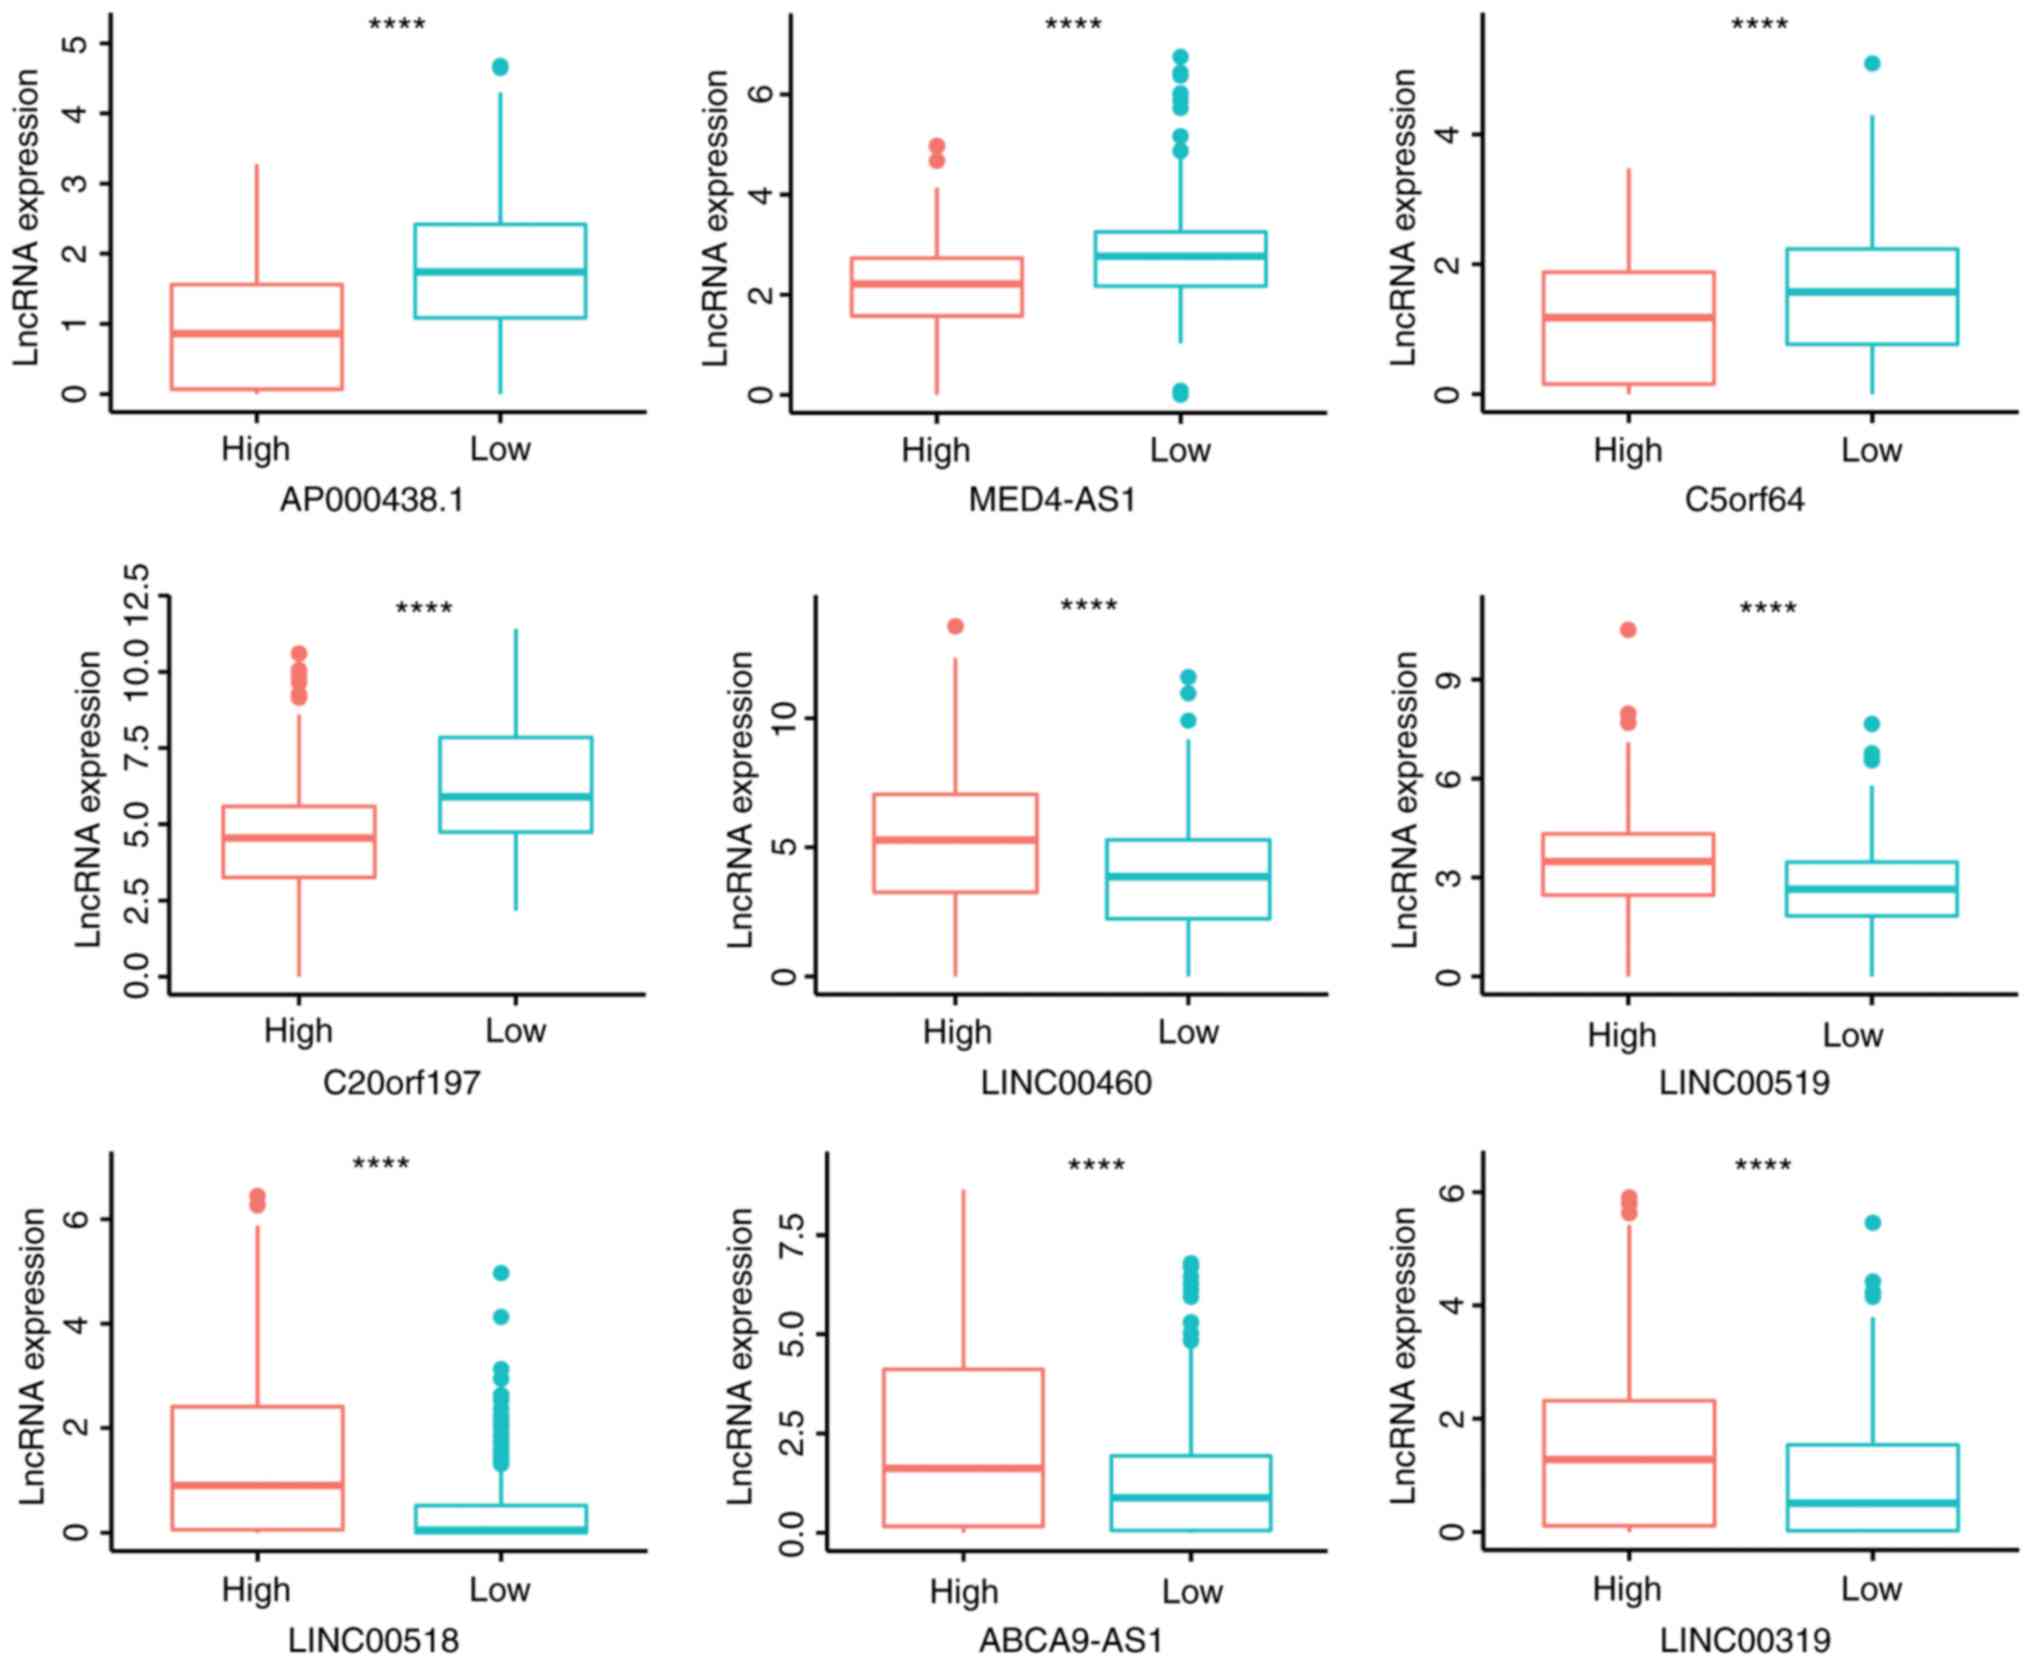
To further study the value of LASiglnc-9 for LUAC
prognosis, the expression pattern of 9 lncRNAs of tumor patients in
two risk groups was analyzed and presented in Fig. 7. Of these 9 lncRNAs, the expression
of 5 lncRNAs (LINC00460, LINC00519, LINC00518, ABCA9-AS1 and
LINC00319) was higher in the high-risk group than that in the
low-risk group (P<0.001), while the expression of the other 4
lncRNAs (AP000438.1, MED4-AS1, C5orf64 and C20orf197) was lower in
the high-risk group than that in the low-risk group
(P<0.001).
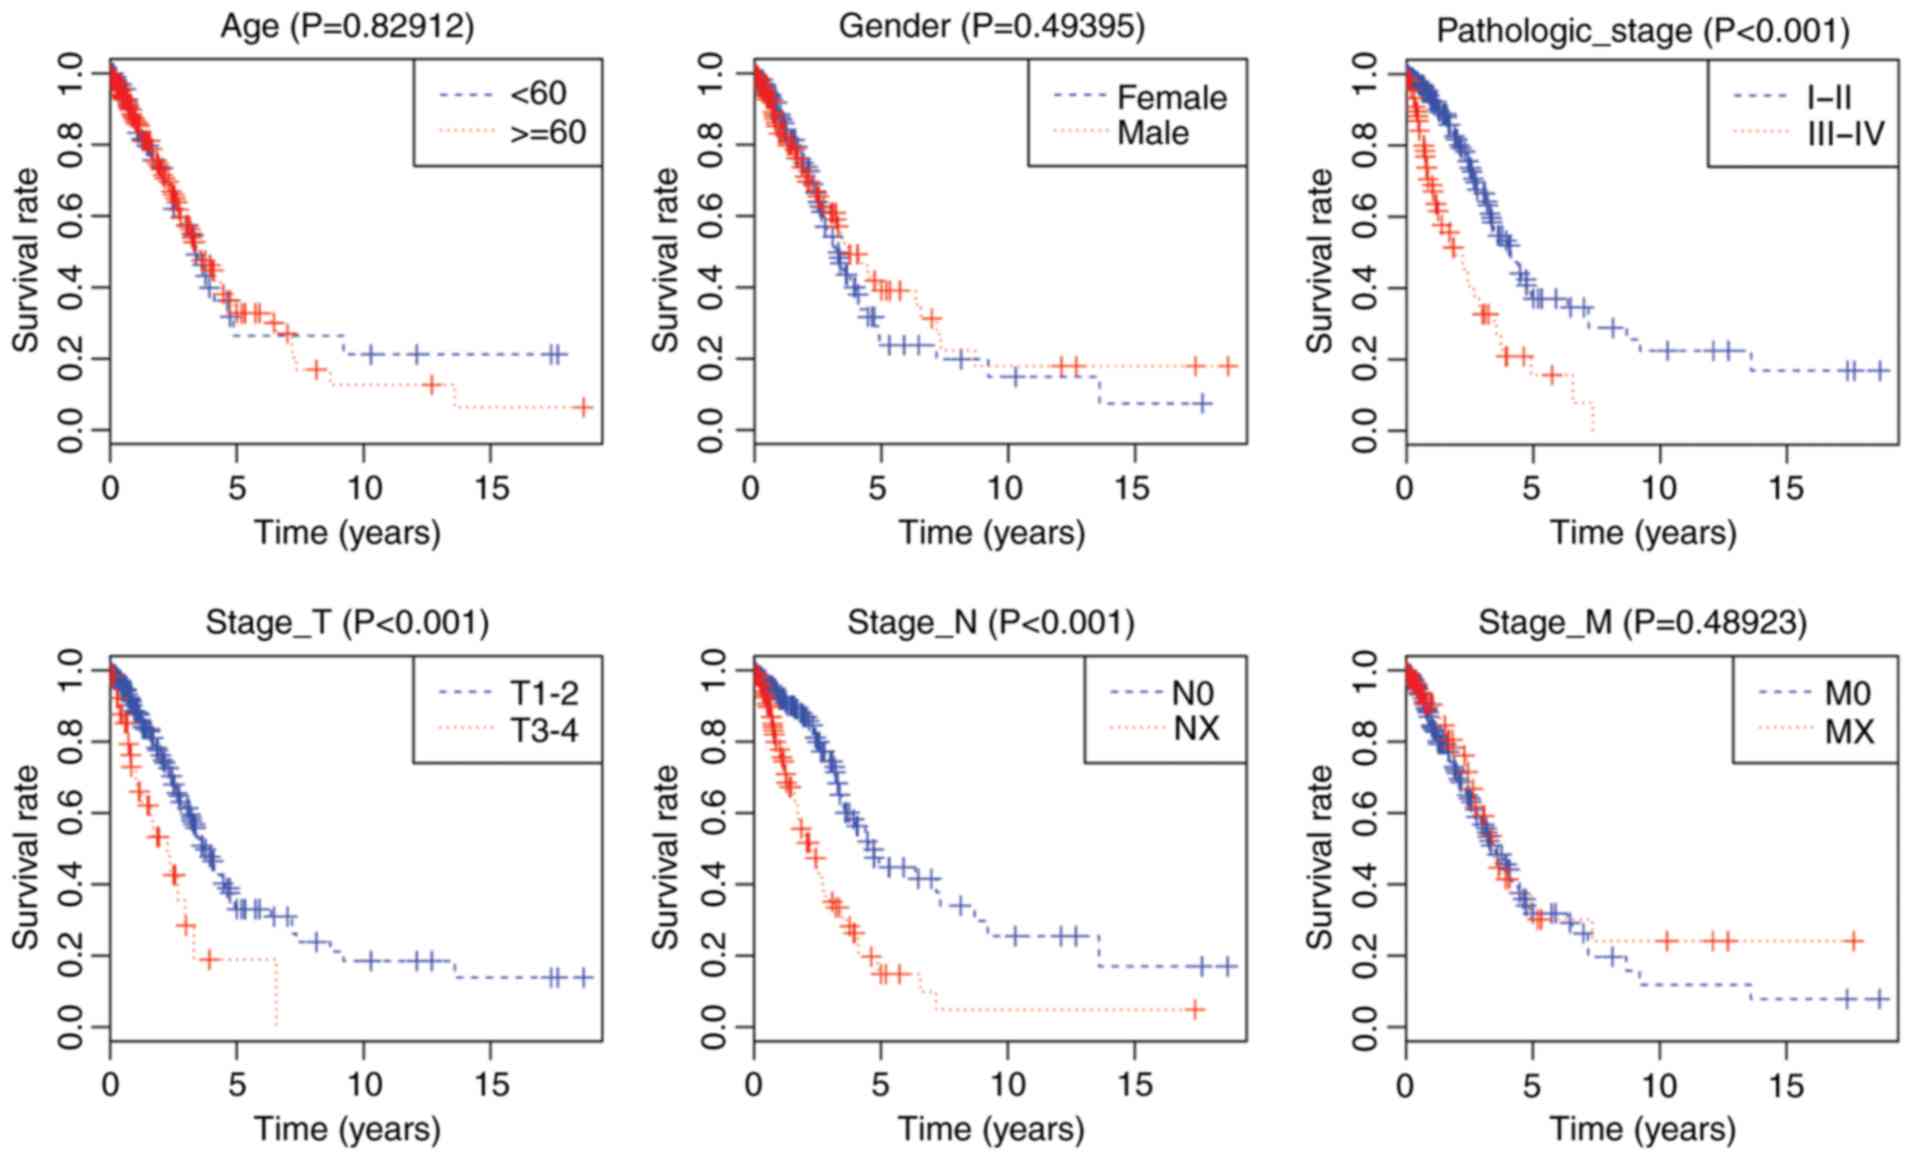
Independence of predictive capacity of
LASiglnc-9 from clinical factors
Kaplan-Meier curve analysis for clinical factors,
including age, gender, stage of pathology, and T, N and M stages,
revealed that stage of pathology (P<0.001), T stage
(P=9×10⁻⁵) and N stage (P<0.001) were associated with
overall survival in LUAC patients (Fig.
8). Univariate Cox's regression model analysis showed that
stage of pathology (HR, 2.82; 95% CI, 1.94–4.09; P<0.001), T
stage (HR, 2.49; 95% CI, 1.55–4.00; P<0.001), N stage (HR, 2.78;
95% CI, 1.92–4.01; P<0.001) and risk score (HR, 0.39; 95% CI,
0.26–0.58; P<0.001) were significantly associated with overall
survival (P<0.001). However, T stage (HR, 1.46; 95% CI,
0.85–2.50; P=0.170) was not associated with overall survival in
LUAC patients upon multivariate regression analysis (Table V). These results suggest that the
stage of pathology, N stage and the risk score based on LASiglnc-9
function as independent prognostic factors.
| Table V.Predictive values of clinical
features and risk score. |
Table V.
Predictive values of clinical
features and risk score.
|
|
| Univariate
analysis | Multivariate
analysis |
|---|
|
|
|
|
|
|---|
| Variables | Patients, n | HR (95% CI) | P-value | HR (95% CI) | P-value |
|---|
| Age (<60/≥60
years) | 131/351 | 1.04
(0.70–1.56) | 0.83 | 1.17
(0.77–1.77) | 0.47 |
| Gender
(male/female) | 260/222 | 0.88
(0.61–1.27) | 0.49 | 0.82
(0.57–1.20) | 0.31 |
| Pathological stage
(I–II/III–IV) | 377/105 | 2.82
(1.94–4.09) | 0.00 | 1.68
(1.02–2.77) | 0.04 |
| T stage
(T1-T2/T3-T4) | 417/65 | 2.49
(1.55–4.00) | 0.00 | 1.46
(0.85–2.50) | 0.17 |
| N stage
(N0/NX) | 312/170 | 2.78
(1.92–4.01) | 0.00 | 1.80
(1.15–2.83) | 0.01 |
| M stage
(M0/MX) | 318/164 | 0.87
(0.58–1.30) | 0.49 | 0.90
(0.59–1.36) | 0.61 |
| Risk score
(low/high) | 238/244 | 0.39
(0.26–0.58) | 0.00 | 0.51
(0.34–0.76) | 0.00 |
Discussion
Although clinical management of lung cancer has
improved over the years through a variety of technologies that
reduce patient mortality rate, an ever-increasing number of
patients remain in danger of tumor recurrence or mortality
(1). This is mainly due to the fact
that the majority of lung cancer cases are diagnosed at advanced
stages where surgical resection is not a good choice for tumor
cure. Moreover, clinicopathological factors, including tumor stage,
lymph node status, tumor grade and size, and lymphatic and vascular
invasion appear to be associated with LUAC prognosis, but do not
appear to be sufficient for predicting treatment outcomes in LUAC
patients (24). A growing number of
studies are focusing on microarray technology and high-throughput
sequencing with the hope of identifying molecular signatures,
including protein-coding genes, lncRNAs or miRNAs, that can assist
in predicting survival, metastasis and the prognosis of patients
(17,25). Furthermore, with a greater
understanding of RNA crosstalk and interaction in the scientific
community, the integrated analysis of an lncRNA-associated ceRNA
network is becoming more widely used to predict prognostic
signatures in various cancer types, including LUAC (26). Although several lncRNAs and miRNAs
have been associated with LUAC prognosis (17,25),
their expression patterns and prognostic values have not been
thoroughly studied and they cannot be considered to be valid
prognostic biomarkers at this time.
In the current study, RNA-sequencing and clinical
data were retrieved from TCGA database and then analyzed and
screened for differentially expressed mRNAs, lncRNAs and miRNAs
between LUAC patient tissues and adjacent normal tissues. With
LUAC-specific dysregulated lncRNAs, miRNAs and mRNAs, the
lncRNA-mRNA-miRNA ceRNA network was constructed, which provides
more insight into the detection of key RNAs associated with LUAC
prognosis. Kaplan-Meier and log-rank analyses revealed 8
differentially expressed lncRNAs and 9 mRNAs associated with
overall survival from exhibiting as ceRNA in patients with LUAC.
Next, an lncRNA-based prognostic signature, LASiglnc-9, was
constructed, which contains 9 lncRNAs, as well as an
lncRNA-mRNA-based prognostic signature, LASiglnc2-m3, which
contains 2 lncRNAs and 3 mRNAs based on the differentially
expressed RNAs that were mapped into the ceRNA network. Of these,
LASiglnc-9 showed that it may be able to more accurately predict
the overall survival of patients with LUAC compared with
LASiglnc2-m3. Furthermore, it was found that the predictive ability
of LASiglnc-9 is certainly independent from clinicopathological
factors, including stage of pathology (HR, 2.82; 95% CI, 1.94–4.09;
P<0.001), T stage (HR, 2.49; 95% CI, 1.55–4.00; P<0.001), N
stage (HR, 2.78; 95% CI, 1.92–4.01; P<0.001) and risk score (HR,
0.39; 95% CI, 0.26–0.58; P<0.001) through Cox's regression
analysis. These findings show that LASiglnc-9 may be a candidate
biomarker for LUAC prognosis prediction based on mechanisms derived
from the ceRNA networks.
The lncRNA ABCA9-AS1, 1 of 9 prognosis-related
lncRNAs, is targeted by hsa-mir-195 in the present ceRNA network of
downregulated lncRNAs and mRNAs. It is well known that hsa-mir-195
is implicated in various cancer types, including hepatocellular
carcinoma (27), esophageal
squamous cell carcinoma (28) and
glioblastoma (29). Notably, a
previous study demonstrated that serum mir-195 was predictive of
the recurrence risk of adrenocortical cancer (30). Moreover, target prediction analysis
in the present study showed that hsa-mir-195 may regulate the
expression of several mRNAs in the ceRNA network, including
RS1, transmembrane protein 100, osteoclast-associated
immunoglobulin-like receptor, transforming growth factor β receptor
3, E2F7, phosphoserine aminotransferase 1, spalt like
transcription factor 1, CEP55, KIF23, ret proto-oncogene,
cell division cycle 25A, chromobox 2, cyclin E1, homeobox A10
(HOXA10), CHEK1 and claspin. GO and KEGG enrichment
analysis for mRNAs co-expressed with lncRNAs and miRNAs indicated
that the majority of the implicated genes are significantly
involved in cell cycle-related biological processes mediating tumor
cell proliferation. Another lncRNA MED4-AS1, which is targeted by
hsa-mir-143 and hsa-mir-144, was overexpressed in the low-risk
group. Several genes, including collagen type I α1 chain
(COL1A1), COL5A2, T-box 18, potassium voltage-gated
channel subfamily Q member 5 and HOXA10, were predicted to
be regulated by hsa-mir-143 and hsa-mir-144, and are clearly
enriched in cell proliferation-associated GO terms. As studies on
the roles and mechanisms of action of lncRNAs are in their infancy,
functional interpretation of their co-expressed mRNAs within a
ceRNA network is considered to be an effective computational
strategy. The present study found that ABCA9-AS1 and MED4-AS1 may
be involved in the ‘skeletal system’, ‘protein binding’, ‘DNA
binding’, ‘cell cycle’ and ‘p53 signaling pathway’. The skeletal
system served a vital role in body support and movement. Meanwhile,
collagen, as one component of the skeletal system, has been proven
to promote tumor initiation and progression (31). It is widely accepted that the p53
tumor suppressor inhibits tumor growth by mediating cell-cycle
arrest, apoptotic cell death and cellular senescence triggered by
diverse cellular stresses (32). As
a result, we hypothesize that dysregulation of these 9 lncRNAs
associated LUAC prognosis contributes to the poor outcome of
patients with LUAC by mediating known tumor-associated biological
processes and pathways acting as ceRNAs regulating gene
expression.
Currently, the TNM staging system is the most widely
used system in predicting the survival of patients with LUAC.
However, there are several limitations to the system. For example,
not all stage III–IV patients experienced worse survival times
compared with stage I–II patients, and patients who were in the
same stage experienced variable survival times. Thus, the genetic
predictive markers are required to assist doctors in forming more
accurate estimates in clinical practice. In the present study, the
identified 9-lncRNA signature showed prognostic value in LUAC
patients. Even in the same pathological stage, the 9-lncRNA
signature can classify patients into high- and low-risk groups with
lncRNA expression level, suggesting that this lncRNA signature can
improve the accuracy of survival prediction. Therefore, this result
may aid doctors in selecting the corresponding therapeutic schedule
for patients at different pathological stages, which can improve
the overall survival of patients with LUAC.
However, there are certain limitations to the
present study. First, the limited available lncRNA and miRNA
expression profiles only identified a fraction of the lncRNAs that
may be associated with LUAC prognosis. Second, the predictive value
of lncRNA signatures remains to be verified by molecular and
clinical experiments in future studies. Therefore, larger cohorts
and experimental studies are required to validate this signature to
further investigate the functional roles of LASiglnc-9 in LUAC
prognosis.
In summary, the present study identified a 9-lncRNA
signature that is closely associated with the tumor prognosis of
patients with LUAC by use of lncRNAs profiles and construction of
ceRNA networks, and by performing survival analysis. The present
study not only indicates the predictive ability of lncRNA ceRNAs as
potential biomarkers for LUAC diagnosis and prognosis, but also
provides novel insight into the molecular mechanism underlying LUAC
with further experimental validation.
Acknowledgements
Not applicable.
Funding
No funding was received.
Availability of data and materials
The datasets used and/or analyzed during the current
study are available from the corresponding author on reasonable
request.
Authors' contributions
GF designed the study. XW, YD, BD and YF analyzed
the data. XW and GF wrote the manuscript. All authors read and
approved the final manuscript.
Ethics approval and consent to
participate
Not applicable.
Patient consent for publication
Not applicable.
Competing interests
The authors declare that they have no competing
interests.
Glossary
Abbreviations
Abbreviations:
|
ncRNA
|
non-coding RNA
|
|
ceRNA
|
competing endogenous RNA
|
|
LUAC
|
lung adenocarcinoma
|
|
ROC
|
receiver operating characteristic
|
|
TCGA
|
The Cancer Genome Atlas
|
References
|
1
|
Director's Challenge Consortium for the
Molecular Classification of Lung Adenocarcinoma, . Shedden K,
Taylor JM, Enkemann SA, Tsao MS, Yeatman TJ, Gerald WL, Eschrich S,
Jurisica I, Giordano TJ, Misek DE, et al: Gene expression-based
survival prediction in lung adenocarcinoma: A multi-site, blinded
validation study. Nat Med. 14:822–827. 2008. View Article : Google Scholar : PubMed/NCBI
|
|
2
|
Siegel RL, Miller KD and Jemal A: Cancer
statistics, 2015. CA Cancer J Clin. 65:5–29. 2015. View Article : Google Scholar : PubMed/NCBI
|
|
3
|
Minna JD, Roth JA and Gazdar AF: Focus on
lung cancer. Cancer cell. 1:49–52. 2002. View Article : Google Scholar : PubMed/NCBI
|
|
4
|
Sun S, Schiller JH and Gazdar AF: Lung
cancer in never smokers-a different disease. Nat Rev Cancer.
7:778–790. 2007. View
Article : Google Scholar : PubMed/NCBI
|
|
5
|
Ling H, Fabbri M and Calin GA: MicroRNAs
and other non-coding RNAs as targets for anticancer drug
development. Nat Rev Drug Discov. 12:8472013. View Article : Google Scholar : PubMed/NCBI
|
|
6
|
Mattick JS and Makunin IV: Non-coding RNA.
Hum Mol Genet. 15 Suppl 1:R17–R29. 2006. View Article : Google Scholar : PubMed/NCBI
|
|
7
|
Yu F, Yao H, Zhu P, Zhang X, Pan Q, Gong
C, Huang Y, Hu X, Su F, Lieberman J and Song E: let-7 regulates
self renewal and tumorigenicity of breast cancer cells. Cell.
131:1109–1123. 2007. View Article : Google Scholar : PubMed/NCBI
|
|
8
|
Kumar MS, Erkeland SJ, Pester RE, Chen CY,
Ebert MS, Sharp PA and Jacks T: Suppression of non-small cell lung
tumor development by the let-7 microRNA family. Proc Natl Acad Sci
USA. 105:3903–3908. 2008. View Article : Google Scholar : PubMed/NCBI
|
|
9
|
Faraoni I, Antonetti FR, Cardone J and
Bonmassar E: miR-155 gene: A typical multifunctional microRNA.
Biochim Biophys Acta. 1792:497–505. 2009. View Article : Google Scholar : PubMed/NCBI
|
|
10
|
Nagano T and Fraser P: No-nonsense
functions for long noncoding RNAs. Cell. 145:178–181. 2011.
View Article : Google Scholar : PubMed/NCBI
|
|
11
|
Prensner JR and Chinnaiyan AM: The
emergence of lncRNAs in cancer biology. Cancer Discov. 1:391–407.
2011. View Article : Google Scholar : PubMed/NCBI
|
|
12
|
Weakley SM, Wang H, Yao Q and Chen C:
Expression and function of a large non-coding RNA gene XIST in
human cancer. World J Surg. 35:1751–1756. 2011. View Article : Google Scholar : PubMed/NCBI
|
|
13
|
Salmena L, Poliseno L, Tay Y, Kats L and
Pandolfi PP: A ceRNA hypothesis: The rosetta stone of a hidden RNA
language? Cell. 146:353–358. 2011. View Article : Google Scholar : PubMed/NCBI
|
|
14
|
Wee LM, Flores-Jasso CF, Salomon WE and
Zamore PD: Argonaute divides its RNA guide into domains with
distinct functions and RNA-binding properties. Cell. 151:1055–1067.
2012. View Article : Google Scholar : PubMed/NCBI
|
|
15
|
Wang J, Liu X, Wu H, Ni P, Gu Z, Qiao Y,
Chen N, Sun F and Fan Q: CREB up-regulates long non-coding RNA,
HULC expression through interaction with microRNA-372 in liver
cancer. Nucleic Acids Res. 38:5366–5383. 2010. View Article : Google Scholar : PubMed/NCBI
|
|
16
|
Fan M, Li X, Jiang W, Huang Y, Li J and
Wang Z: A long non-coding RNA, PTCSC3, as a tumor suppressor and a
target of miRNAs in thyroid cancer cells. Exp Ther Med.
5:1143–1146. 2013. View Article : Google Scholar : PubMed/NCBI
|
|
17
|
Sui J, Li YH, Zhang YQ, Li CY, Shen X, Yao
WZ, Peng H, Hong WW, Yin LH, Pu YP, et al: Integrated analysis of
long non-coding RNAassociated ceRNA network reveals potential
lncRNA biomarkers in human lung adenocarcinoma. Int J Oncol.
49:2023–2036. 2016. View Article : Google Scholar : PubMed/NCBI
|
|
18
|
Sui J, Xu SY, Han J, Yang SR, Li CY, Yin
LH, Pu YP and Liang GY: Integrated analysis of competing endogenous
RNA network revealing lncRNAs as potential prognostic biomarkers in
human lung squamous cell carcinoma. Oncotarget. 8:65997–66018.
2017. View Article : Google Scholar : PubMed/NCBI
|
|
19
|
Edge S, Byrd DR, Compton CC, Fritz AG,
Greene F and Trotti A: AJCC Cancer Staging Handbook: From the AJCC
Cancer Staging Manual. 7th edition. Springer-Verlag; New York, NY:
2010
|
|
20
|
Robinson MD, McCarthy DJ and Smyth GK:
edgeR: A Bioconductor package for differential expression analysis
of digital gene expression data. Bioinformatics. 26:139–140. 2010.
View Article : Google Scholar : PubMed/NCBI
|
|
21
|
Shannon P, Markiel A, Ozier O, Baliga NS,
Wang JT, Ramage D, Amin N, Schwikowski B and Ideker T: Cytoscape: A
software environment for integrated models of biomolecular
interaction networks. Genome Res. 13:2498–2504. 2003. View Article : Google Scholar : PubMed/NCBI
|
|
22
|
Alizadeh AA, Gentles AJ, Alencar AJ, Liu
CL, Kohrt HE, Houot R, Goldstein MJ, Zhao S, Natkunam Y, Advani RH,
et al: Prediction of survival in diffuse large B-cell lymphoma
based on the expression of 2 genes reflecting tumor and
microenvironment. Blood. 118:1350–1358. 2011. View Article : Google Scholar : PubMed/NCBI
|
|
23
|
Detterbeck FC, Boffa DJ and Tanoue LT: The
new lung cancer staging system. Chest. 136:260–271. 2009.
View Article : Google Scholar : PubMed/NCBI
|
|
24
|
Suzuki K, Yokose T, Yoshida J, Nishimura
M, Takahashi K, Nagai K and Nishiwaki Y: Prognostic significance of
the size of central fibrosis in peripheral adenocarcinoma of the
lung. Anna Thorac Surg. 69:893–897. 2000. View Article : Google Scholar
|
|
25
|
Yanaihara N, Caplen N, Bowman E, Seike M,
Kumamoto K, Yi M, Stephens RM, Okamoto A, Yokota J, Tanaka T, et
al: Unique microRNA molecular profiles in lung cancer diagnosis and
prognosis. Cancer Cell. 9:189–198. 2006. View Article : Google Scholar : PubMed/NCBI
|
|
26
|
Tay Y, Rinn J and Pandolfi PP: The
multilayered complexity of ceRNA crosstalk and competition. Nature.
505:344–352. 2014. View Article : Google Scholar : PubMed/NCBI
|
|
27
|
Amer M, Elhefnawi M, El-Ahwany E, Awad AF,
Gawad NA, Zada S and Tawab FM: Hsa-miR-195 targets PCMT1 in
hepatocellular carcinoma that increases tumor life span. Tumour
Biol. 35:11301–11309. 2014. View Article : Google Scholar : PubMed/NCBI
|
|
28
|
Fu MG, Li S, Yu TT, Qian LJ, Cao RS, Zhu
H, Xiao B, Jiao CH, Tang NN, Ma JJ, et al: Differential expression
of miR-195 in esophageal squamous cell carcinoma and miR-195
expression inhibits tumor cell proliferation and invasion by
targeting of Cdc42. FEBS Lett. 587:3471–3479. 2013. View Article : Google Scholar : PubMed/NCBI
|
|
29
|
Susluer Yilaz S, Avci Biray C, Dodurga Y,
Ozlem Dogan Sigva Z, Oktar N and Gunduz C: Downregulation of
miR-195 via cyclosporin A in human glioblastoma cells. J BUON.
20:1337–1340. 2015.PubMed/NCBI
|
|
30
|
Chabre O, Libe R, Assie G, Barreau O,
Bertherat J, Bertagna X, Feige JJ and Cherradi N: Serum miR-483-5p
and miR-195 are predictive of recurrence risk in adrenocortical
cancer patients. Endocr Relat Cancer. 20:579–594. 2013. View Article : Google Scholar : PubMed/NCBI
|
|
31
|
Provenzano PP, Inman DR, Eliceiri KW,
Knittel JG, Yan L, Rueden CT, White JG and Keely PJ: Collagen
density promotes mammary tumor initiation and progression. BMC Med.
6:112008. View Article : Google Scholar : PubMed/NCBI
|
|
32
|
Feng Z and Levine AJ: The regulation of
energy metabolism and the IGF-1/mTOR pathways by the p53 protein.
Trends Cell Biol. 20:427–434. 2010. View Article : Google Scholar : PubMed/NCBI
|