Introduction
Ovarian cancer is one of the most common
gynecological malignancies and has numerous histological types;
epithelial ovarian cancer (EOC) accounts for 85–90% of ovarian
cancer cases (1). Due to the
anatomical location of the ovary, early lesions are not easy to
detect, which results in the diagnosis of the majority of ovarian
cancer patients at a late stage (2). Ovarian cancer has the characteristics
of early metastasis, recurrence and drug resistance; the 5-year
survival rate of ovarian cancer is only 30–40%, and the mortality
rate is the highest among the gynecological malignancies (3). Therefore, it is of great importance to
actively search for novel biomarkers to improve EOC diagnosis and
prognosis.
Glutamine is an abundant non-essential amino acid in
the human body, and a number of tumor cells consume much glutamine
and show the ‘glutamine dependence’ phenomenon (4). Glutamine is transported by cellular
transporters and is regarded as a precursor for the synthesis of
numerous nucleotides, amino acids, proteins and other biologically
important molecules; glutamine also provides glutathione and
nicotinamide adenine dinucleotide phosphate to maintain redox
homeostasis (5). Therefore,
glutamine serves a crucial role in cell metabolism and
proliferation. Aberrant bioenergetics is one of the markers of
cancer cells (6). To satisfy rapid
growth, cancer cells have to use another energy source, e.g.,
glutamine (7). A greater amount of
glutamine is used for anabolic metabolism in cancer cells than is
used in normal cells (8). Glutamine
metabolism restriction can suppress cancer cell proliferation
(9).
Glutamine must cross the plasma membrane to be used
by cells, and this process requires specific transporters (10). There are a number of types of
transporters used for transport across the plasma membrane,
including Na+-dependent system N,
Na+-dependent system A, Na+-independent
system L and Na+-dependent system Alanine serine
cysteine (ASC) (11). Moreover, the
transporter differs between normal cells and tumor cells (12). The ASC system is commonly expressed
in human cancer cells (13,14). Alanine serine cysteine-preferring
transporter 2 (ASCT2; also known as SLC1A5), belongs to the ASC
system And acts as a high-affinity glutamine transporter in cancer
cells (11). ASCT2 regulates the
uptake of amino acids, including glutamine (15,16).
Numerous studies have reported that ASCT2 is closely associated
with various cancer types, including breast cancer (17), clear-cell renal cell (18) and hepatocellular carcinoma (19), prostate (20), colorectal (21) and gastric cancer (22). In addition, downregulation of ASCT2
inhibits glutamine uptake, which successfully prevents tumor cell
proliferation in prostate cancer (20), non-small cell lung cancer (23,24),
melanoma (25) and acute myeloid
leukemia (26). However, studies
involved in determining the expression and clinical significance of
ASCT2 in EOC remain few in number.
Mechanistic target of rapamycin (mTOR) can be
activated by the increased consumption of glutamine in cancer,
which then promotes cell proliferation (27). In mammalian cells, mTOR has two
complexes, mTORC1 and mTORC2 (28,29).
The mTOR pathway serves an important role in the progression of
ovarian cancer (30). Blockade of
ASCT2 decreases glutamine uptake through downregulation of the
mTORC1 pathway in lymph node carcinoma in prostate cancer (20). However, the clinical significance of
mTOR expression in EOC remains unclear.
The present study investigated the association
between ASCT2 and p-mTOR expression and clinicopathological
features in EOC, and the impact of the proteins ASCT2 and p-mTOR on
the clinical factors, pathogenesis and prognosis of EOC. Moreover,
the association between these proteins and the expression of Ki-67
and CD34 in EOC was also evaluated.
Materials and methods
Patients
All methods were approved by the Research Medical
Ethics Committee of Kunming Medical University (Kunming, Yunnan,
China) and were performed in accordance with the approved
guidelines. Patients were retrospectively analyzed from between
April 18, 2007 and January 1, 2017, and these times were regarded
as the start and end points for measuring survival. The inclusion
criteria included the following: i) Patients with epithelial
ovarian cancer who were diagnosed according to clinical
manifestations and pathology, and for whom the clinicopathological
data were complete; and ii) patients who did not receive
radiotherapy and chemotherapy prior to surgery and who received
combined chemotherapy consisting of Taxol and cisplatin (TP
chemotherapy) following surgery. The exclusion criteria included
the following: i) Patients pathologically diagnosed with
reproductive cell tumors; ii) patients receiving neoadjuvant
chemotherapy or radiotherapy prior to surgery; and iii) patients
who received non-TP chemotherapy following surgery, or who did not
receive regular chemotherapy. A total of 104 eligible tissues were
collected from the patients at the First Affiliated Hospital of
Kunming Medical University. Another 17 normal ovarian tissues, 14
benign ovarian tumor tissues, 19 borderline ovarian tumor tissues
and 19 EOC tissues were used to obtain RNA and protein, and also
were obtained from the First Affiliated Hospital of Kunming Medical
University. The median age of these patients was 49 years, ranging
from 16 to 71 years. For immunohistochemical, tissues were fixed
with 10% formaldehyde, followed by dehydration and paraffin
embedding, and storage at room temperature. For the reverse
transcription-quantitative polymerase chain reaction (RT-qPCR) and
western blotting, tissues were kept at −80°C in a refrigerator. The
clinical data of the patients, including age, International
Federation of Gynecology and Obstetrics (FIGO) stage, tumor type,
pathological grade and preoperative serum tumor marker values were
collected. Tumor stages were histologically classified according to
the 2010 American Joint Committee on Cancer Tumor-Node-Metastasis
(TNM) classification (31).
RT-qPCR
The 17 normal ovarian tissues, 14 benign ovarian
tumor tissues, 19 borderline ovarian tumor tissues and 19 EOC
tissues were used to obtain RNA. RNA extraction was performed using
an RNAprep Pure Tissue kit (Tiangen Biotech, Co., Ltd., Beijing,
China) according to the manufacturer's protocols. RNA (1 µg) was
used for cDNA synthesis with a cDNA synthesis kit (Thermo Fisher
Scientific, Inc., Waltham, MA, USA) following the manufacturer's
protocols. qPCR was performed using TaqMan Fast Advanced Master mix
(Thermo Fisher Scientific, Inc.) on an ABI 7500 thermal cycler
(Applied Biosystems). The PCR content was as follows: 10 µl 2X PCR
Master mix, 1 µl primers and probe, 1 µl cDNA and ddH2O
up to a total reaction volume of 20 µl. The thermal cycling
protocol was as follows: Initial denaturation at 95°C for 5 min,
and 20 cycles of denaturation at 95°C for 10 min and annealing and
extension at 60°C for 60 sec. The β-actin gene was used as a
house-keeping gene. The relative mRNA expression was calculated by
the 2−ΔΔCq method (32).
The primers and TaqMan probe sequences for ASCT2 and β-actin were
as follows: ASCT2 forward, CTCCTTGATCCTGGCTGTGG, reverse,
GGGCAGCTCACTCTTCACTT and probe, CCGTCCTCAATGTAGAAGGTGACGC; β-actin
forward GCCAACACAGTGCTGTCT, reverse, GGAGCAATGATCTTGATCTT and
probe, TCACCAACTGGGACGACATGGAGAAA. The primer sequences for mTOR
were as follows: mTOR forward, CCAACAGTTCACCCTCAGGT and reverse,
GCTGCCACTCTCCAAGTTTC.
Western blot assay
Total protein was extracted by
radioimmunoprecipitation assay lysis buffer (Beyotime Institute of
Biotechnology, Shanghai, China). The concentrations of protein were
determined using a bicinchoninic acid protein assay kit (Beyotime
Institute of Biotechnology). A total of 30 µg protein per lane was
loaded on 10% SDS-PAGE gels and then transferred to a
polyvinylidene fluoride membrane and blocked with 10% skimmed milk
in Tris-buffered saline plus Tween-20 for 2 h at room temperature.
Subsequent to blocking, membranes were immunoblotted with rabbit
anti-ASCT2 antibody (1:1,000 dilution; cat. no. bs-0473R),
anti-p-mTOR antibody (Ser2481) (1:1,000 dilution; cat. no.
bs-3495R), anti-mTOR antibody (1:1,000 dilution; cat. no. bs-1992R)
and anti-GAPDH antibody (1:5,000 dilution; cat. no. bs-10900R) (all
Bioss, Beijing, China), as appropriate, at 4°C overnight, and were
then incubated with HRP-labeled goat anti-rabbit secondary
antibodies (1:2,000 dilution; cat. no. bs-0295G; Bioss) for 1 h at
room temperature. The blotted protein bands were visualized using
Pierce™ ECL Western Blotting Substrate (Thermo Fisher Scientific,
Inc.). The optical density of the resulting bands was determined by
Image J2× software (Rawak Software, Inc., Dresden, Germany)
(33), with normalization of the
densitometry measures to GAPDH.
Immunohistochemistry (IHC)
Sections (5-µm thick) were cut from paraffin
samples. Sections were dewaxed with ethanol and xylene, and were
then washed 3 times in phosphate-buffered saline (PBS). Next,
antigen repair was performed on the sections with 0.01 M citric
acid buffer (pH 6.0) at 100°C temperature and 80 kpa pressure.
Sections were blocked by incubation with 5% goat serum in PBS for
15 min at room temperature. The sections were then incubated with
anti-ASCT2 antibody (1:100 dilution; cat. no. bs-0473R),
anti-p-mTOR antibody (Ser2481) (1:100 dilution; cat. no. bs-3495R),
anti-CD34 antibody (1:100 dilution; catalog no. bs-0646R) and
anti-Ki-67 antibody (1:100 dilution; cat. no. bs-23102R) (all
Bioss), as appropriate, and then with horseradish
peroxidase-conjugated goat anti-rabbit antibody (1:200 dilution;
cat. no. bs-0295G; Bioss). Staining was detected in the sections
using a DAB kit (MXB Biotechnologies, Fuzhou, China) at room
temperature for 3–10 min, and the sections were then observed under
a microscope (Nikon Corporation, Tokyo, Japan). The percentage of
positive cells was scored as follows: 0, no positive cells; 1,
1–25% positive cells; 2, 26–50% positive cells; 3, 51–75% positive
cells; and 4, 76–100% positive cells. The intensity was estimated
as follows: 0, negative; 1, weak; 2, moderate; and 3, strong. The
percentage and intensity scores were multiplied; a total score of
<6 was considered as low expression, while a score of ≥7 was
considered as high expression.
Statistics
Differences in mRNA and protein expression were
calculated by one-way analysis of variance, followed by Tukey's
post hoc test. The survival curve was generated using the
Kaplan-Meier technique and differences between these curves were
analyzed by the log-rank test. Factors that had prognostic
significance in the univariate analysis were further analyzed using
a multivariate Cox regression model. Associations between
ASCT2/p-mTOR expression and clinicopathological characteristics
were analyzed by the χ2 test. Correlations between the
expression of ASCT2 and p-mTOR were analyzed by Spearman's
correlation analysis. For all tests, P<0.05 was considered to
indicate a statistically significant difference. All statistical
data were analyzed using SPSS 13.11 software (SPSS. Inc., Chicago,
IL, USA).
Results
mRNA and protein expression of ASCT2
in normal ovarian tissues and EOC tissues
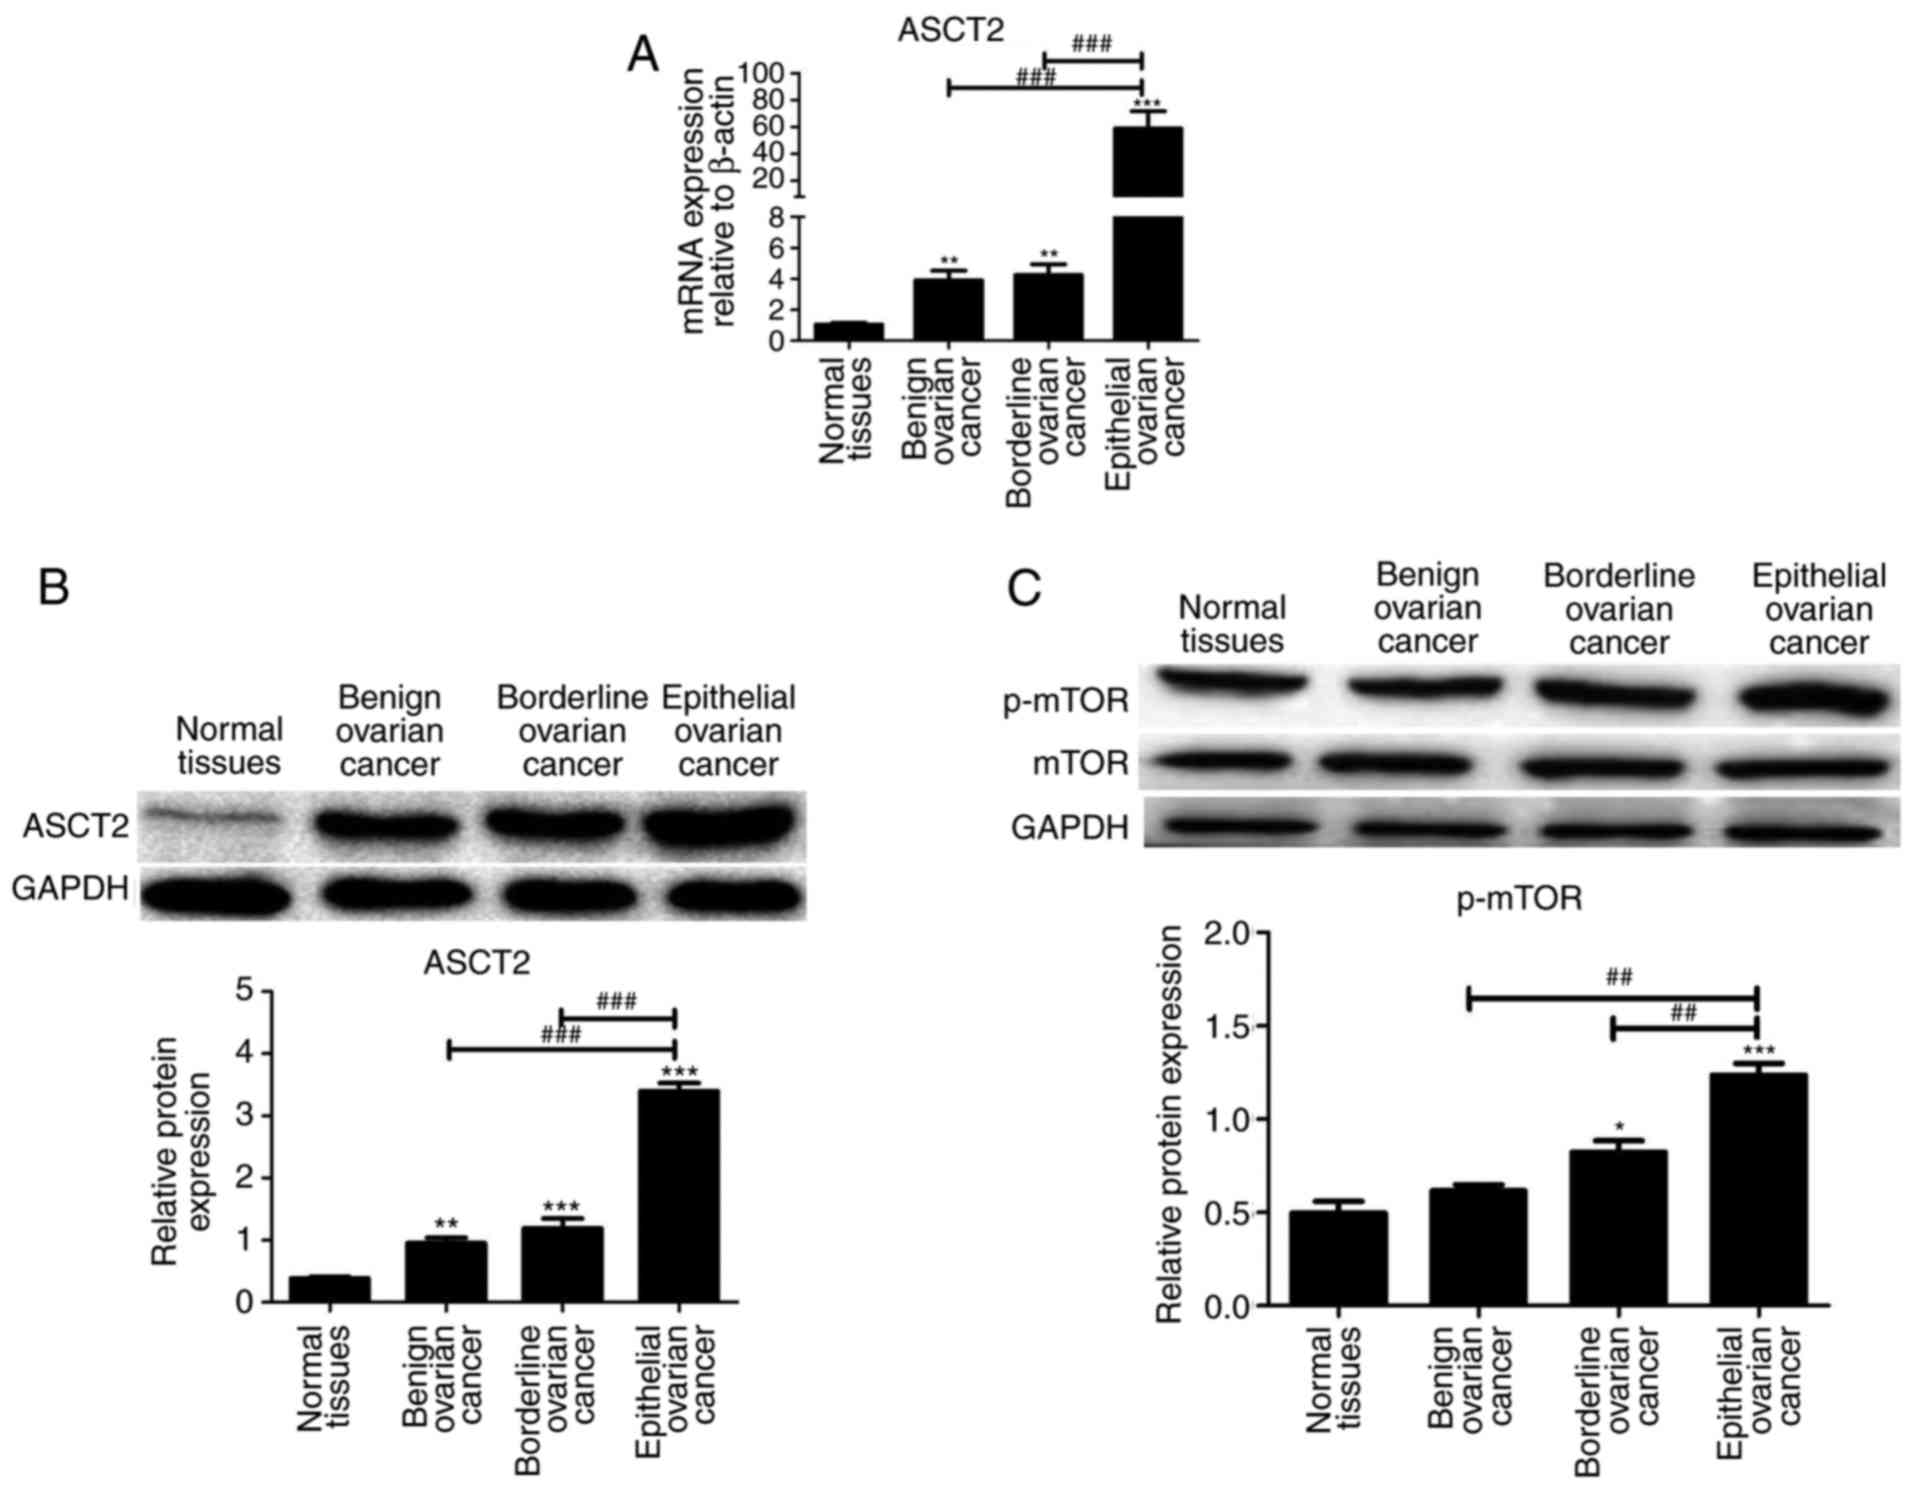
The mRNA and protein expression of ASCT2 was
analyzed by qPCR and western blotting, respectively, in normal
ovarian tissues, benign ovarian tumors, borderline ovarian tumors
and EOC tissues. ASCT2 mRNA and protein levels were markedly higher
in ovarian tumor tissues than in normal ovarian tissues, and were
highest in EOC tissues compared with that in benign ovarian tumor
and borderline ovarian tumor tissues (Fig. 1A and B). p-mTOR protein level was
markedly higher in EOC tissues compared with that in normal ovarian
tissues, benign ovarian tumors and borderline ovarian tumor tissues
(Fig. 1C). These results suggested
that the ASCT2 and p-mTOR levels in EOC are the highest compared
with that in other tissues. Thus, EOCs were used for subsequent
analysis of the association between ASCT2/p-mTOR and EOC.
Clinicopathological characteristics of
patients with EOC
A total of 104 patients with EOC were analyzed. The
clinicopathological characteristics of the 104 EOC patients are
summarized in Table I. The median
age of the patients was 49 years, ranging from 14 to 80 years. The
tumor types of the patients included 45 serous adenocarcinoma, 19
mucinous adenocarcinoma, 25 endometrioid adenocarcinoma, 12 clear
cell adenocarcinoma and 3 other histological types (Table I). The day of surgery was considered
as the start day for measuring postoperative survival.
 | Table I.Clinical characteristics of patients
with epithelial ovarian cancer. |
Table I.
Clinical characteristics of patients
with epithelial ovarian cancer.
|
Characteristics | Value |
|---|
| Total patients, n
(%) | 104 (100.00) |
| Age at surgery,
years |
|
|
Mean | 49.39 |
| FIGO stage, n
(%) |
|
| Stage
I | 32 (30.77) |
| Stage
II | 18 (17.31) |
| Stage
III | 45 (43.27) |
| Stage
IV | 9 (8.65) |
| Tumor type, n
(%) |
|
|
Serous | 45 (43.27) |
|
Mucinous | 19 (18.27) |
|
Endometrioid | 25 (24.04) |
| Clear
cell | 12 (11.54) |
|
Others | 3 (2.88) |
| Pathological grade,
n (%) |
|
| I | 41 (39.42) |
| II | 43 (41.35) |
|
III | 18 (17.31) |
| IV | 2 (1.92) |
| Ki-67, n (%) |
|
|
Low | 68 (65.38) |
|
High | 36 (34.62) |
| CD34, n (%) |
|
|
Positive | 13 (12.50) |
|
Negative | 91 (87.50) |
ASCT2/p-mTOR protein expression and
the association with the clinicopathological characteristics of
patients with EOC
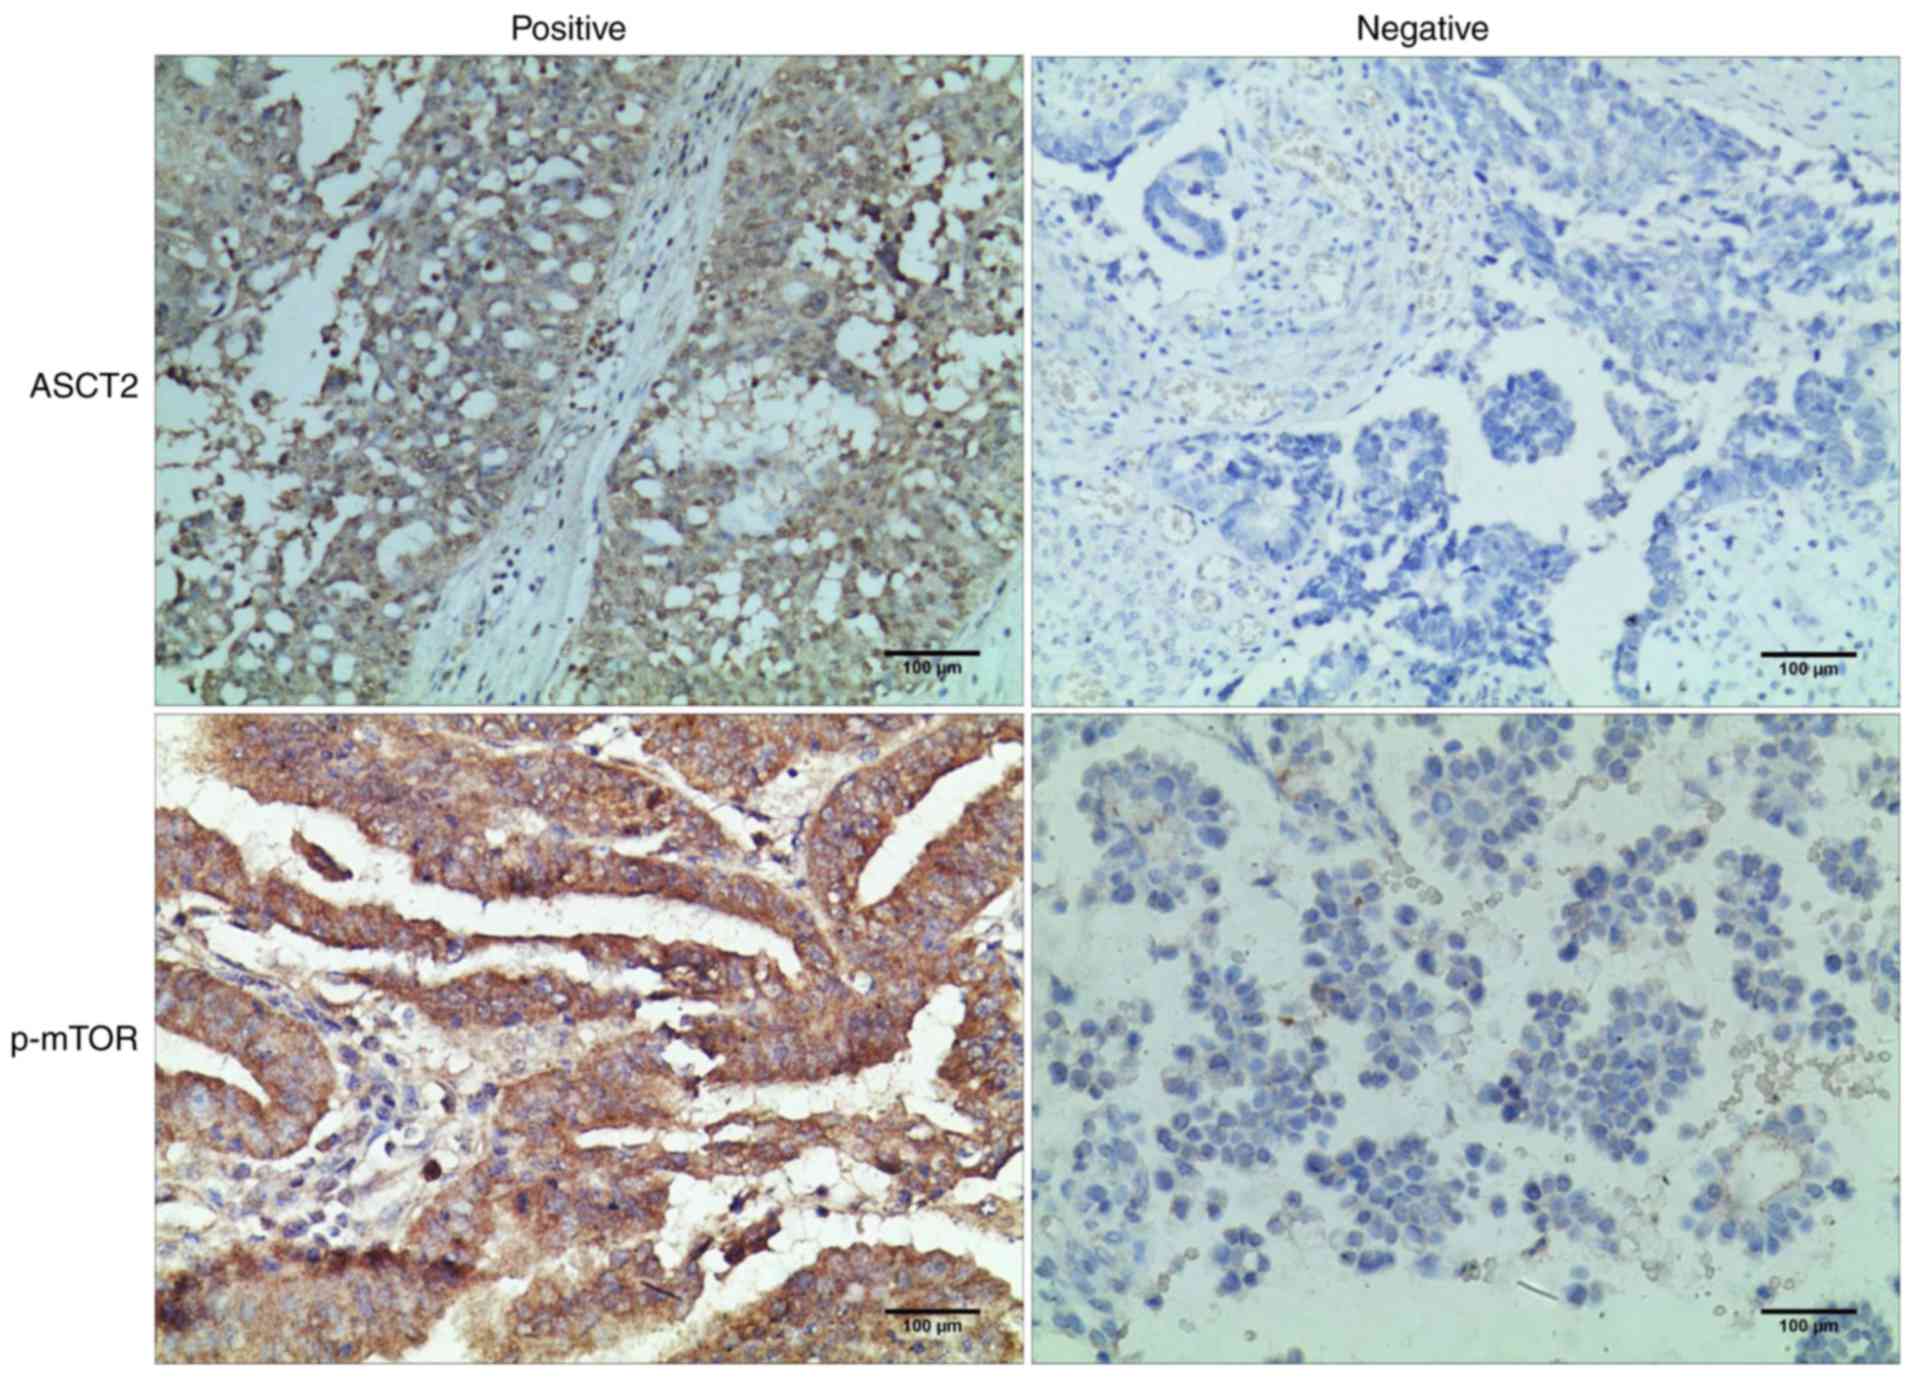
ASCT2 and p-mTOR levels were detected in 104
epithelial ovarian tumor tissues by IHC assay. The 104 patients
with EOC were divided into the low-expression group and
high-expression group according to the level of ASCT2 and p-mTOR
expression. As shown in Fig. 2A,
the ASCT2 protein was localized mainly on the plasma membrane. The
p-mTOR protein was localized mainly in the cytoplasm (Fig. 2). The ASCT2 percentage scores in the
high-expression and low-expression patient groups were 59.62%
(62/104) and 40.38% (42/104), respectively. The p-mTOR percentage
scores in the high-expression and low-expression patient groups
were 75.00% (78/104) and 25.00% (26/104), respectively (Table II). The association between ASCT2
or p-mTOR status and clinicopathological characteristics,
respectively, was also analyzed (Table
II). As shown in Table II, the
expression of ASCT2 and p-mTOR was significantly associated with
high FIGO stage (P<0.001), and the presence and concentration of
serum cancer antigen 125 (P<0.01), Ki-67 status (P<0.01) and
CD34 status (P<0.01). However, neither ASCT2 expression nor
p-mTOR expression was significantly associated with age. It was
also found that the expression of p-mTOR was significantly
associated with tumor type (P=0.006) and that the expression of
ASCT2 was significantly associated with pathological grade
(P=0.026) (Table II).
| Table II.Association between ASCT2/p-mTOR
expression and clinicopathological parameters. |
Table II.
Association between ASCT2/p-mTOR
expression and clinicopathological parameters.
|
|
| ASCT2 |
| p-mTOR |
|
|---|
|
|
|
|
|
|
|
|---|
|
Characteristics | n | Low | High |
P-valuea | Low | High |
P-valuea |
|---|
| Age at surgery,
years |
|
|
|
|
|
| 0.072 |
|
Mean | 49.39 | 50.11 | 48.33 | 0.265 | 50.72 | 45.42 |
|
| FIGO stage, n |
|
|
|
|
|
| <0.001 |
| Stage
I | 32 | 26 | 6 | <0.001 | 29 | 3 |
|
| Stage
II | 18 | 12 | 6 |
| 15 | 3 |
|
| Stage
III | 45 | 23 | 22 |
| 32 | 13 |
|
| Stage
IV | 9 | 1 | 8 |
| 2 | 7 |
|
| Tumor type, n |
|
|
|
|
|
| 0.006 |
|
Serous | 45 | 24 | 21 | 0.190 | 29 | 16 |
|
|
Mucinous | 19 | 10 | 9 |
| 13 | 6 |
|
|
Endometrioid | 25 | 18 | 7 |
| 22 | 3 |
|
| Clear
cell | 12 | 10 | 2 |
| 11 | 1 |
|
|
Others | 3 | 0 | 3 |
| 3 | 0 |
|
| Pathological grade,
n |
|
|
|
|
|
| 0.426 |
| I | 41 | 19 | 22 | 0.026 | 29 | 12 |
|
| II | 43 | 28 | 15 |
| 33 | 10 |
|
|
III | 18 | 15 | 3 |
| 3 | 3 |
|
| IV | 2 | 0 | 2 |
| 1 | 1 |
|
| Serum CA125, n |
|
|
|
|
|
| 0.001 |
|
Mean | 129.98 | 89.17 | 334.83 | <0.001 | 98.24 | 319.75 |
|
| Ki-67, n |
|
|
|
|
|
| 0.004 |
|
Low | 68 | 48 | 20 | 0.002 | 57 | 11 |
|
|
High | 36 | 14 | 22 |
| 21 | 15 |
|
| CD34, n |
|
|
|
|
|
| 0.001 |
|
Positive | 13 | 3 | 10 | 0.004 | 5 | 8 |
|
|
Negative | 91 | 59 | 32 |
| 73 | 18 |
|
Furthermore, the correlation analysis of ASCT2
expression and p-mTOR expression suggested a positive correlation
between these two proteins in EOC patients (r=0.385, P<0.001)
(Table III).
| Table III.Correlation between the expression of
ASCT2 and p-mTOR. |
Table III.
Correlation between the expression of
ASCT2 and p-mTOR.
|
| ASCT2 |
|
|
|---|
|
|
|
|
|
|---|
| p-mTOR | Low | High | Total | r |
P-valuea |
|---|
| Low | 55 | 7 | 62 | 0.385 | <0.001 |
| High | 23 | 19 | 42 |
|
|
| Total | 78 | 26 | 104 |
|
|
Prognostic value of ASCT2/p-mTOR
expression in EOC
Univariate analysis was used to evaluate
ASCT2/p-mTOR protein expression and other clinicopathological
parameters for their prognostic value in EOC. High expression of
ASCT2, high expression of p-mTOR, high FIGO stage, high serum CA125
level, high Ki-67 level and high CD34 status were significantly
associated with poor overall survival. These parameters were
unfavorable predictors for overall survival of EOC patients
(Table IV). Subsequently, these
prognostic factors were further analyzed by multivariate Cox
proportional hazards regression model analysis. This analysis
revealed that high expression of ASCT2 [hazard ratio (HR), 2.062;
P=0.036], high expression of p-mTOR (HR, 0.377; P=0.015), FIGO
stage (HR, 2.329; P<0.001) and Ki-67 status (HR, 2.111; P=0.018)
were prognostic markers of overall survival of EOC patients
(Table IV).
| Table IV.Univariate and multivariate analysis
of overall survival in patients with epithelial ovarian cancer. |
Table IV.
Univariate and multivariate analysis
of overall survival in patients with epithelial ovarian cancer.
|
| Univariate
analysis | Multivariate
analysis |
|---|
|
|
|
|
|---|
| Variable |
P-valuea | HR | 95% CI |
P-valueb |
|---|
| Age at surgery,
years | ns |
|
|
|
| FIGO stage | <0.001 | 2.329 | 1.536–3.529 | <0.001 |
| Tumor type | ns |
|
|
|
| Pathological
grade | ns |
|
|
|
| Serum ca125 | <0.001 |
|
| ns |
| Ki-67 | <0.001 | 2.111 | 1.136–3.924 | 0.018 |
| CD34 | <0.001 |
|
| ns |
| ASCT2 | <0.001 | 2.062 | 1.050–4.048 | 0.036 |
| p-mTOR | 0.046 | 0.377 | 0.172–0.827 | 0.015 |
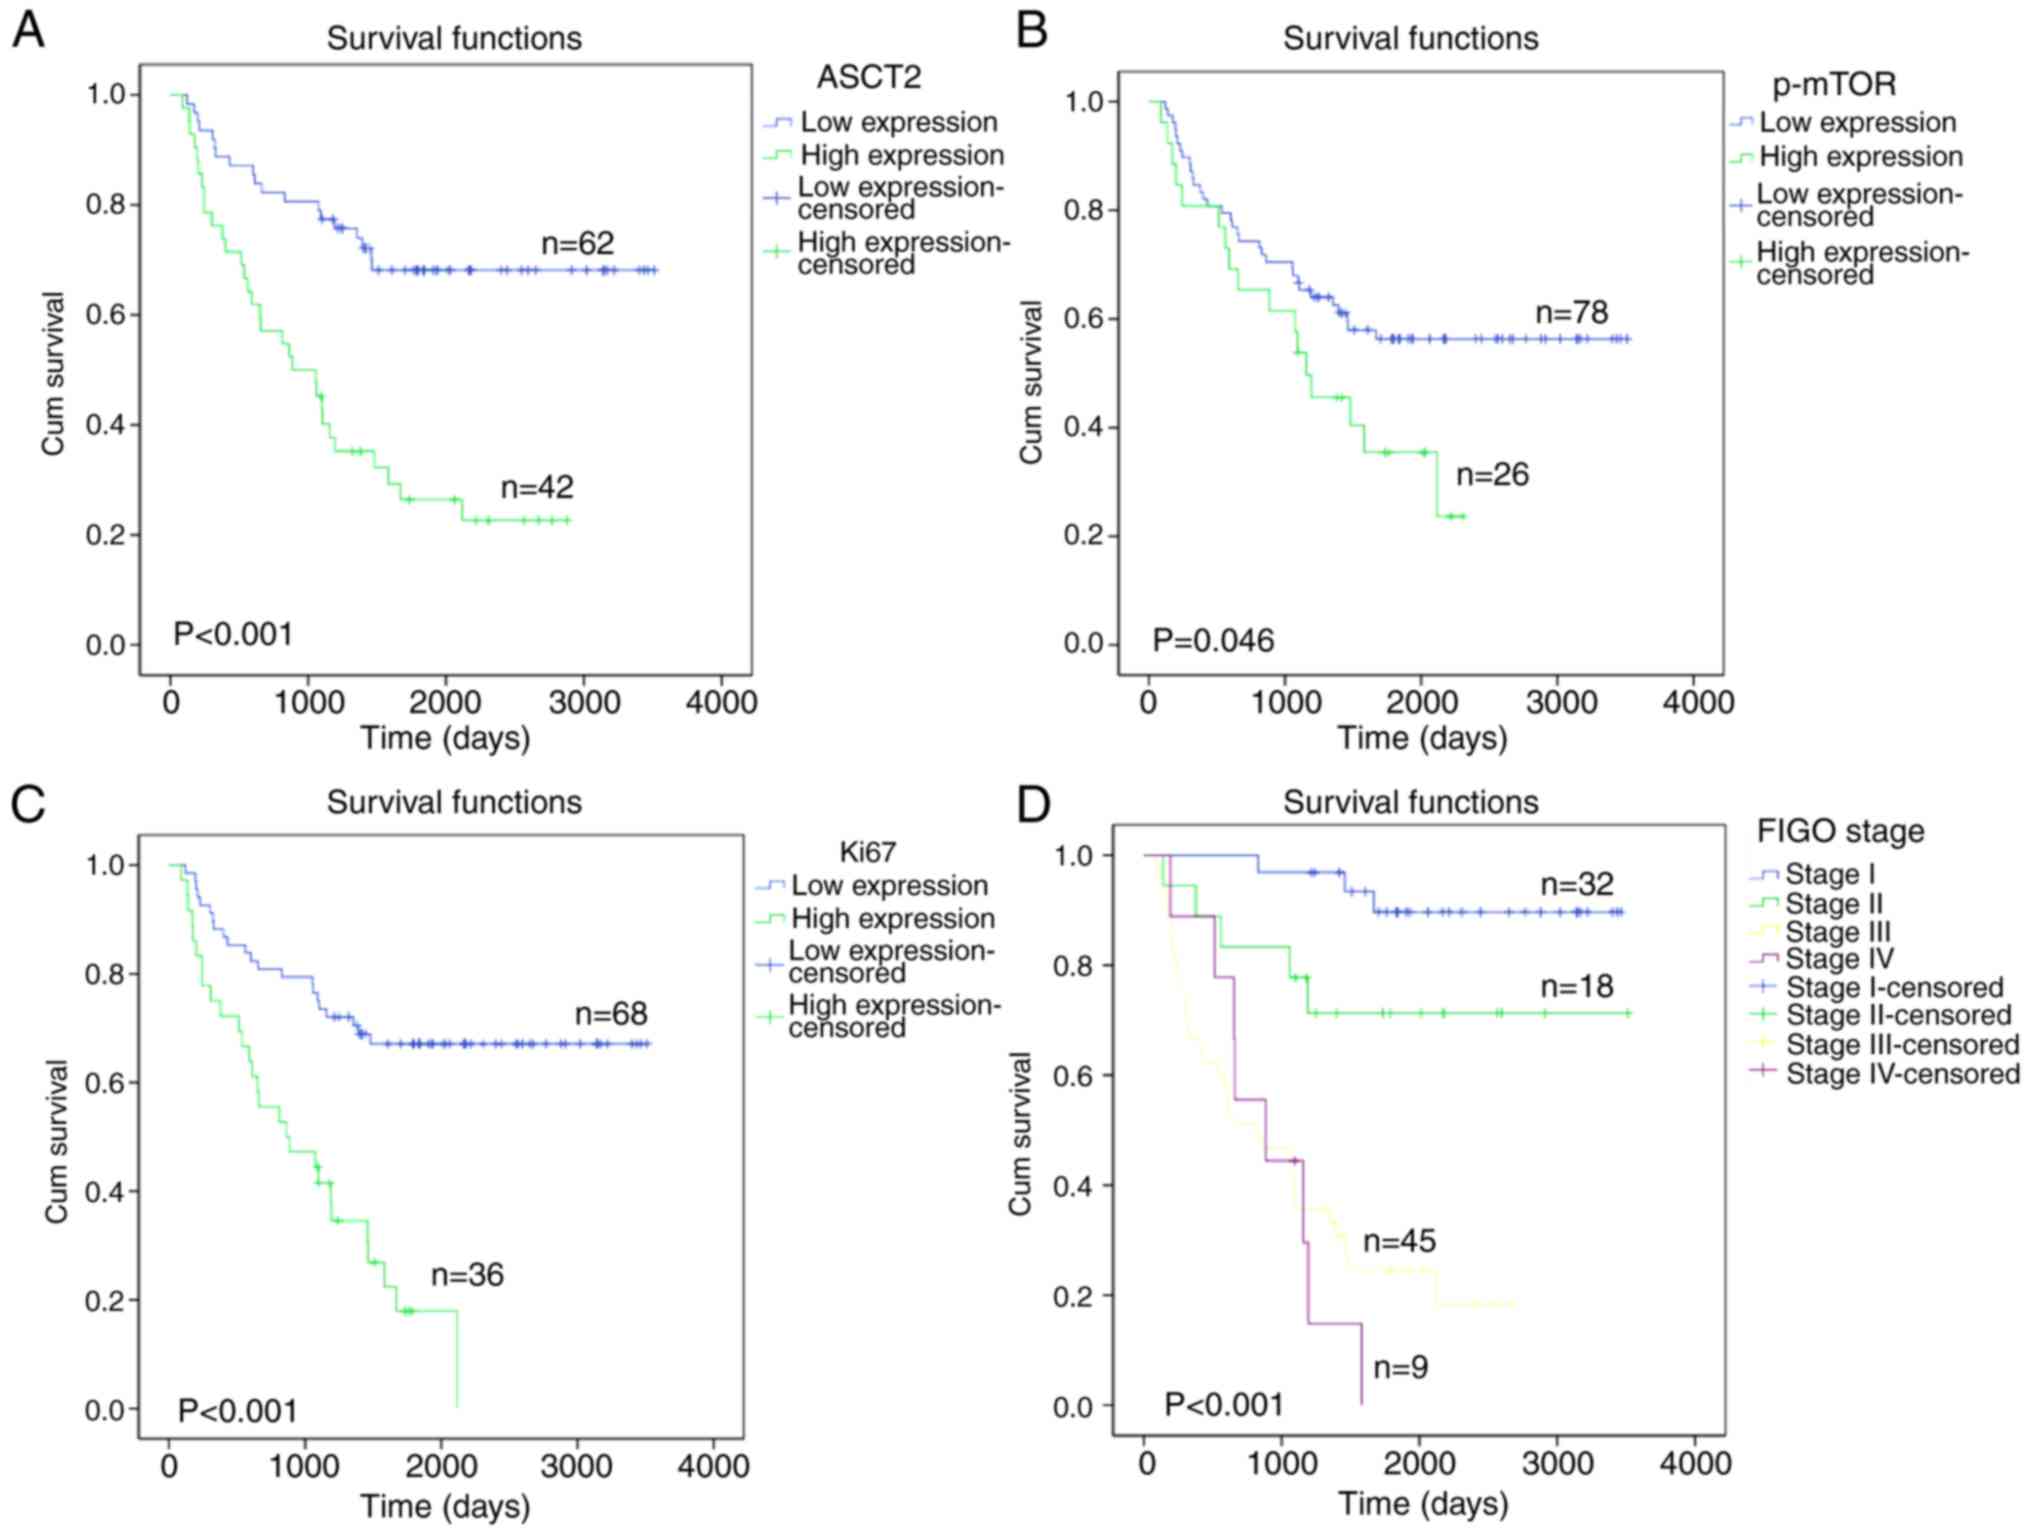
Kaplan-Meier survival curves of patients with
positive and negative ASCT2/p-mTOR expression were generated. These
curves indicated that the patient survival rate was significantly
associated with ASCT2/p-mTOR expression. The association between
ASCT2 protein expression and overall survival was analyzed and it
was found that patients with low ASCT2 (P<0.001) or p-mTOR
(P=0.046) expression experienced a significantly longer overall
survival time compared with that of patients with high ASCT2 or
p-mTOR expression (Fig. 3A and B).
In addition, patients with high Ki-67 expression had a poorer
overall survival rate (P<0.001) than patients with low Ki-67
expression (Fig. 3C), and patients
in FIGO stage IV had a lower overall survival rate (P<0.001)
than patients in TNM stages I–III (Fig.
3D).
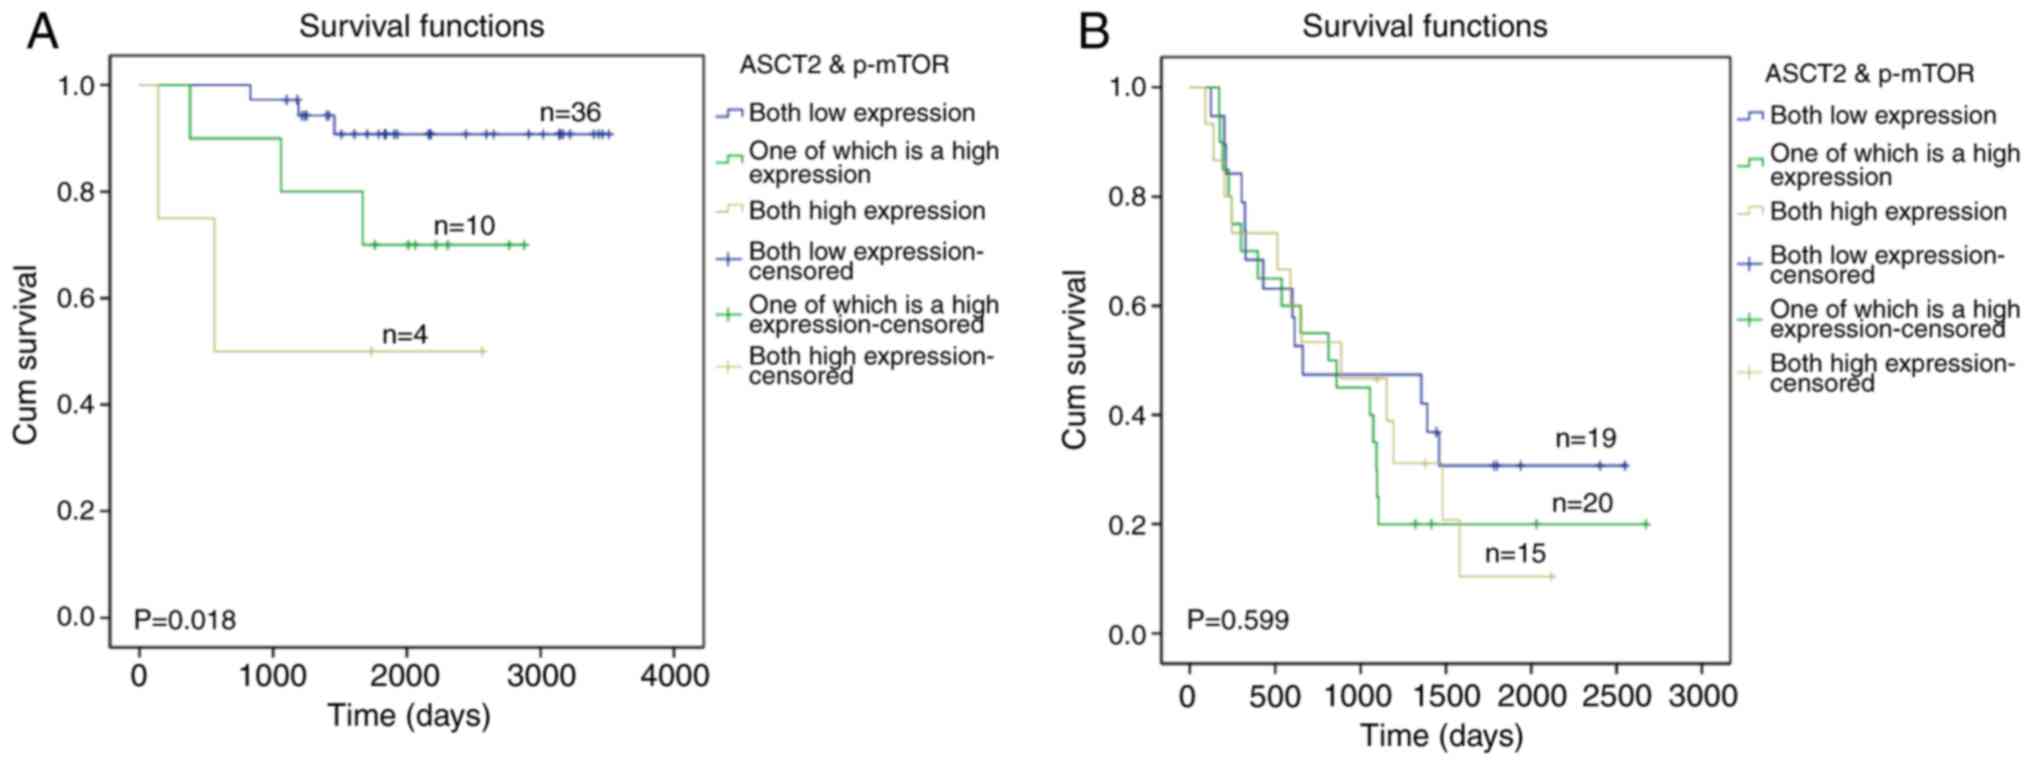
As shown in Fig. 4A,
the overall survival rate of patients with low expression of ASCT2
and p-mTOR was longer than patients with high expression of either
ASCT2 or p-mTOR (P=0.036) in early EOC patients. Importantly, it
was also found that the overall survival rate of patients with high
expression of ASCT2 and p-mTOR was shorter than patients with low
expression of ASCT2 and p-mTOR (P<0.001) and patients with high
expression of either ASCT2 or p-mTOR (P=0.024) in patients with
early-stage EOC. However, as shown in Fig. 4B, there was no significant
difference between the groups with high expression of ASCT2 and
p-mTOR or with high expression of either ASCT2 or p-mTOR (P=0.599)
in the patients with terminal-stage EOC. These results indicated
that the combined detection of ASCT2 and p-mTOR may serve as a
potential marker to inform diagnosis and targeted therapy options
for early EOC patients but not for terminal EOC patients.
Discussion
Amino acid metabolism and the involved transporters
are crucial for the proliferation and growth of cancer cells
(34). ASCT2, an important
glutamine transporter has been reported to be upregulated in
numerous cancer types, including breast cancer, clear cell renal
cell carcinoma and lung cancer (17,18,35,36).
ASCT2 levels are correspondingly increased in cancer (11). It was reported that the activation
of mTOR was associated with adverse prognostic factors in EOC
(37,38). Elevated ASCT2 expression promoted
cell growth and survival through mTOR signaling in lung cancer
(23). However, the association
between ASCT2 and p-mTOR proteins, and the clinical significance of
this association in patients with EOC remains unknown. To the best
of our knowledge, the present clinicopathological study is the
first to investigate the clinical significance of ASCT2 and p-mTOR,
and the association between them, in patients with EOC.
The present results showed that ASCT2 was highly
expressed in EOC tissues compared with that in normal, benign and
borderline ovarian cancer tissues. However, a previous study
reported that ASCT2 expression was upregulated in the majority of
EOC cases, and that there was no significant difference between EOC
tissue and borderline malignancy (39). One important cause for this
difference between the present study and the previous study may be
that the southwest of China is contains more areas with ethnic
minorities, thus there are certain differences in ethnicity. Our
future research will focus on the influence of differences in
ethnicity in EOC patients.
In the present study, the expression of ASCT2 was
associated with pathological variables, including cell
proliferation (Ki-67), angiogenesis (angiogenic markers,
microvessel density as determined by CD34 expression) and the
activation of the mTOR signaling pathway. It was found that the
expression levels of ASCT2 and p-mTOR were significantly associated
with FIGO stage (P<0.001), serum CA125 concentration
(P<0.01), Ki-67 status (P<0.01) and CD34 status (P<0.01).
However, neither ASCT2 expression nor p-mTOR expression were
significantly associated with age.
These findings suggest that ASCT2 and the mTOR
signaling pathway are activated and probably serve an important
role in the development of EOC. Although Kaira et al
(39) reported that ASCT2 was
highly expressed in ovarian tumors, indicating that ASCT2 is
associated with the prognosis of ovarian tumors, the present study
focused on the prognostic significance of ASCT2 in EOC and
evaluated the associations between ASCT2 and p-mTOR in EOC.
In a previous report, glutamine promoted ovarian
cancer cell proliferation through the mTOR/S6 pathway, suggesting a
close association between amino acid metabolism and the mTOR
signaling pathway (40). ASCT2
mediates the uptake of glutamine in tumors. In the present study,
it was found that ASCT2 expression was positively associated with
p-mTOR expression. Using Kaplan-Meier survival curve analysis,
either high expression of ASCT2 or high expression of p-mTOR was
significant associated with poor overall survival. Furthermore, it
was found that there was a positive correlation between ASCT2
expression and p-mTOR expression in EOC patients. The Kaplan-Meier
survival curves for EOC patients by ASCT2/p-mTOR expression showed
that patients with higher co-expression of ASCT2/p-mTOR experienced
shorter survival times than patients with low co-expression and
patients with high expression of either ASCT2 or p-mTOR in the
early-stage patients, but this association was not true for
terminal-stage patients with EOC. This finding indicated that ASCT2
and p-mTOR may play a mutual role in EOC, as demonstrated by the
marked correlation between ASCT2 and p-mTOR expression levels in
early-stage patients with EOC.
In summary, the present study demonstrated the
association between ASCT2/p-mTOR expression levels and the
prognosis of patients with EOC. Although the high expression of
ASCT2 or p-mTOR alone was identified as a significant prognostic
predictor, the coexpression of ASCT2 and p-mTOR was a more powerful
indicator for predicting worse outcome in early-stage patients with
EOC. This study suggests that ASCT2 and p-mTOR expression may be
promising prognostic biomarkers and therapeutic targets in
early-stage EOC.
Acknowledgements
Not applicable.
Funding
This project was supported by funding from the
Yunling Scholar Foundation of the First Affiliated Hospital of
Kunming Medical University (grant no. 2016BS001), the Key Science
and Technology Planning Project of Kunming Science and Technology
Bureau and the Key Science and Technology Planning Project of
Yunnan Provincial Science and Technology Department (grant no.
2016FC005).
Availability of data and materials
All data generated or analyzed during this study are
included in this published article and are freely available to any
researchers.
Authors' contributions
HW, KW and HG conceived and designed the
experiments; YX, FW, ZS, XT and HQ performed the experiments and
analyzed the data; and YX wrote the manuscript. All authors have
read and approved the final manuscript.
Ethics approval and consent to
participate
All human tissue samples were collected by the First
Affiliated Hospital of Kunming Medical University and written
informed consent was obtained from all patients. All methods were
approved by the Research Medical Ethics Committee of Kunming
Medical University and were performed in accordance with the
approved guidelines.
Patient consent for publication
Not applicable.
Competing interests
The authors declare that they have no competing
interests.
References
|
1
|
Morgan RJ Jr, Alvarez RD, Armstrong DK,
Boston B, Burger RA, Chen LM, Copeland L, Crispens MA, Gershenson
D, Gray HJ, et al: Epithelial ovarian cancer. J Natl Compr Canc
Netw. 9:82–113. 2011. View Article : Google Scholar : PubMed/NCBI
|
|
2
|
Prat J: Ovarian carcinomas: Five distinct
diseases with different origins, genetic alterations, and
clinicopathological features. Virchows Arch. 460:237–249. 2012.
View Article : Google Scholar : PubMed/NCBI
|
|
3
|
Siegel R, Ward E, Brawley O and Jemal A:
Cancer statistics, 2011: The impact of eliminating socioeconomic
and racial disparities on premature cancer deaths. CA Cancer J
Clin. 61:212–236. 2011. View Article : Google Scholar : PubMed/NCBI
|
|
4
|
Hensley CT, Wasti AT and DeBerardinis RJ:
Glutamine and cancer: Cell biology, physiology, and clinical
opportunities. J Clin Invest. 123:3678–3684. 2013. View Article : Google Scholar : PubMed/NCBI
|
|
5
|
Mohamed A, Deng X, Khuri FR and Owonikoko
TK: Altered glutamine metabolism and therapeutic opportunities for
lung cancer. Clin Lung Cancer. 15:7–15. 2014. View Article : Google Scholar : PubMed/NCBI
|
|
6
|
Hanahan D and Weinberg RA: Hallmarks of
cancer: The next generation. Cell. 144:646–674. 2011. View Article : Google Scholar : PubMed/NCBI
|
|
7
|
Zhdanov AV, Waters AH, Golubeva AV,
Dmitriev RI and Papkovsky DB: Availability of the key metabolic
substrates dictates the respiratory response of cancer cells to the
mitochondrial uncoupling. Biochim Biophys Acta. 1837:51–62. 2014.
View Article : Google Scholar : PubMed/NCBI
|
|
8
|
Herrera Gonzalez KN, Lee J and Haigis MC:
Intersections between mitochondrial sirtuin signaling and tumor
cell metabolism. Crit Rev Biochem Mol Biol. 50:242–255. 2015.
View Article : Google Scholar : PubMed/NCBI
|
|
9
|
Fuchs BC and Bode BP: Stressing out over
survival: Glutamine as an apoptotic modulator. J Surg Res.
131:26–40. 2006. View Article : Google Scholar : PubMed/NCBI
|
|
10
|
Medina MA, Sánchez-Jimenez F, Márquez J,
Quesada Rodriguez A and de Castro Nuñez I: Relevance of glutamine
metabolism to tumor cell growth. Mol Cell Biochem. 113:1–15. 1992.
View Article : Google Scholar : PubMed/NCBI
|
|
11
|
Fuchs BC and Bode BP: Amino acid
transporters ASCT2 and LAT1 in cancer: Partners in crime? Semin
Cancer Biol. 15:254–266. 2005. View Article : Google Scholar : PubMed/NCBI
|
|
12
|
Dolinska M, Dybel A, Zablocka B and
Albrecht J: Glutamine transport in C6 glioma cells shows ASCT2
system characteristics. Neurochem Int. 43:501–507. 2003. View Article : Google Scholar : PubMed/NCBI
|
|
13
|
Kilberg MS, Stevens BR and Novak DA:
Recent advances in mammalian amino acid transport. Annu Rev Nutr.
13:137–165. 1993. View Article : Google Scholar : PubMed/NCBI
|
|
14
|
McGivan JD and Pastor-Anglada M:
Regulatory and molecular aspects of mammalian amino acid transport.
Biochem J. 299:321–334. 1994. View Article : Google Scholar : PubMed/NCBI
|
|
15
|
Kanai Y and Hediger MA: The
glutamate/neutral amino acid transporter family SLC1: Molecular,
physiological and pharmacological aspects. Pflugers Arch.
447:469–479. 2004. View Article : Google Scholar : PubMed/NCBI
|
|
16
|
Kekuda R, Prasad PD, Fei YJ,
Torres-Zamorano V, Sinha S, Yang-Feng TL, Leibach FH and Ganapathy
V: Cloning of the sodium-dependent, broad-scope, neutral amino acid
transporter Bo from a human placental choriocarcinoma cell line. J
Biol Chem. 271:18657–18661. 1996. View Article : Google Scholar : PubMed/NCBI
|
|
17
|
van Geldermalsen M, Wang Q, Nagarajah R,
Marshall AD, Thoeng A, Gao D, Ritchie W, Feng Y, Bailey CG, Deng N,
et al: ASCT2/SLC1A5 controls glutamine uptake and tumour growth in
triple-negative basal-like breast cancer. Oncogene. 35:3201–3208.
2016. View Article : Google Scholar : PubMed/NCBI
|
|
18
|
Liu Y, Yang L, An H, Chang Y, Zhang W, Zhu
Y, Xu L and Xu J: High expression of solute carrier family 1,
member 5 (SLC1A5) is associated with poor prognosis in clear-cell
renal cell carcinoma. Sci Rep. 5:169542015. View Article : Google Scholar : PubMed/NCBI
|
|
19
|
Sun HW, Yu XJ, Wu WC, Chen J, Shi M, Zheng
L and Xu J: GLUT1 and ASCT2 as predictors for prognosis of
hepatocellular carcinoma. PLoS One. 11:e01689072016. View Article : Google Scholar : PubMed/NCBI
|
|
20
|
Wang Q, Hardie RA, Hoy AJ, van
Geldermalsen M, Gao D, Fazli L, Sadowski MC, Balaban S, Schreuder
M, Nagarajah R, et al: Targeting ASCT2-mediated glutamine uptake
blocks prostate cancer growth and tumour development. J Pathol.
236:278–289. 2015. View Article : Google Scholar : PubMed/NCBI
|
|
21
|
Toda K, Nishikawa G, Iwamoto M, Itatani Y,
Takahashi R, Sakai Y and Kawada K: Clinical role of ASCT2 (SLC1A5)
in KRAS-mutated colorectal cancer. Int J Mol Sci. 18:pii:
E16322017. View Article : Google Scholar
|
|
22
|
Kasai N, Sasakawa A, Hosomi K, Poh TW,
Chua BL, Yong WP, So J, Chan SL, Soong R, Kono K, et al: Anti-tumor
efficacy evaluation of a novel monoclonal antibody targeting
neutral amino acid transporter ASCT2 using patient-derived
xenograft mouse models of gastric cancer. Am J Transl Res.
9:3399–3410. 2017.PubMed/NCBI
|
|
23
|
Hassanein M, Hoeksema MD, Shiota M, Qian
J, Harris BK, Chen H, Clark JE, Alborn WE, Eisenberg R and Massion
PP: SLC1A5 mediates glutamine transport required for lung cancer
cell growth and survival. Clin Cancer Res. 19:560–570. 2013.
View Article : Google Scholar : PubMed/NCBI
|
|
24
|
Hassanein M, Qian J, Hoeksema MD, Wang J,
Jacobovitz M, Ji X, Harris FT, Harris BK, Boyd KL, Chen H, et al:
Targeting SLC1a5-mediated glutamine dependence in non-small cell
lung cancer. Int J Cancer. 137:1587–1597. 2015. View Article : Google Scholar : PubMed/NCBI
|
|
25
|
Wang Q, Beaumont KA, Otte NJ, Font J,
Bailey CG, van Geldermalsen M, Sharp DM, Tiffen JC, Ryan RM,
Jormakka M, et al: Targeting glutamine transport to suppress
melanoma cell growth. Int J Cancer. 135:1060–1071. 2014. View Article : Google Scholar : PubMed/NCBI
|
|
26
|
Willems L, Jacque N, Jacquel A, Neveux N,
Maciel TT, Lambert M, Schmitt A, Poulain L, Green AS, Uzunov M, et
al: Inhibiting glutamine uptake represents an attractive new
strategy for treating acute myeloid leukemia. Blood. 122:3521–3532.
2013. View Article : Google Scholar : PubMed/NCBI
|
|
27
|
Wise DR and Thompson CB: Glutamine
addiction: A new therapeutic target in cancer. Trends Biochem Sci.
35:427–433. 2010. View Article : Google Scholar : PubMed/NCBI
|
|
28
|
Montero JC, Chen X, Ocaña A and Pandiella
A: Predominance of mTORC1 over mTORC2 in the regulation of
proliferation of ovarian cancer cells: Therapeutic implications.
Mol Cancer Ther. 11:1342–1352. 2012. View Article : Google Scholar : PubMed/NCBI
|
|
29
|
Zoncu R, Efeyan A and Sabatini DM: mTOR:
From growth signal integration to cancer, diabetes and ageing. Nat
Rev Mol Cell Biol. 12:21–35. 2011. View
Article : Google Scholar : PubMed/NCBI
|
|
30
|
Dobbin ZC and Landen CN: The importance of
the PI3K/AKT/MTOR pathway in the progression of ovarian cancer. Int
J Mol Sci. 14:8213–8227. 2013. View Article : Google Scholar : PubMed/NCBI
|
|
31
|
Edge SB and Compton CC: The American Joint
Committee on Cancer: The 7th edition of the AJCC cancer staging
manual and the future of TNM. Ann Surg Oncol. 17:1471–1474. 2010.
View Article : Google Scholar : PubMed/NCBI
|
|
32
|
Livak KJ and Schmittgen TD: Analysis of
relative gene expression data using real-time quantitative PCR and
the 2−ΔΔCT method. Methods. 25:402–408. 2001. View Article : Google Scholar : PubMed/NCBI
|
|
33
|
Gallo-Oller G, Ordoñez R and Dotor J: A
new background subtraction method for Western blot densitometry
band quantification through image analysis software. J Immunol
Methods. 457:1–5. 2018. View Article : Google Scholar : PubMed/NCBI
|
|
34
|
Hammoudi N, Ahmed KB, Garcia-Prieto C and
Huang P: Metabolic alterations in cancer cells and therapeutic
implications. Chin J Cancer. 30:508–525. 2011. View Article : Google Scholar : PubMed/NCBI
|
|
35
|
Huang F, Zhao Y, Zhao J, Wu S, Jiang Y, Ma
H and Zhang T: Upregulated SLC1A5 promotes cell growth and survival
in colorectal cancer. Int J Clin Exp Pathol. 7:6006–6014.
2014.PubMed/NCBI
|
|
36
|
Shimizu K, Kaira K, Tomizawa Y, Sunaga N,
Kawashima O, Oriuchi N, Tominaga H, Nagamori S, Kanai Y, Yamada M,
et al: ASC amino-acid transporter 2 (ASCT2) as a novel prognostic
marker in non-small cell lung cancer. Br J Cancer. 110:2030–2039.
2014. View Article : Google Scholar : PubMed/NCBI
|
|
37
|
Noske A, Lindenberg JL, Darb-Esfahani S,
Weichert W, Buckendahl AC, Röske A, Sehouli J, Dietel M and Denkert
C: Activation of mTOR in a subgroup of ovarian carcinomas:
Correlation with p-eIF-4E and prognosis. Oncol Rep. 20:1409–1417.
2008.PubMed/NCBI
|
|
38
|
No JH, Jeon YT, Park IA, Kim YB, Kim JW,
Park NH, Kang SB, Han JY, Lim JM and Song YS: Activation of mTOR
signaling pathway associated with adverse prognostic factors of
epithelial ovarian cancer. Gynecol Oncol. 121:8–12. 2011.
View Article : Google Scholar : PubMed/NCBI
|
|
39
|
Kaira K, Nakamura K, Hirakawa T, Imai H,
Tominaga H, Oriuchi N, Nagamori S, Kanai Y, Tsukamoto N, Oyama T,
et al: Prognostic significance of L-type amino acid transporter 1
(LAT1) expression in patients with ovarian tumors. Am J Transl Res.
7:1161–1171. 2015.PubMed/NCBI
|
|
40
|
Yuan L, Sheng X, Willson AK, Roque DR,
Stine JE, Guo H, Jones HM, Zhou C and Bae-Jump VL: Glutamine
promotes ovarian cancer cell proliferation through the mTOR/S6
pathway. Endocr Relat Cancer. 22:577–591. 2015. View Article : Google Scholar : PubMed/NCBI
|