Introduction
Osteosarcoma is the most common primary malignant
tumor of the bones, which usually occurs in the rapidly growing
backbone epiphysis (1). Despite
improvements in the efficacy of surgery combined with radiotherapy
and/or chemotherapy, the 5-year survival rate of metastatic
osteosarcoma patients is still less than 20%. Most patients with
osteosarcoma succumb from lung metastases. At initial diagnosis,
approximately 20% of patients present with lung metastases whereas
40% of patients develop metastases at a later stage (2). There are currently no approved
targeted therapies for osteosarcoma. Therefore, identifying the
molecular mechanisms underlying osteosarcoma growth and metastasis
is important to facilitate the development of effective therapeutic
strategies of osteosarcoma.
COX-2 is an important rate-limiting enzyme that
metabolizes arachidonic acid (AA) to endogenous prostaglandin (PG)
(3). Overexpression of COX-2 mainly
enhances the activation of the AA/PG pathway and accelerates the
production of PGE2, thus promoting tumorigenesis (4). The COX-2/AA/PGE2 pathway is involved
in inflammatory response, carcinogenesis, angiogenesis, invasion
and metastasis of several tumors (5–7).
Exogenous PGE2 promotes the growth of osteosarcoma and represses
the effects of meloxicam on cell viability (8). Recent studies have shown that the
percentage of osteosarcoma with COX-2 positivity ranges from 67 to
92%, and it is greater in metastatic lesions than that of the
primary site (9,10). The inhibition of COX-2/PGE2
expression has become one of the promising targets for the
treatment of osteosarcoma.
SND1 is a multifunctional protein involved in
multiple cellular processes, such as cell differentiation, cell
proliferation, adipogenesis and lipid droplets in cellular stress
responses. Initially, SND1 was identified as a transcriptional
co-activator of Epstein-Barr virus nuclear antigen 2 (EBNA2) and
subsequently found to interact with other transcription factors,
such as c-Myb, Pim-1, signal transducer and activator of
transcription 5 (STAT5), and STAT6 (11). In addition, SND1 is a component of
the RNA-induced silencing complex (RISC) that regulates
RNAi-mediated gene silencing (12).
Recent studies have shown that SND1 is highly expressed in multiple
types of cancer, including liver, colon, breast and prostate cancer
and glioma (13). To date, the role
of SND1 in the carcinogenic process is not well understood.
The NF-κB pathway is one of the most important
pathways involved in inflammation and carcinogenesis (14). Inhibition of the NF-κB pathway
represses the growth and increases the sensitivity of osteosarcoma
to chemotherapies in vitro and in vivo (15). A recent study has revealed that SND1
promoted the development of hepatocellular cancer by activating
NF-κB pathways (16). The
activation of NF-κB is involved in the transcription of
PTGS2, which is the encoding gene of COX-2 protein. In our
preliminary experiments, we detected the protein level of SND1 and
COX-2 in 12 fresh osteosarcoma tissues by western blotting and
found that the expression of these two proteins was highly
consistent. Therefore, we hypothesized that SND1 may promote COX-2
expression via the NF-κB pathway and participate in the development
of osteosarcoma.
The present study revealed that the SND1 protein was
upregulated in osteosarcoma tissues compared to paired normal bone
tissues. Moreover, SND1 promoted osteosarcoma growth in
vitro and in vivo by upregulating NF-κB activity to
subsequently promote the expression of COX-2/PGE2. Collectively,
these functional and biochemical studies indicated that SND1
exhibited oncogenic activities in osteosarcoma, and supported the
targeting of SND1 as a new antitumor strategy for patients with
osteosarcoma.
Materials and methods
Patients and tissue/blood samples
Fresh osteosarcoma tissues, normal bone tissues and
paired blood samples were obtained from 12 patients with
osteosarcoma who underwent surgical resection from January 2014 to
January 2016 at the Department of Osteology of the First Affiliated
Hospital of Dalian Medical University. Information on patient
demographics (sex and age) and clinicopathological features
(histology type and Ennecking stage) were obtained from clinical
and pathological records (Table I).
There were 7 male and 5 female patients with ages ranging from 12
to 33 years. All fresh samples were collected from the patients at
the time of surgical resection and confirmed by hematoxylin and
eosin staining in frozen sections with histopathological analysis
at the Department of Pathology of the First Affiliated Hospital of
Dalian Medical University. The distal tissue of the resected tissue
was collected and confirmed to be normal bone by frozen section.
Twenty-three blood samples from healthy volunteers were obtained
from the Physical Examination Center of the First Affiliated
Hospital of Dalian Medical University. Blood samples were
centrifuged at 4°C and 1,080 × g for 10 min to obtain serum, and
samples were stored at −80°C until their use. Additionally, all of
these surgical patients signed informed consents and agreed to
donate their tissues and blood for research. Ethical approval for
the project was obtained from the Research Ethics Committee of the
First Affiliated Hospital of Dalian Medical University.
 | Table I.SND1 expression in patients suffering
with osteosarcoma. |
Table I.
SND1 expression in patients suffering
with osteosarcoma.
|
|
| SND1 |
|
|---|
|
|
|
|
|
|---|
|
Characteristics | N | High | Low | High SND1
expression rate (%) |
|---|
| Ages (years) |
|
≤20 | 8 | 5 | 3 | 62.5 |
|
>20 | 4 | 1 | 3 | 25 |
| Sex |
|
Male | 7 | 4 | 3 | 57 |
|
Female | 5 | 2 | 3 | 40 |
| Histology type |
|
Osteoblastoma | 5 | 4 | 1 | 80 |
|
Chondroblastic | 3 | 1 | 2 | 33.3 |
|
Fibroblastic | 4 | 1 | 3 | 25 |
| Ennecking
stage |
| IA | 2 | 1 | 1 | 50 |
|
IIA | 3 | 1 | 2 | 33.3 |
| IB | 3 | 1 | 2 | 33.3 |
|
IIB | 4 | 3 | 1 | 75 |
Cell culture
The human osteosarcoma cell lines, HOS, Saos-2 and
MG-63 were purchased from the Cell Bank of the Committee on Type
Culture Collection of the Chinese Academy of Sciences (Shanghai,
China). HOS and MG-63 cells were cultured in MEM medium
supplemented with 10% fetal bovine serum (FBS; both from GIBCO;
Thermo Fisher Scientific, Inc., Waltham, MA, USA). Saos-2 cells
were maintained in McCoy's 5A medium (Sigma-Aldrich; Merck KGaA,
Darmstadt, Germany) supplemented with 10% FBS. All the cells were
cultured in cell culture flasks or Petri dishes in a humidified
incubator at 37°C in an atmosphere of 5% CO2.
Plasmids and transfection
The human SND1 ORF was obtained from Shanghai
GenePharma Co., Ltd. (Shanghai, China) and subcloned into the
pLOC-Lentivirus vector. All transfection reactions were performed
using PEI (Invitrogen; Thermo Fisher Scientific, Inc.) in
accordance with the manufacturer's instructions. Stable
transfectants were selected with 10 µg/ml BSH (Invitrogen; Thermo
Fisher Scientific, Inc.).
siRNA and transfection
siRNA for P65
(5′-GATCCGAAGACAGCCTTTACTGAAATTCAAGAGATTTCAGTAAAGGCTGTCTTTTTTTTG-3′)
and a negative control were purchased from Shanghai GenePharma Co.,
Ltd. (Shanghai, China). According to the manufacturer's protocol,
cells were transfected using Lipofectamine 2000 (Invitrogen; Thermo
Fisher Scientific, Inc.). After transfection, the cells were
cultured for 48 or 72 h before use in further ELISA and
immunoblotting experiments.
RNA isolation and quantitative
real-time PCR
Total RNA was isolated from tumor cells using TRIzol
reagent (Invitrogen; Thermo Fisher Scientific, Inc.). Reverse
transcription PCR was performed using the Revert Aid First Strand
cDNA synthesis kit (Fermentas; Thermo Fisher Scientific, Inc.)
according to the manufacturer's protocol. Quantitative real-time
PCR was performed using StepOnePlus and the DNA
double-strand-specific reagent SYBR-Green I for detection (Roche
Applied Science, Penzberg, Germany). Fold changes were calculated
using the Cq method (17). The
results were normalized to GAPDH levels. The primer sequences were
as follows: SND1 forward, GTGATCAGATACCGGCAGGATG and reverse,
TCTTAATAGCTCTGGCCTCTGCAG; GAPDH forward, CACCATTGGCAATGAGCGGTTC and
reverse, AGGTCTTTGCGGATGTCCACGT.
Flow cytometric analysis
Cells pellets were washed with phosphate buffered
saline and fixed/permeabilized with 50% ice-cold ethanol. Pellets
were washed and resuspended in 50 µg/ml ribonuclease A and 62.5
µg/ml propidium iodide. Samples were analyzed on the BD FACSCalibur
(BD Biosciences, San Jose, CA, USA). The percentages of cells in
various phases of the cell cycle were quantified using the ModFit
LT Version 3.0 program (Verity Software House, Inc., Topsham, ME,
USA). The error bars were derived from the SD of multiple
experiments.
Luciferase reporter assay
X-tremeGene9 (Sigma-Aldrich; Merck KGaA) was used
for the cell transfection. The firefly luciferase reporter gene
construct, 3κB-Luc, containing three tandem NF-κB-binding sites
upstream of the luciferase gene, as well as a Renilla
luciferase expression construct (0.5 µg) and pRL-SV40
Renilla luciferase construct (10 ng, for normalization)
(pSV40-h-gal; Promega Corp., Madison, WI, USA) were used for
co-transfection. Cell extracts were prepared 48 h after
transfection. The luciferase activity was measured using the
Dual-Luciferase Reporter Assay System (Promega Corp.) according to
the manufacturer's protocol (18).
The h-galactosidase activity was determined using the Galacto-Light
Plus kit (Tropix, Inc., Bedford, MA, USA).
Cell proliferation assay
Firstly, equal numbers of cells were plated in
12-well plates in triplicate. Beginning on day 3, the cells were
fixed with 10% methanol and stained with 0.1% crystal violet
(dissolved in 10% methanol) every day. After staining, wells were
washed three times with phosphate-buffered saline (PBS) and
destained with acetic acid, and the absorbance of the crystal
violet solution was measured at 590 nm.
ELISA
Culture supernatants were harvested, centrifuged to
remove cellular debris, and stored at −80°C. Culture supernatants
and serum levels of PGE2 were quantified using a commercial ELISA
kit (cat. no. ab133021; Abcam, Cambridge, UK), according to the
manufacturer's instructions.
LC-MS based metabolomics analyses
Cell sample preparation
Cell culture plates were washed with PBS and
snap-frozen in liquid nitrogen and stored at −80°C. To the culture
plate, 1 ml of −20°C pre-cooled 80% methanol [with internal
standard mixture of carnitine C2:0-d3, carnitine C10:0-d3,
carnitine C16:0-d3, LPC 19:0, free fatty acid (FFA) 16:0-d3, FFA
18:0-d3, chenodeoxycholic acid-d4, cholic acid-d4, leu-d3, phe-d5
and tryptophan-d5] was added, and cells were gently scraped off the
bottom of the plate into a 5-ml EP tube using a cell scraper. After
thorough vortexing and centrifugation (13,000 × g for 10 min at
4°C), the supernatant was pipetted for drying into a CentriVap
Centrifugal Vacuum Concentrator (Labconco Corp., Kansas City, MO,
USA). The dried residues were stored at −80°C until analysis.
LC-MS-based metabolic profiling
For LC-MS-based metabolic profiling, an
ultra-high-performance liquid chromatograph (UPLC) (Waters Corp.,
Milford, MA, USA) was coupled to a triple TOF™ 5600 plus (Applied
Biosystems, Foster City, CA, USA) mass spectrometer equipped with
an electrospray source. The dried sample powder was dissolved in 80
µl of acetonitrile/water (1:4, v/v). After centrifugation at 13,000
× g for 10 min at 4°C, 5 µl of supernatant was injected. During LC
separation, the column temperature was set at 50°C, with an elution
rate of 0.35 ml/min. For the positive mode, a BEH C8 (100×2.1 mm
×1.7 µm; Waters Corp.) column was used. The gradient started with
10% B (0.1% formic acid in acetonitrile) for 1 min, linearly
increased to 40% B within 4 min, then increased to 100% B at 17 min
and maintained for 5 min. The elute phase was rapidly changed to
90% A (0.1% formic acid in water) (within 0.1 min), and the total
run time for each injection was 25 min, including a
post-equilibration of 2.9 min. For the negative mode, an HSS T3
(100×2.1 mm ×1.8 µm; Waters Corp.) column was used. The gradient
started with 0% D [6.5 mM NH4HCO3 in
methanol/water (95/5, v/v)] for 1 min, linearly increased to 40% D
within 2 min, then increased to 100% D at 16 min and maintained for
6 min. The elute phase was rapidly changed to 100% Av (6.5 mM
NH4HCO3 in water) (within 0.1 min), and the
total run time for each injection was 25 min, including a
post-equilibration of 2.9 min.
For data acquisition, the m/z values were scanned
from 50–1200 for both ESI+ and ESI- modes. The ion source
parameters were as follows: Source temperature set of 500°C; Gas 1
and Gas 2 values were both 0.28 MPa; curtain gas was 0.24 MPa; and
the floating ion spray voltages were 5,500 V and −4,500 V for
positive and negative ion modes, respectively. IDA-based auto-MS2
was performed for the top 20 ions in MS response with an m/z
scanning range of 50–1,200 Dalton, collision energy of (±)30 V and
collision energy spread of 10 V. (19).
TNF-α treatment
To activate the NF-κB signaling pathway, exogenous
TNF-α was applied to the related experiments. Following the
transient transfection of a firefly luciferase reporter gene for 48
h, 10 ng/ml TNF-α was added to the culture medium for 12 h. Then,
cell extracts were prepared, and the luciferase activity was
assessed. In addition, 10 ng/ml TNF-α was also added to the culture
medium of control or SND1 overexpressing MG-63 cells with or
without p65-siRNA treatment for 24 h. Subsequently, the cell
extracts were prepared for the further ELISA and immunoblotting
experiments.
Western blot analysis
Western blot analyses were performed with standard
methods. Briefly, cells were lysed in radioimmunoprecipitation
assay (RIPA) buffer containing protease inhibitors and phosphatase
inhibitors (Sigma-Aldrich; Merck KGaA, Darmstadt, Germany). Protein
concentrations were measured using the BCA assay. Equal amounts of
protein (10 µg) were fractionated by SDS-PAGE (10 or 12%) and then
transferred to nitrocellulose membranes (Bio-Rad Laboratories,
Inc., Hercules, CA, USA). The membranes were blocked in a buffer
(TBS; 50 mM Tris-HCl and 150 mM NaCl, pH 7.4) containing 5% bovine
serum albumin (BSA) and 0.1% Tween-20 followed by incubation with
the following primary antibodies SND1 (dilution 1:1,000; cat. no.
sc-271590; Santa Cruz Biotechnology, Inc., Santa Cruz, CA, USA),
COX-2 (dilution 1:1,000; cat. no. sc-271590), p65 (dilution
1:1,000; cat. no. 10745-1-AP) and PCNA (dilution 1:1,000, cat. no.
10205-1-AP; all from ProteinTech Group, Inc., Wuhan, China), cyclin
A (dilution 1:500; cat. no. sc-136253; Santa Cruz Biotechnology,
Inc.), cyclin B1 (dilution 1:1,000; cat. no. 55004-1-AP), cyclin D1
(dilution 1:1,000, cat. no. 60186-1-Ig) and cyclin E (dilution
1:1,000, cat. no. 11554-1-AP; all from ProteinTech Group, Inc.),
β-actin (dilution 1:1,000, cat. no. sc-8432; Santa Cruz
Biotechnology, Inc.) and GAPDH (dilution 1:3,000, cat. no. ab8245;
Abcam). The immunoreactive proteins were visualized using the ECL
western blot analysis system (Bio-Rad Laboratories, Inc.) and
densitometric analysis was performed using the Image Pro-Plus
software (Media Cybernetics, Inc., Rockville, MD, USA).
In vivo assays for tumor growth
Pathogen-free female athymic nude mice (4 weeks old;
18–22 g) were purchased from the Beijing Vital River Laboratory
Animal Technology Co., Ltd. (Beijing, China). All the mice were
housed in specific pathogen-free (SPF) environments at the
Institute of Genome Engineered Animal Models for Human Disease of
Dalian Medical University. All animal experiments were performed in
accordance with a protocol approved by Dalian Medical University
Research Ethics Committee. MG-63-control or MG-63-SND1 cells were
implanted into the right or left dorsal flank of 4-week-old female
nude mice. Based on the mean tumor volume at each time-point,
growth curves were plotted for each experimental group. The tumor
dimensions were measured every 3 days using a digital caliper. The
tumor volume (mm3) was calculated as follows: V =
ab2/2 where a and b were the largest and smallest tumor
diameters measured at necropsy, respectively. After 22 days, the
mices were sacrificed by CO2 asphyxiation and the tumor
tissues were harvested for use in further ELISA and immunoblotting
experiments.
According to the animal ethical guidelines and our
preliminary experimental results, we set the maximum tumor weight
to 10% of the mouse weight (equivalent to a maximum tumor diameter
of 20 mm) as the experimental endpoint. In fact, the maximum tumor
burden observed in our study was 7.6% and no mouse in the study
presented with multiple tumors. The non-retrospective ethical
approval obtained for the animal experiments was obtained from the
Research Ethics Committee of Dalian Medical University.
Statistical analysis
All data represented the mean ± standard deviation
of at least three independent experiments. Student's t-test was
used to assess the differences between two groups. ANOVA-post-hoc
pairwise comparison analysis was used to compare the means from
three groups. Pearson's correlation analysis was used to assess the
correlation between two groups. P<0.05 was considered to
indicate a statistically significant difference. All of the
relative protein expression was normalized by ImageJ (version no.:
1.8.0_112; http://imagej.nih.gov/ij/).
Statistical analysis was performed using the SPSS 18.0 software
package (SPSS, Inc., Chicago, IL, USA).
Results
SND1 expression in fresh osteosarcoma
tissues and adjacent normal tissues
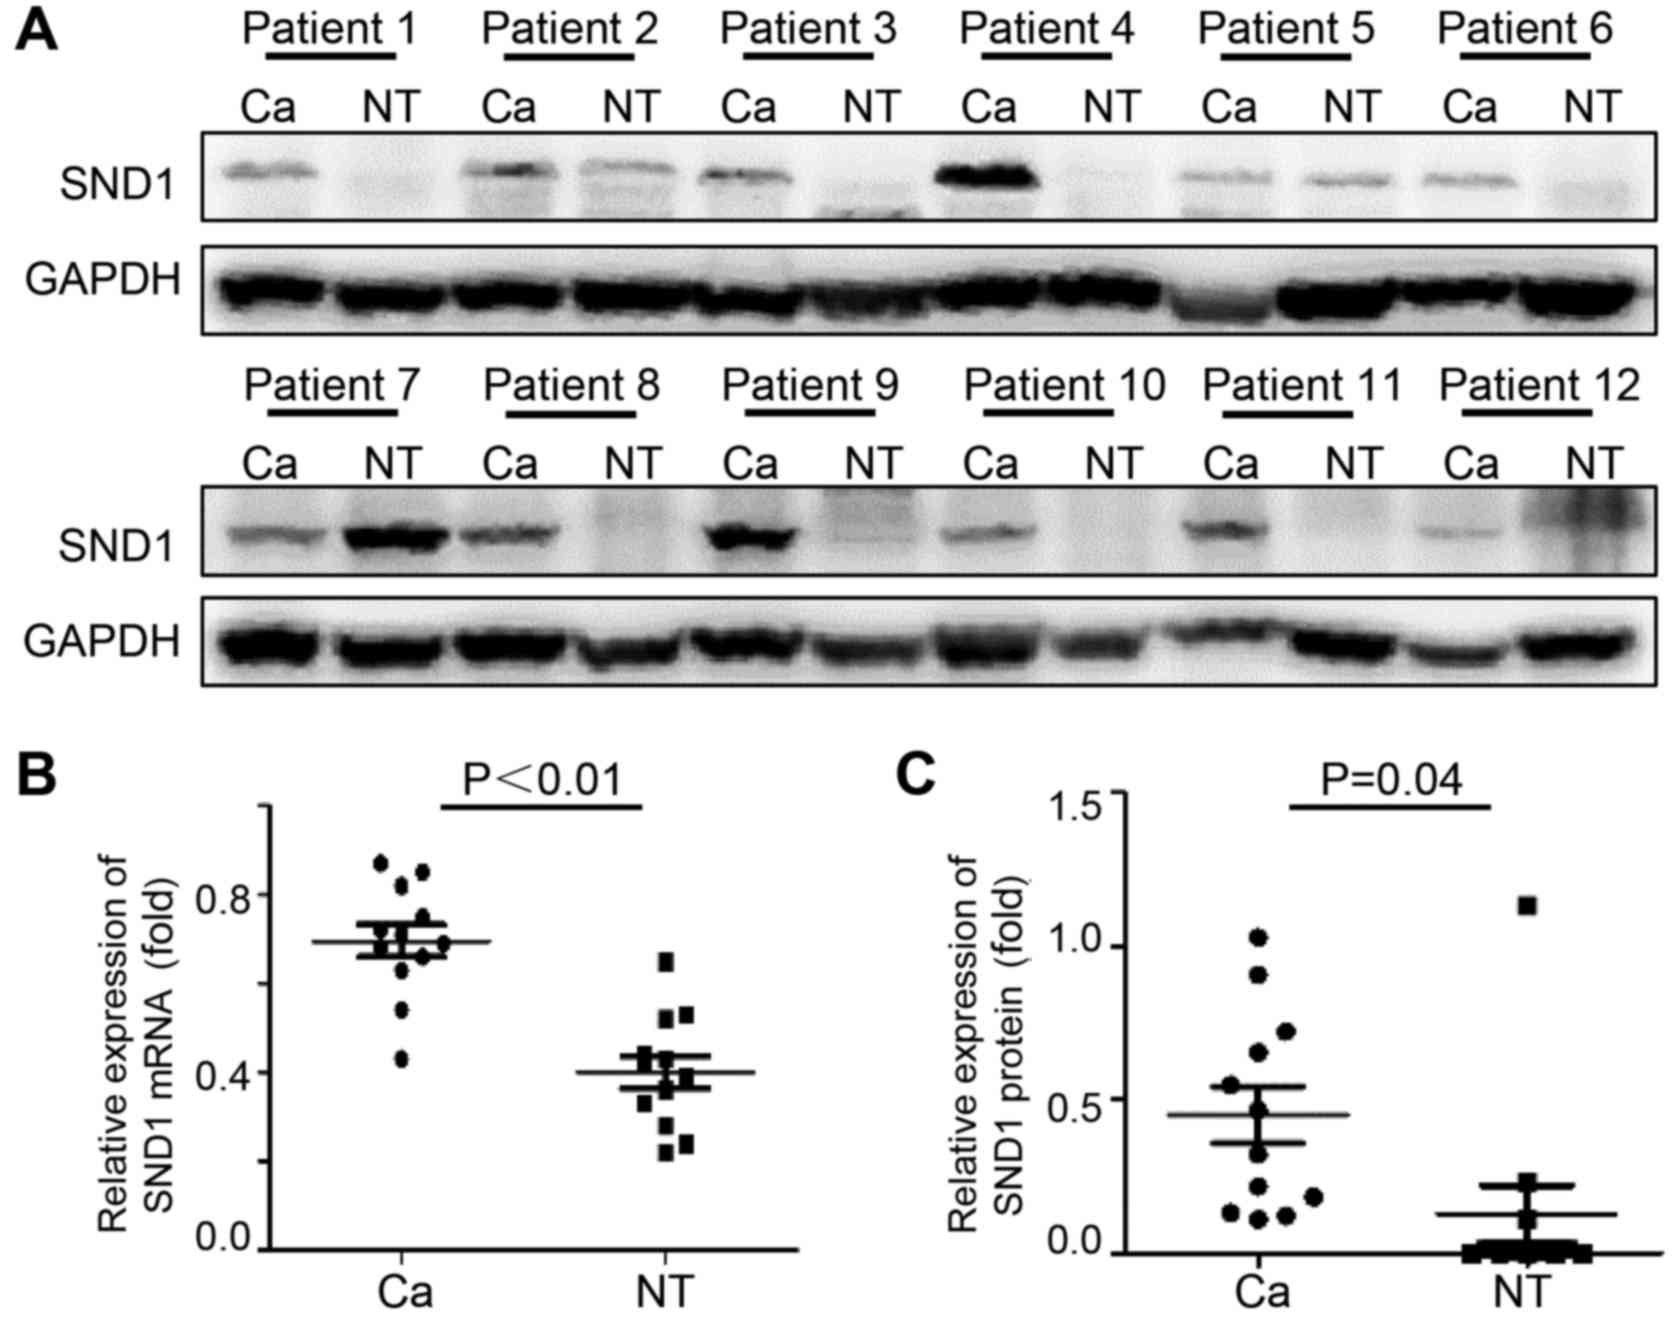
To determine if SND1 is dysregulated in osteosarcoma
tissues, immunoblotting and real time-PCR analyses were performed
using human osteosarcoma tissues and paired normal bone tissues. As
revealed in Fig. 1A, 75% of
osteosarcoma samples exhibited high SND1 expression compared to
normal bone tissues. Osteosarcoma tissues expressed significantly
high SND1 mRNA (Fig. 1B) and
protein expression (Fig. 1C), which
was increased by 1.74- and 3.07-fold, respectively, compared to
normal bone tissues.
Osteosarcoma is classified into chondroblastic,
osteoblastoma, telangiectatic and fbroblastic types according to
the histological difference. Immunoblotting data revealed that SND1
was highly expressed in 80% of osteoblastoma cases. However, SND1
expression was present in only 33.3 and 25% in chondroblastic and
fbroblastic types cases, respectively. In the II B phase of
Ennecking staging, positive SND1 cases accounted for 75%, which was
far higher than other stages (Table
I). Thus, these results revealed that high SND1 expression may
be related to the histological classification and the Ennecking
stage of osteosarcoma.
SND1 promotes the proliferation of
osteosarcoma cells
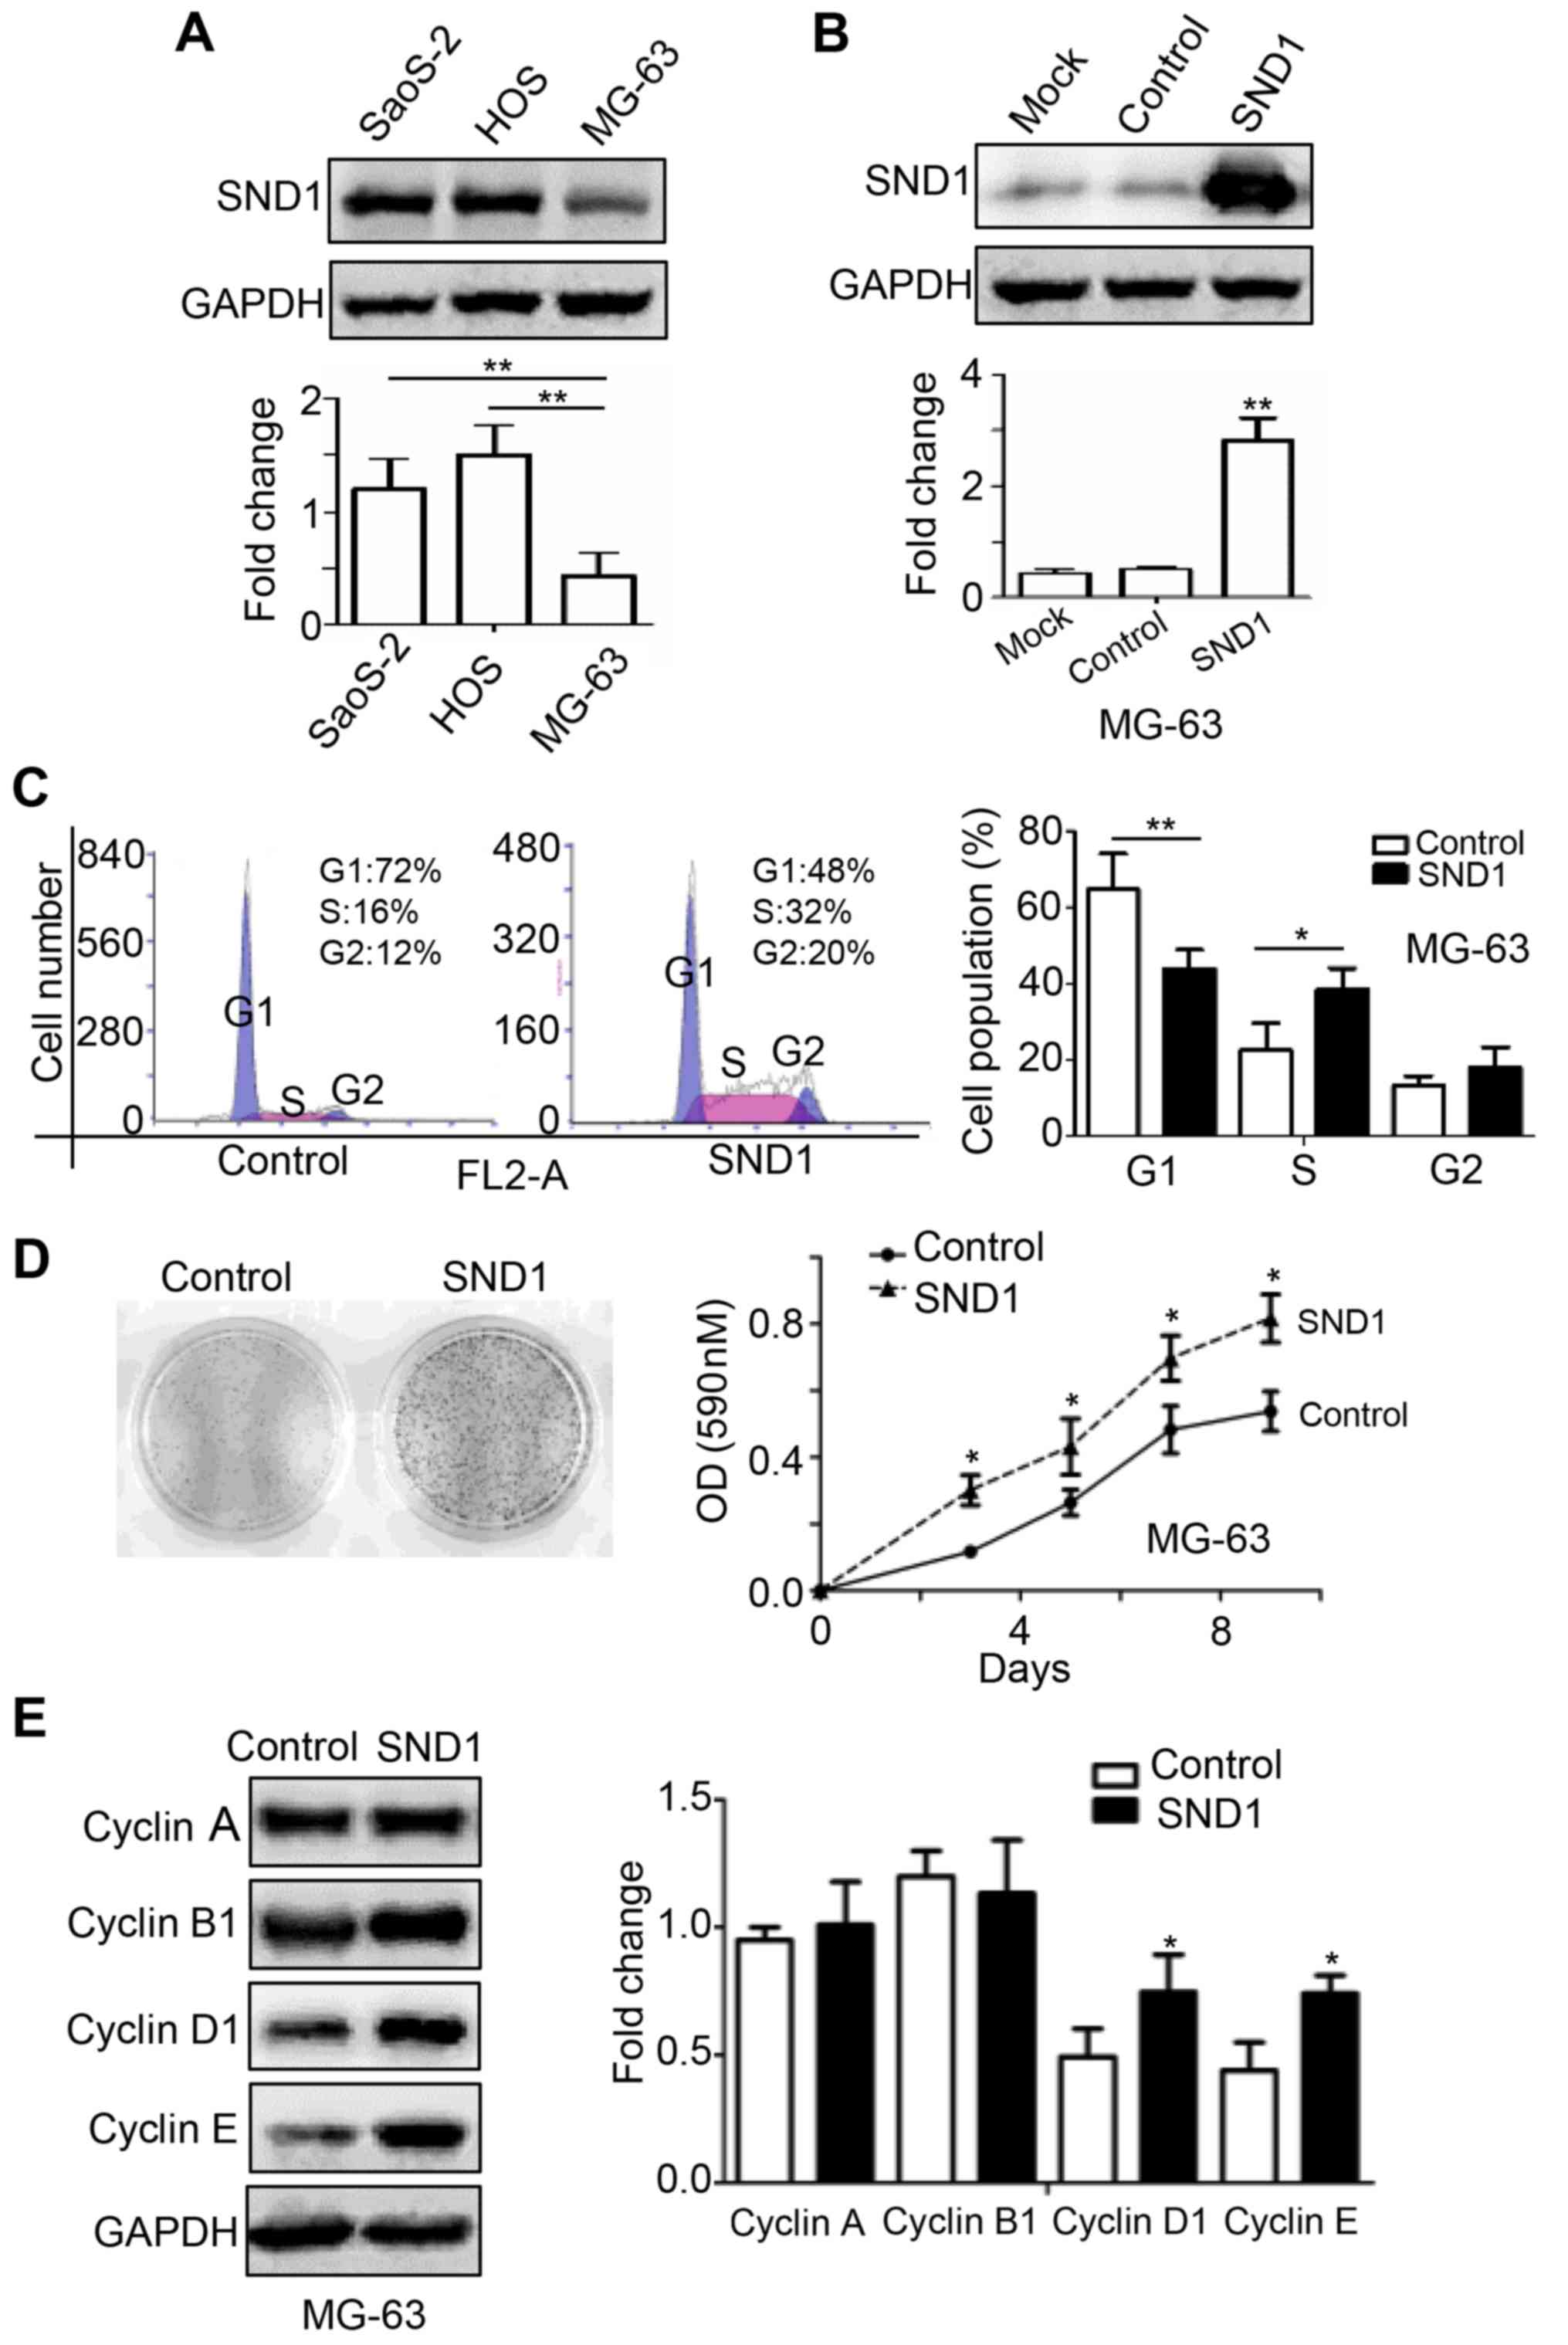
To investigate the role of SND1 in osteosarcoma
cells, the protein expression of SND1 was determined in 3
osteosarcoma cell lines, namely MG-63, Saos-2 and HOS. SND1
expression was relatively lower in MG-63 cells compared to Saos-2
and HOS cells (Fig. 2A). To further
define the biological function of SND1 in osteosarcoma, SND1 was
stably overexpressed in MG-63 cells, which were transfected with
SND1-pLOC-Lentivirus plasmids and selected with 10 µg/ml BSH.
Western blot analysis was used to verify the transfection
efficiency. As shown in Fig. 2B,
the SND1 protein expression in MG63-SND1 cells was significantly
higher compared to the mock and control cells which were stably
transfected with a pLOC-lentiviral vector containing an RFP open
reading frame. Next, cell populations were examined by flow
cytometry. SND1 overexpression increased the G1/S transition rate,
resulting in a significant decrease in the proportion of G1 phase
cells and an increase in the proportion of S phase cells (Fig. 2C). Additionally, SND1 overexpression
significantly stimulated proliferation compared to the control
cells (Fig. 2D). Cyclin proteins in
SND1-overexpressing and control cells were also detected. As shown
in Fig. 2E, overexpression of SND1
led to a significant increase of cyclin D1 and cyclin E, while
cyclin A and cyclin B1 were not altered. Collectively, these
findings indicated that SND1 promoted the proliferation of
osteosarcoma cells.
SND1 promotes PGE2 synthesis and
release
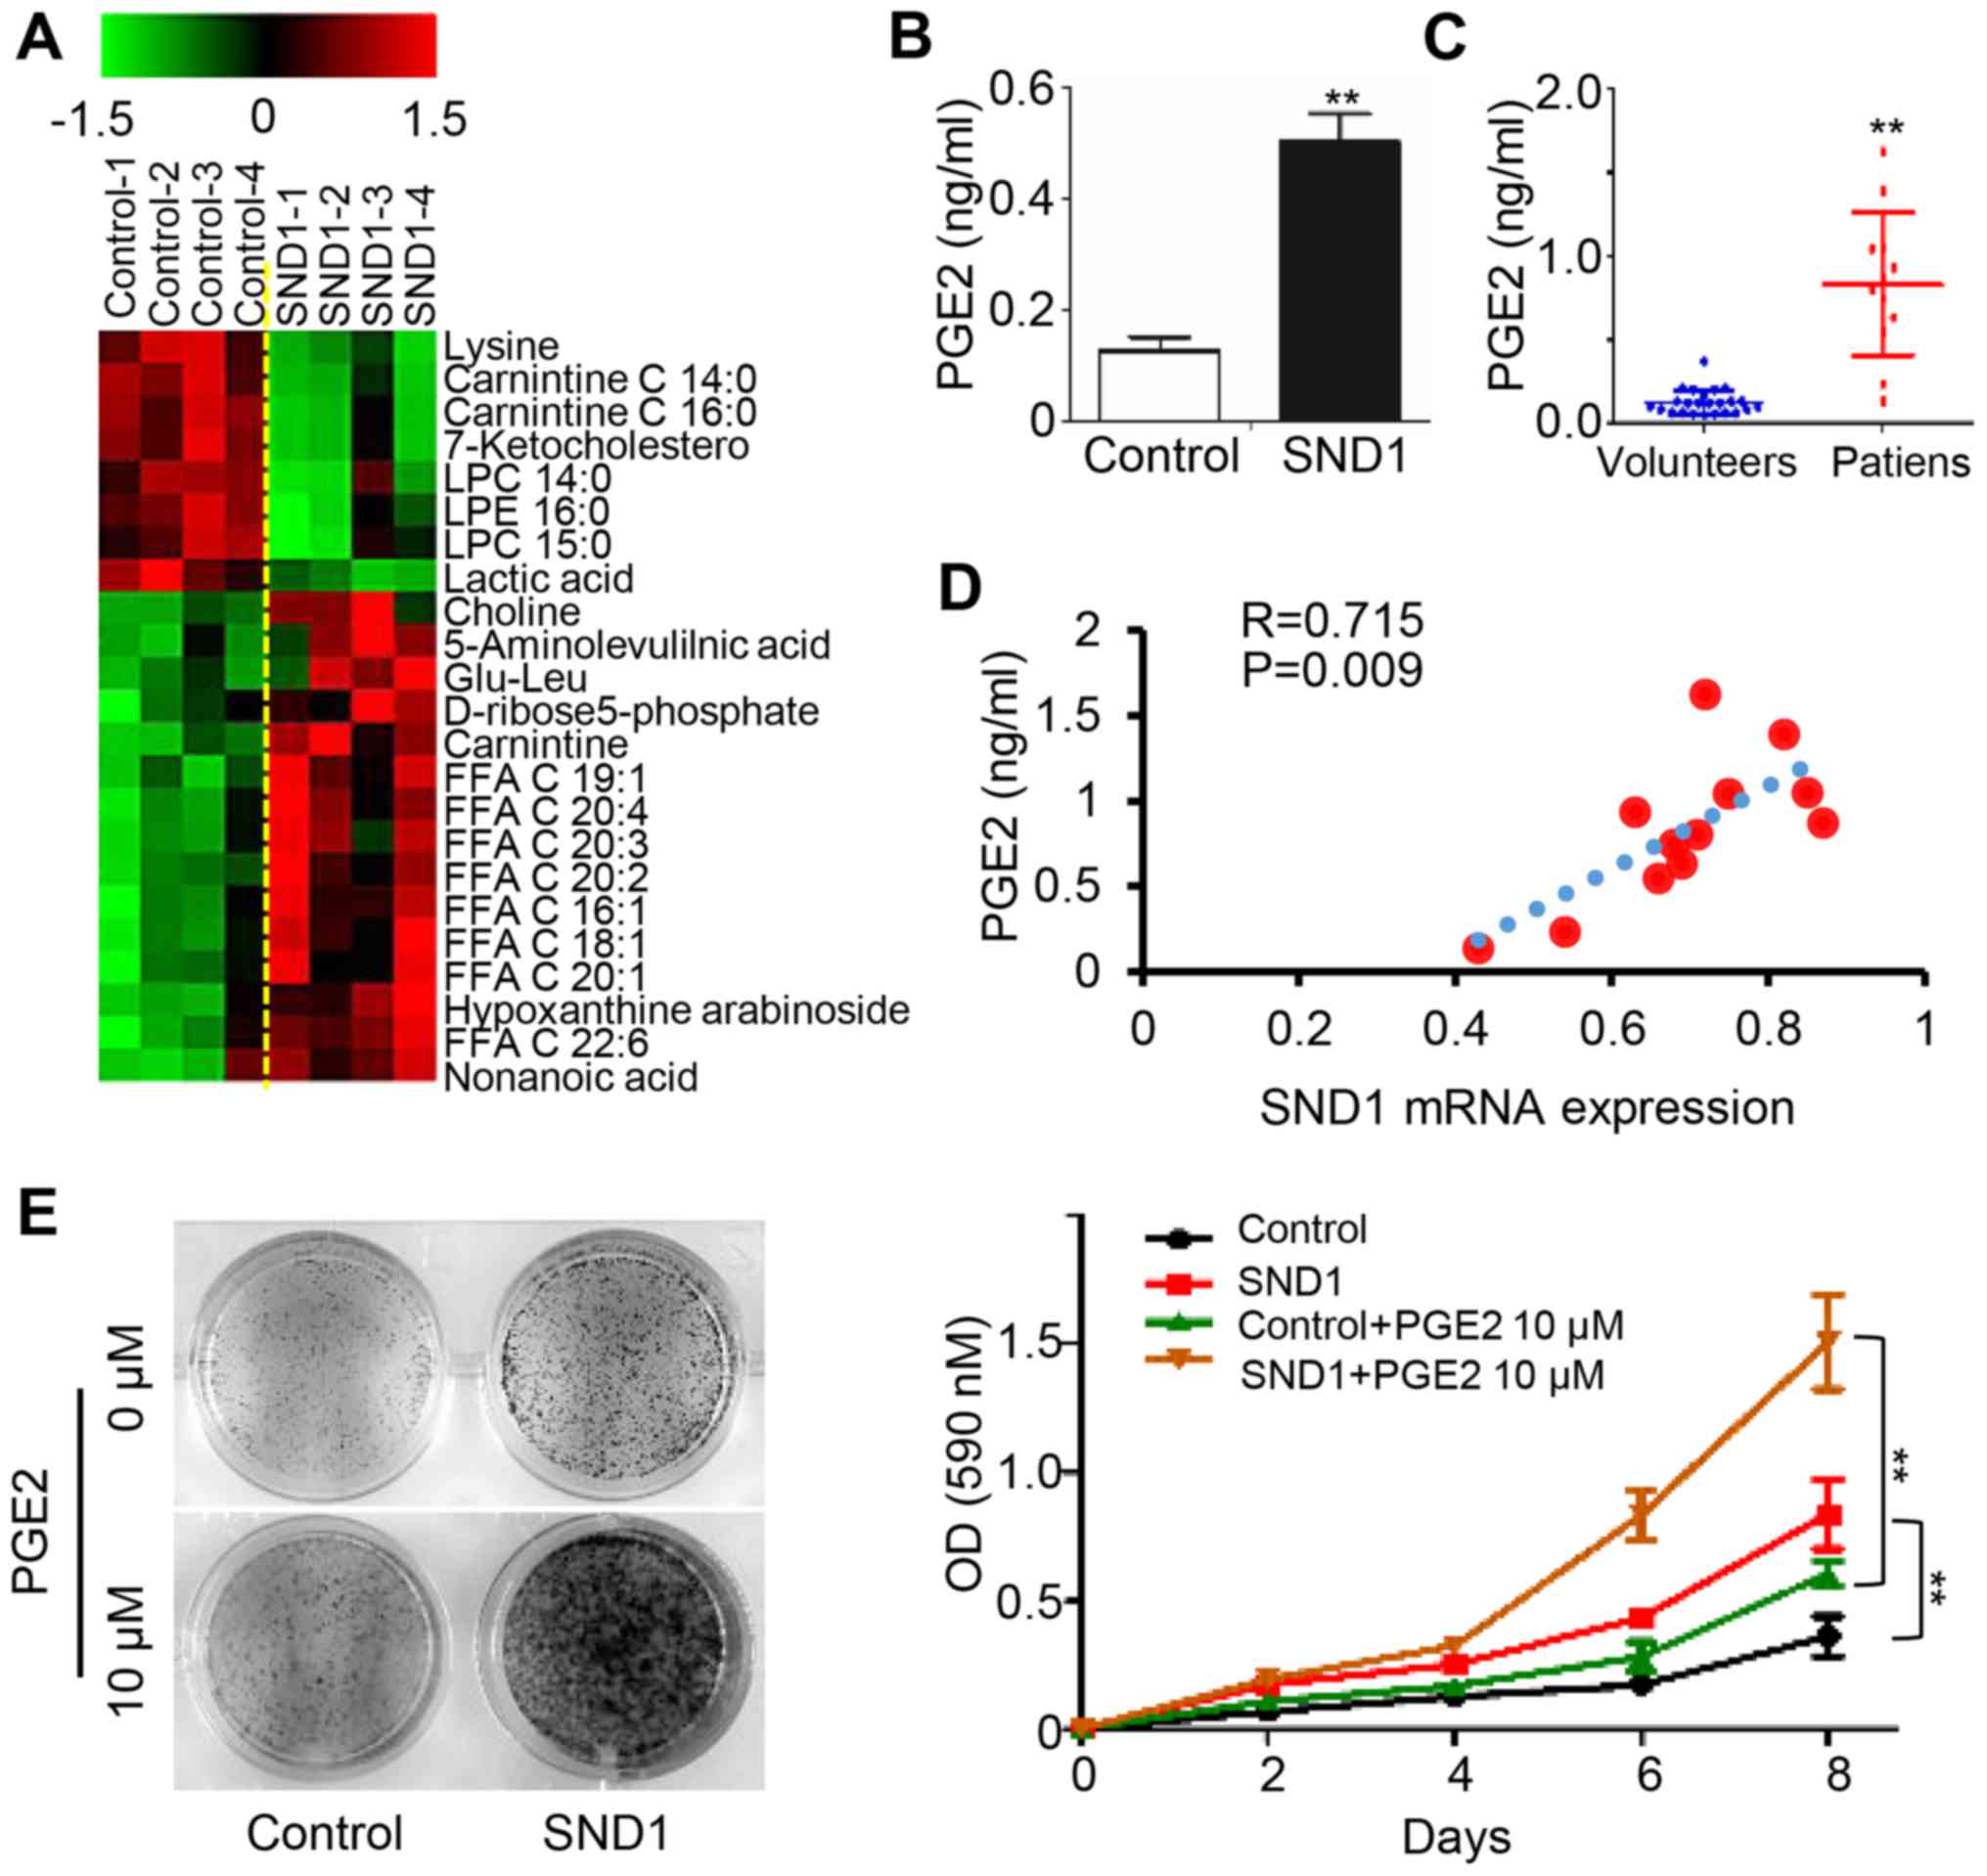
To elucidate the underlying mechanisms of
SND1-mediated oncogenic features, we applied untargeted metabolite
profiling in control and SND1-overexpressing cells using LC-MS.
Arachidonic acid and other 20-C polyunsaturated fatty acids were
upregulated in SND1-overexpressing cells compared to control cells
(Fig. 3A). In addition, the
expression level of PGE2 was elevated in SND1-overexpressing cell
culture supernatants (Fig. 3B). In
addition, higher serum PGE2 levels were observed in osteosarcoma
patients (12 cases) compared to healthy controls (23 cases)
(Fig. 3C). Furthermore, the paired
serum PGE2 levels were significantly positively correlated with the
SND1 mRNA level in paired osteosarcoma tissues (n=12) (Fig. 3D). Notably, the SND1
overexpression-stimulated cell proliferation was enhanced by
exogenous addition of PGE2 (Fig. 3E and
F). Collectively, these data revealed that SND1 promoted the
proliferation of osteosarcoma cells by upregulating PGE2.
SND1 upregulates COX-2/PGE2 expression
through the NF-κB pathway
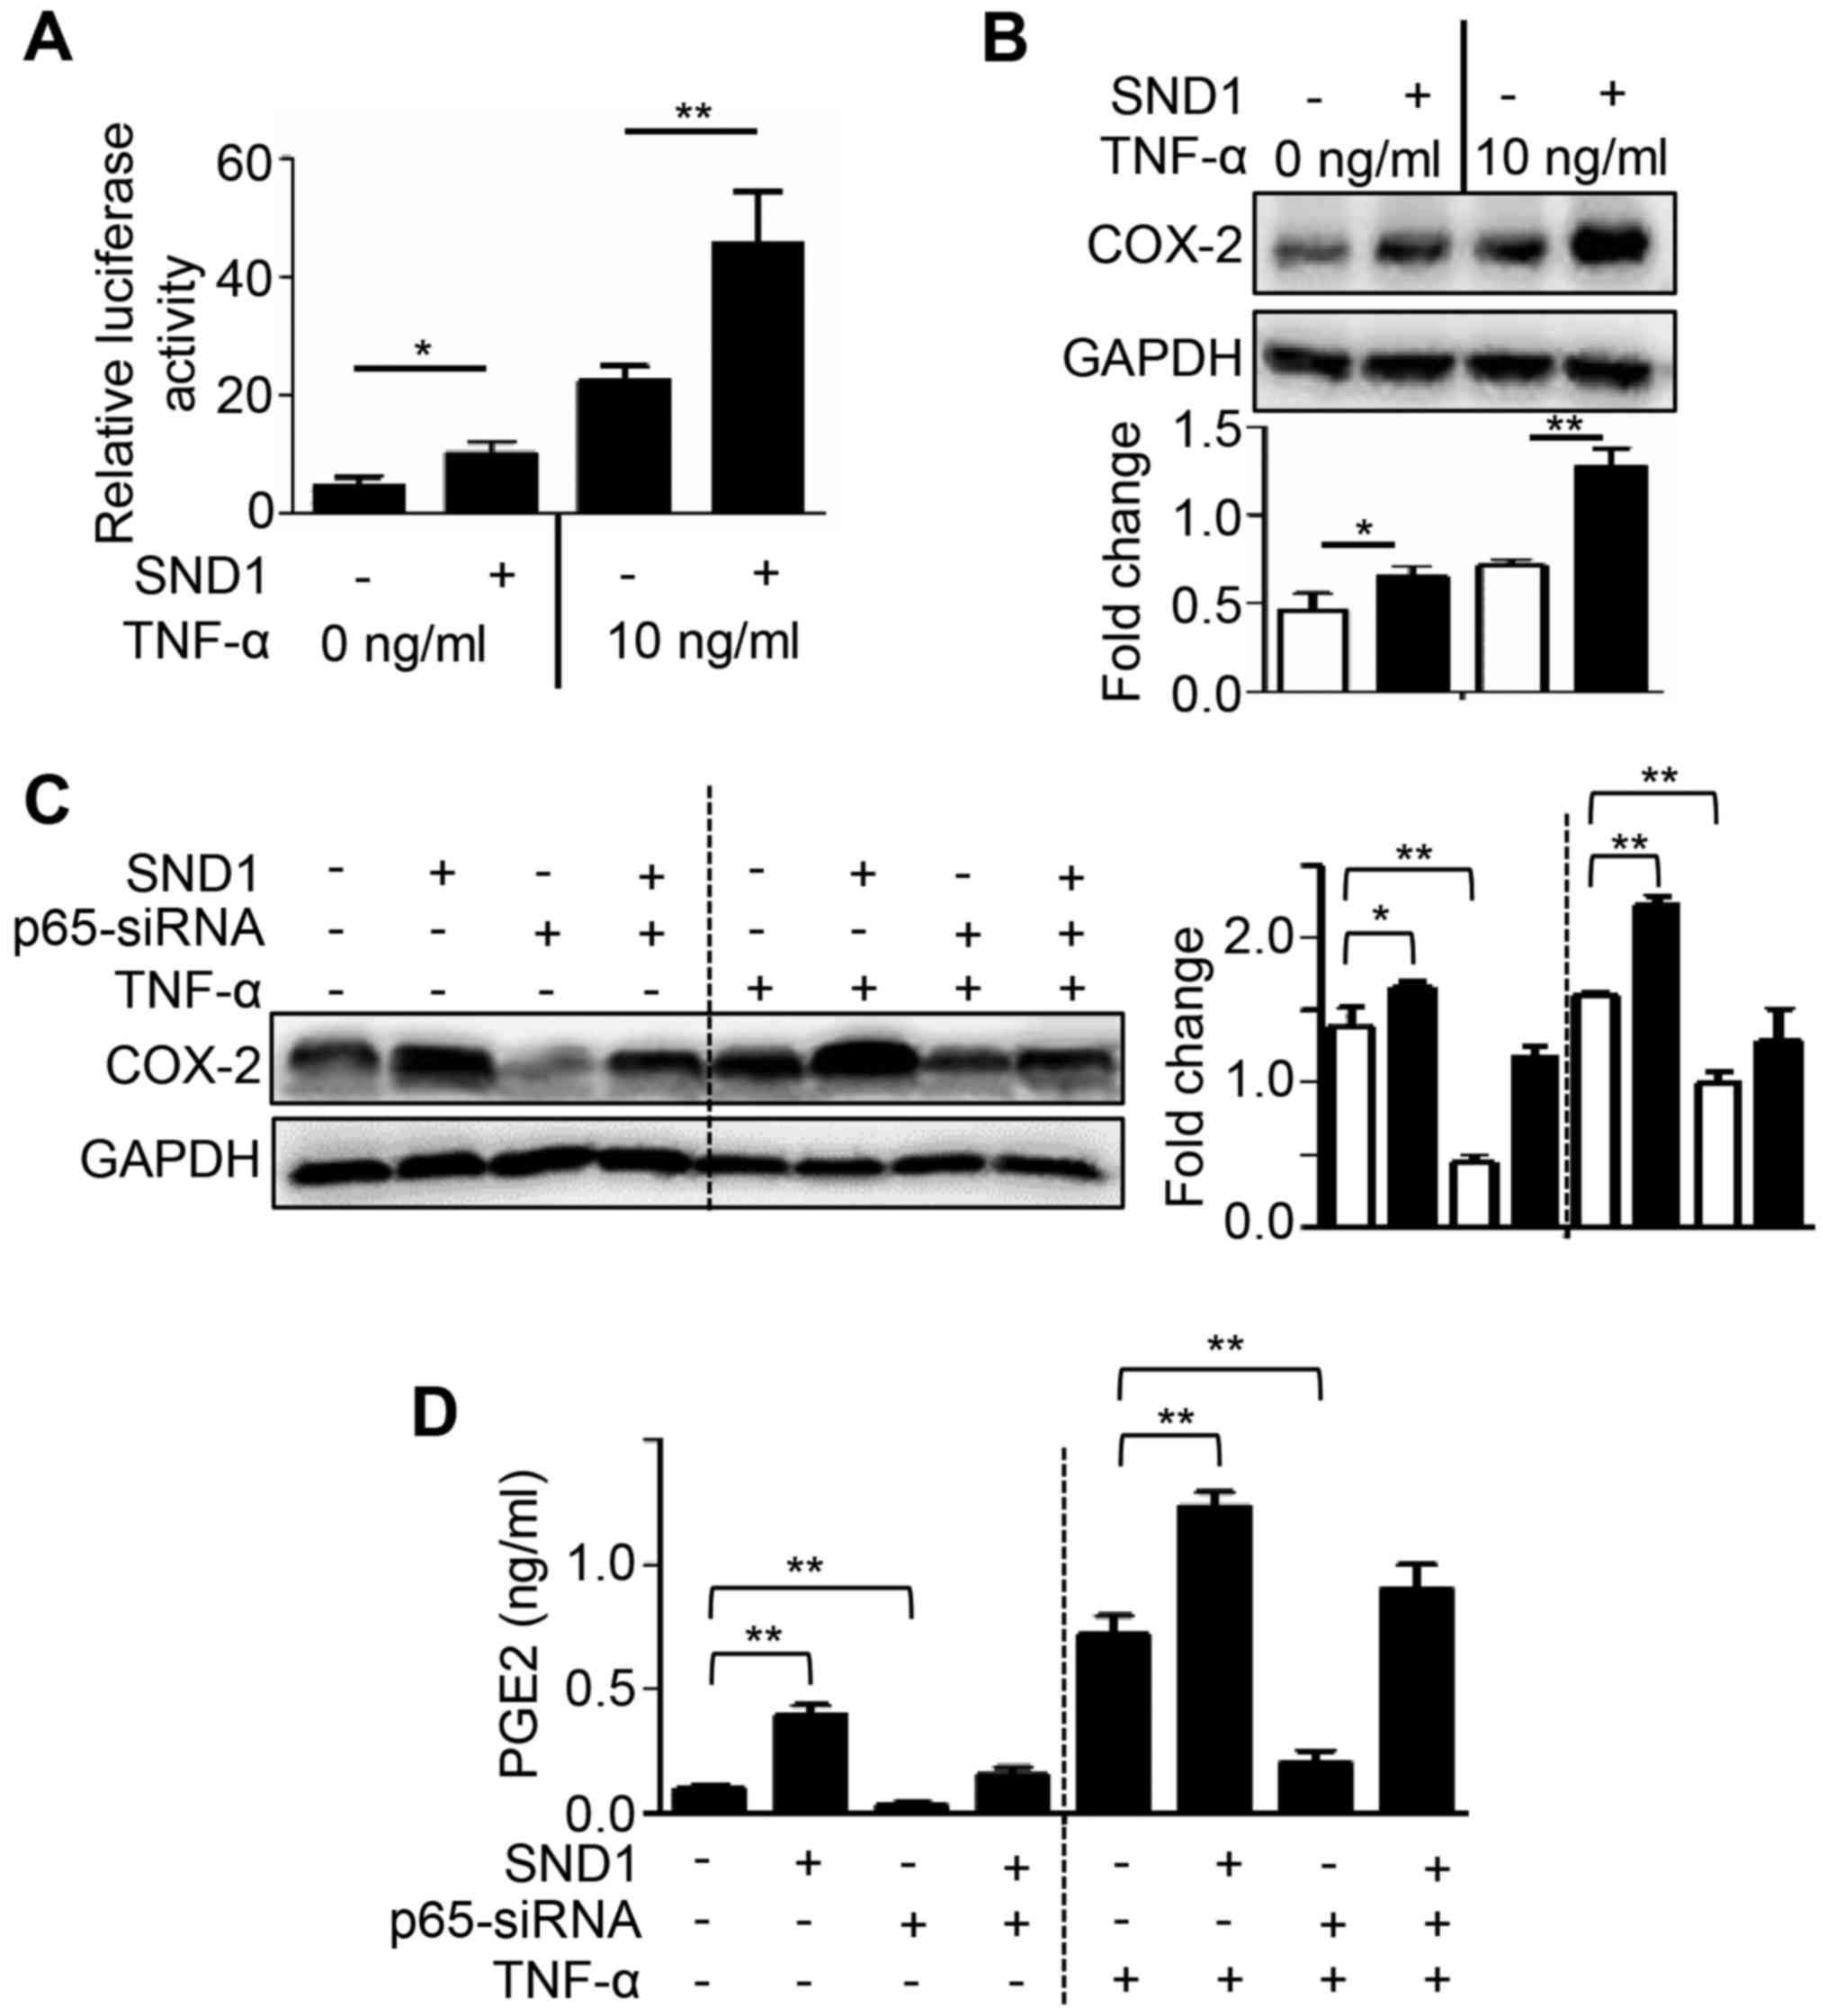
Since COX-2 levels have been revealed to be
regulated by NF-κB, the involvement of NF-κB in SND1-mediated PGE2
induction was investigated. To investigate NF-κB activity,
SND1-overexpressing and control cells were transfected with a
reporter vector (3κB-Luc) and treated with TNF-α (a known activator
of NF-κB) and luciferase activity was then determined. As shown in
Fig. 4A, the basal NF-κB activity
was significantly higher in SND1-overexpressing cells compared to
control cells. Furthermore, treatment with TNF-α markedly increased
NF-κB activity in SND1-overexpressing cells compared to Control
cells (Fig. 4A). In
SND1-overexpressing cells, the level of COX-2 protein expression
was also significantly higher compared with that in control cells,
and this phenomenon was further accentuated after treatment with
TNF-α (Fig. 4B). In addition, siRNA
was used to knockdown NF-κB p65 expression to determine if SND1
overexpression-stimulated COX-2/PGE2 expression depended on the
NF-κB pathway. As revealed in Fig. 4C
and D, NF-κB p65 depletion by RNAi significantly inhibited the
expression of COX-2 and PGE2 both in control and
SND1-overexpressing cells, and this phenomenon was also further
accentuated after treatment with TNF-α. Collectively, these results
indicated that SND1 activated the NF-κB pathway and increased
COX-2/PGE2 expression.
SND1 promotes osteosarcoma tumor
growth in vivo
To further explore the effect of SND1 on
tumorigenesis in vivo, control or SND1-overexpressing cells
were injected into nude mice. In a 3-week assay, tumor volume and
weight were monitored, and tumor growth was markedly enhanced with
SND1 overexpression (Fig. 5A-C).
The expression of COX-2 and PGE2 in SND1-overexpressing xenograft
tissues was significantly higher than that of control groups, which
was accompanied by increased PCNA levels (Fig. 5D and E). Collectively, these results
revealed that SND1 promoted osteosarcoma tumor growth via
COX-2/PGE2 production.
Discussion
Despite efforts that have been increasingly made to
discover the underlying mechanisms of the malignant biological
behavior of osteosarcoma, the specific mechanism is still not clear
(20,21). The present study revealed for the
first time that overexpression of SND1 promoted osteosarcoma
proliferation and tumorigenesis in vitro and in vivo.
Moreover, the present findings demonstrated that SND1 manifested
its pro-tumor activities by upregulating COX-2/PGE2 expression via
the NF-κB pathway.
SND1 is a multifunctional protein that plays
important roles in cell signal transduction, gene transcription,
RNA splicing, RNA editing, stress, cell proliferation and apoptosis
(11). Abnormally high expression
of SND1 has been detected in a variety of tumors, such as colon
(22,23), lung (24,25),
prostate (26), breast (27) and liver cancer (28). However, the expression of SND1 in
osteosarcoma is still unknown. The present study found that that
mRNA and protein expression levels of SND1 were significantly
higher in osteosarcoma tissue compared to paired normal bone
tissues. In line with the present study, Bilbao-Aldaiturriaga et
al reported that three SNPs located in miRNA-processing genes
(CNOT1, CNOT4 and SND1) are associated with osteosarcoma
susceptibility (29). Collectively,
these results and studies provided an indication of the importance
of SND1 in osteosarcoma.
Uncontrolled cell proliferation is an important
feature of tumor cells. Recently, several studies have demonstrated
that SND1 participates in cell cycle regulation, but the specific
mechanism is still not clear. Yoo et al revealed that SND1
promoted the proliferation of human HCC cells by increasing
RNA-induced silencing complex (RISC) activity (12). Jariwala et al confirmed that
SND1 promoted the proliferation of human HCC cells by promoting
tumor-initiating cell (TIC) formation (28). In addition, SND1 interacted with
E2F-1, which upregulated E2F-1 transcriptional activity, thereby
promoting cell proliferation (30).
The present study demonstrated that SND1 significantly promoted
MG-63 osteosarcoma cell proliferation and tumor growth in
vivo and in vitro.
In cancer cells, metabolism is markedly reprogrammed
to support accelerated cell proliferation, including increased
aerobic glycolysis and arachidonic acid/PG metabolism as well as
decreased tricarboxylic acid cycle (31–33).
The present study revealed that SND1 significantly increased the
production of arachidonic acid and other 20C polyunsaturated fatty
acids in MG-63 cells, which was accompanied by increased secretion
of PGE2. A previous study reported that exogenous PGE2 treatment
promoted the proliferation of osteosarcoma cells through the
MAPK/ERK signaling pathway (34).
In addition, PGE2 promoted the proliferation of colon cancer cells
by activating the β-catenin axis through a biochemical pathway
initiated by the activation of the G protein-linked PGE2 receptor,
EP2 (35). The present study
revealed that the expression level of serum PGE2 had a significant
positive association with the SND1 expression level in osteosarcoma
tissues. Collectively, these results indicated that SND1 may be
involved in the proliferation of osteosarcoma cells by increasing
the expression of PGE2.
COX-2 is the rate-limiting enzyme during the
metabolic formation process of prostaglandins from arachidonic
acid. Downregulation of COX-2 expression inhibits the proliferation
of tumor cells and induces tumor cell apoptosis by reducing the
synthesis of PG. In addition, high expression of COX-2 occurs in a
variety of tumors, including osteosarcoma. The expression level of
COX-2 is related to osteosarcoma staging, and it can be used as an
independent prognostic factor in osteosarcoma (10). In recent years, the effect of
selective COX-2 inhibitors on osteosarcoma has been confirmed in a
number of trials (36). The present
study revealed that SND1 promoted the proliferation of osteosarcoma
cells via the upregulation of COX-2/PGE2 expression.
The present study also investigated the underlying
mechanism of SND1-induced COX2/PGE2 upregulation. NF-κB-p65 is a
subunit of the NF-κB transcription complex that plays a crucial
role in inflammation, cell proliferation, differentiation, and
survival. Several studies have revealed that the NF-κB signaling
pathway is in a continuous activation state in numerous tumors.
PTGS2 is a target gene of p65, and activation of the NF-κB pathway
results in PTGS2 upregulation. Santhekadur et al revealed
that SND1 increased NF-κB activation in HCC cells (16). The present study confirmed that SND1
also increased NF-κB activation in MG-63 cells. In addition,
depletion of p65 expression in SND1-ox cells abolished SND1
overexpression-stimulated PGE2 release and COX-2 protein
expression. Collectively, these data revealed that SND1 promoted
osteosarcoma cell proliferation and tumor growth via NF-κB-p65
activation. However, the mechanism by which SND1 activated
NF-κB-p65 remains to be determined.
There are still some limitations in this study.
First of all, the available osteosarcoma patients were very limited
in our department, only 12 clinical samples were collected in this
study. Due to this this small clinical volume, which is not enough
to analyze the association between SND1 expression and clinical
features, we simply counted the proportion of patients with higher
SND1 expression under different clinical characteristics. In
addition, no significant PGE2 expression change in the serum of the
tumor-bearing mice was observed, and this may be associated with
the reasons that follow: i) the model construction time was too
short to reach the peak PGE2 concentration in the blood; ii) this
was a subcutaneous rather than an orthotopic transplantation
model.
In conclusion, these findings in osteosarcoma cells
and xenografts support that SND1 promotes proliferation and tumor
growth by upregulating COX-2/PGE2 expression via activation of
NF-κB. Therefore, downregulation of SND1 may represent an effective
treatment method for inhibiting the proliferation of osteosarcoma.
In addition, SND1 may act as a potential biomarker of the
therapeutic strategies utilizing COX-2 inhibitors.
Acknowledgements
Not applicable.
Funding
The present study was supported by the Science
Research Project of Education of the Department of Liaoning
Province (L2016022).
Availability of data and materials
The datasets used and/or analyzed during the current
study are available from the corresponding author on reasonable
request.
Authors' contributions
KS and JL conceived and designed the study. MZ, AW,
BY, DW, SH and WZ performed the experiments. MZ and AW wrote the
paper. All authors read and approved the manuscript and agree to be
accountable for all aspects of the research in ensuring that the
accuracy or integrity of any part of the work are appropriately
investigated and resolved.
Ethics approval and consent to
participate
Ethical approval for the project was obtained from
the Research Ethics Committee of the First Affiliated Hospital of
Dalian Medical University. All patients signed the informed
consent. The non-retrospective ethical approval obtained for the
animal experiments was obtained from Dalian Medical University
Research Ethics Committee.
Patient consent for publication
Not applicable.
Competing interests
The authors declare that they have no competing
interests.
References
|
1
|
Hingorani P, Janeway K, Crompton BD,
Kadoch C, Mackall CL, Khan J, Shern JF, Schiffman J, Mirabello L,
Savage SA, et al: Current state of pediatric sarcoma biology and
opportunities for future discovery: A report from the sarcoma
translational research workshop. Cancer Genet. 209:182–194. 2016.
View Article : Google Scholar : PubMed/NCBI
|
|
2
|
Harrison DJ, Geller DS, Gill JD, Lewis VO
and Gorlick R: Current and future therapeutic approaches for
osteosarcoma. Expert Rev Anticancer Ther. 18:39–50. 2018.
View Article : Google Scholar : PubMed/NCBI
|
|
3
|
Smith WL, DeWitt DL and Garavito RM:
Cyclooxygenases: Structural, cellular, and molecular biology. Annu
Rev Biochem. 69:145–182. 2000. View Article : Google Scholar : PubMed/NCBI
|
|
4
|
Pang LY, Hurst EA and Argyle DJ:
Cyclooxygenase-2: A role in cancer stem cell survival and
repopulation of cancer cells during therapy. Stem Cells Int.
2016:20487312016. View Article : Google Scholar : PubMed/NCBI
|
|
5
|
Xu L, Stevens J, Hilton MB, Seaman S,
Conrads TP, Veenstra TD, Logsdon D, Morris H, Swing DA, Patel NL,
et al: COX-2 inhibition potentiates antiangiogenic cancer therapy
and prevents metastasis in preclinical models. Sci Transl Med.
6:242ra842014. View Article : Google Scholar : PubMed/NCBI
|
|
6
|
Rodriguez PC, Hernandez CP, Quiceno D,
Dubinett SM, Zabaleta J, Ochoa JB, Gilbert J and Ochoa AC: Arginase
I in myeloid suppressor cells is induced by COX-2 in lung
carcinoma. J Exp Med. 202:931–939. 2005. View Article : Google Scholar : PubMed/NCBI
|
|
7
|
Cha YI and DuBois RN: NSAI Ds and cancer
prevention: Targets downstream of COX-2. Annu Rev Med. 58:239–252.
2007. View Article : Google Scholar : PubMed/NCBI
|
|
8
|
Naruse T, Nishida Y, Hosono K and Ishiguro
N: Meloxicam inhibits osteosarcoma growth, invasiveness and
metastasis by COX-2-dependent and independent routes.
Carcinogenesis. 27:584–592. 2006. View Article : Google Scholar : PubMed/NCBI
|
|
9
|
Qu L and Liu B: Cyclooxygeanse-2 promotes
metastasis in osteosarcoma. Cancer Cell Int. 15:692015. View Article : Google Scholar : PubMed/NCBI
|
|
10
|
Rodriguez NI, Hoots WK, Koshkina NV,
Morales-Arias JA, Arndt CA, Inwards CY, Hawkins DS, Munsell MF and
Kleinerman ES: COX-2 expression correlates with survival in
patients with osteosarcoma lung metastases. J Pediatr Hematol
Oncol. 30:507–512. 2008. View Article : Google Scholar : PubMed/NCBI
|
|
11
|
Gutierrez-Beltran E, Denisenko TV,
Zhivotovsky B and Bozhkov PV: Tudor staphylococcal nuclease:
Biochemistry and functions. Cell Death Differ. 23:1739–1748. 2016.
View Article : Google Scholar : PubMed/NCBI
|
|
12
|
Yoo BK, Santhekadur PK, Gredler R, Chen D,
Emdad L, Bhutia S, Pannell L, Fisher PB and Sarkar D: Increased
RNA-induced silencing complex (RISC) activity contributes to
hepatocellular carcinoma. Hepatology. 53:1538–1548. 2011.
View Article : Google Scholar : PubMed/NCBI
|
|
13
|
Jariwala N, Rajasekaran D, Srivastava J,
Gredler R, Akiel MA, Robertson CL, Emdad L, Fisher PB and Sarkar D:
Role of the staphylococcal nuclease and tudor domain containing 1
in oncogenesis (review). Int J Oncol. 46:465–473. 2015. View Article : Google Scholar : PubMed/NCBI
|
|
14
|
Pandey MK, Gupta SC, Nabavizadeh A and
Aggarwal BB: Regulation of cell signaling pathways by dietary
agents for cancer prevention and treatment. Semin Cancer Biol.
46:158–181. 2017. View Article : Google Scholar : PubMed/NCBI
|
|
15
|
Tang QL, Xie XB, Wang J, Chen Q, Han AJ,
Zou CY, Yin JQ, Liu DW, Liang Y, Zhao ZQ, et al: Glycogen synthase
kinase-3β, NF-κB signaling, and tumorigenesis of human
osteosarcoma. J Natl Cancer Inst. 104:749–763. 2012. View Article : Google Scholar : PubMed/NCBI
|
|
16
|
Santhekadur PK, Das SK, Gredler R, Chen D,
Srivastava J, Robertson C, Baldwin AS Jr, Fisher PB and Sarkar D:
Multifunction protein staphylococcal nuclease domain containing 1
(SND1) promotes tumor angiogenesis in human hepatocellular
carcinoma through novel pathway that involves nuclear factor κB and
miR-221. J Biol Chem. 287:13952–13958. 2012. View Article : Google Scholar : PubMed/NCBI
|
|
17
|
Livak KJ and Schmittgen TD: Analysis of
relative gene expression data using real-time quantitative PCR and
the 2−ΔΔCT method. Methods. 25:402–408. 2001. View Article : Google Scholar : PubMed/NCBI
|
|
18
|
Piao H, Yuan Y, Wang M, Sun Y, Liang H and
Ma L: α-catenin acts as a tumor suppressor in E-cadherin-negative
basal-like breast cancer by inhibiting NF-κB signaling. Nat Cell
Biol. 16:245–254. 2014. View
Article : Google Scholar : PubMed/NCBI
|
|
19
|
Wu Q, Zhou L, Sun X, Yan Z, Hu C, Wu J, Xu
L, Li X, Liu H, Yin P, et al: Altered lipid metabolism in recovered
SARS patients twelve years after infection. Sci Rep. 7:91102017.
View Article : Google Scholar : PubMed/NCBI
|
|
20
|
Lin YH, Jewell BE, Gingold J, Lu L, Zhao
R, Wang LL and Lee DF: Osteosarcoma: Molecular pathogenesis and
iPSC modeling. Trends Mol Med. 23:737–755. 2017. View Article : Google Scholar : PubMed/NCBI
|
|
21
|
Taran SJ, Taran R and Malipatil NB:
Pediatric osteosarcoma: An updated review. Indian J Med Paediatr
Oncol. 38:33–43. 2017. View Article : Google Scholar : PubMed/NCBI
|
|
22
|
Tsuchiya N, Ochiai M, Nakashima K, Ubagai
T, Sugimura T and Nakagama H: SN D1, a component of RNA-induced
silencing complex, is up-regulated in human colon cancers and
implicated in early stage colon carcinogenesis. Cancer Res.
67:9568–9576. 2007. View Article : Google Scholar : PubMed/NCBI
|
|
23
|
Wang N, Du X, Zang L, Song N, Yang T, Dong
R, Wu T, He X and Lu J: Prognostic impact of Metadherin-SND1
interaction in colon cancer. Mol Biol Rep. 39:10497–10504. 2012.
View Article : Google Scholar : PubMed/NCBI
|
|
24
|
Xing A, Pan L and Gao J: p100 functions as
a metastasis activator and is targeted by tumor suppressing
microRNA-320a in lung cancer. Thorac Cancer. 9:152–158. 2018.
View Article : Google Scholar : PubMed/NCBI
|
|
25
|
Jin SJ, Lee A, Li J, Liyanage H, Yang Y,
Guo L, Asmann YW, Li PW, Erickson-Johnson M, Sakai Y, et al: Common
oncogene mutations and novel SND1-BRAF transcript fusion in lung
adenocarcinoma from never smokers. Sci Rep. 5:97552015. View Article : Google Scholar : PubMed/NCBI
|
|
26
|
Kuruma H, Kamata Y, Takahashi H, Igarashi
K, Kimura T, Miki K, Miki J, Sasaki H, Hayashi N and Egawa S:
Staphylococcal nuclease domain-containing protein 1 as a potential
tissue marker for prostate cancer. Am J Pathol. 174:2044–2050.
2009. View Article : Google Scholar : PubMed/NCBI
|
|
27
|
Ho J, Kong JW, Choong LY, Loh MC, Toy W,
Chong PK, Wong CH, Wong CY, Shah N and Lim YP: Novel breast cancer
metastasis-associated proteins. J Proteome Res. 8:583–594. 2009.
View Article : Google Scholar : PubMed/NCBI
|
|
28
|
Jariwala N, Rajasekaran D, Mendoza RG,
Shen XN, Siddiq A, Akiel MA, Robertson CL, Subler MA, Windle JJ,
Fisher PB, et al: Oncogenic role of SND1 in development and
progression of hepatocellular carcinoma. Cancer Res. 77:3306–3316.
2017. View Article : Google Scholar : PubMed/NCBI
|
|
29
|
Bilbao-Aldaiturriaga N, Gutierrez-Camino
A, Martin-Guerrero I, Pombar-Gomez M, Zalacain-Diez M,
Patiño-Garcia A, Lopez-Lopez E and Garcia-Orad A: Polymorphisms in
miRNA processing genes and their role in osteosarcoma risk. Pediatr
Blood Cancer. 62:766–769. 2015. View Article : Google Scholar : PubMed/NCBI
|
|
30
|
Su C, Zhang C, Tecle A, Fu X, He J, Song
J, Zhang W, Sun X, Ren Y, Silvennoinen O, et al: Tudor
staphylococcal nuclease (Tudor-SN), a novel regulator facilitating
G1/S phase transition, acting as a co-activator of E2F-1
in cell cycle regulation. J Biol Chem. 290:7208–7220. 2015.
View Article : Google Scholar : PubMed/NCBI
|
|
31
|
Netea-Maier RT, Smit Jwa and Netea MG:
Metabolic changes in tumor cells and tumor-associated macrophages:
A mutual relationship. Cancer Lett. 413:102–109. 2018. View Article : Google Scholar : PubMed/NCBI
|
|
32
|
Yarla NS, Bishayee A, Sethi G, Reddanna P,
Kalle AM, Dhananjaya BL, Dowluru KS, Chintala R and Duddukuri GR:
Targeting arachidonic acid pathway by natural products for cancer
prevention and therapy. Semin Cancer Biol 40-. 41:48–81. 2016.
View Article : Google Scholar
|
|
33
|
Zhou Z, Ibekwe E and Chornenkyy Y:
Metabolic alterations in cancer cells and the emerging role of
oncometabolites as drivers of neoplastic change. Antioxidants.
7:E162018. View Article : Google Scholar : PubMed/NCBI
|
|
34
|
Krysan K, Reckamp KL, Dalwadi H, Sharma S,
Rozengurt E, Dohadwala M and Dubinett SM: Prostaglandin
E2 activates mitogen-activated protein kinase/Erk
pathway signaling and cell proliferation in non-small cell lung
cancer cells in an epidermal growth factor receptor-independent
manner. Cancer Res. 65:6275–6281. 2005. View Article : Google Scholar : PubMed/NCBI
|
|
35
|
Castellone MD, Teramoto H, Williams BO,
Druey KM and Gutkind JS: Prostaglandin E2 promotes colon
cancer cell growth through a Gs-axin-β-catenin signaling
axis. Science. 310:1504–1510. 2005. View Article : Google Scholar : PubMed/NCBI
|
|
36
|
Consalvi S, Biava M and Poce G: COX
inhibitors: A patent review (2011–2014). Expert Opin Ther Pat.
25:1357–1371. 2015. View Article : Google Scholar : PubMed/NCBI
|