Introduction
The MAPT gene (microtubule-associated protein Tau
gene) encodes the Tau protein, which is involved in microtubule
stabilization and tubulin polymerization into microtubules. It has
long been established that aggregations of hyperphosphorylated
neurofibrillary and gliofibrillary tangles of Tau protein are
involved in several neurodegenerative disorders, known as
tauopathies (1,2). However, the role of Tau in brain
cancers, and specifically, low-grade glioma, has not been
explored.
Gliomas are histologically graded from I to IV.
Grade I gliomas are usually benign. Grade II [low-grade glioma
(LGG)] has an average survival period of ~7 years. Grade II gliomas
can progress into grade III (high-grade gliomas), and eventually
grade IV (secondary glioblastoma). Recent research indicates that
historically used clinical variables in LGG are inferior prognostic
indicators relative to current genetic information, for example the
IDH1 mutational status (3). As LGG
is an early stage in the progression of gliomas from low grade to
high grade, there is a need to understand the disease process from
this early onset. Pinpointing key molecular features that are
associated with improved outcomes will help elucidate the disease
progression and possibly provide prognostic markers (4).
Given Tau's role in neurodegeneration in the brain
and microtubule stabilization, it was of interest to explore Tau's
connection to LGG. Colodner et al demonstrated that glial
fibrillary tangle formation was accompanied by JAK/STAT-mediated
apoptotic cell death of both glia and neurons in a
Drosophila model of glial tauopathy (5). However, previous research on Tau in
the cancer setting, for the most part, has focused on
microtubule-inhibiting chemotherapy in breast cancer (6–8). For
example, Zhou et al identified Tau expression as a factor to
predict tumor sensitivity to microtubule-inhibiting compounds such
as taxanes (9). In the present
study, we present a novel look into the association of Tau with
survival rates for LGG patients.
Materials and methods
MAPT, apoptosis-effector gene and
pro-proliferative gene RNAseq analysis
RNASeq values for MAPT, for the panel of
apoptosis-effector genes, and for the panel of pro-proliferative
genes, were downloaded from cbioportal.org. Pearson correlation coefficients were
obtained, using Microsoft Excel (10–12).
Kaplan-Meier analyses and RNASeq
data
The barcodes (patient identifiers) representing 530
LGG samples, 1,105 BRCA (breast cancer) samples and 478 SKCM (skin
cutaneous melanoma) samples, for which RNASeq data were available,
were sorted from low to high based on the RNASeq values for each of
the indicated genes in the Results section. Survival relationships
were then obtained by matching barcode survival data, available
from cbioportal.org, with the RNASeq data
representing the top and bottom 20% of the RNASeq values (106
barcodes for LGG, 221 barcodes for BRCA and 94 barcodes for SKCM);
and with the top and bottom 50, 40, 30 and 10% of the RNASeq values
for MAPT (LGG only). The clinical data (months of overall survival
and disease-free survival) for the associated barcodes were then
processed using IBM Statistics Package for the Social Sciences
(SPSS), version 24, to provide the Kaplan-Meier (KM) curves and an
average difference in survival rates between samples representing
the top and bottom RNASeq value percentages (for the genes as
indicated in Results).
Histological grade analysis
Histological grades for LGG barcodes were downloaded
from cbioportal.org. Histological grade
barcodes were then matched to the RNAseq data (106 barcodes for
LGG). Comparison of proportions test for the data representing the
top and bottom 20% of the MAPT RNASeq values was carried out using
the MedCalc comparison of proportions calculator (https://www.medcalc.org/calc/comparison_of_proportions.php).
Copy number variation (CNV)
analysis
Copy numbers for the MAPT gene for LGG barcodes were
downloaded from cbioportal.org. Copy numbers were
then matched to barcode RNAseq data (530 barcodes for LGG). A
Student's t-test for copy number data representing the top and
bottom 20% of the MAPT RNASeq values was carried out using the
Microsoft Excel function.
Methylation analysis
Methylation data for the MAPT gene for LGG barcodes
were downloaded from cbioportal.org. Methylation data barcodes were then
matched to RNAseq data (530 barcodes for LGG). A Student's t-test
for the methylation data representing the top and bottom 20% of the
MAPT RNASeq values was carried out using the Microsoft Excel
function.
Diagnosis age analysis
Diagnosis age data for LGG barcodes were downloaded
from cbioportal.org. Diagnosis age barcodes
were then matched to RNAseq data (530 barcodes for LGG). A
Student's t-test for diagnosis age representing the top and bottom
20% of the MAPT RNASeq values was carried out using the Microsoft
Excel function.
R2: Genomics Analysis and
Visualization Platform
MAPT gene expression and overall survival data for
additional glioma datasets were assessed using the ‘R2: Genomics
Analysis and Visualization Platform (http://r2.amc.nl)’. Single gene Kaplan scan analysis
was conducted for MAPT expression (203929_s_at) for each dataset as
indicated in Results. Median MAPT mRNA expression was used as a
cut-off for overall survival comparisons. The R2 algorithm was used
to generate Kaplan-Meier analyses to compare survival outcomes for
the top half vs. bottom half of MAPT expressers in each indicated
dataset.
Supplementary and supporting
material
A large amount of supplementary and supporting
documentation has been prepared for the generation of this report,
including detailed data supporting for the Materials and methods
section directly above. This information is available as a single
PDF upon E-mail request to the corresponding author or by
accessing: http://www.universityseminarassociates.com/Supporting_online_material_for_scholarly_pubs.php.
Results
MAPT (Tau) expression and survival
rates
We first compared the rate of overall and
disease-free survival for LGG patients representing the top and
bottom 20% of MAPT expressers, based on the MAPT RNASeq values
representing the TCGA-LGG data set (Fig. 1). This comparison indicated that
high MAPT RNASeq values were associated with a significantly
increased overall and disease-free survival rates for LGG. To
substantiate this result, we compared the top 10, 30, 40 and 50%
MAPT expressers with their corresponding lower level MAPT
expressers for overall survival. In all cases, the initial result
was confirmed.
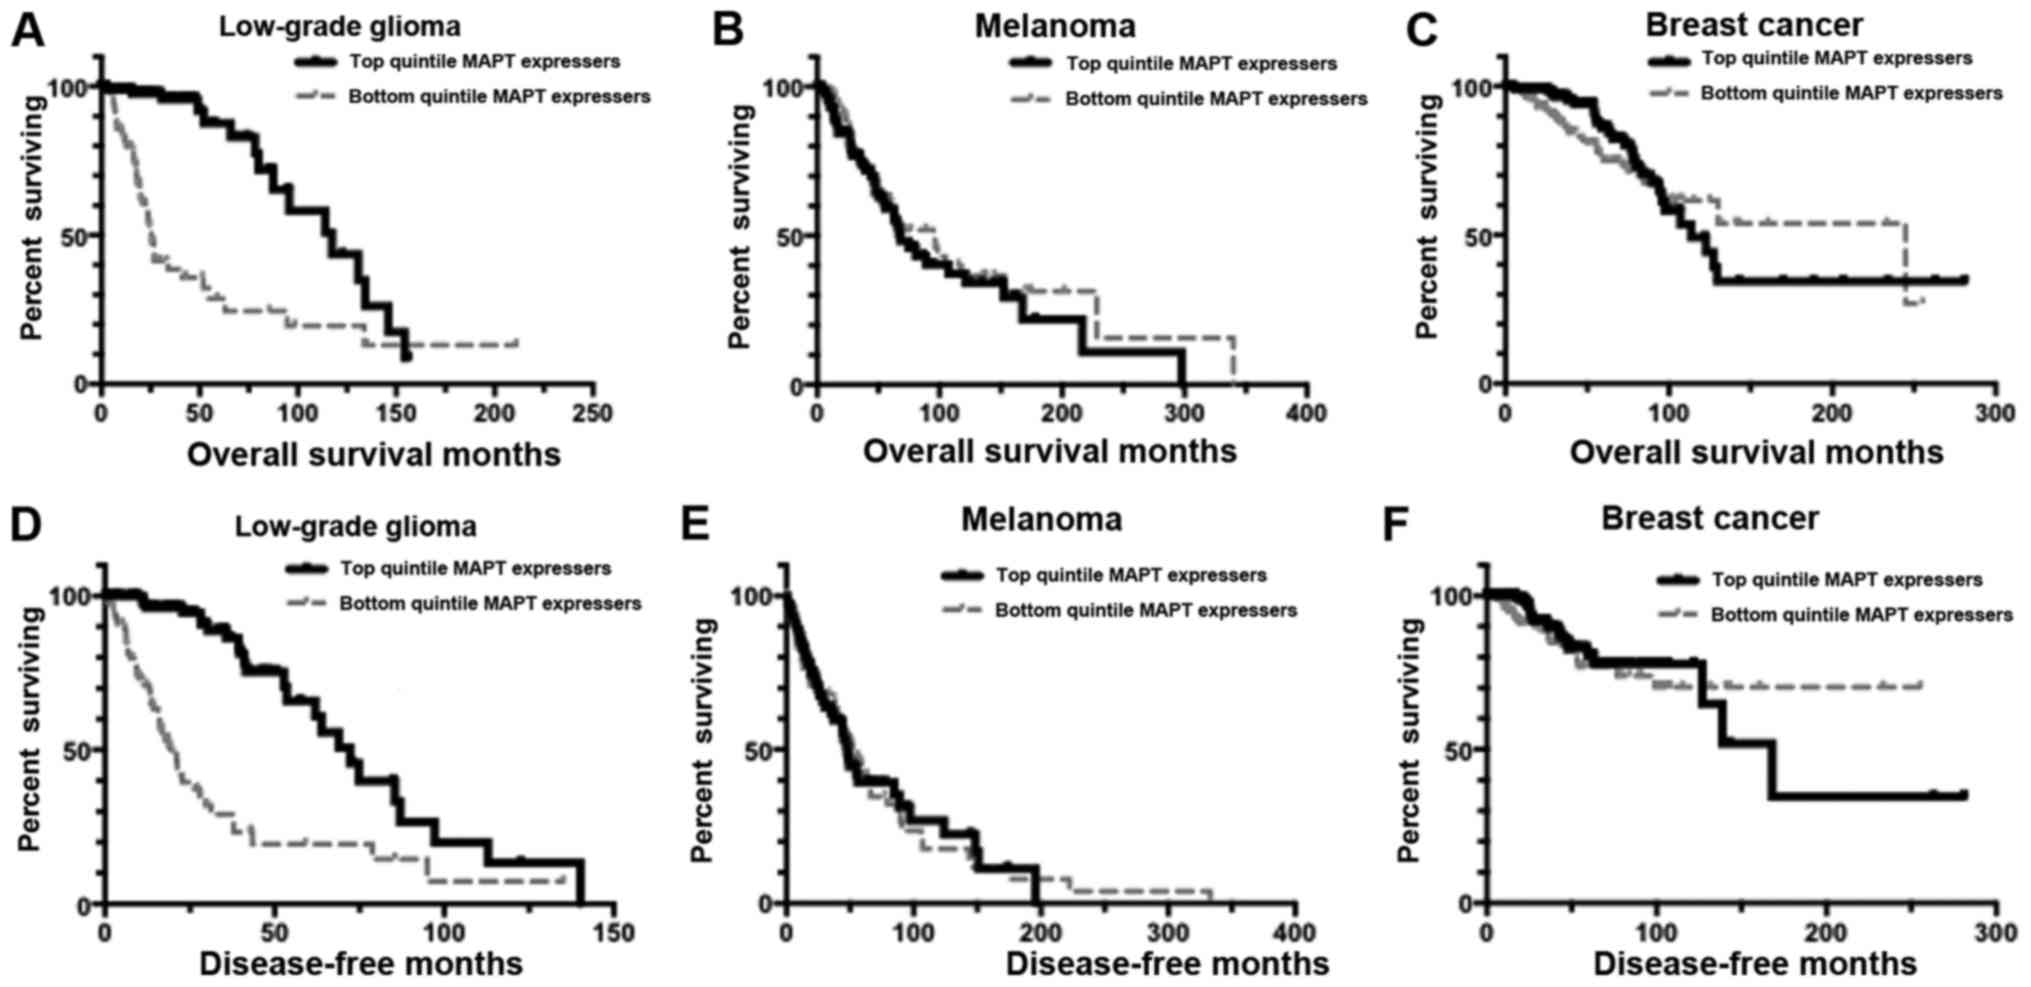 | Figure 1.Kaplan-Meier curves representing
distinct MAPT expression levels. Results here indicate that there
were overall survival (OS) and disease-free survival (DFS)
distinctions for low-grade glioma (LGG) based on the MAPT levels in
the patient tumors. However, no such distinctions were detectable
in BRCA (breast cancer) and SKCM (skin cutaneous melanoma) tumor
samples. The following text provides mean survival times and
P-values for the Kaplan-Meier (KM) analyses. (A) KM OS curve for
LGG barcodes that are in the top quintile of MAPT expressers
(n=96), compared to the OS for the bottom quintile of MAPT
expressers (n=104). Mean OS for the top quintile of MAPT
expressers, 109.04 months; mean OS for bottom quintile of MAPT
expressers, 59.36 months. Log-rank comparison P-value, P=9.152E-10.
(B) KM OS analysis for SKCM barcodes that are in the top quintile
of MAPT expressers (n=90), compared to the OS for the bottom
quintile of MAPT expressers (n=91). Mean OS for the top quintile of
MAPT expressers, 108.85 months; mean OS for bottom quintile of MAPT
expressers, 131.09 months. Log-rank comparison P-value, P=0.433.
(C) KM OS analysis for BRCA barcodes that are in the top quintile
of MAPT expressers (n=218), compared to the OS for the bottom
quintile of MAPT expressers (n=218). Mean OS for the top quintile
of MAPT expressers, 154.70 months; mean OS for bottom quintile of
MAPT expressers, 164.95 months. Log-rank comparison P-value,
P=0.302. (D) KM DFS analysis for LGG barcodes that are in the top
quintile of MAPT expressers (n=93), compared to the DFS for the
bottom quintile of MAPT expressers (n=86). Mean DFS for the top
quintile of MAPT expressers, 74.72 months; mean DFS for bottom
quintile of MAPT expressers, 34.80 months. Log-rank comparison
P-value, P=2.215E-10. (E) KM DFS analysis for SKCM barcodes that
are in the top quintile of MAPT expressers (n=76), compared to the
DFS for the bottom quintile of MAPT expressers (n=80). Mean DFS for
the top quintile of MAPT expressers, 71.36 months; mean DFS for
bottom quintile of MAPT expressers, 73.59 months. Log-rank
comparison P-value, P=0.975. (F) KM DFS analysis for BRCA barcodes
that are in the top quintile of MAPT expressers (n=200), compared
to the DFS for the bottom quintile of MAPT expressers (n=198). Mean
DFS for the top quintile of MAPT expressers, 169.72 months; mean
DFS for bottom quintile of MAPT expressers, 192.60 months. Log-rank
comparison P-value, P=0.316. MAPT, microtubule-associated protein
Tau gene. |
To determine whether the above association of MAPT
RNASeq levels with the markedly distinct survival rates was
specific to LGG, data for overall survival and disease-free
survival for BRCA and SKCM tumor barcodes were downloaded from
cbioportal.org, and the RNAseq and KM analyses
were conducted. Results indicated that MAPT expression levels did
not correlate with either overall or disease-free survival rate
differences in the cases of BRCA or SKCM (Fig. 1). The mean survival periods and
P-values for the log-rank tests are given in the figure legend for
Fig. 1. These data indicated that
the higher overall and disease-free survival rates for high MAPT
expressing patients was specific to LGG.
To determine whether the increased LGG survival rate
associated with MAPT expression could be associated with other
neurotoxic proteins, we assessed whether significantly increased
survival rates could be associated with higher RNASeq values for
APP or SNCA. Analyses indicated there were no differences in
survival for the patients represented by the LGG barcodes
representing the top and bottom quintiles, for RNASeq values for
APP or SNCA, respectively (Fig.
2).
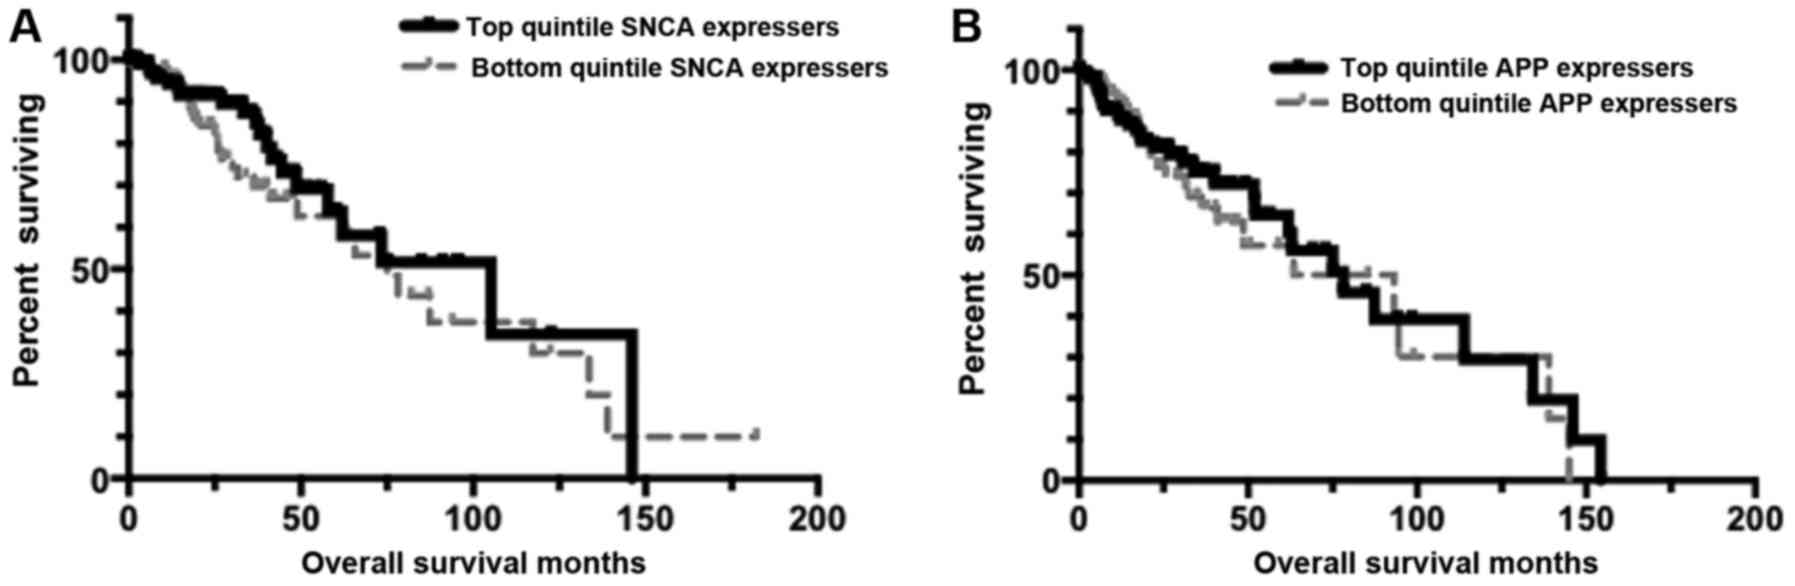 | Figure 2.Kaplan-Meier (KM) curves representing
distinct APP and SNCA expression levels. Results here indicate that
no survival distinctions are detectable for low-grade glioma (LGG)
based on APP or SNCA expression levels. (A) KM overall survival
(OS) analysis for LGG barcodes that are in the top quintile of SNCA
expressers (n=105), compared to the OS for the bottom quintile of
SNCA expressers (n=100). Mean OS for the top quintile of MAPT
expressers, 89.44 months; mean OS for bottom quintile of MAPT
expressers, 82.74 months. Log-rank comparison P-value, P=0.279. (B)
KM OS analysis for LGG barcodes that are in the top quintile of APP
expressers (n=102), compared to the OS for the bottom quintile of
APP expressers (n=102). Mean OS for the top quintile of MAPT
expressers, 134.17 months; mean OS for bottom quintile of MAPT
expressers, 138.93 months. Log-rank comparison P-value, P=0.565.
APP, amyloid precursor protein gene; MAPT, microtubule-associated
protein Tau gene. |
LGG apoptosis-effector gene RNASeq
values are correlated with MAPT RNASeq values
As Tau is a neurotoxic protein associated with
various tauopathies, and contributes to neuronal cell death, we
sought to determine whether apoptosis-effector genes were expressed
at higher levels in the LGG samples represented by the barcodes
with higher levels of MAPT RNASeq values. We first evaluated a set
of 28 apoptosis-effector genes (13) for RNAseq expression as represented
by the LGG barcodes. Of those 28 genes, we identified a subset of
five apoptosis-effector genes that had significantly increased
RNASeq values associated with barcodes that represented the top 20%
of MAPT expressors: CASP9, CYC1, CRADD, COX7A2L and UQCRC2
(Table I).
 | Table I.Average apoptosis-effector gene RNASeq
values for LGG barcodes representing high and low expression of
MAPT. |
Table I.
Average apoptosis-effector gene RNASeq
values for LGG barcodes representing high and low expression of
MAPT.
| Apoptosis-effector
gene | Bottom 20% MAPT
RNASeq values | Top 20% MAPT RNASeq
values | P-value |
|---|
| CASP9 |
511.0 |
901.2 | <0.0001 |
| COX7A2L | 1,158.2 | 1,300.2 |
0.0011 |
| CRADD |
193.1 |
215.0 |
0.0054 |
| CYC1 | 1,952.8 | 2,339.4 | <0.0001 |
| UQCRC2 | 2,601.8 | 3,853.1 | <0.0001 |
To verify the above positive correlations of
apoptosis-effector gene RNASeq values with MAPT RNASeq values, we
obtained the Pearson correlation coefficients for the MAPT RNA
expression levels and the RNA expression levels of CASP9, CYC1,
CRADD, COX7A2L and UQCRC2 in LGG. In each case, there was a
statistically significant correlation with MAPT expression
(Fig. 3).
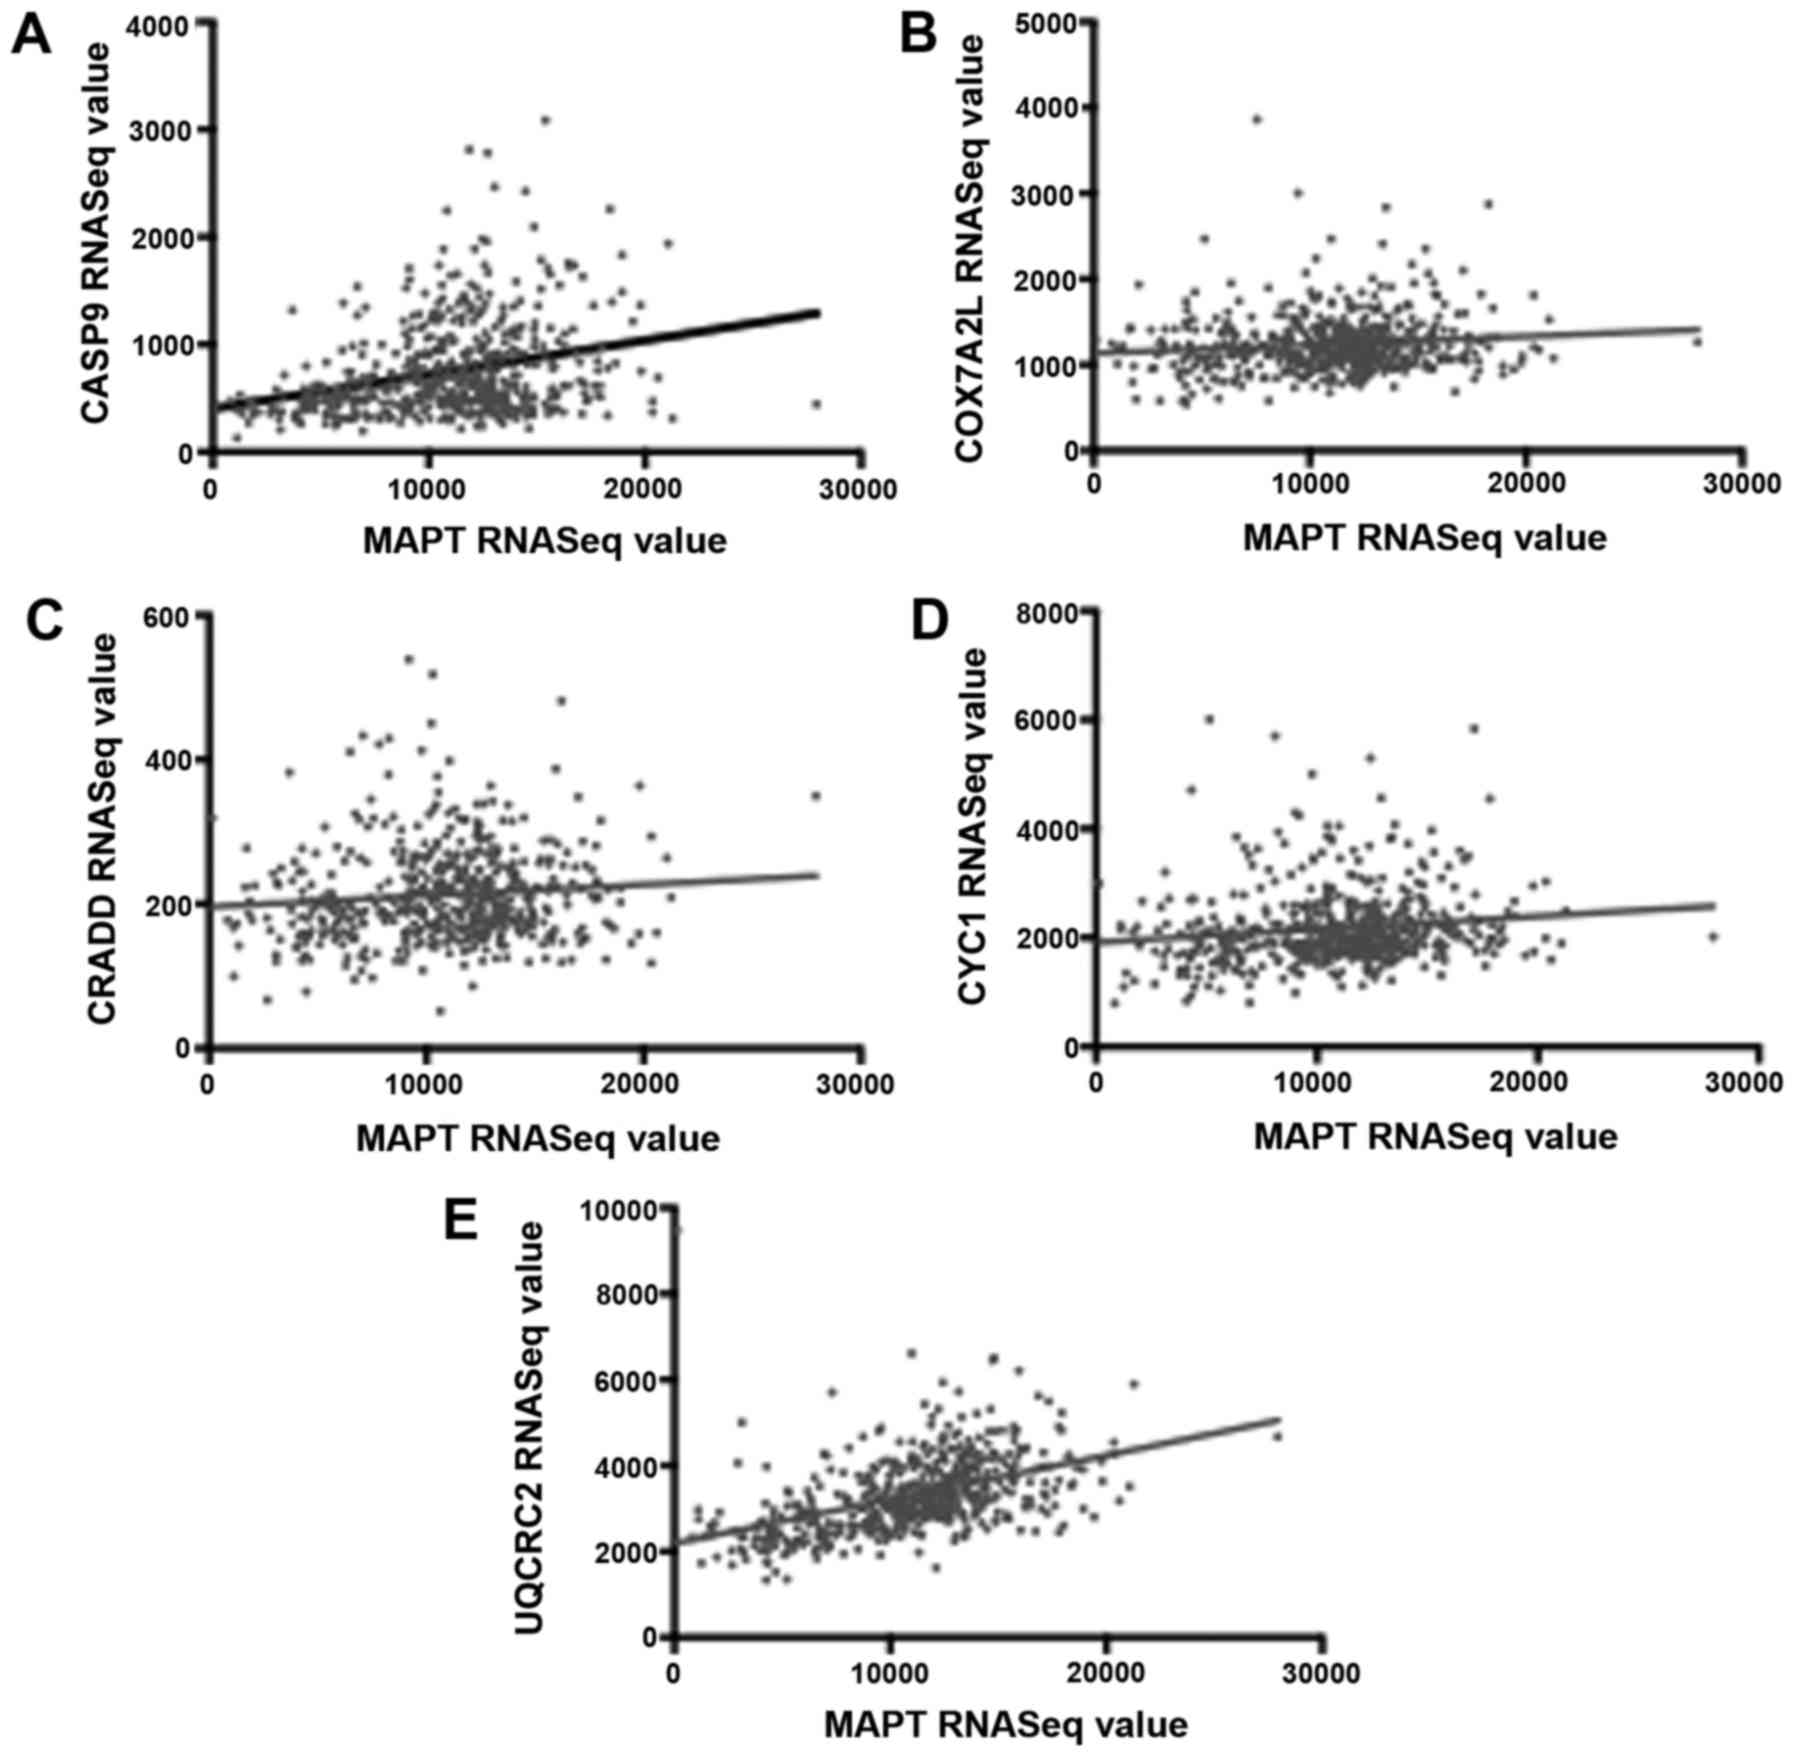 | Figure 3.Correlation of MAPT and
apoptosis-effector gene expression levels. Results here indicate
correlation of high MAPT expression levels with high
apoptosis-effector gene expression levels, possibly providing an
explanation for the longer survival rates observed with higher MAPT
levels. (A) MAPT vs. CASP9 (B) MAPT vs. COX7A2L (C) MAPT vs. CRADD
(D) MAPT vs. CYC1 (E) MAPT vs. UQCRC2. The P-values for the Pearson
correlation coefficients are P<0.00001, P=0.00723, P=0.02863,
P=0.00169 and P<0.00001, respectively for each relationship.
MAPT, microtubule-associated protein Tau gene; CASP9, caspase 9;
COX7A2L, cytochrome c oxidase subunit 7A2 like; CRADD, CASP2
and RIPK1 domain containing adaptor with death domain; CYC1,
cytochrome c1; UQCRC2, ubiquinol-cytochrome c
reductase core protein 2. |
To determine whether any of the five above
identified apoptosis-effector genes represented independent markers
of survival rates, the overall survival data for LGG barcodes
representing the highest 20% and lowest 20% of CASP9, CYC1, CRADD,
COX7A2L and UQCRC2 expression levels were obtained for KM analysis.
Results indicated that only CASP9 and UQCRC2 represented
independent markers of survival, with barcodes representing the
highest 20% of both CASP9 and UQCRC2 having significantly increased
survival rates (Fig. 4).
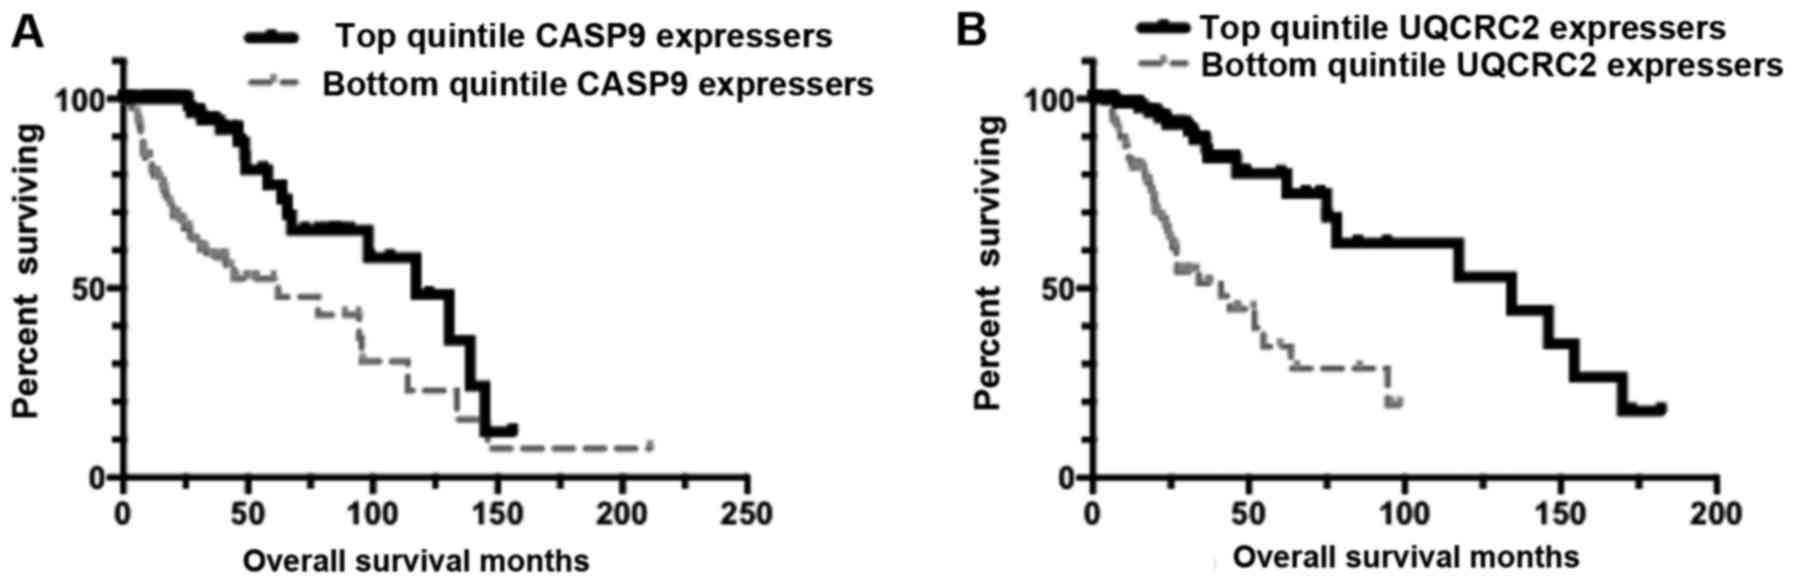 | Figure 4.Kaplan-Meier (KM) curves representing
distinct apoptosis-effector gene expression levels. Results
presented here indicate that apoptosis-effector gene expression
represents an independent marker of survival rates. (A) KM overall
survival (OS) curve for low-grade glioma (LGG) barcodes that are in
the top quintile of CASP9 expressers (n=100), compared to the OS
for the bottom quintile of CASP9 expressers (n=105). Mean OS for
the top quintile of CASP9 expressers, 105.309 months; mean OS for
bottom quintile of CASP9 expressers, 73.471 months. Log-rank
comparison P-value, P=0.000014. (B) KM OS curve for LGG barcodes
that are in the top quintile of UQCRC2 expressers (n=103), compared
to the OS for the bottom quintile of UQCRC2 expressers (n=103).
Mean OS for the top quintile of UQCRC2 expressers, 115.495 months;
mean OS for bottom quintile of UQCRC2 expressers, 48.623 months.
Log-rank comparison P-value, P=1.971E-7. CASP9, caspase 9; MAPT,
microtubule-associated protein Tau gene; UQCRC2,
ubiquinol-cytochrome c reductase core protein 2. |
LGG proliferation-effector gene RNASeq
values are correlated with MAPT RNASeq values
We next sought to determine whether any
proliferation-effector genes were expressed at higher levels in the
samples with lower levels of the MAPT RNASeq values. We previously
established a panel of 62 proliferation-effector genes (13). Of those 62 genes, we identified a
subset of 28 proliferation-effector genes that have significantly
increased RNASeq expression in barcodes that represent the bottom
20% of MAPT expressers.
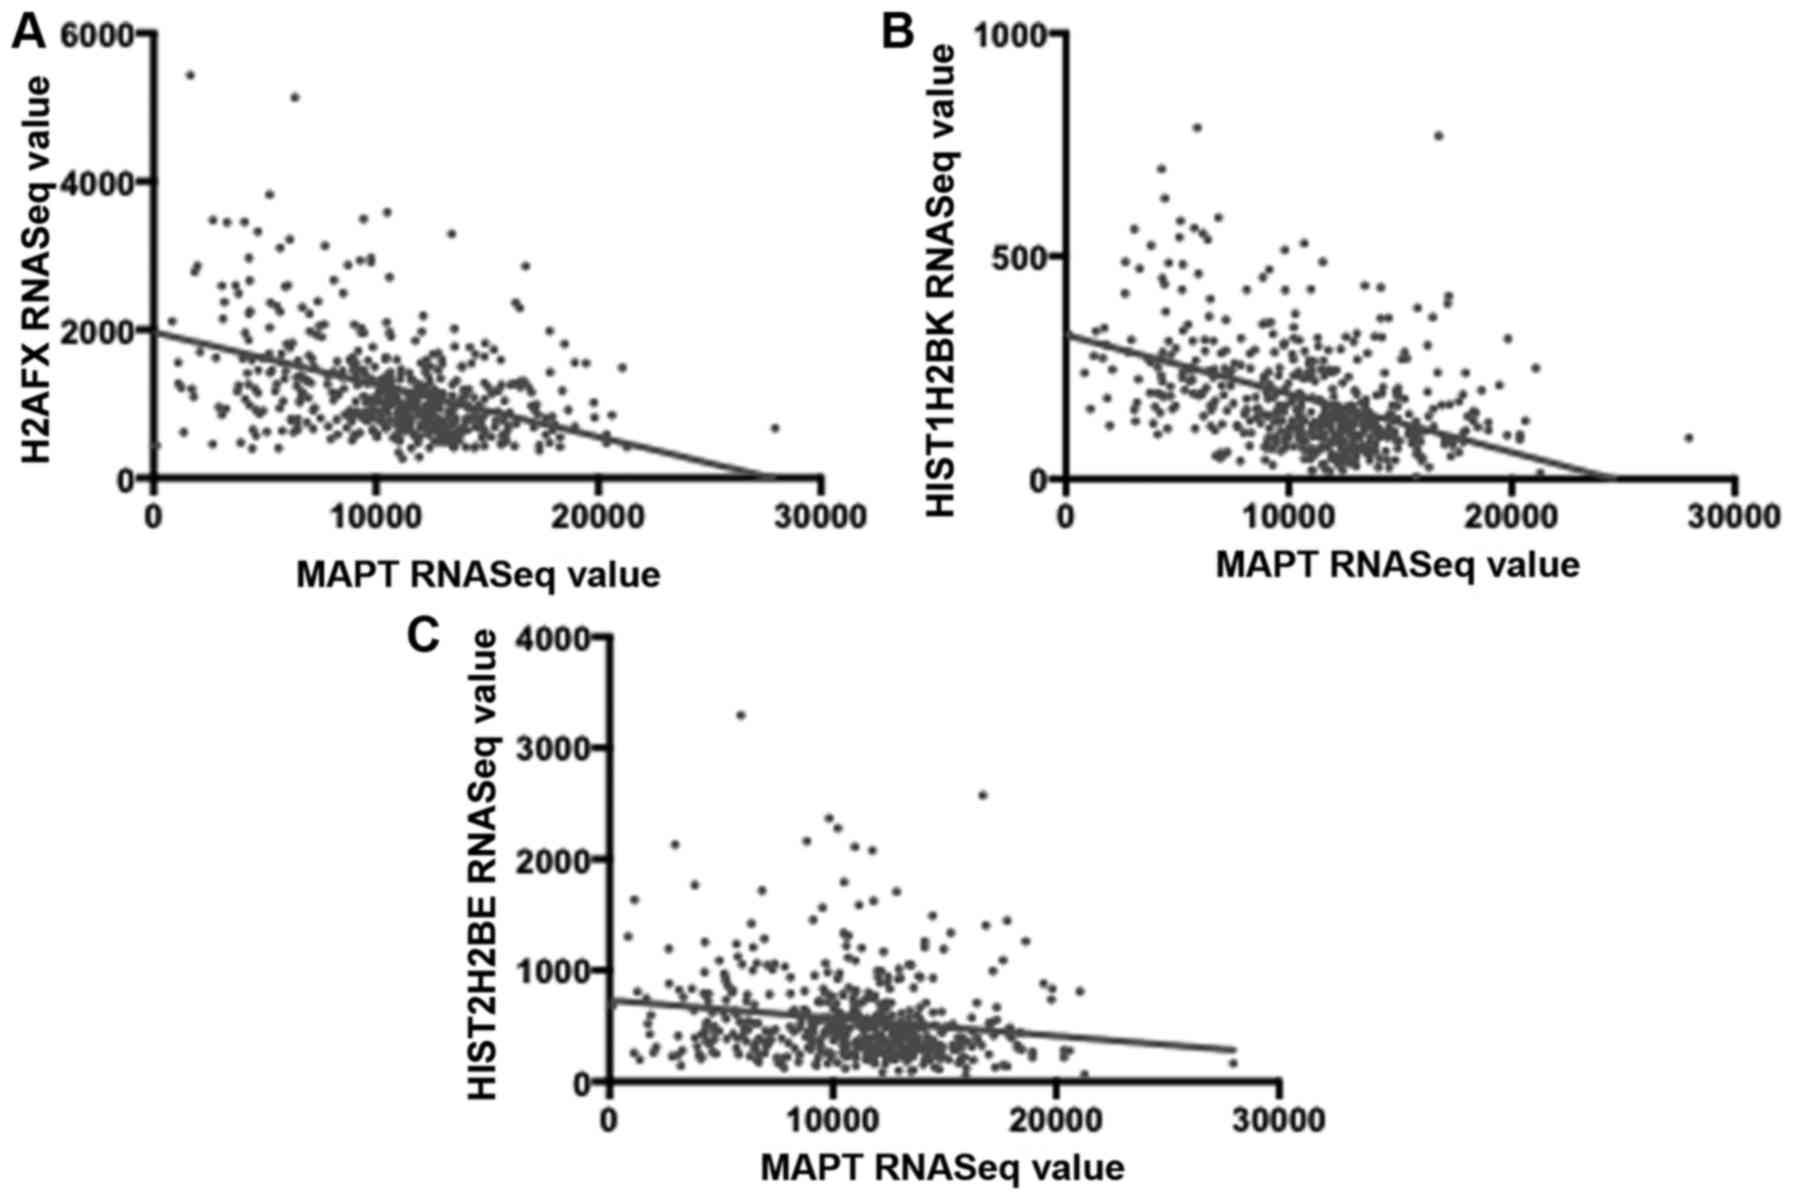
To verify the above inverse correlations of
proliferation-effector gene expression with MAPT expression, we
obtained the Pearson correlation coefficients for MAPT RNASeq
values and the RNASeq values for a histone subset of the above
indicated, 28 proliferation-effector genes, for the LGG barcodes:
H2AFX, HIST1H2BK and HIST2H2BE. In each case, there was a
statistically significant inverse correlation with MAPT expression
(Fig. 5).
To determine whether any of the above indicated
histone genes represented independent survival markers, we
generated KM survival curves based on the top and bottom LGG
expressers. From these analyses, we determined that the expression
of all three of the histone genes independently represented
survival distinctions (Table
II).
| Table II.Identifying proliferation-effector
gene survival associations in LGG.. |
Table II.
Identifying proliferation-effector
gene survival associations in LGG..
|
| Gene |
|---|
|
|
|
|---|
| Survival
distinctions | H2AFX | HIST1H2BK | HIST2H2BE |
|---|
| Increased/decreased
survival for the top quintile of expressers of the indicated
gene | Decreased | Decreased | Decreased |
| Increased/decreased
survival for the bottom quintile of expressers of the indicated
gene | Increased | Increased | Increased |
| KM, log-rank
P-value | <0.0001 | <0.0001 | <0.0001 |
LGG histological grade is correlated
with MAPT RNASeq values
To determine whether MAPT expression correlates with
histological features of LGG, we compared histological grades of
the top quintile and bottom quintile of MAPT-expressing barcodes.
All LGG barcodes in the dataset used were graded either G2 or G3.
We determined that the low MAPT-expressing barcodes, that also
represented decreased survival rates, also had a greater proportion
of G3 histological grade than the high MAPT-expressing barcodes
(Table III).
| Table III.Identification of histological grade
associations with MAPT expression. |
Table III.
Identification of histological grade
associations with MAPT expression.
|
| Bottom quintile
MAPT expressers | Top quintile MAPT
expressers | P-value |
|---|
| Fraction G3
histological grade | 0.78 | 0.22 | <0.0001 |
CNV and methylation are correlated
with MAPT RNASeq values in LGG
To determine whether there may be any genetic or
epigenetic associations with increased MAPT expression, we compared
MAPT copy number variation (CNV) and methylation of the MAPT gene
in the top quintile and bottom quintile of MAPT-expressing barcodes
using data available on cbioportal.org. For CNV, a negative result indicates
average copy number loss, while a positive result indicates average
copy number gain among the barcodes analyzed. Our results indicated
that there is an average increase in MAPT copy number among
barcodes that are in the top quintile of MAPT expressers, while
there is an average decrease in copy number among barcodes that are
in the bottom quintile of MAPT expressers. Furthermore, our results
indicated that there is an increase in MAPT gene methylation among
barcodes that are in the bottom quintile of MAPT expressers
(Table IV). Together, the CNV and
methylation results indicated that there are likely straightforward
genetic and epigenetic explanations for decreased MAPT
expression.
| Table IV.Copy number variation and methylation
associations with MAPT expression. |
Table IV.
Copy number variation and methylation
associations with MAPT expression.
|
| Bottom quintile
MAPT expressers | Top quintile MAPT
expressers | P-value |
|---|
| Copy no.
variation | −0.031 | 0.048 | 0.0002 |
| Methylation |
0.490 | 0.355 | 3.479E-13 |
Diagnosis age is correlated with MAPT
RNASeq values in LGG
To determine whether MAPT expression may have an
effect on diagnosis age, we compared the average age of diagnosis
in patient barcodes representing the top and bottom quintile of
MAPT RNASeq expression using data available on cbioportal.org. Results indicated that increased MAPT
expression was associated with an earlier diagnosis age. The top
quintile of MAPT expressers had an average diagnosis age of 39,
while the lowest quintile of MAPT expressers had an average
diagnosis age of 48 (Table V).
| Table V.Diagnosis age associations with MAPT
expression. |
Table V.
Diagnosis age associations with MAPT
expression.
|
| Bottom quintile
MAPT expressers | Top quintile MAPT
expressers | P-value |
|---|
| Average age of
diagnosis | 48.56 | 39.38 | 4.248E-07 |
Analysis of MAPT expression and
survival in additional glioma datasets from the R2: Genomics
Analysis and Visualization Platform
To determine if MAPT mRNA expression is associated
with improved survival outcomes in additional, independent glioma
datasets, the R2: Genomics analysis and visualization platform was
used. Two additional glioma datasets were analyzed, French (n=284)
and Kawaguchi (n=50). In both datasets, the top half of MAPT
expressers had improved overall survival outcomes when compared to
the bottom half of MAPT expressers (Table VI). Thus, results from these
datasets were consistent with the above analyses of the TCGA LGG
dataset.
| Table VI.Identifying MAPT expression
associations with survival in additional glioma datasets, using the
R2: Genomics Analysis and Visualization Platform. |
Table VI.
Identifying MAPT expression
associations with survival in additional glioma datasets, using the
R2: Genomics Analysis and Visualization Platform.
|
| Dataset |
|---|
|
|
|
|---|
| Survival
distinctions | Glioma (French)
n=284 | Glioma (Kawaguchi)
n=50 |
|---|
| Increased/decreased
survival for the top half of MAPT expressers in the indicated
dataset | Increased | Increased |
| Increased/decreased
survival for the bottom half of MAPT expressers in the indicated
dataset | Decreased | Decreased |
| KM, log-rank
P-value | <0.0001 | <0.001 |
Discussion
In summary, the above data and analyses indicated
that Tau expression was associated with a dramatic increase in
survival in low-grade glioma (LGG) patients. While the Tau
mechanism in LGG is unknown, we demonstrated that increased Tau
expression was correlated with an increase in the expression of
several apoptosis-effector genes; and that lack of Tau was
associated with a higher level of proliferation-effector gene
expression. In addition, the histological grade of the tumor was
inversely correlated with Tau expression.
The precise process of Tau-induced neurotoxicity in
tauopathies also remains a mystery, but may be due to multiple
causes, including DNA damage. In neurons, Tau aggregates become
misfolded and hyperphosphorylated, leading to the bundling and
stabilization of filamentous actin, ultimately causing oxidative
stress in the cell through dysfunctional mitochondria. The
oxidative stress causes DNA damage and causes the loss of
heterochromatin, allowing genes that are normally silenced by
heterochromatin to be transcribed, ultimately leading to cell cycle
activation and apoptosis in mature neurons (14). Several studies have noted the link
between DNA damage and neurodegeneration in Alzheimer's disease
(15–19).
While much has been explored regarding the role of
Tau pathology in neurons, there has been less focus on
investigating the role of Tau aggregation in glial cells. Several
studies have demonstrated the functional consequences of Tau
aggregation in glial cells (5,20).
Various studies indicate that Tau pathology in glial cells is
similar to that in neurons, to an extent, but is not identical
(21,22). If we apply the model of Tau
oligomerization impact on neural cells (in tauopathies), to glial
cells, Tau accumulation in glial cells (in LGG) could trigger a DNA
damage response and apoptosis. Our results would be consistent with
this hypothesis through increased expression of several
apoptosis-effector genes in the population of patients that have
high MAPT expression.
Tau is crucial in stabilizing and organizing axonal
microtubules in neural cells (23).
However, in various tauopathies, Tau forms hyperphosphorylated
aggregates which causes the disruption of the microtubule network
(24). While the role of Tau in
glial cells remains less-investigated, if we apply the previously
established model of Tau aggregation and phosphorylation
contributing to microtubule destabilization in neural cells to
glial cells, it becomes evident that decreased Tau aggregation may
allow increased microtubule stabilization, and thus increased cell
proliferation. The above data are consistent with this idea as LGG
samples with decreased MAPT expression expressed higher
proliferation-effector genes, and specifically expressed more
histone genes.
Acknowledgements
Authors acknowledge the financial support of the
taxpayers of the State of Florida; and would also like to thank
Laura Blair for the helpful discussions.
Funding
No specific funding was received.
Availability of data and materials
The supporting online material files indicated in
the article are available upon E-mail reqeust to the corresponding
author.
Authors' contributions
SZ made the initial discovery connecting Tau
expression to LGG survival outcomes and conducted the majority of
the subsequent analyses. BIC conducted the analyses regarding the
proliferation-effector genes. DS contributed to the design of
particular aspects of RNASeq interpretations. GB supervised the
project, provided guidance for the design of the project, conducted
some of the analyses directly, spot-checked much of the analyses,
wrote most of the drafts of the manuscript and takes full
responsibility for the content. All authors read and approved the
manuscript and agree to be accountable for all aspects of the
research in ensuring that the accuracy or integrity of any part of
the work are appropriately investigated and resolved.
Ethics approval and consent to
participate
Not applicable
Patient consent for publication
Not applicable.
Competing interests
The authors state that they have no competing
interests.
Glossary
Abbreviations
Abbreviations:
|
APP
|
amyloid precursor protein gene
|
|
BRCA
|
breast cancer
|
|
CASP9
|
caspase 9 gene
|
|
H2AFX
|
H2A histone family, member X gene
|
|
HIST1H2AL
|
histone H2A type 1 gene
|
|
HIST1H2BK
|
histone H2B type 1-K gene
|
|
HIST1H3J
|
histone H3J gene
|
|
HIST1H4B
|
histone H4B gene
|
|
HIST2H2BE
|
histone H2B type 2-E gene
|
|
HUGO
|
Human Genome Organization
|
|
KM
|
Kaplan-Meier survival curve
|
|
LGG
|
low-grade glioma
|
|
MAPT
|
microtubule-associated protein Tau
|
|
SKCM
|
skin cutaneous melanoma
|
|
SNCA
|
α-synuclein gene
|
|
SPSS
|
IBM Statistical Package for the Social
Sciences
|
|
TCGA
|
The Cancer Genome Atlas
|
References
|
1
|
Spillantini MG and Goedert M: Tau
pathology and neurodegeneration. Lancet Neurol. 12:609–622. 2013.
View Article : Google Scholar : PubMed/NCBI
|
|
2
|
Ikeda K, Akiyama H, Arai T and Nishimura
T: Glial tau pathology in neurodegenerative diseases: Their nature
and comparison with neuronal tangles. Neurobiol Aging. 19
Suppl:S85–S91. 1998. View Article : Google Scholar : PubMed/NCBI
|
|
3
|
Hartmann C, Hentschel B, Tatagiba M,
Schramm J, Schnell O, Seidel C, Stein R, Reifenberger G, Pietsch T,
von Deimling A, et al: Molecular markers in low-grade gliomas:
predictive or prognostic? Clin Cancer Res. 17:4588–4599. 2011.
View Article : Google Scholar : PubMed/NCBI
|
|
4
|
Claus EB, Walsh KM, Wiencke JK, Molinaro
AM, Wiemels JL, Schildkraut JM, Bondy ML, Berger M, Jenkins R and
Wrensch M: Survival and low-grade glioma: The emergence of genetic
information. Neurosurg Focus. 38:E62015. View Article : Google Scholar : PubMed/NCBI
|
|
5
|
Colodner KJ and Feany MB: Glial fibrillary
tangles and JAK/STAT-mediated glial and neuronal cell death in a
Drosophila model of glial tauopathy. J Neurosci.
30:16102–16113. 2010. View Article : Google Scholar : PubMed/NCBI
|
|
6
|
Li ZH, Xiong QY, Tu JH, Gong Y, Qiu W,
Zhang HQ, Wei WS, Hou YF and Cui WQ: Tau proteins expressions in
advanced breast cancer and its significance in taxane-containing
neoadjuvant chemotherapy. Med Oncol. 30:5912013. View Article : Google Scholar : PubMed/NCBI
|
|
7
|
Koo DH, Lee HJ, Ahn JH, Yoon DH, Kim SB,
Gong G, Son BH, Ahn SH and Jung KH: Tau and PTEN status as
predictive markers for response to trastuzumab and paclitaxel in
patients with HER2-positive breast cancer. Tumour Biol.
36:5865–5871. 2015. View Article : Google Scholar : PubMed/NCBI
|
|
8
|
Wang K, Deng QT, Liao N, Zhang GC, Liu YH,
Xu FP, Zu J, Li XR and Wu YL: Tau expression correlated with breast
cancer sensitivity to taxanes-based neoadjuvant chemotherapy.
Tumour Biol. 34:33–38. 2013. View Article : Google Scholar : PubMed/NCBI
|
|
9
|
Zhou J, Qian S, Li H, He W, Tan X, Zhang
Q, Han G, Chen G and Luo R: Predictive value of
microtubule-associated protein Tau in patients with recurrent and
metastatic breast cancer treated with taxane-containing palliative
chemotherapy. Tumour Biol. 36:3941–3947. 2015. View Article : Google Scholar : PubMed/NCBI
|
|
10
|
Grossman RL, Heath AP, Ferretti V, Varmus
HE, Lowy DR, Kibbe WA and Staudt LM: Toward a shared vision for
cancer cenomic data. N Engl J Med. 375:1109–1112. 2016. View Article : Google Scholar : PubMed/NCBI
|
|
11
|
Gao J, Aksoy BA, Dogrusoz U, Dresdner G,
Gross B, Sumer SO, Sun Y, Jacobsen A, Sinha R, Larsson E, et al:
Integrative analysis of complex cancer genomics and clinical
profiles using the cBioPortal. Sci Signal. 6:pl12013. View Article : Google Scholar : PubMed/NCBI
|
|
12
|
Ping Z, Siegal GP, Almeida JS, Schnitt SJ
and Shen D: Mining genome sequencing data to identify the genomic
features linked to breast cancer histopathology. J Pathol Inform.
5:32014. View Article : Google Scholar : PubMed/NCBI
|
|
13
|
Mauro JA and Blanck G: Functionally
distinct gene classes as bigger or smaller transcription factor
traps: A possible stochastic component to sequential gene
expression programs in cancer. Gene. 536:398–406. 2014. View Article : Google Scholar : PubMed/NCBI
|
|
14
|
Frost B, Götz J and Feany MB: Connecting
the dots between tau dysfunction and neurodegeneration. Trends Cell
Biol. 25:46–53. 2015. View Article : Google Scholar : PubMed/NCBI
|
|
15
|
Iijima-Ando K, Zhao L, Gatt A, Shenton C
and Iijima K: A DNA damage-activated checkpoint kinase
phosphorylates tau and enhances tau-induced neurodegeneration. Hum
Mol Genet. 19:1930–1938. 2010. View Article : Google Scholar : PubMed/NCBI
|
|
16
|
Khurana V, Merlo P, DuBoff B, Fulga TA,
Sharp KA, Campbell SD, Götz J and Feany MB: A neuroprotective role
for the DNA damage checkpoint in tauopathy. Aging Cell. 11:360–362.
2012. View Article : Google Scholar : PubMed/NCBI
|
|
17
|
Kruman II, Wersto RP, Cardozo-Pelaez F,
Smilenov L, Chan SL, Chrest FJ, Emokpae R Jr, Gorospe M and Mattson
MP: Cell cycle activation linked to neuronal cell death initiated
by DNA damage. Neuron. 41:549–561. 2004. View Article : Google Scholar : PubMed/NCBI
|
|
18
|
Silva AR, Santos AC, Farfel JM, Grinberg
LT, Ferretti RE, Campos AH, Cunha IW, Begnami MD, Rocha RM, Carraro
DM, et al: Repair of oxidative DNA damage, cell-cycle regulation
and neuronal death may influence the clinical manifestation of
Alzheimer's disease. PLoS One. 9:e998972014. View Article : Google Scholar : PubMed/NCBI
|
|
19
|
Simpson JE, Ince PG, Matthews FE, Shaw PJ,
Heath PR, Brayne C, Garwood C, Higginbottom A and Wharton SB:
Function MRCC; MRC Cognitive Function and Ageing Neuropathology
Study Group: A neuronal DNA damage response is detected at the
earliest stages of Alzheimer's neuropathology and correlates with
cognitive impairment in the Medical Research Council's Cognitive
Function and Ageing Study ageing brain cohort. Neuropathol Appl
Neurobiol. 41:483–496. 2015. View Article : Google Scholar : PubMed/NCBI
|
|
20
|
Nishimura M, Tomimoto H, Suenaga T, Namba
Y, Ikeda K, Akiguchi I and Kimura J: Immunocytochemical
characterization of glial fibrillary tangles in Alzheimer's disease
brain. Am J Pathol. 146:1052–1058. 1995.PubMed/NCBI
|
|
21
|
Ferrer I, López-González I, Carmona M,
Arregui L, Dalfó E, Torrejón-Escribano B, Diehl R and Kovacs GG:
Glial and neuronal tau pathology in tauopathies: Characterization
of disease-specific phenotypes and tau pathology progression. J
Neuropathol Exp Neurol. 73:81–97. 2014. View Article : Google Scholar : PubMed/NCBI
|
|
22
|
Arai T, Ikeda K, Akiyama H, Shikamoto Y,
Tsuchiya K, Yagishita S, Beach T, Rogers J, Schwab C and McGeer PL:
Distinct isoforms of tau aggregated in neurons and glial cells in
brains of patients with Pick's disease, corticobasal degeneration
and progressive supranuclear palsy. Acta Neuropathol. 101:167–173.
2001.PubMed/NCBI
|
|
23
|
Harada A, Oguchi K, Okabe S, Kuno J,
Terada S, Ohshima T, Sato-Yoshitake R, Takei Y, Noda T and Hirokawa
N: Altered microtubule organization in small-calibre axons of mice
lacking tau protein. Nature. 369:488–491. 1994. View Article : Google Scholar : PubMed/NCBI
|
|
24
|
Mandelkow E and Mandelkow EM: Microtubules
and microtubule-associated proteins. Curr Opin Cell Biol. 7:72–81.
1995. View Article : Google Scholar : PubMed/NCBI
|