Introduction
Thymic epithelial neoplasms are uncommon thymic
neoplasms that arise from epithelial cells of the thymus; they are
the most frequent type of anterior mediastinal tumors in adults
(1). Thymic epithelial neoplasms
are divided into thymomas, thymic carcinomas and thymic
neuroendocrine tumors (2). In
clinical practice, different classifications have been proposed and
used. The latest histological classification released in 2015 by
the World Health Organization (WHO) suggested two main thymoma
types; types A and B. More specifically, thymomas can be classified
into five histological types (A, AB, B1, B2 and B3) based on the
morphology of epithelial cells and the lymphocyte to epithelial
cell ratio (3). Traditionally, the
most commonly used classifications are the Masaoka and Masaoka-Koga
staging systems (4). Thymomas are
known to be associated with a variety of immunological diseases
(5). Myasthenia gravis (MG) is the
most frequent syndrome accompanying thymomas and occurs in 15–20%
thymoma patients (6,7).
The etiology and molecular pathogenesis of thymoma
has not yet been elucidated. There are various mechanisms by which
the pathogenesis of thymoma occurs, including epigenetic
alterations, which are a hallmark of cancer due to their role in
carcinogenesis initiation (8,9).
Recent evidence has indicated that miR-145-5p is an important
epigenetic regulation factor that may be involved in tumor
progression and treatment response in thymic epithelial tumors
(10). A set of prognostic and
subtype-specific potential miRNAs have been identified in thymoma
(11). A large miRNA cluster on
chr19q13.42 was revealed as a transcriptional hallmark of type A
and AB thymomas (12). Previous
research has also provided evidence that DNA hypermethylation in
promoter regions and global DNA hypomethylation serve an important
role in the tumorigenesis of thymic epithelial tumors (13,14).
Specific DNA methylation aberrations, which are associated with
different thymic epithelial tumor histotypes or thymomas
accompanied by MG, have previously been identified (15,16).
However, the function of aberrant DNA methylation in thymomas is
less clear. The specific DNA methylation aberrations in thymoma vs.
control, type A vs. type B thymomas and MG- vs. non-MG-thymomas
remains largely unknown.
Therefore, an array-based approach was used to
uncover genome-wide DNA methylation profiles in fresh frozen
thymoma and adjacent normal tissues in the present study. Following
differential methylation analysis, a set of differentially
methylated CpGs (DMCs) was identified. Furthermore, functional
annotation analysis was performed on the corresponding
differentially methylated genes. The present study may provide
valuable insights into the epigenetic regulation of DNA methylation
in thymoma and different thymoma subtypes.
Materials and methods
Study participants
For the genome-wide methylation analysis, eight
patients with thymoma or atypical thymic carcinoid undergoing
sternotomy were recruited at Peking Union Medical College Hospital
(Beijing, China) between October 2014 and July 2015. The patients'
age range was 26–80 years (mean age, 49 years; 1:1 male:female).
WHO histological subtypes were recorded as follows: Atypical type A
(n=1), type A (n=1), type AB (n=1), type B1 (n=1), type B2 (n=1),
type B3 (n=2) and atypical thymic carcinoid (n=1). Atypical thymic
carcinoid is an extremely rare thymic neuroendocrine tumor derived
from the neuroendocrine system (17). In total, 16 paired surgically
resected tumor and adjacent normal tissue samples were collected
and stored at −80°C until DNA extraction. Written informed consent
was provided by all participants. The present study was approved by
the Ethics Committee of Peking Union Medical College Hospital
(Beijing, China) and was performed in compliance with the
Declaration of Helsinki. Patient demographics and clinical
characteristics are presented in Table
I.
 | Table I.Clinicopathological variables of
thymoma patients used for methylation analysis. |
Table I.
Clinicopathological variables of
thymoma patients used for methylation analysis.
| ID | Sex | Age | Myasthenia
gravis | WHO histological
classification | Masaoka stage | Adjuvant
treatment |
|---|
| 1 | Male | 36 | No | Atypical type
A | I | No |
| 2 | Female | 52 | Yes | Type A | I | No |
| 3 | Male | 48 | No | Type AB | 2B | No |
| 4 | Female | 47 | No | Type B1 | I | No |
| 5 | Male | 33 | Yes | Type B2 | I | No |
| 6 | Male | 30 | Yes | Type B3 | − | No |
| 7 | Male | 80 | No | Type B3 | G3 | Yes |
| 8 | Female | 26 | No | Atypical thymic
carcinoid | G3 | No |
DNA isolation and bisulfite
treatment
Genomic DNA was obtained from both the surgically
resected tumor and adjacent normal tissue using the TIANamp Genomic
DNA kit (Tiangen Biotech, Co., Ltd., Beijing, China) according to
the manufacturer's instructions. The concentration of extracted DNA
was measured using a NanoDrop 2000 spectrophotometer (Thermo Fisher
Scientific, Inc., Waltham, MA, USA). The quality of extracted DNA
was checked in 0.8% agarose gel electrophoresis. Only samples with
a purity of 1.8–2.05 were selected for the microarray study. In
total, four DNA samples were excluded from further analysis due to
poor quality. Finally, DNA samples from six tumors (1T, 2T, 4T, 6T,
7T and 8T) and six normal tissues (2N, 3N, 4N, 5N, 6N and 7N) were
maintained for downstream analysis. Genomic DNA (200–500 ng) from
each sample was chemically modified and bisulfite-converted using
the EZ DNA Methylation kit (Zymo Research Corp., Irvine, CA, USA)
according to the manufacturer's instructions, which converts
unmethylated cytosines into uracil. Methylated cytosines remained
unchanged during treatment.
Illumina 850K methylation
microarray
Following bisulfite treatment, the DNA methylation
status of case and control subjects was assayed using the recently
developed Infinium MethylationEPIC BeadChip microarray from
Illumina, Inc. (San Diego, CA, USA) according to the manufacturer's
instructions, which measured the methylation status of 853,307 CpG
sites distributed over the whole genome. The image intensities were
extracted using the Illumina iScan system (Illumina, Inc.) and
quality-controlled using RnBeads (version 3.5) (18) in R (www.r-project.org/).
Microarray data preprocessing
The Illumina iScan system was used for image and
data analysis of the BeadChips. The raw (.idat) files obtained from
the methylation microarray were then transferred to the RnBeads
software and a quality check of the raw data of each probe analysis
was performed, including background correction, adjustment of probe
type differences and probe exclusion. The single nucleotide
polymorphism-associated probes were filtered, while those
corresponding to the sex chromosomes were not. To avoid batch
effect, all samples were processed together. Following these
intra-sample normalization procedures, DNA methylation was scored
as a β value, ranging from 0 (no methylation) to 1 (100%
methylation). Unsupervised hierarchical clustering was then
performed with Euclidian distance and complete linkage.
Searching for DMCs
To identify DMCs, the average β value was compared
between the groups of interest (thymoma tumor tissues vs. adjacent
normal tissue; type A vs. type B thymoma; MG- vs. non-MG-thymoma).
Briefly, the CpGs were considered DMCs at an average DNA
methylation differences (Δβ) between two groups of >0.2. The
DMCs for each comparison were determined, following which DMCs were
annotated with respect to defined CpG islands (CGIs), shores,
shelves and relative to RefSeq genes 3′ untranslated region (UTR),
gene body, exon 1, 5′UTR, transcription start site (TSS)1500,
TSS200 and intergenic, according to the Infinium MethylationEPIC
Microarray annotation file (www.illumina.com).
Expression data of thymomas
Gene expression data of thymomas (GSE29695)
(19) were downloaded from the
public data repository of Gene Expression Omnibus (GEO; www.ncbi.nlm.nih.gov/gds) (20). These expression data were obtained
from 36 patients with thymomas, divided into two main groups: Type
A (1 type A and 9 type AB) and B thymomas (20 type B1-B2 and 6 type
B3). Genes with a poor signal quality across a maximal number of
arrays were removed. As a result, 6,486 genes were found to have
signals significantly above background. The raw data were
quantile-normalized and log2-transformed prior to statistical
analysis. Differential expression analysis was performed between
type A and B thymomas. Statistical analysis was performed using
Wilcoxon rank-sum tests. P-values were further corrected for false
discovery by applying the Benjamini-Hochberg procedure. The genes
were defined as differentially expressed genes (DEGs) at
P<0.05.
Functional annotation analysis of
differentially methylated genes
Once DMCs were annotated to the genes, those that
showed significant differences in DNA methylation between different
groups underwent functional annotation analysis, using the online
GeneCodis3 tool (genecodis.cnb.csic.es/analysis) (21). Gene Ontology (GO) enrichment
analysis was performed to classify the differentially methylated
genes into categories of cellular component, biological process and
molecular function (22). In
addition, the Kyoto Encyclopedia of Genes and Genomes (KEGG)
pathway enrichment analysis was performed to detect the potential
pathways of the differentially methylated genes (23).
Receiver operating characteristic
(ROC) analysis
In order to assess the diagnostic value of candidate
DNA methylation markers, ROC analysis was performed using the pROC
package (24) in R. The area under
the curve (AUC) was then calculated to assess the performance of
each DNA methylation marker.
Results
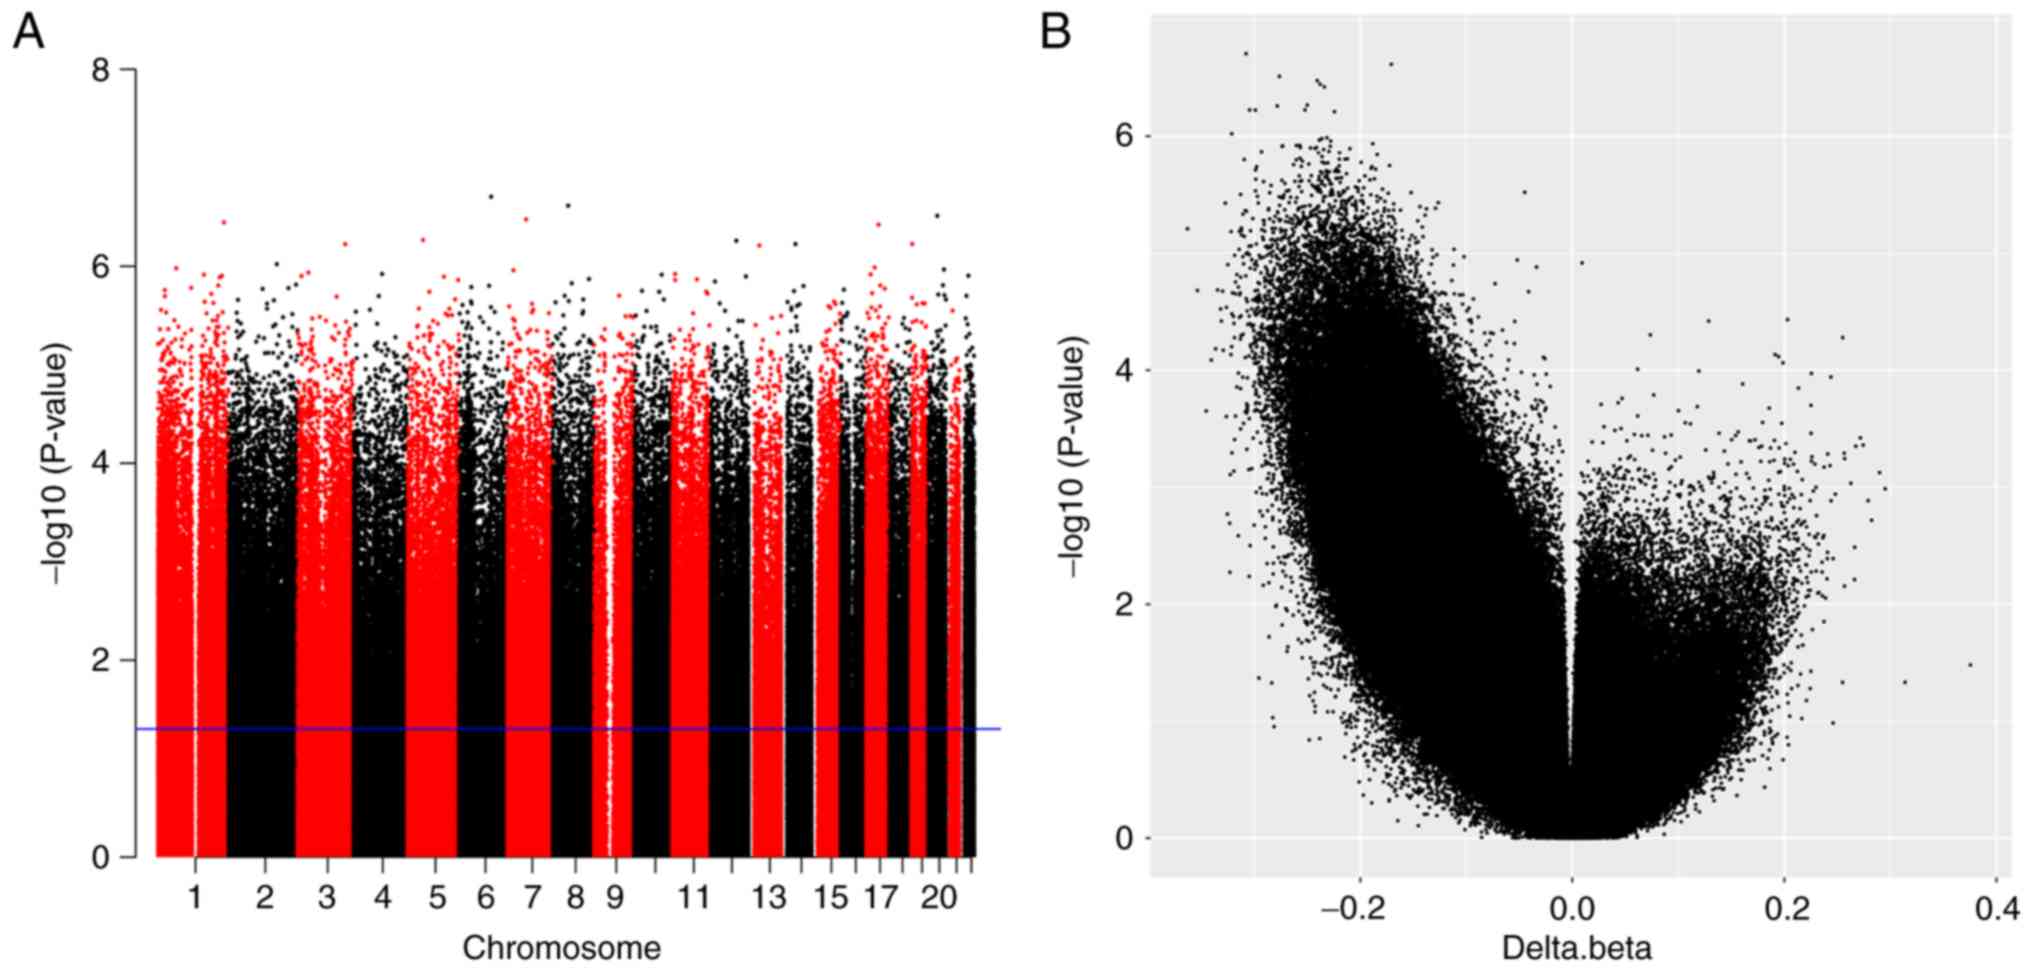
Illumina 850K methylation microarray
of subjects
In total, eight paired tumor samples and
corresponding adjacent normal tissues were evaluated. The qualified
DNA of six tumor (1T, 2T, 4T, 6T, 7T and 8T) and six normal (2N,
3N, 4N, 5N, 6N and 7N) tissues was used for genome-wide DNA
methylation profiling using the Illumina 850K methylation
microarray. A Manhattan plot was produced to display P-values that
were generated by the-log10 (P-value) function for each CpG site
(Fig. 1A). In addition, a volcano
plot of CpG sites was constructed using Δβ and P-value,
representing the methylation difference between tumors and controls
by magnitude of change and statistical significance (Fig. 1B).
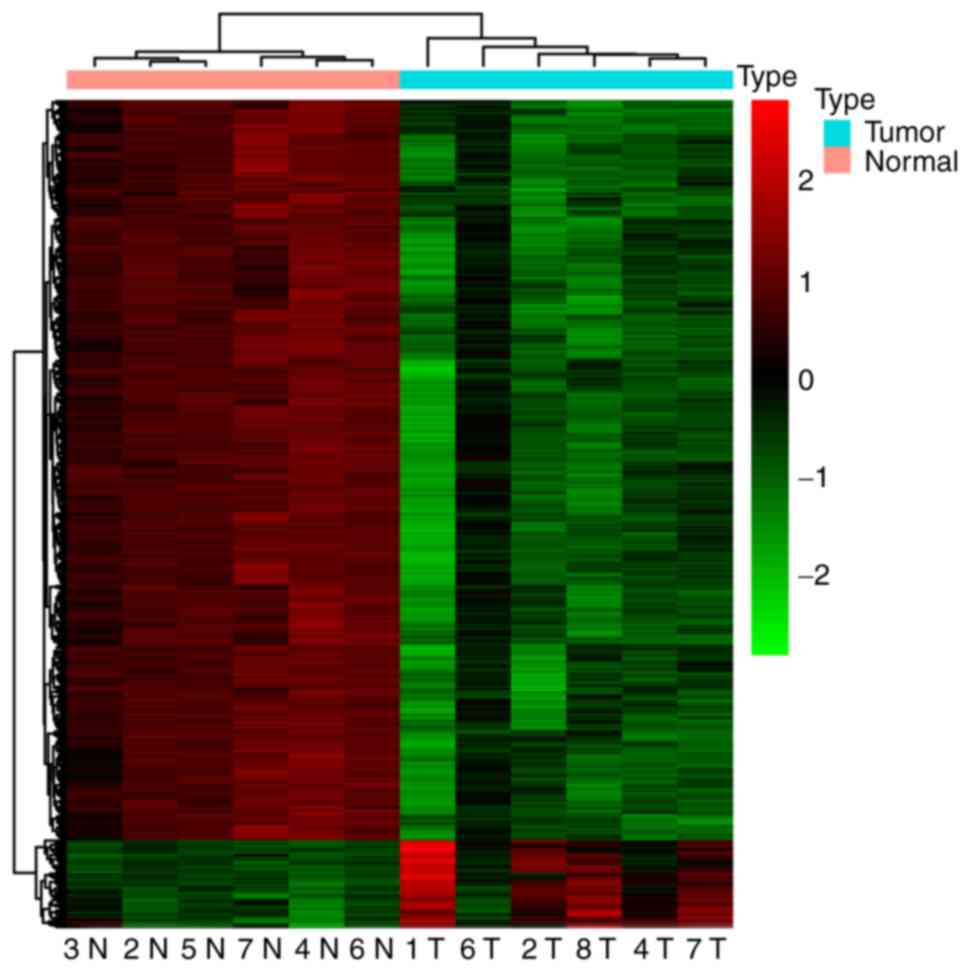
Identification of DMCs between tumor
and control samples
In order to analyze DNA methylation differences
between tumor and control samples, the average β values between the
groups were examined. A total of 19,118 probes were found to be
significantly differentially methylated (Δβ>0.2 and adjusted
P<0.05), including 119 hypermethylated and 18,999 hypomethylated
DMCs. Overall, there was a general decrease in tumor methylation,
compared with the control. An unsupervised hierarchical clustering
was performed and a heat map of the top 1,000 hypomethylated DMCs
and all 119 hypermethylated DMCs was produced (Fig. 2). The heat map showed two robust DNA
methylation clusters: One encompassing all tumors and another
containing all controls. This indicated that tumors and controls
had different DNA methylation characters and patterns.
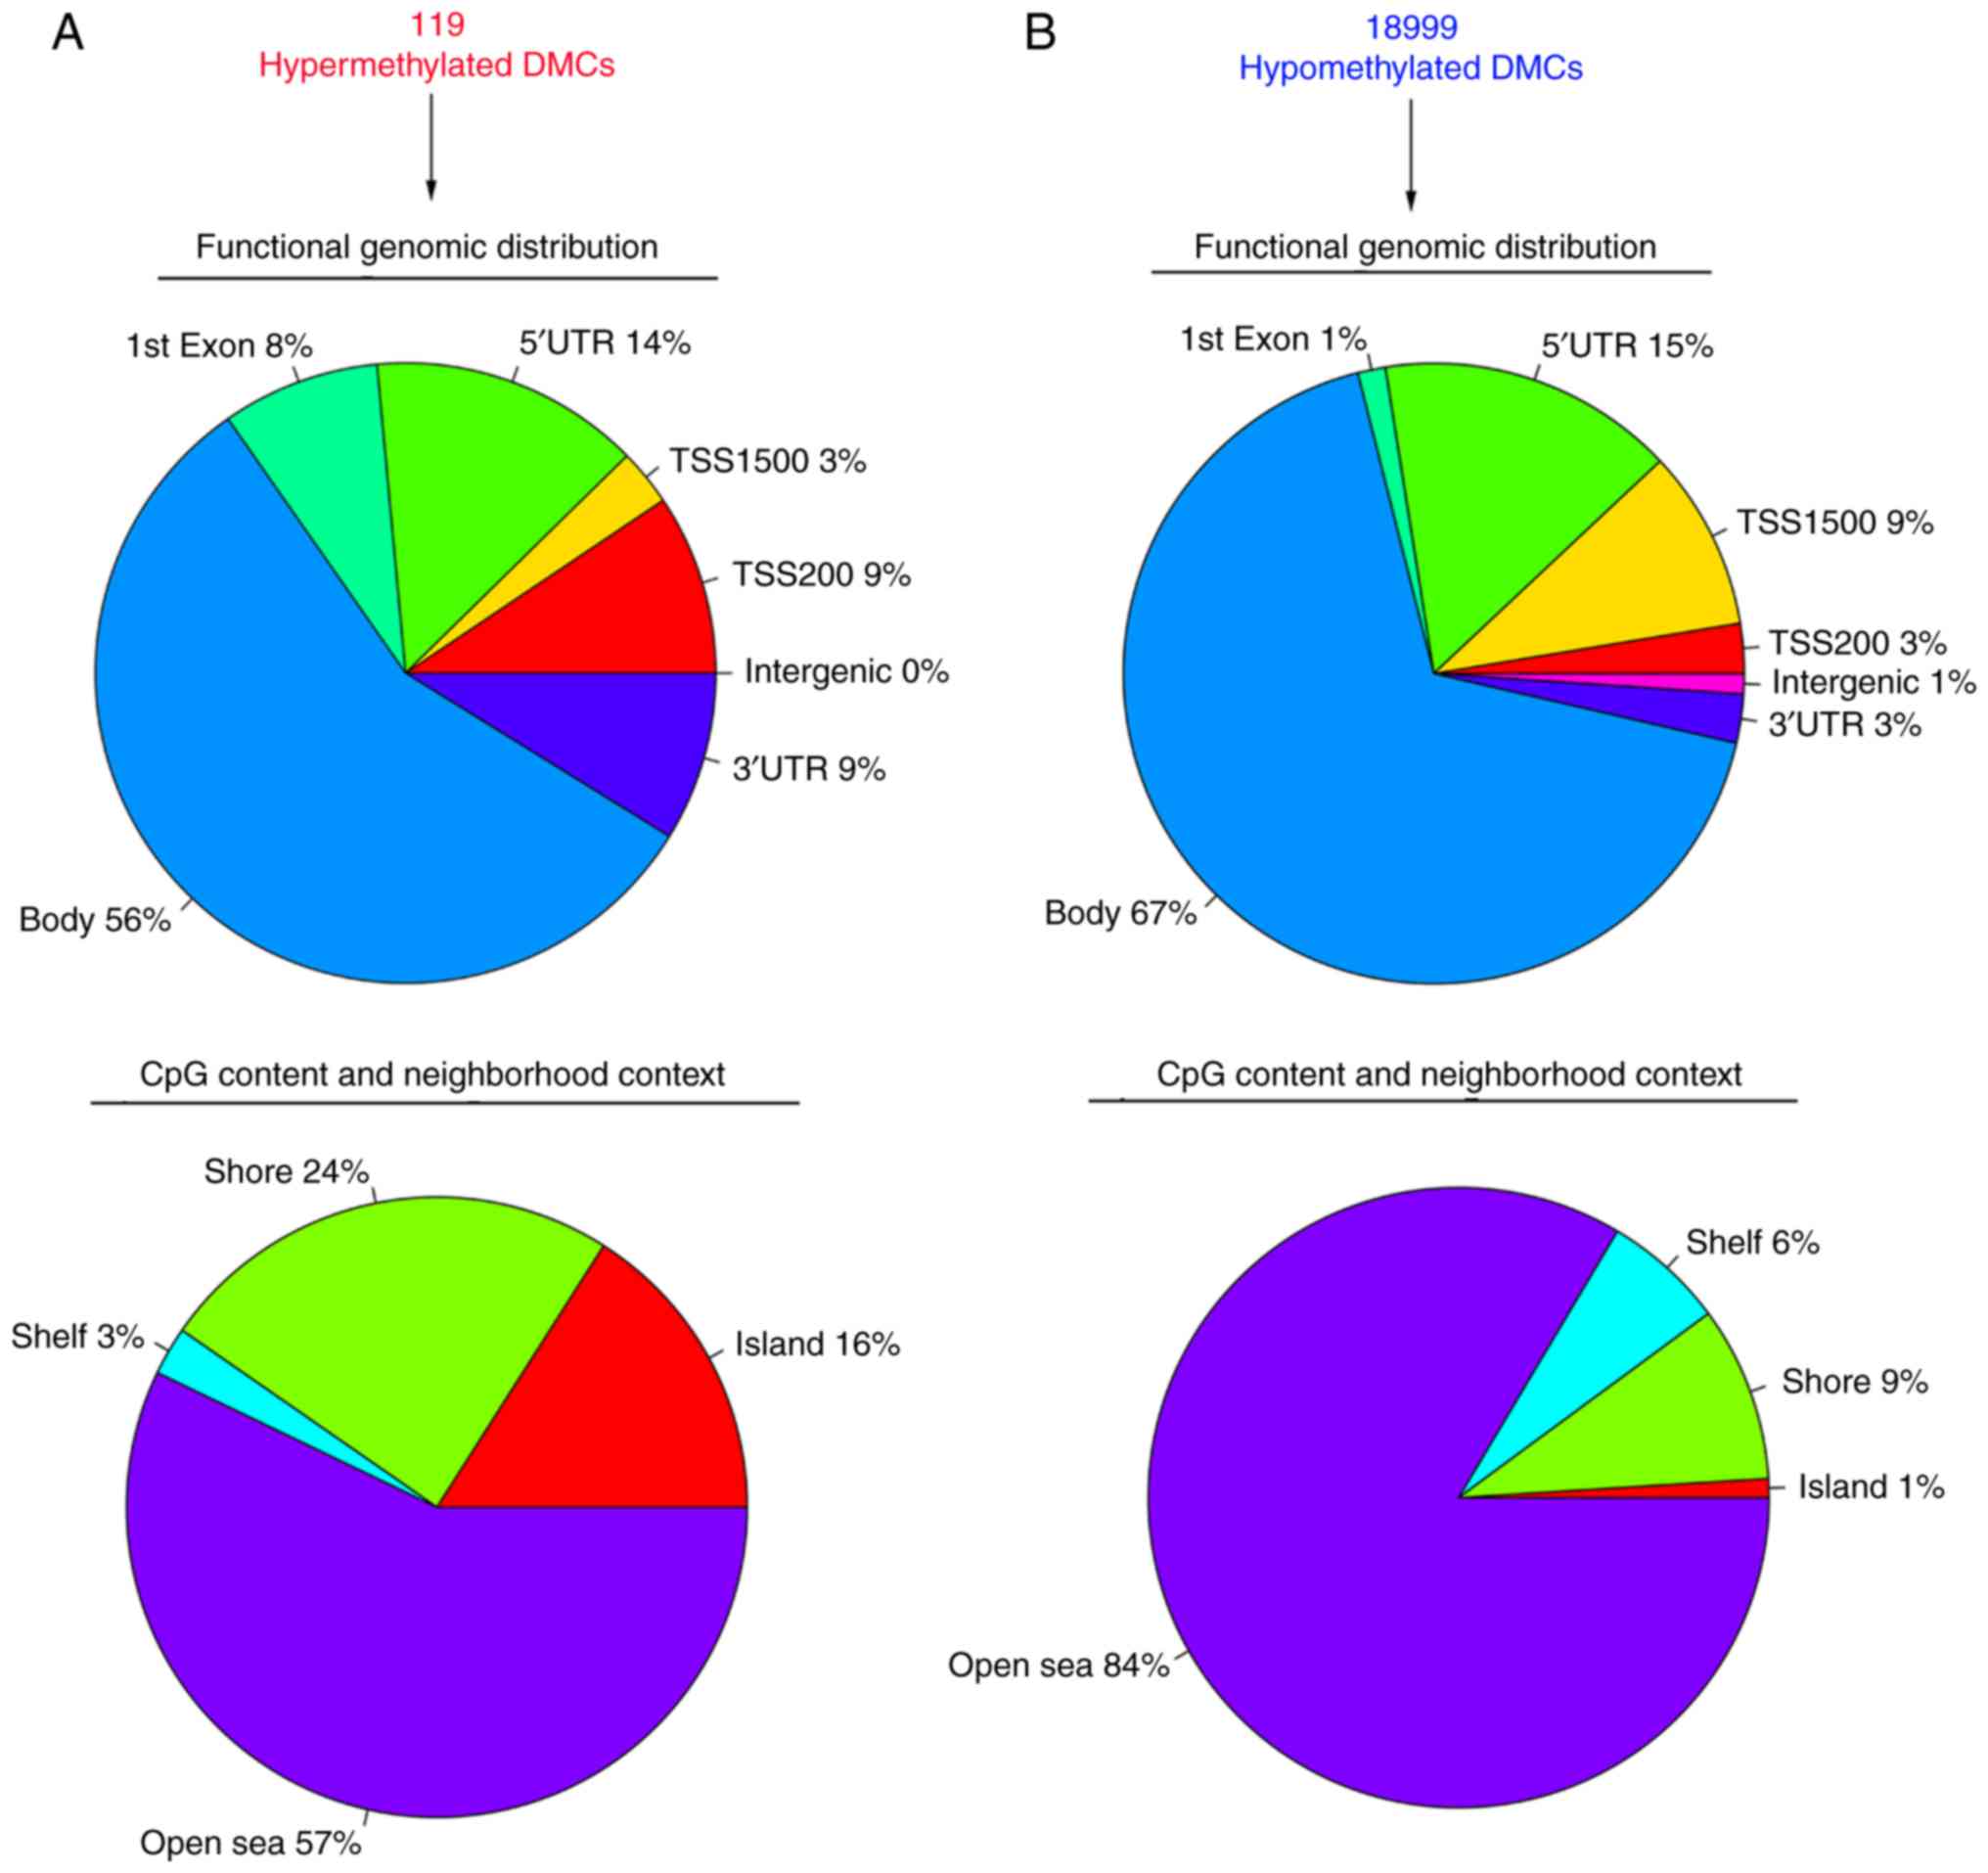
Genomic features of DMCs between
tumors and controls
The methylation categories of DMCs were analyzed in
relation to genomic locations. Significant differences were
observed between the hypo- and hypermethylated DMCs according to
the functional genomic distribution, as well as the CpG content and
neighborhood context (Fig. 3).
Of the 119 significantly hypermethylated DMCs, 9%
were located in the 3′UTR region, 56% in the gene body, 8% in exon
1, 14% in the 5′UTR, 3% in TSS1500, 9% in TSS200 and none in
intergenic region (Fig. 3A). Of the
annotated significantly hypermethylated DMCs, 16% belonged to the
CGI, 24% to the shore area, 3% to the shelf area, and the remaining
57% to the open sea area (Fig.
3A).
In contrast to hypermethylation, 3% of the 18,999
significantly hypomethylated DMCs were located in the 3′UTR region,
67% in the gene body, 1% in exon 1, 15% in the 5′UTR, 9% in the
TSS1500, 3% in the TSS200, and the remaining 1% in intergenic
region (Fig. 3B). With regard to
CpG content and neighborhood context, 84% belonged to the open sea
area of the genome, 9% to the shore area, 6% to the shelf area and
1% to the CGI (Fig. 3B).
Functional annotation of
differentially methylated genes between tumor and controls
Of the 119 significantly hypermethylated DMCs, 81
DMCs represented 72 genes. Functional annotation of the 72 genes
indicated that the most significantly enriched pathway was ‘natural
killer cell mediated cytotoxicity’, as shown in Table II.
| Table II.KEGG pathway enrichment analysis for
the 72 hypermethylated genes and 6,202 hypomethylated genes between
tumor and control. |
Table II.
KEGG pathway enrichment analysis for
the 72 hypermethylated genes and 6,202 hypomethylated genes between
tumor and control.
| A, KEGG pathway for
hypermethylated genes |
|---|
|
|---|
| ID | Items | FDR |
|---|
|
|---|
| hsa04650 | Natural killer cell
mediated cytotoxicity | 0.006166 |
|---|
|
|---|
| B, KEGG pathway for
hypomethylated genes |
|---|
|
|---|
| ID | Items | FDR |
|---|
| hsa05200 | Pathways in
cancer |
1.03×10⁻²³ |
| hsa04510 | Focal adhesion |
1.80×10⁻²³ |
| hsa04810 | Regulation of actin
cytoskeleton |
1.07×10⁻²² |
| hsa04360 | Axon guidance |
1.12×10⁻¹⁶ |
| hsa04020 | Calcium signaling
pathway |
1.18×10⁻¹⁶ |
| hsa04514 | Cell adhesion
molecules (CAMs) |
4.80×10⁻¹⁶ |
| hsa04724 | Glutamatergic
synapse |
6.56×10⁻¹⁵ |
| hsa05412 | Arrhythmogenic
right ventricular cardiomyopathy (ARVC) |
6.29×10⁻¹³ |
| hsa05146 | Amoebiasis |
1.92×10⁻¹² |
| hsa04070 |
Phosphatidylinositol signaling system |
2.85×10⁻¹² |
| hsa04530 | Tight junction |
4.58×10⁻¹² |
| hsa04520 | Adherens
junction |
5.38×10⁻¹² |
| hsa04971 | Gastric acid
secretion |
5.19×10⁻¹¹ |
| hsa04060 | Cytokine-cytokine
receptor interaction |
5.45×10⁻¹¹ |
| hsa04080 | Neuroactive
ligand-receptor interaction |
1.40×10⁻¹⁰ |
| hsa05410 | Hypertrophic
cardiomyopathy (HCM) |
2.06×10⁻¹⁰ |
| hsa04730 | Long-term
depression |
2.68×10⁻¹⁰ |
| hsa04512 | ECM-receptor
interaction |
4.27×10⁻¹⁰ |
| hsa05222 | Small cell lung
cancer |
4.27×10⁻¹⁰ |
| hsa04970 | Salivary
secretion |
6.28×10⁻¹⁰ |
| hsa04144 | Endocytosis |
6.91×10⁻¹⁰ |
| hsa05414 | Dilated
cardiomyopathy |
7.09×10⁻¹⁰ |
| hsa04270 | Vascular smooth
muscle contraction |
1.15×10⁻⁹ |
| hsa04380 | Osteoclast
differentiation |
1.68×10⁻⁹ |
| hsa05215 | Prostate
cancer |
1.76×10⁻⁹ |
| hsa04010 | MAPK signaling
pathway |
2.65×10⁻⁹ |
| hsa04910 | Insulin signaling
pathway |
3.76×10⁻⁹ |
| hsa04972 | Pancreatic
secretion |
4.18×10⁻⁹ |
| hsa04666 | Fc gamma R-mediated
phagocytosis |
7.21×10⁻⁹ |
| hsa04662 | B cell receptor
signaling pathway |
1.26×10⁻⁸ |
In addition, 10,953 of the 18,999 significantly
hypomethylated DMCs represented 6,202 genes. To obtain further
insight into pathways targeted by the hypomethylated DMCs, further
functional annotation was performed. ‘Pathways in cancer’, ‘focal
adhesion’, ‘regulation of actin cytoskeleton’, ‘axon guidance’,
‘calcium signaling pathway’ and ‘cell adhesion molecules (CAMs)’
were the most enriched KEGG pathways (Table II).
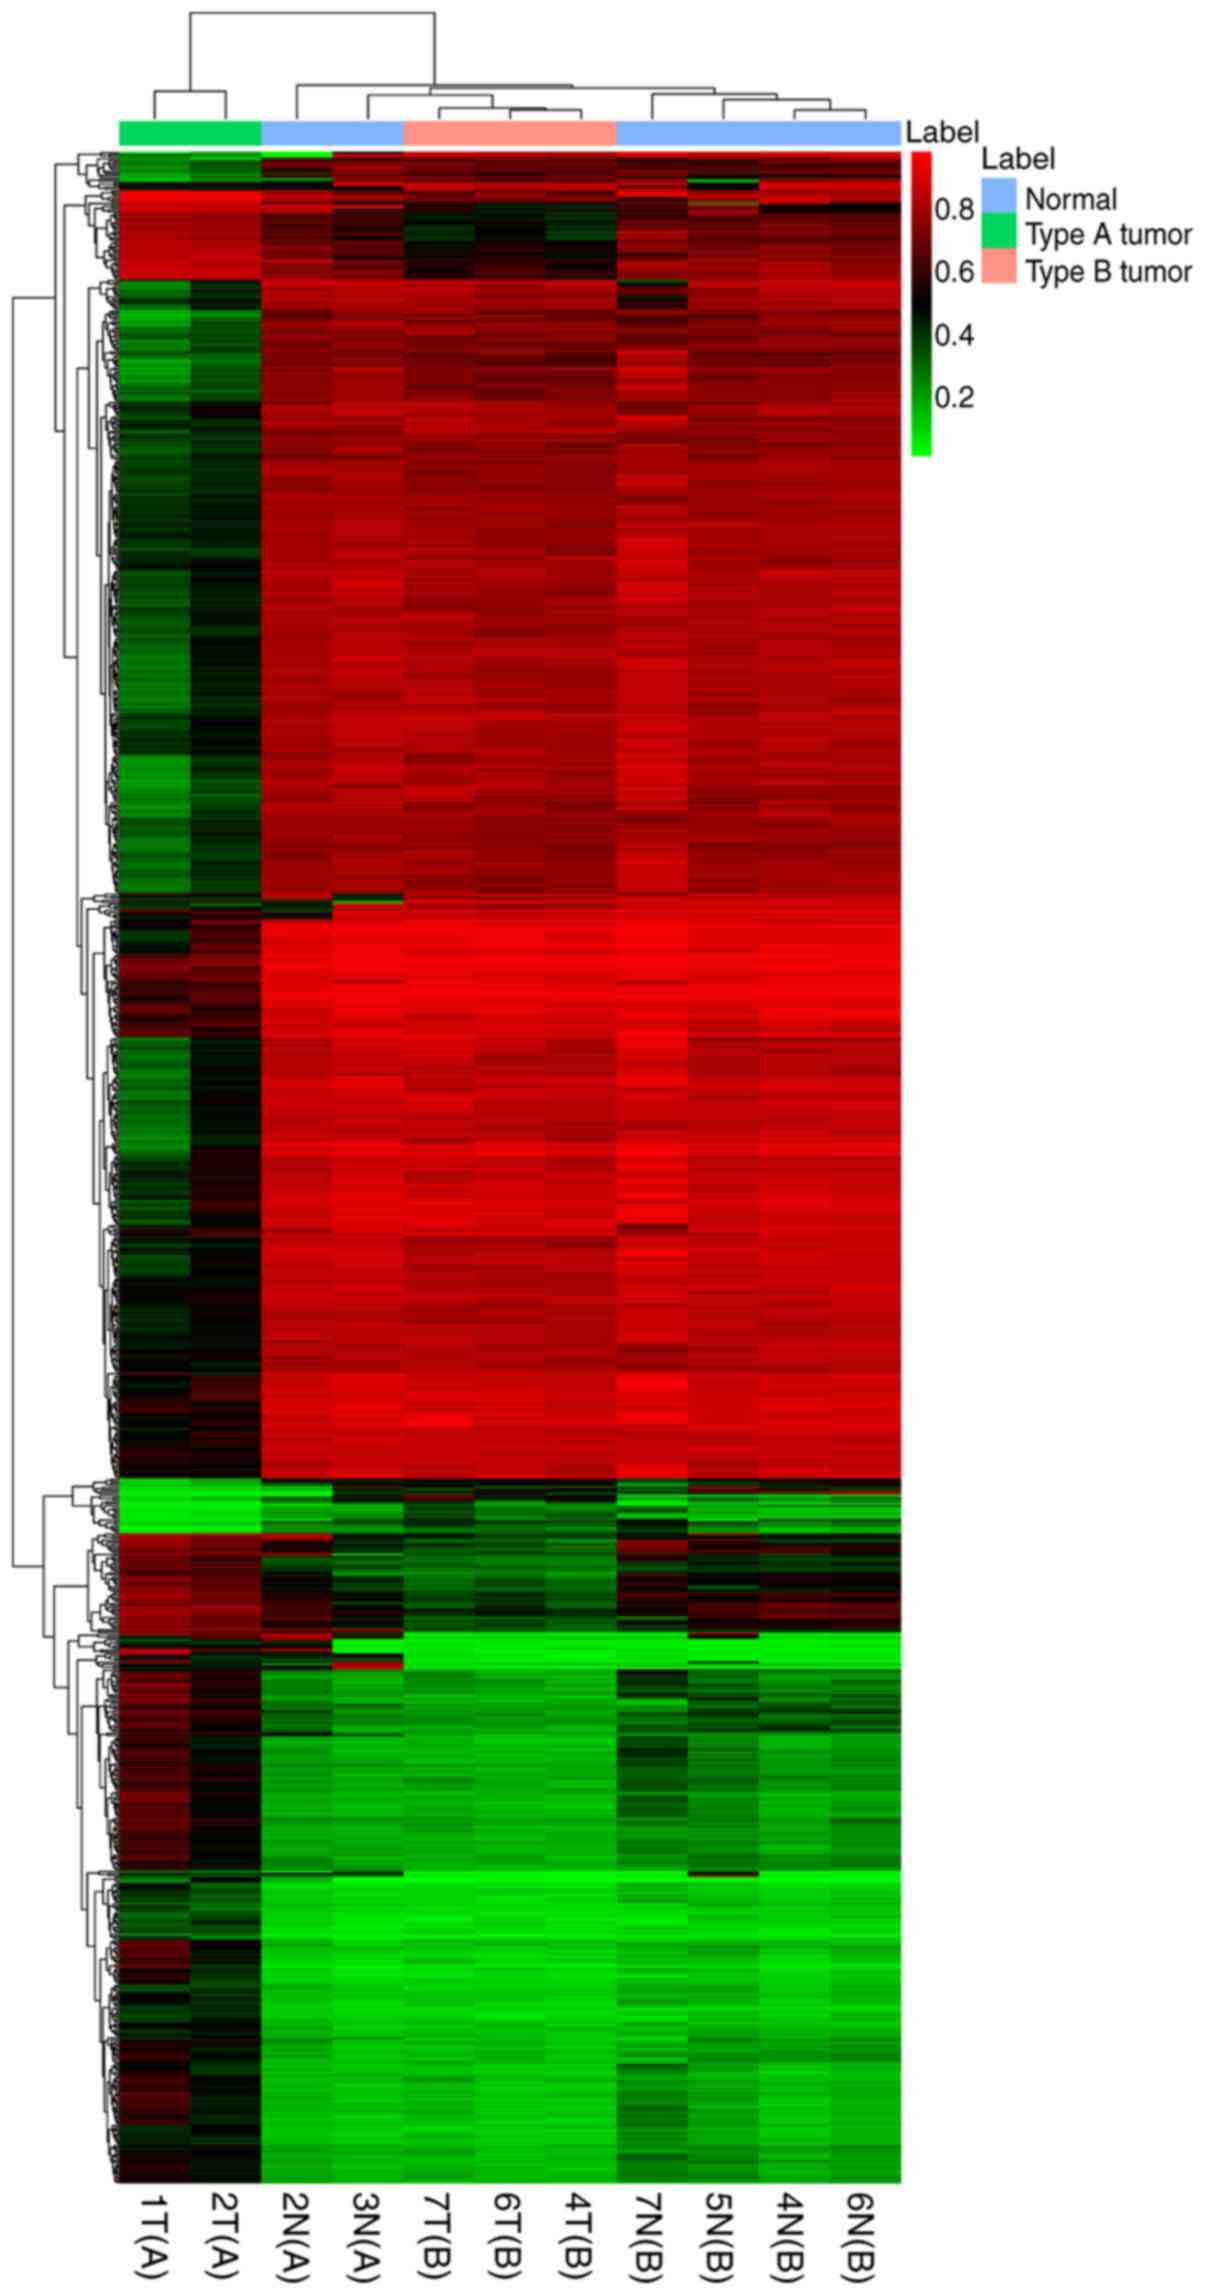
Identification of DMCs between type A
and B thymomas
The DNA methylation profiling of two type A (1T and
2T) and three type B (4T, 6T and 7T) thymomas was obtained using
the Illumina 850K methylation microarray. In total, 10,014 CpGs
were differentially methylated at Δβ>0.2 and P<0.001 between
type A and B thymoma subjects, which consisted of 3,998
hypermethylated and 6,016 hypomethylated DMCs. The top 1,000 DMCs
were used for unsupervised hierarchical clustering. The results
indicated that DNA methylation profiling of type A was
significantly distinguished from that of type B thymoma (Fig. 4).
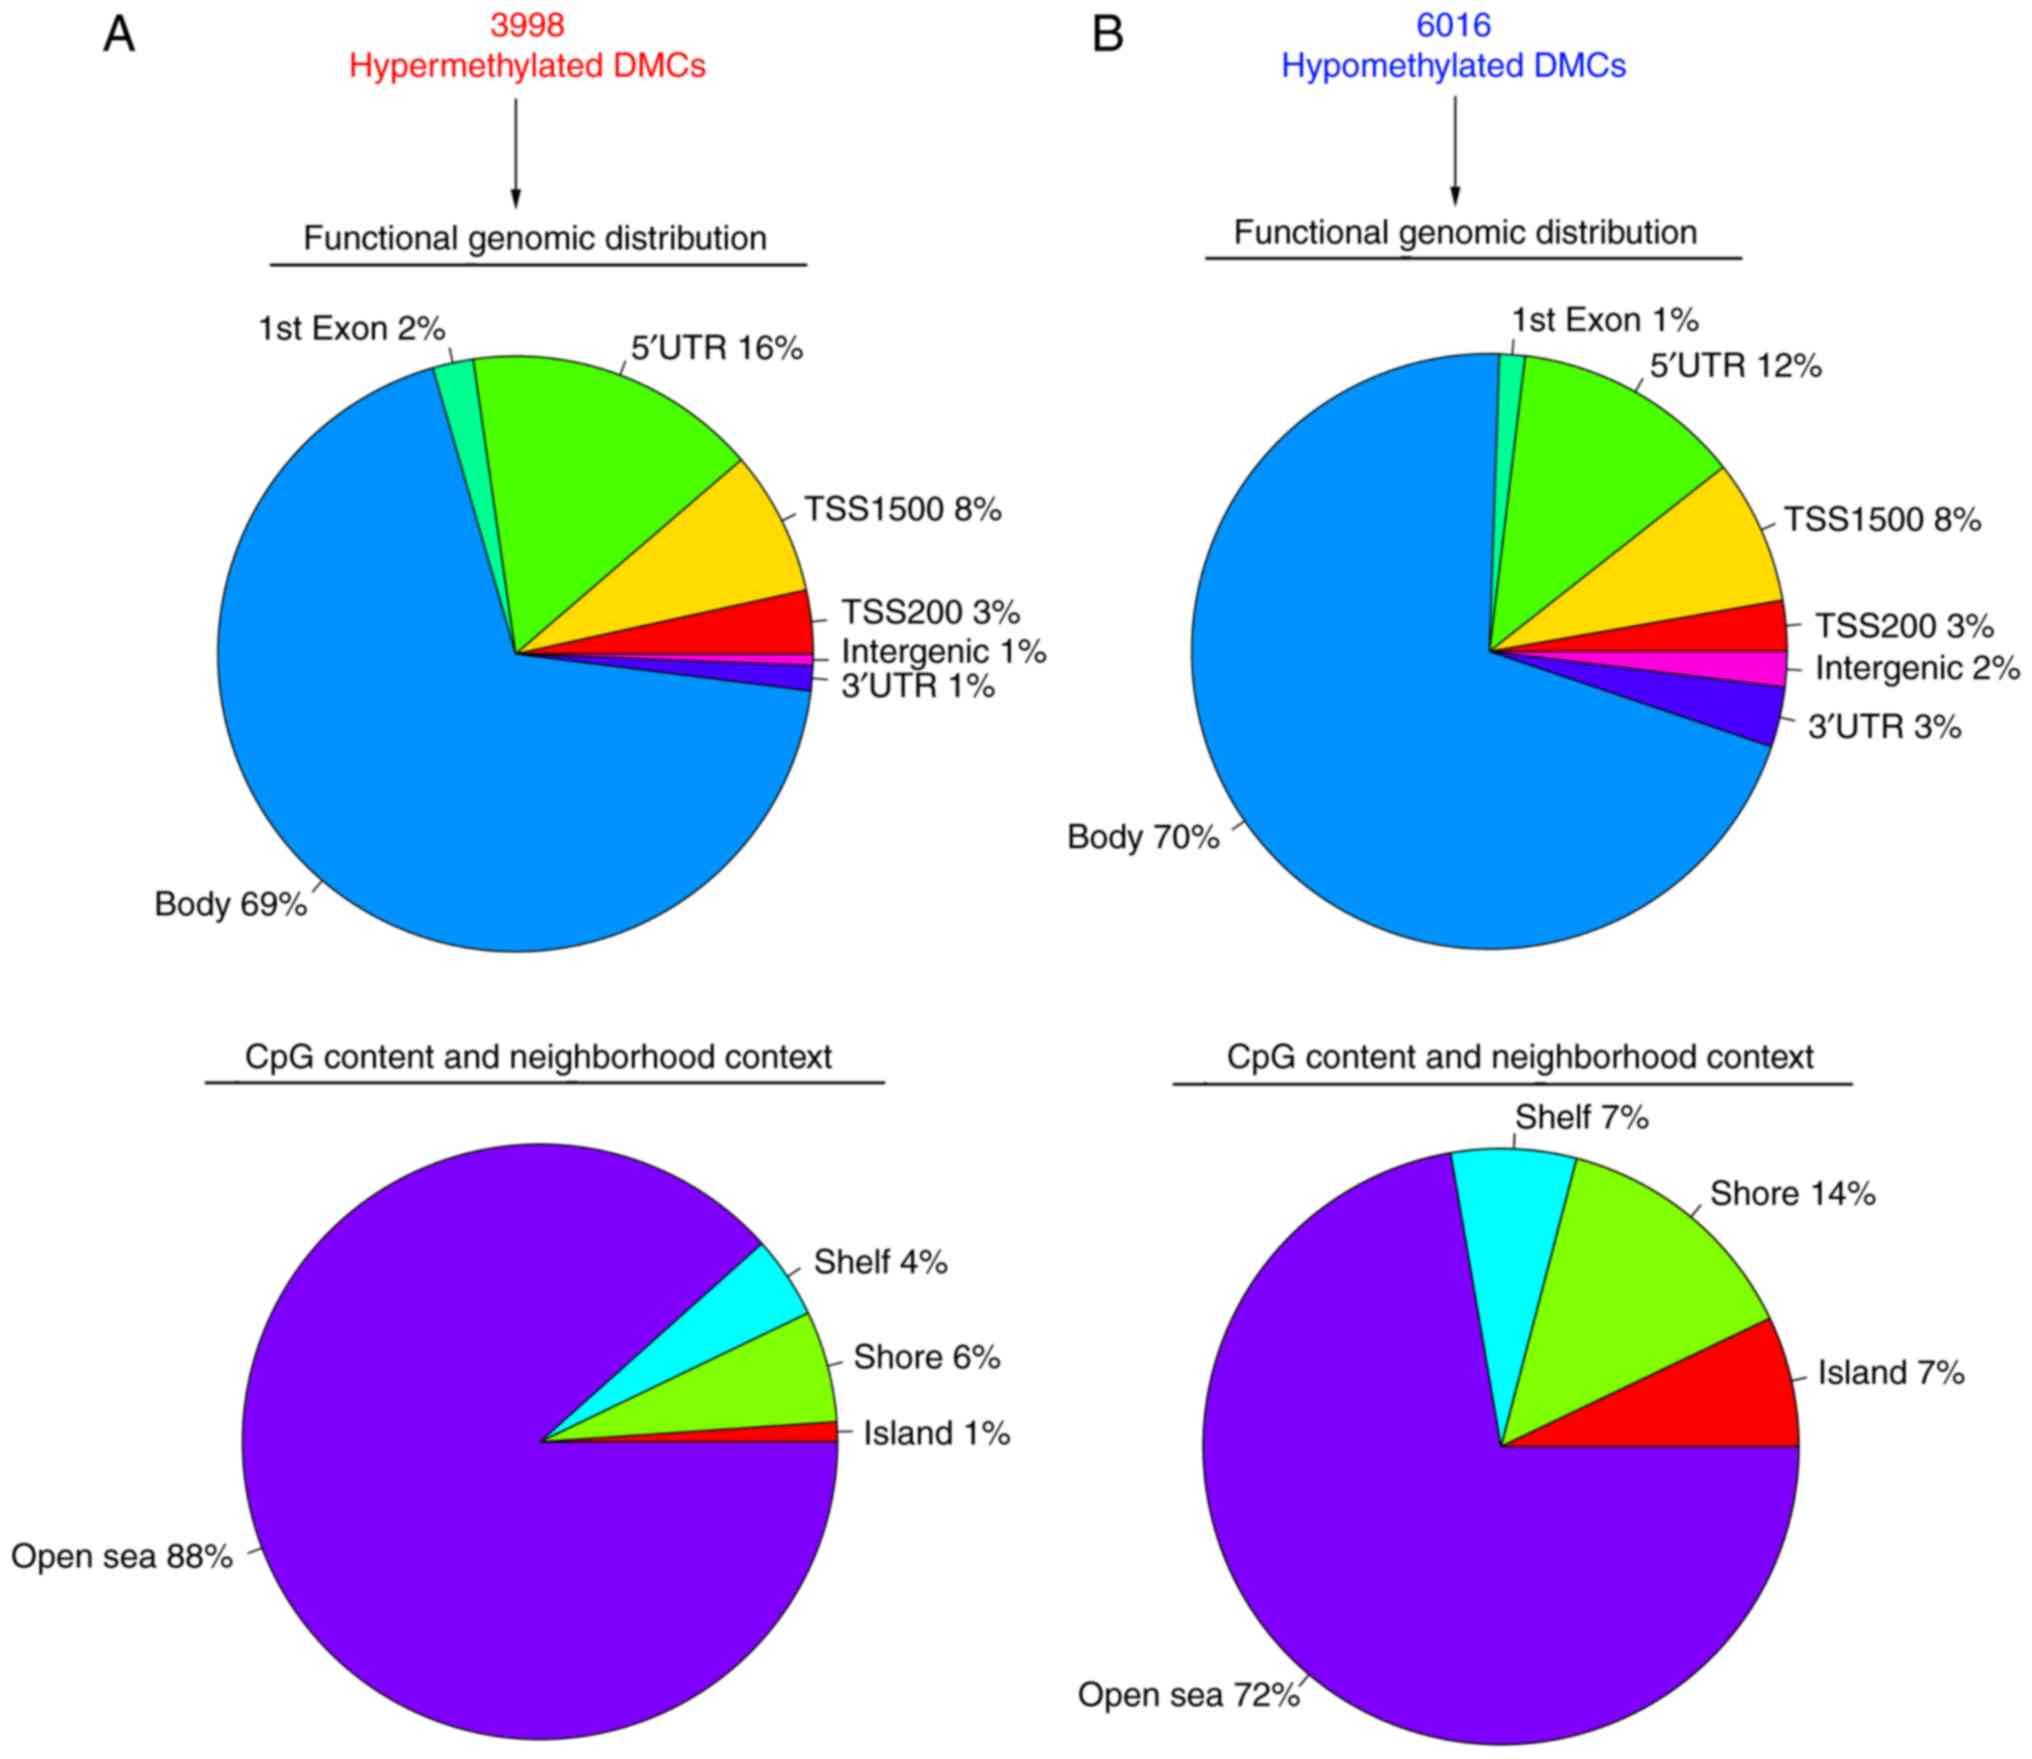
Genomic features of DMCs between type
A and B thymomas
The functional genomic distribution, CpG content and
neighborhood context for the hypo- sand hypermethylated DMCs are
shown in Fig. 5. Out of the 3,998
hypermethylated DMCs, 1% were located in the 3′UTR region, 69% in
the gene body, 2% in exon 1, 16% in the 5′UTR, 8% in the TSS1500,
3% in the TSS200 and 1% in the intergenic region (Fig. 5A). In addition, 1% of the
hypermethylated DMCs belonged to the CGI, 6% to the shore area, 4%
to the shelf area, and the remaining 88% to open sea area (Fig. 5A).
As shown in Fig. 5B,
3% of the 6,016 hypomethylated DMCs were located in the 3′UTR
region, 70% in the gene body, 1% in exon 1, 12% in the 5′UTR, 8% in
the TSS1500, 3% in the TSS200, and the remaining 2% intergenic
region. With regard to CpG content and neighborhood context, 72% of
the hypomethylated DMCs belonged to the open sea area of the
genome, 14% to the shore area, 7% to the shelf area, and 7% to the
CGI (Fig. 5B).
Integrated analysis of methylation and
expression data of type A and B thymomas
Considering that aberrant DNA methylation may cause
gene expression alterations in thymomas (25), methylation and expression data of
type A and B thymomas from the GEO database were analyzed.
Differential methylation analysis showed that a total of 377
hypermethylated DMCs between type A and B thymomas were located in
proximal promoters (TSS1500 and TSS200), which were associated with
319 genes. In addition, a total of 658 hypomethylated DMCs between
type A and B thymomas were located in proximal promoters, which
were associated with 530 genes.
The expression data compared 10 type A and 26 type B
thymomas, and 1,562 DEGs were identified between the two types. In
total, 55 common genes were found between the methylation and
expression data of type A and B thymomas (Table III). Among them, 36 genes showed
an inverse correlation between DNA methylation and expression
alterations, in which seven genes were hypermethylated with low
expression (ICAM3, APBB1IP, IFI16, PARVG, CCM2, INPP5D, SP110) and
29 were hypomethylated with high expression (GALC, ALS2CR4, IQCC,
RPL22, FEZ2, EPS15, KIF25, PACSIN2, PRKAR1A, PTPRE, ATP2A2, PNPLA8,
SERPINB5, SGK3, CBLB, KLF11, C5orf45, SLC2A10, AUH, CPE, FBXO8,
EEF1E1, STARD13, RAPGEF4, FSTL1, ZNF396, FRAS1, NAV2 and LCA5).
| Table III.Fifty-five common genes between the
methylation and expression data of type A and B thymomas. |
Table III.
Fifty-five common genes between the
methylation and expression data of type A and B thymomas.
| NCBI gene ID | Symbol | Mean.a | Mean.b | log2FC | P-value.wilox |
|---|
| 51149 | C5orf45 | −2.102930058 | −2.503322201 | −0.251443123 | 0.021177724 |
| 9637 | FEZ2 | 1.303466656 | 1.098450577 | 0.246883717 | 0.001037259 |
| 1363 | CPE | 1.504873609 | 1.021808511 | 0.558517465 | 0.000425847 |
| 549 | AUH | 0.361937179 | −0.093619066 | NA | 0.009478003 |
| 89797 | NAV2 | 0.357340345 | −0.374725063 | NA | 0.001568131 |
| 11069 | RAPGEF4 | −0.556887935 | −1.1271287 | −1.017193317 | 0.001193108 |
| 7919 | BAT1 | 0.383356739 | 1.017168635 | −1.407799434 | 0.039674448 |
| 3834 | KIF25 | −1.524919975 | −1.76772686 | −0.21316184 | 0.04690174 |
| 26269 | FBXO8 | −0.359657144 | −0.850239994 | −1.241247864 | 0.0105367 |
| 11167 | FSTL1 | 0.2920439 | −0.375401601 | NA | 0.000672044 |
| 2581 | GALC | 1.009684914 | 0.913221129 | 0.144869007 | 0.021177724 |
| 23051 | ZHX3 | −1.431590388 | −1.06661393 | 0.424580688 | 0.00430993 |
| 6146 | RPL22 | 1.92145252 | 1.723732502 | 0.15666142 | 0.014340868 |
| 57176 | VARS2 | 0.504252427 | 0.852942998 | −0.758303208 | 0.043164899 |
| 5791 | PTPRE | 0.648380999 | 0.358704002 | 0.85404797 | 0.005445117 |
| 57404 | CYP20A1 | −1.075059329 | −0.82894206 | 0.375073109 | 0.021177724 |
| 2060 | EPS15 | 0.601014623 | 0.359845244 | 0.740023504 | 0.006104164 |
| 80144 | FRAS1 | 1.224452937 | 0.541981128 | 1.175822802 |
5.26×10⁻⁵ |
| 3853 | KRT6A | −0.968952762 | −0.078244194 | 3.630370725 | 0.001568131 |
| 5268 | SERPINB5 | 0.884731379 | 0.530946778 | 0.736672239 | 0.0105367 |
| 868 | CBLB | 0.621699125 | 0.254483425 | 1.288644852 |
1.51×10⁻⁵ |
| 5573 | PRKAR1A | 1.630734363 | 1.38168313 | 0.239095003 | 0.00232546 |
| 488 | ATP2A2 | 0.613248964 | 0.293021363 | 1.065467044 | 0.000158687 |
| 50640 | PNPLA8 | −0.118260809 | −0.44273736 | −1.904479067 | 0.039674448 |
| 84283 | TMEM79 | −1.351520231 | −0.790482225 | 0.77377818 | 0.008511842 |
| 9521 | EEF1E1 | −0.664623538 | −1.15528475 | −0.797639192 | 0.017478649 |
| 167691 | LCA5 | −1.152514072 | −1.982068102 | −0.782222167 |
7.71×10⁻⁵ |
| 10109 | ARPC2 | 1.176142371 | 1.309877505 | −0.155369195 | 0.019253419 |
| 51389 | RWDD1 | 0.229588154 | 0.734803706 | −1.678310694 | 0.04690174 |
| 90627 | STARD13 | −1.152950212 | −1.659424944 | −0.525353163 | 0.004848756 |
| 8462 | KLF11 | 0.31155478 | −0.083381262 | NA | 0.021177724 |
| 252884 | ZNF396 | −0.062746326 | −0.739148969 | −3.558262253 |
9.29×10⁻⁵ |
| 65062 | ALS2CR4 | 1.134639505 | 0.971836256 | 0.22344884 | 0.033385967 |
| 55721 | IQCC | −1.638095756 | −1.819151371 | −0.151245901 | 0.04690174 |
| 10978 | CLP1 | −1.334499175 | −0.955373735 | 0.482161294 | 0.039674448 |
| 128387 | TATDN3 | −1.64574706 | −1.425240499 | 0.207537237 | 0.023260885 |
| 11252 | PACSIN2 | 1.408366082 | 1.165251567 | 0.273380936 | 0.002641037 |
| 23678 | SGK3 | −0.155180551 | −0.520928994 | −1.747138985 | 0.000899667 |
| 64098 | PARVG | 0.104295597 | 0.587763121 | −2.494556581 | 0.019253419 |
| 160728 | SLC5A8 | −0.811122514 | −0.389094826 | 1.059798045 | 0.033385967 |
| 81031 | SLC2A10 | 1.032303784 | 0.622080161 | 0.730695183 | 0.009478003 |
| 2 | A2M | 0.50047177 | −0.092486832 | NA | 0.000133173 |
| 3635 | INPP5D | −1.025761944 | −0.798974115 | 0.360475283 | 0.043164899 |
| 8452 | CUL3 | −0.41681927 | −0.934666023 | −1.165028973 | 0.002993599 |
| 3431 | SP110 | 0.653415681 | 0.813894131 | −0.316840067 | 0.021177724 |
| 3428 | IFI16 | −0.554778354 | −0.001533575 | 8.498868544 | 0.019253419 |
| 152330 | CNTN4 | 0.055184231 | −0.701012597 | NA | 0.005445117 |
| 2690 | GHR | 0.828244257 | 0.288386478 | 1.522052773 | 0.012960556 |
| 3385 | ICAM3 | −0.828251179 | −0.004174698 | 7.632252662 | 0.043164899 |
| 83605 | CCM2 | 0.909215687 | 1.225045194 | −0.430140494 | 0.021177724 |
| 54518 | APBB1IP | −0.245298433 | 0.422097639 | NA | 0.017478649 |
| 81846 | SBF2 | 0.52478967 | 0.114005332 | 2.20263802 |
4.32×10⁻⁵ |
| 27252 | KLHL20 | 0.692117181 | 0.541111423 | 0.355090623 | 0.036418783 |
| 10068 | IL18BP | 0.367427467 | 0.117710084 | 1.642221566 | 0.043164899 |
| 185 | AGTR1 | −1.260285672 | −1.835884547 | −0.542724545 | 0.002993599 |
Functional annotation of
differentially methylated genes between type A and B thymomas
Based on the combination analysis result of the 36
genes, the GO and KEGG pathway enrichment analysis was performed
with a threshold FDR value of <0.05. The most enriched
biological processes for the seven genes that were hypermethylated
with a low expression were ‘negative regulation of neutrophil
differentiation’, ‘blood vessel endothelial cell differentiation’
and ‘negative regulation of monocyte differentiation’. The most
enriched cellular components were ‘focal adhesion’, ‘cytoplasm’ and
‘cortical cytoskeleton’. The most enriched molecular functions were
‘phosphatidylinositol trisphosphate phosphatase activity’,
‘inositol-4, 5-bisphosphate 5-phosphatase activity’ and ‘PTB domain
binding’. Furthermore, functional annotation showed that the seven
genes that were hypermethylated with a lower expression were highly
involved in five KEGG pathways: ‘Insulin signaling pathway’, ‘Fc
gamma R-mediated phagocytosis’, ‘Fc epsilon RI singling pathway’,
‘CAMs’ and ‘focal adhesion’ (Table
IV).
| Table IV.Enrichment analysis of the 7 genes
hypermethylated with lower expression between type A and type B
thymoma. |
Table IV.
Enrichment analysis of the 7 genes
hypermethylated with lower expression between type A and type B
thymoma.
| Term | ID | Items | FDR |
|---|
| Biological
processes | GO:0045659 | Negative regulation
of neutrophil differentiation | 0.004604 |
|
| GO:0060837 | Blood vessel
endothelial cell differentiation | 0.004604 |
|
| GO:0045656 | Negative regulation
of monocyte differentiation | 0.005524 |
|
| GO:0061154 | Endothelial tube
morphogenesis | 0.005524 |
|
| GO:0001885 | Endothelial cell
development | 0.006138 |
|
| GO:0045409 | Negative regulation
of interleukin-6 biosynthetic process | 0.006575 |
| Cellular
components | GO:0005925 | Focal adhesion | 0.003788 |
|
| GO:0005737 | Cytoplasm | 0.011388 |
|
| GO:0030863 | Cortical
cytoskeleton | 0.015032 |
|
| GO:0030054 | Cell junction | 0.015433 |
|
| GO:0005886 | Plasma
membrane | 0.017133 |
|
| GO:0005884 | Actin filament | 0.017957 |
| Molecular
functions | GO:0034594 |
Phosphatidylinositol trisphosphate
phosphatase activity | 0.003274 |
|
| GO:0030487 |
Inositol-4,5-bisphosphate 5-phosphatase
activity | 0.003274 |
|
| GO:0051425 | PTB domain
binding | 0.004364 |
|
| GO:0004445 |
Inositol-polyphosphate 5-phosphatase
activity | 0.005727 |
|
| GO:0005515 | Protein
binding | 0.023332 |
|
| GO:0005178 | Integrin
binding | 0.0412 |
| KEGG pathways | hsa04910 | Insulin signaling
pathway | 0.031387 |
|
| hsa04666 | Fc gamma R-mediated
phagocytosis | 0.032684 |
|
| hsa04664 | Fc epsilon RI
signaling pathway | 0.036521 |
|
| hsa04514 | Cell adhesion
molecules (CAMs) | 0.035423 |
|
| hsa04510 | Focal adhesion | 0.039626 |
In addition, the 29 genes that were hypomethylated
with high expression were predominantly involved in the following
biological processes: ‘Morphogenesis of an epithelium’, ‘regulation
of protein phosphorylation’ and ‘cell communication’. ‘Cytoplasm’,
‘cytosol’ and ‘cAMP-dependent protein kinase complex’ were the most
enriched cellular components. ‘cAMP binding’, ‘cAMP-dependent
protein kinase regulator activity’ and ‘galactosylceramidase
activity’ were the most enriched molecular functions (Table V). No significantly enriched KEGG
pathways were identified for the 29 genes that were hypomethylated
with high expression at a threshold FDR value of <0.05.
| Table V.Enrichment analysis of the 29 genes
hypomethylated with higher expression between type A and type B
thymoma. |
Table V.
Enrichment analysis of the 29 genes
hypomethylated with higher expression between type A and type B
thymoma.
| Term | ID | Items | Hyp_c |
|---|
| Biological
processes | GO:0002009 | Morphogenesis of an
epithelium | 0.008491 |
|
| GO:0001932 | Regulation of
protein phosphorylation | 0.009307 |
|
| GO:0007154 | Cell
communication | 0.021245 |
|
| GO:0060512 | Prostate gland
morphogenesis | 0.022083 |
|
| GO:0033003 | Regulation of mast
cell activation | 0.022083 |
|
| GO:0023051 | Regulation of
signaling | 0.022083 |
| Cellular
components | GO:0005737 | Cytoplasm | 0.000212 |
|
| GO:0005829 | Cytosol | 0.028305 |
|
| GO:0005952 | cAMP-dependent
protein kinase complex | 0.000883 |
| Molecular
functions | GO:0030552 | cAMP binding | 0.004318 |
|
| GO:0008603 | cAMP-dependent
protein kinase regulator activity | 0.006962 |
|
| GO:0004336 |
Galactosylceramidase activity | 0.011623 |
|
| GO:0004490 |
Methylglutaconyl-CoA hydratase
activity | 0.011623 |
|
| GO:0031775 |
Lutropin-choriogonadotropic hormone
receptor binding | 0.011623 |
|
| GO:0005509 | Calcium ion
binding | 0.023277 |
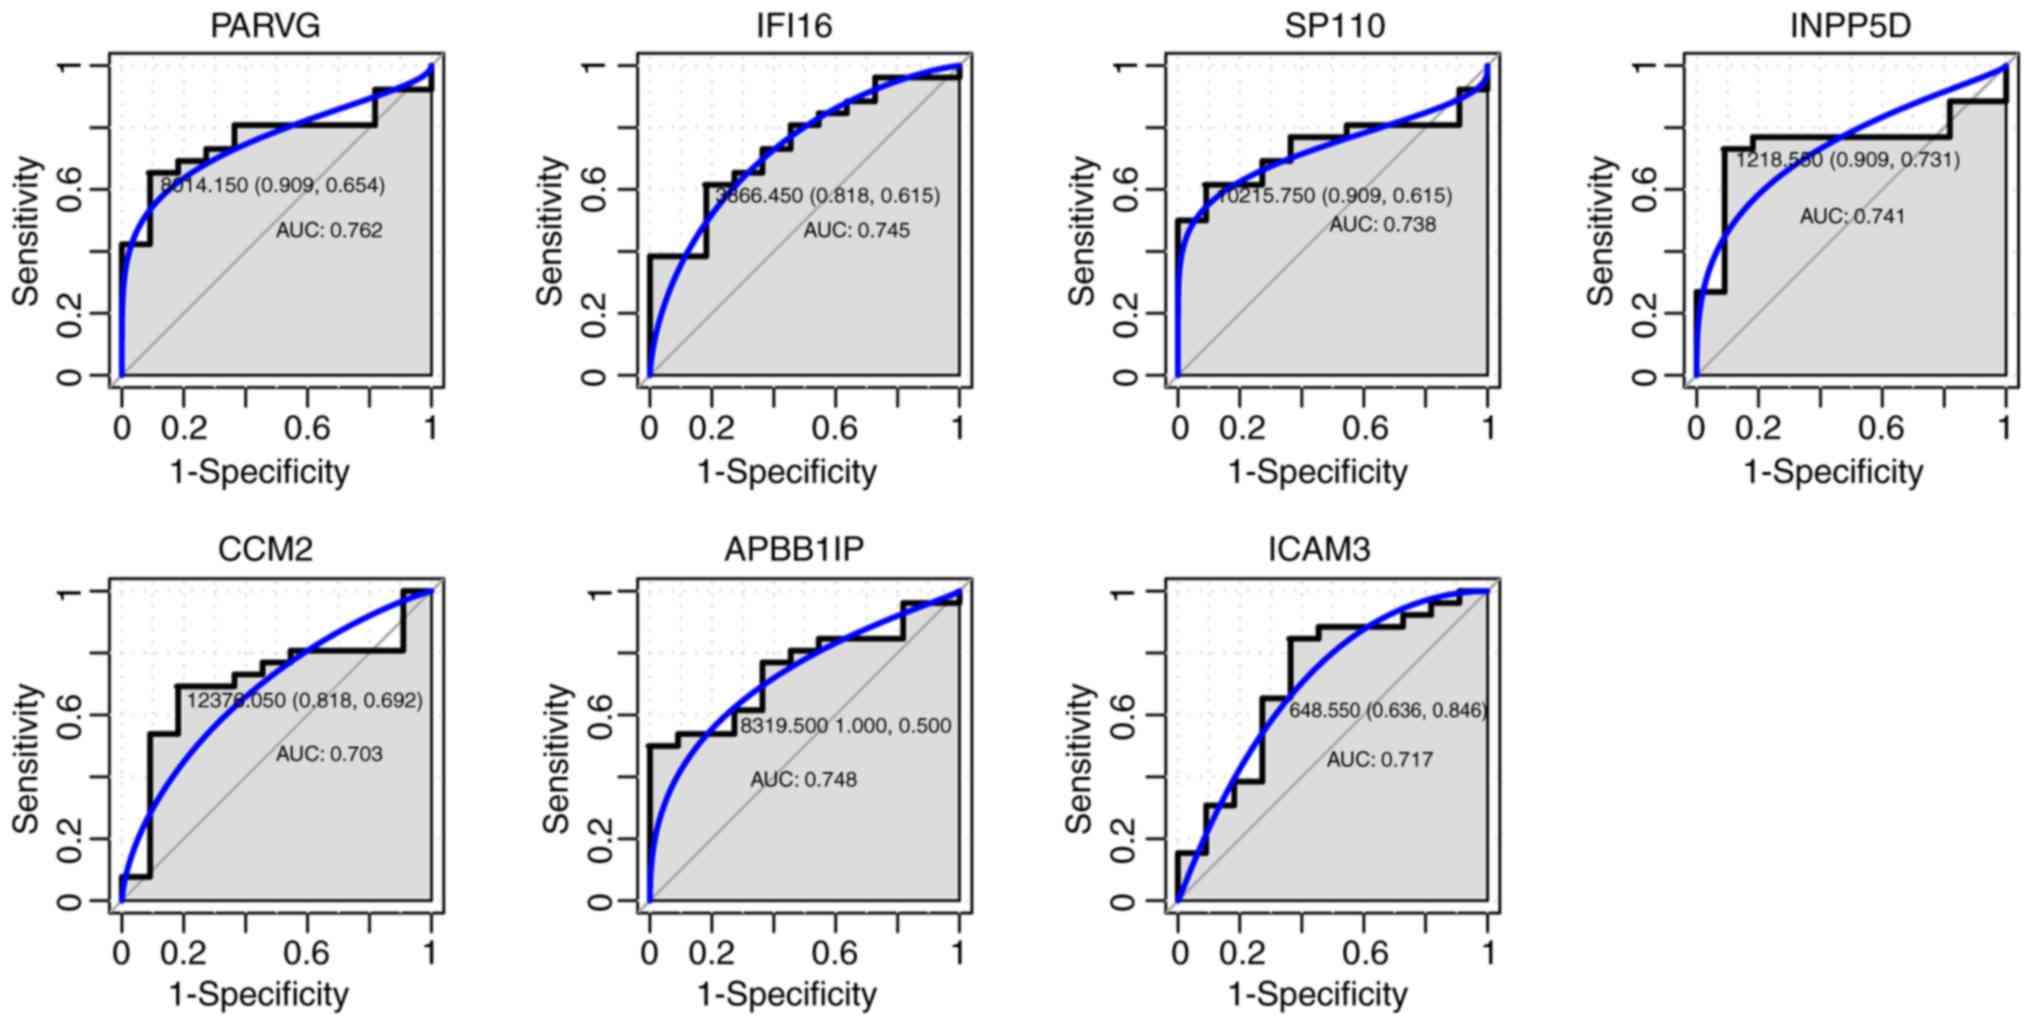
Evaluation of DNA methylation markers
for type A and B thymomas
To assess the clinical functionality of DNA
methylation markers as diagnostic biomarkers for type A and B
thymomas, their sensitivity and specificity were determined using
ROC curve analysis. For the seven genes that were hypermethylated
with low expression, the AUC of ICAM3 (0.717), APBB1IP (0.748),
IFI16 (0.745), PARVG (0.762), CCM2 (0.703), INPP5D (0.741) and
SP110 (0.738) was >0.7, as shown in Fig. 6.
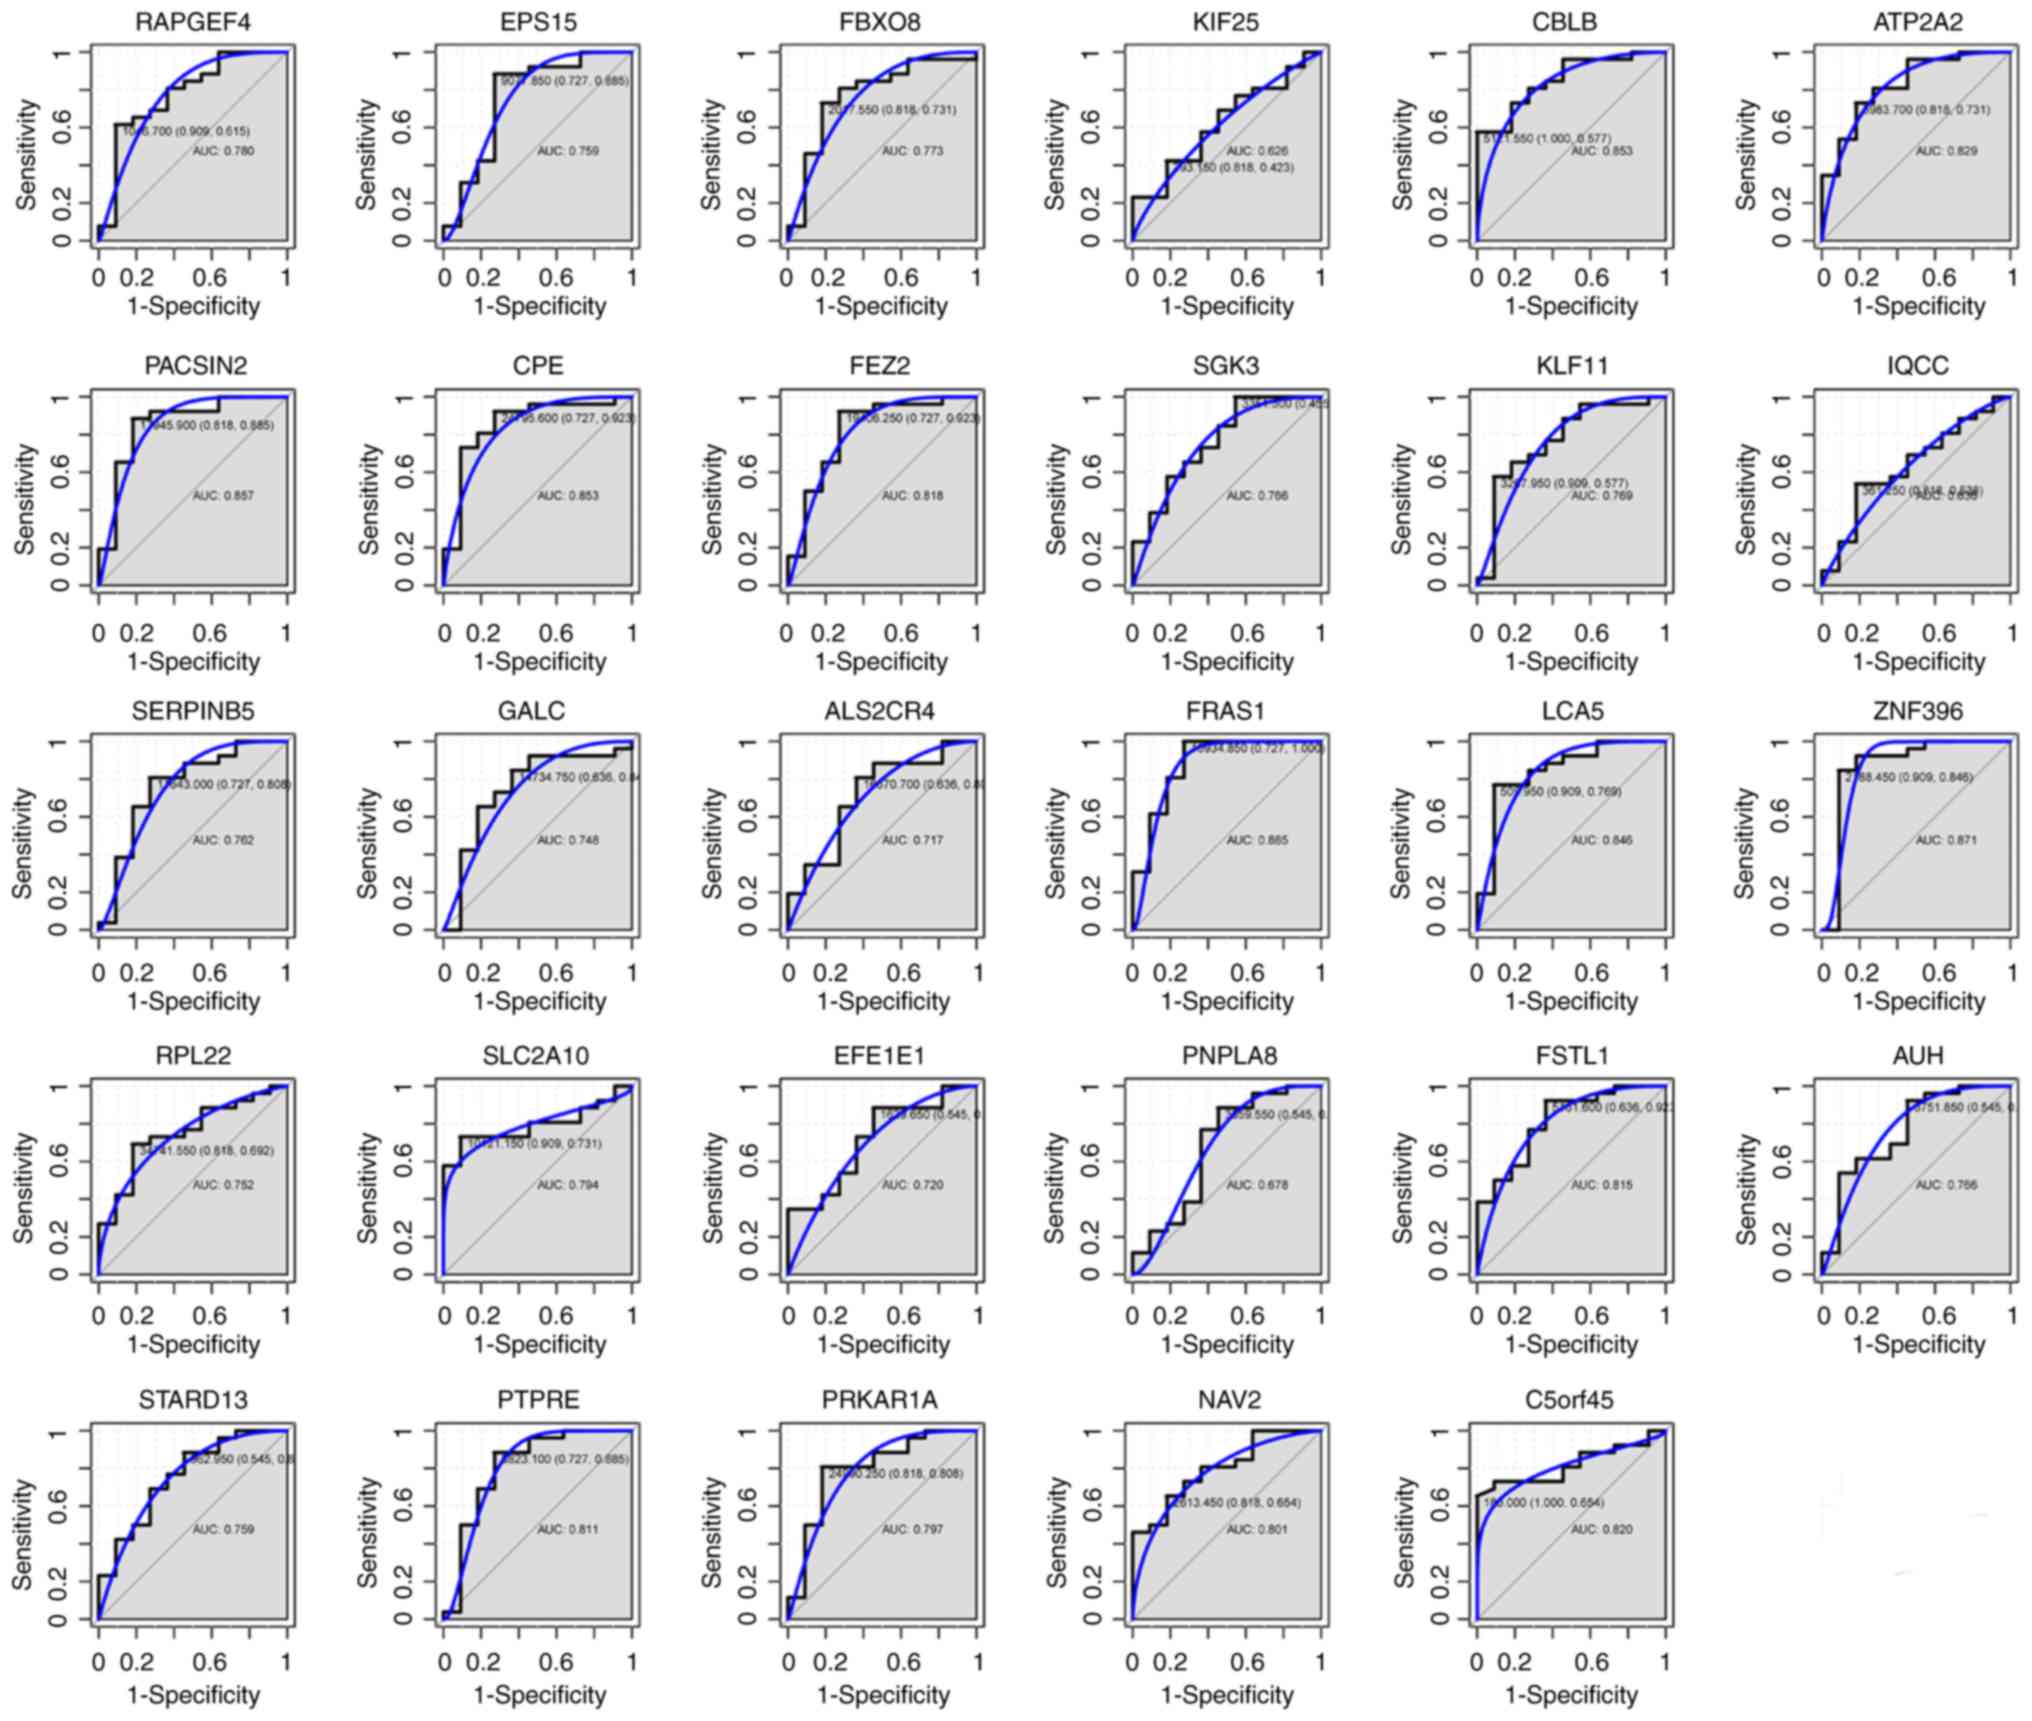
For the 29 genes that were hypomethylated with high
expression, the AUC of FEZ2 (0.818), PTPRE (0.811), ATP2A2 (0.829),
CBLB (0.853), C5orf45 (0.820), CPE (0.853), FSTL1 (0.815), ZNF396
(0.871), FRAS1 (0.885), NAV2 (0.801) and LCA5 (0.846) was > 0.8,
as shown in Fig. 7A-K. Among these
11 genes, ZNF396 and FRAS1 had the largest AUC. For the diagnosis
of type A and B thymomas, the sensitivity and specificity of ZNF396
was 84.6 and 90.9% (Fig. 7H), while
that of FRAS1 was 100 and 72.7% (Fig.
7I), respectively. The combination analysis of the above 11
genes increased sensitivity to 96.2% (Fig. 7L). The AUC of all 29 genes was shown
in Fig. 8.
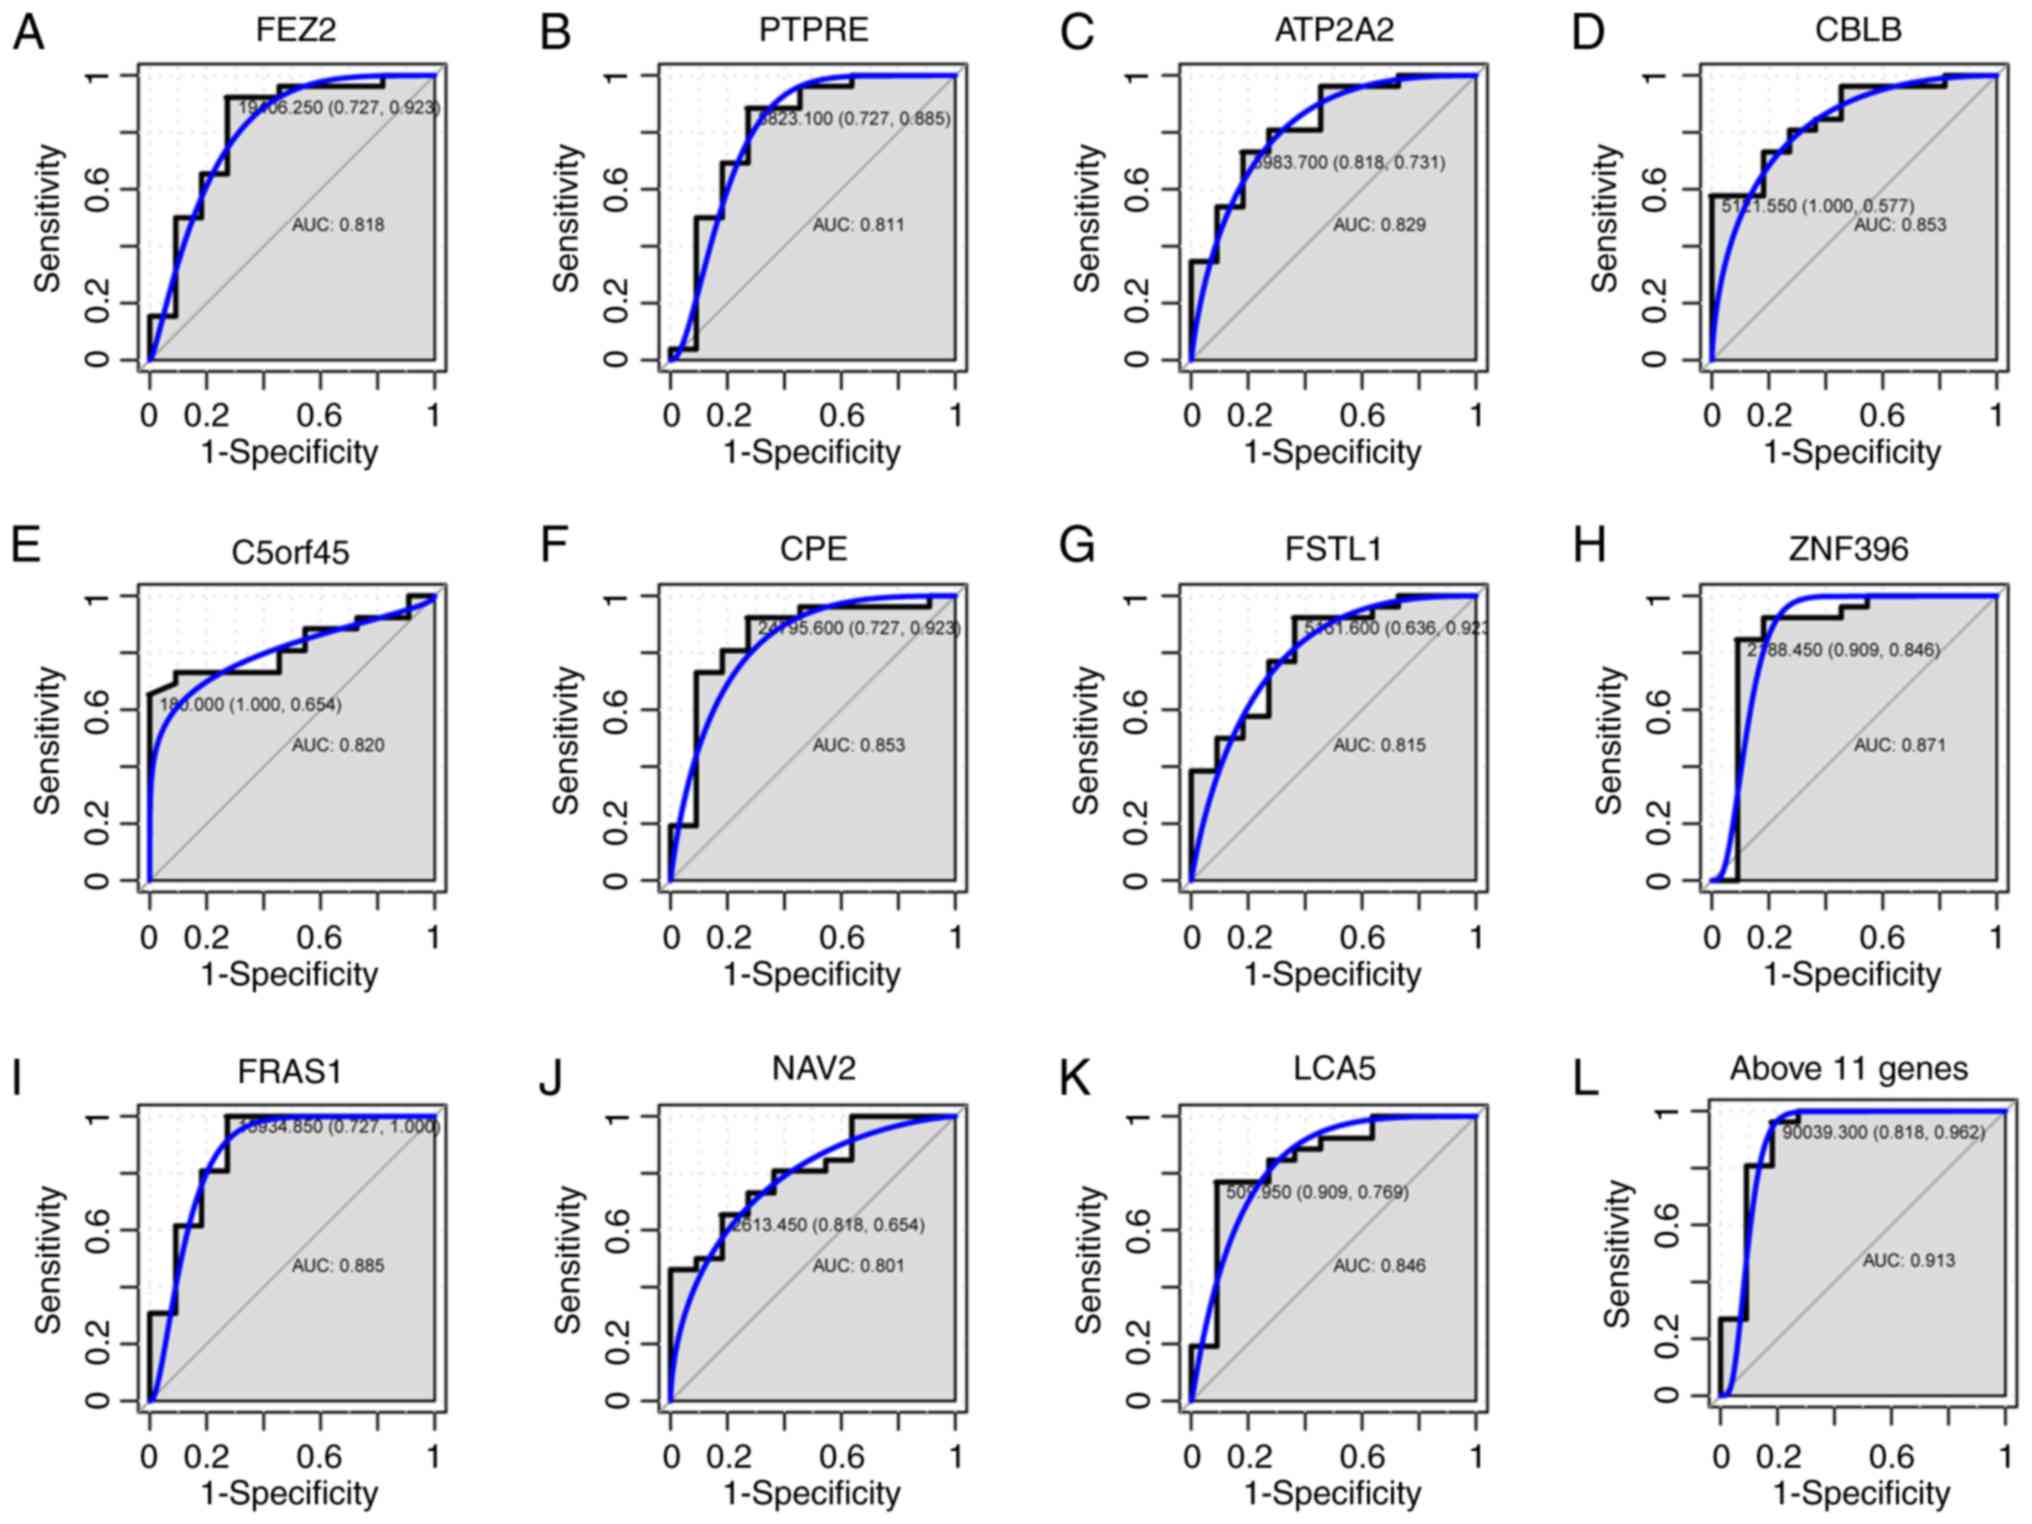 | Figure 7.ROC curves for the discrimination of
type A and type B thymomas. ROC curves and AUC values were
generated for (A) FEZ2, (B) PTPRE, (C) ATP2A2, (D) CBLB, (E)
C5orf45, (F) CPE, (G) FSTL1, (H) ZNF396, (I) FRAS1, (J) NAV2 and
(K) LCA5, to compare gene expression in 10 type A and 26 type B
thymoma cases from GSE29695. (L) A ROC curve of the above 11 genes
was also generated. ROC, receiver operating characteristic; AUC,
area under the curve. |
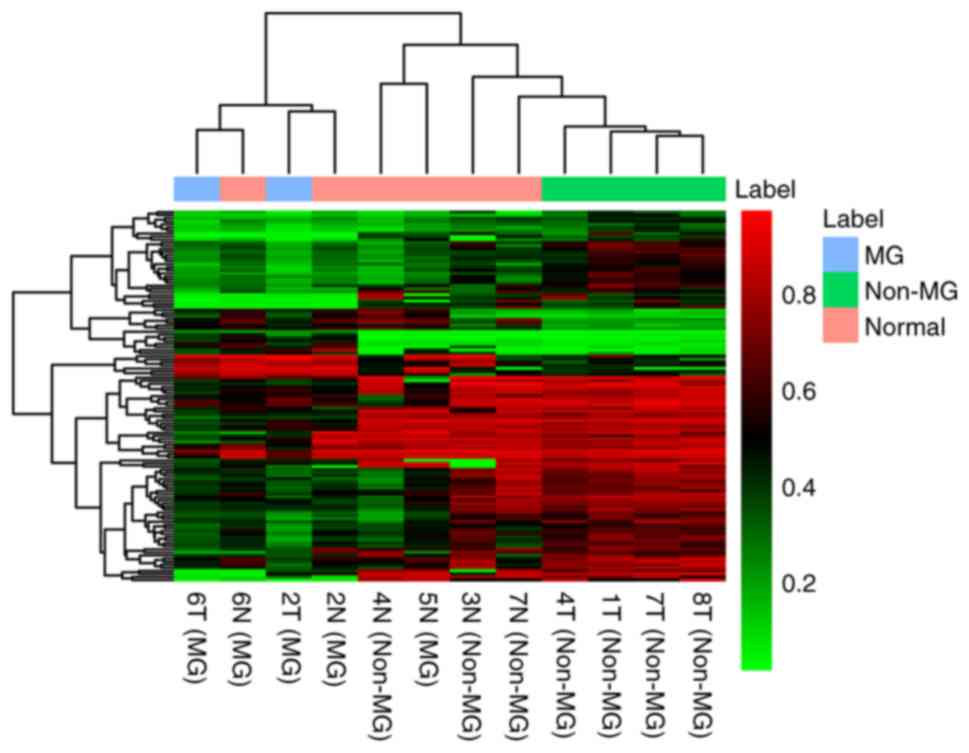
Identification of DMCs between MG- and
non-MG-thymomas
Methylation microarray analysis was also used to
obtain the DNA methylation pattern of the 2 MG- and 4
non-MG-thymomas. Using Δβ>0.2 and P<0.001, 121 DMCs were
identified between the MG- and non-MG-thymoma subjects, including
22 hypermethylated and 99 hypomethylated DMCs. The result of
unsupervised hierarchical clustering showed that the DNA
methylation profiling of MG-thymoma was significantly distinguished
from that of non-MG-thymoma (Fig.
9).
The 22 hypermethylated DMCs represented 20 genes,
which were enriched in 4 KEGG pathways: ‘Mucin type O-Glycan
biosynthesis’, ‘lysine degradation’, ‘p53 signaling pathway’ and
‘phototransduction pathway’. The 99 hypomethylated DMCs represented
73 genes, and no significantly enriched KEGG pathway was found.
Discussion
Epigenetic changes, particularly changes in DNA
methylation, are important markers and widely studied in a variety
of cancer types (26). The role of
DNA methylation in oncogenesis is a topic of interest in the study
of cancer biology. A previous report showed that epigenetic events
have been implicated in thymomas (27). However, to the best of our
knowledge, exhaustive analysis of genome-wide aberrant DNA
methylation in the development and progression of thymomas has not
been performed. In the current pilot study, the methylation profile
of patients with thymoma was described. The landscape of
methylation in thymomas was obtained using an Illumina 850K
methylation microarray.
A total of 19,118 DMCs were identified, 119 of which
were hypermethylated and 18,999 hypomethylated. In general, a
global decrease in methylation was observed in thymoma tissue,
compared with the control. It is known that DNA methylation may be
more dynamic outside the CGI (28);
the results of the present study also indicated that the majority
of DMCs were found within the gene body or open sea area. The DNA
methylation of FHIT, MLH1, E-cadherin, MGMT, CDKN2A, HPP1 and DAP-K
in thymomas has been previously described (13,14,29,30).
The present study provided a more extensive list of candidate
differentially methylated genes, which may be associated with
thymomas. Further studies are required to evaluate the gene
expression alterations in thymomas regulated by aberrant DNA
methylation.
The latest histological classification recognizes
two main thymoma types: A and B (1). The histological subtypes of thymomas
seem to be of independent prognostic significance (31,32).
Type A thymoma frequently follows a benign clinical course, whereas
type B thymoma is considered a low to moderate malignant neoplasm
(33). In the present study, the
global methylation patterns of types A and B thymoma across the
genome were studied. To avoid gender bias, all CpG probe and gene
expression data were removed from chromosomes X and Y for the
analysis. Differential methylation analysis identified 3,998
hypermethylated and 6,016 hypomethylated DMCs between type A and B
thymoma subjects. Genomic features of DMCs also suggested that most
DMCs were found within the gene body region or open sea area.
Furthermore, the methylation array data of type A
and B thymomas were analyzed in relation to the gene expression
array data from the GEO. According to the results, a set of 36
genes showed an inverse correlation between DNA methylation and
expression alterations, which may have potential functional
consequences, owing to aberrant promoter DNA methylation (TSS1500
and TSS200). Pathway enrichment analysis suggested that the seven
genes that were hypermethylated with low expression (ICAM3,
APBB1IP, IFI16, PARVG, CCM2, INPP5D and SP110) covered major
pathways associated with Fc gamma R-mediated phagocytosis, Fc
epsilon RI signaling pathway, cell adhesion molecules and focal
adhesion, which serve an important role in tumor development and
host-defense mechanisms. Therefore, the present results underlined
the importance of aberrant DNA methylation in different subtypes of
thymoma.
The methylation status of the 29 genes that were
hypermethylated with a low expression were also evaluated using ROC
curve analysis to distinguish type A from B thymomas. The results
indicated that 11/29 genes (FEZ2, PTPRE, ATP2A2, CBLB, C5orf45,
CPE, FSTL1, ZNF396, FRAS1, NAV2 and LCA5) may be potential
biomarkers for the diagnosis of type A and B thymomas, with
AUC>0.8. It has been reported that diagnostic information may be
increased if the methylation of multiple genes is analyzed in
combination (34). Herein, it was
observed that combination analysis of the 11 genes increased
sensitivity to 96.2%. The present results suggested that there are
different epigenetic regulation mechanisms for type A and B
thymomas. These 11 genes had potential functional consequences in
type A and B thymomas, owing to aberrant promoter DNA methylation.
Their roles in thymoma subtypes, as well as the utility of these
biomarkers in a clinical setting, requires further study in a
larger cohort of thymoma subjects.
In conclusion, the present study reported the
dysregulated DNA methylation involved in thymoma using the Illumina
850K methylation microarray. Significant changes were observed in
the DNA methylomes of thymoma tumor and normal samples, and between
type A and B thymomas. To the best of our knowledge, the present
study was the first global DNA methylation analysis of thymoma,
which may set the foundation for understanding the mechanisms of
tumorigenesis in thymoma, as well as for future investigation of
epigenetic regulation in type A and B thymomas.
Acknowledgements
We thank Beijing Medintell Bioinformatic Technology
Co., Ltd., for assistance in high-throughput sequencing and data
analysis.
Funding
This study was funded by the Research Special Fund
for the Public Welfare Industry of Health (grant no. 201402001),
the National Natural Science Foundation of China (Youth Science
Fund) (grant no. 81400068) and the CAMS Innovation Fund for Medical
Sciences (grant no. 2016-I2M-1-002).
Availability of data and materials
The datasets used and analyzed during the present
study are available from the corresponding author on reasonable
request.
Authors' contributions
YB, YM, and YN designed the study. YB, YM, SL, HL
and JH contributed to the materials and performed experiments. YN,
YZ, NL and LL performed the data analyses. YZ, NL, XM and JY
interpreted the data. LL, XM, JY, BL, ZL and ZW performed the
microarray analysis of DNA methylation and contributed
significantly to writing the manuscript. All authors read and
approved the final manuscript.
Ethics approval and consent to
participate
Written informed consent was provided by all
participants. The present study was approved by the Ethics
Committee of Peking Union Medical College Hospital (Beijing, China)
and was performed in compliance with the Declaration of
Helsinki.
Patient consent for publication
Not applicable.
Competing interests
The authors declare that they have no competing
interests.
References
|
1
|
Guerrera F, Rendina EA, Venuta F,
Margaritora S, Ciccone AM, Novellis P, Novero D, Anile M, Bora G,
Rena O, et al: Does the World Health Organization histological
classification predict outcomes after thymomectomy? Results of a
multicentre study on 750 patients. Eur J Cardiothorac Surg.
48:48–54. 2015. View Article : Google Scholar : PubMed/NCBI
|
|
2
|
Carter BW, Benveniste MF, Madan R, Godoy
MC, Groot PM, Truong MT, Rosado-de-Christenson ML and Marom EM:
IASLC/ITMIG staging system and lymph node Map for thymic epithelial
neoplasms. Radiographics. 37:758–776. 2017. View Article : Google Scholar : PubMed/NCBI
|
|
3
|
Marx A, Strobel P, Badve SS, Chalabreysse
L, Chan JK, Chen G, de Leval L, Detterbeck F, Girard N, Huang J, et
al: ITMIG consensus statement on the use of the WHO histological
classification of thymoma and thymic carcinoma: refined
definitions, histological criteria, and reporting. J Thorac Oncol.
9:596–611. 2014. View Article : Google Scholar : PubMed/NCBI
|
|
4
|
Ried M, Marx A, Gotz A, Hamer O, Schalke B
and Hofmann HS: State of the art: Diagnostic tools and innovative
therapies for treatment of advanced thymoma and thymic carcinoma.
Eur J Cardiothorac Surg. 49:1545–1552. 2016. View Article : Google Scholar : PubMed/NCBI
|
|
5
|
Okumura M, Fujii Y, Shiono H, Inoue M,
Minami M, Utsumi T, Kadota Y and Sawa Y: Immunological function of
thymoma and pathogenesis of paraneoplastic myasthenia gravis. Gen
Thorac Cardiovasc Surg. 56:143–150. 2008. View Article : Google Scholar : PubMed/NCBI
|
|
6
|
Aydemir B: The effect of myasthenia gravis
as a prognostic factor in thymoma treatment. North Clin Istanb.
3:194–200. 2016.PubMed/NCBI
|
|
7
|
Jamilloux Y, Frih H, Bernard C, Broussolle
C, Petiot P, Girard N and Sève P: Thymoma and autoimmune diseases.
Rev Med Interne. 39:17–26. 2018.(In French). View Article : Google Scholar : PubMed/NCBI
|
|
8
|
Venza M, Visalli M, Biondo C, Oteri R,
Agliano F, Morabito S, Teti D and Venza I: Epigenetic marks
responsible for cadmium-induced melanoma cell overgrowth. Toxicol
In Vitro. 29:242–250. 2015. View Article : Google Scholar : PubMed/NCBI
|
|
9
|
Venza M, Visalli M, Beninati C, Biondo C,
Teti D and Venza I: Role of genetics and epigenetics in mucosal,
uveal, and cutaneous melanomagenesis. Anticancer Agents Med Chem.
16:528–538. 2016. View Article : Google Scholar : PubMed/NCBI
|
|
10
|
Bellissimo T, Ganci F, Gallo E, Sacconi A,
Tito C, De Angelis L, Pulito C, Masciarelli S, Diso D, Anile M, et
al: Thymic Epithelial Tumors phenotype relies on miR-145-5p
epigenetic regulation. Mol Cancer. 16:882017. View Article : Google Scholar : PubMed/NCBI
|
|
11
|
Wei J, Liu Z, Wu K, Yang D, He Y, Chen GG,
Zhang J and Lin J: Identification of prognostic and
subtype-specific potential miRNAs in thymoma. Epigenomics.
9:647–657. 2017. View Article : Google Scholar : PubMed/NCBI
|
|
12
|
Radovich M, Solzak JP, Hancock BA, Conces
ML, Atale R, Porter RF, Zhu J, Glasscock J, Kesler KA, Badve SS, et
al: A large microRNA cluster on chromosome 19 is a transcriptional
hallmark of WHO type A and AB thymomas. Br J Cancer. 114:477–484.
2016. View Article : Google Scholar : PubMed/NCBI
|
|
13
|
Chen C, Yin N, Yin B and Lu Q: DNA
methylation in thoracic neoplasms. Cancer Lett. 301:7–16. 2011.
View Article : Google Scholar : PubMed/NCBI
|
|
14
|
Mokhtar M, Kondo K, Namura T, Ali AH,
Fujita Y, Takai C, Takizawa H, Nakagawa Y, Toba H, Kajiura K, et
al: Methylation and expression profiles of MGMT gene in thymic
epithelial tumors. Lung Cancer. 83:279–287. 2014. View Article : Google Scholar : PubMed/NCBI
|
|
15
|
Hirose Y, Kondo K, Takizawa H, Nagao T,
Nakagawa Y, Fujino H, Toba H, Kenzaki K, Sakiyama S and Tangoku A:
Aberrant methylation of tumour-related genes in thymic epithelial
tumours. Lung Cancer. 64:155–159. 2009. View Article : Google Scholar : PubMed/NCBI
|
|
16
|
Lopomo A, Ricciardi R, Maestri M, De Rosa
A, Melfi F, Lucchi M, Mussi A, Coppedè F and Migliore L:
Gene-specific methylation analysis in thymomas of patients with
myasthenia gravis. Int J Mol Sci. 17:2121–2131. 2016. View Article : Google Scholar :
|
|
17
|
Zhu S, Wang ZT, Liu WZ, Zong SX and Li BS:
Invasive atypical thymic carcinoid: Three case reports and
literature review. Onco Targets Ther. 9:6171–6176. 2016. View Article : Google Scholar : PubMed/NCBI
|
|
18
|
Assenov Y, Muller F, Lutsik P, Walter J,
Lengauer T and Bock C: Comprehensive analysis of DNA methylation
data with RnBeads. Nat Methods. 11:1138–1140. 2014. View Article : Google Scholar : PubMed/NCBI
|
|
19
|
Badve S, Goswami C, Gokmen-Polar Y, Nelson
RP Jr, Henley J, Miller N, Zaheer NA, Sledge GW Jr, Li L, Kesler
KA, et al: Molecular analysis of thymoma. PLoS One. 7:e426692012.
View Article : Google Scholar : PubMed/NCBI
|
|
20
|
Barrett T, Wilhite SE, Ledoux P,
Evangelista C, Kim IF, Tomashevsky M, Marshall KA, Phillippy KH,
Sherman PM, Holko M, et al: NCBI GEO: Archive for functional
genomics data sets- - Update. Nucleic Acids Res. 41:D991–D995.
2013. View Article : Google Scholar : PubMed/NCBI
|
|
21
|
Tabas-Madrid D, Nogales-Cadenas R and
Pascual-Montano A: GeneCodis3: A non-redundant and modular
enrichment analysis tool for functional genomics. Nucleic Acids
Res. 40:W478–W483. 2012. View Article : Google Scholar : PubMed/NCBI
|
|
22
|
Ashburner M, Ball CA, Blake JA, Botstein
D, Butler H, Cherry JM, Davis AP, Dolinski K, Dwight SS, Eppig JT,
et al: Gene ontology: Tool for the unification of biology. The Gene
Ontology Consortium. Nat Genet. 25:25–29. 2000. View Article : Google Scholar : PubMed/NCBI
|
|
23
|
Kanehisa M and Goto S: KEGG: Kyoto
encyclopedia of genes and genomes. Nucl Acids Res. 28:27–30. 2000.
View Article : Google Scholar : PubMed/NCBI
|
|
24
|
Carey V and Redestig H: ROC: Utilities for
ROC, with uarray focus, 2003–2019, v. 1.24.0. http://www.bioconductor.org
|
|
25
|
Xie Y, Liu J, Benbrahim-Tallaa L, Ward JM,
Logsdon D, Diwan BA and Waalkes MP: Aberrant DNA methylation and
gene expression in livers of newborn mice transplacentally exposed
to a hepatocarcinogenic dose of inorganic arsenic. Toxicology.
236:7–15. 2007. View Article : Google Scholar : PubMed/NCBI
|
|
26
|
Vizoso M, Puig M, Carmona FJ, Maqueda M,
Velásquez A, Gómez A, Labernadie A, Lugo R, Gabasa M,
Rigat-Brugarolas LG, et al: Aberrant DNA methylation in non-small
cell lung cancer-associated fibroblasts. Carcinogenesis.
36:1453–1463. 2015.PubMed/NCBI
|
|
27
|
Lopomo A, Ricciardi R, Maestri M, De Rosa
A, Melfi F, Lucchi M, Mussi A, Coppedè F and Migliore L:
Gene-specific methylation analysis in thymomas of patients with
myasthenia gravis. Int J Mol Sci. 17(pii): E21212016. View Article : Google Scholar : PubMed/NCBI
|
|
28
|
Ziller MJ, Gu H, Müller F, Donaghey J,
Tsai LT, Kohlbacher O, De Jager PL, Rosen ED, Bennett DA, Bernstein
BE, et al: Charting a dynamic DNA methylation landscape of the
human genome. Nature. 500:477–481. 2013. View Article : Google Scholar : PubMed/NCBI
|
|
29
|
Suzuki M, Chen H, Shigematsu H, Ando S,
Iida T, Nakajima T, Fujisawa T and Kimura H: Aberrant methylation:
common in thymic carcinomas, rare in thymomas. Oncol Rep.
14:1621–1624. 2005.PubMed/NCBI
|
|
30
|
Hirabayashi H, Fujii Y, Sakaguchi M,
Tanaka H, Yoon HE, Komoto Y, Inoue M, Miyoshi S and Matsuda H:
p16INK4, pRB, p53 and cyclin D1 expression and
hypermethylation of CDKN2 gene in thymoma and thymic
carcinoma. Int J Cancer. 73:639–644. 1997. View Article : Google Scholar : PubMed/NCBI
|
|
31
|
Quintanilla-Martinez L, Wilkins EW Jr,
Ferry JA and Harris NL: Thymoma- - morphologic subclassification
correlates with invasiveness and immunohistologic features: A study
of 122 cases. Hum Pathol. 24:958–969. 1993. View Article : Google Scholar : PubMed/NCBI
|
|
32
|
Quintanilla-Martinez L, Wilkins EW Jr,
Choi N, Efird J, Hug E and Harris NL: Thymoma. Histologic
subclassification is an independent prognostic factor. Cancer.
74:606–617. 1994. View Article : Google Scholar : PubMed/NCBI
|
|
33
|
Marx A and Muller-Hermelink HK: Thymoma
and thymic carcinoma. Am J Surg Pathol. 23:739–742. 1999.
View Article : Google Scholar : PubMed/NCBI
|
|
34
|
Li B, Wang B, Niu LJ, Jiang L and Qiu CC:
Hypermethylation of multiple tumor-related genes associated with
DNMT3b up-regulation served as a biomarker for early diagnosis of
esophageal squamous cell carcinoma. Epigenetics. 6:307–316. 2011.
View Article : Google Scholar : PubMed/NCBI
|