Introduction
Cancer stem cells (CSCs) account for a small
proportion of cancer cells and exhibit characteristics of
self-renewal and tumorigenicity (1,2). CSCs
have been demonstrated to serve a vital role in malignant
behaviors, including cancer infiltration, invasion, metastasis, and
resistance to radiotherapy and chemotherapy (3–6). CSCs
have been identified in numerous human cancer types, including
breast, colorectal (CRC), prostate, lung, pancreatic, liver,
gallbladder and renal cancer, as well as in melanoma and glioma.
Therefore, numerous studies have been focused on CSCs (7–14).
The isolation of CSCs is based on the expression of
putative stem cell markers or the side population in a number of
solid tumors types, including breast cancer, brain tumors and
colorectal cancer (15,16). Identified CSC markers include
cluster of differentiation 133 (CD133), CD44, CD34, aldehyde
dehydrogenase (ALDH), ATP binding cassette subfamily F member 2
(ABCG2), C-kit and CD26 (12,17–30).
CD133 is a 120-kDa molecule with five transmembrane domains
(31). Although the physiological
function of CD133 remains unknown, it is considered a marker of
CSCs in a number of human tumor types, including pancreatic cancer,
brain tumor types, hepatocellular cancer, prostate cancer and CRC.
Since O'Brien et al (9) and
Ricci-Vitiani et al (32)
separated stem-like cells from tumor tissues of patients with CRC
based on CD133, an increasing number of studies of colorectal CSCs
have utilized this putative marker, and have provided an important
prerequisite and reliable basis for the present study and follow-up
research.
Although efforts have been made to characterize
CSCs, the molecular pathways utilized in CSCs, as well as the
mechanisms underlying therapy resistance, remain largely unknown.
However, CSCs and cancer cells have been demonstrated to utilize
similar signaling pathways, including Wnt, Notch, Sonic hedgehog,
Bmi-1 and phosphatase and tensin homolog pathways (33,34).
In the present study, CD133+ cells were
sorted from the SW480 CRC cell line by magnetic activated cell
sorting (MACS), and the gene expression profiles of
CD133+ and CD133− cells were analyzed and
compared using gene chip technology and associated software. The
primary genes and proteins associated with the mitogen-activated
protein kinase (MAPK) and p53 signaling pathways were
differentially expressed in CD133+ cells. These
observations were verified by reverse transcription-quantitative
polymerase chain reaction (RT-qPCR) and western blotting in
vitro. Investigation of gene expression profiles will be
crucial for elucidating the characteristics of colon CSCs, with
potential benefits for the development of drugs and other novel
therapeutic methods targeting CSCs.
Materials and methods
Ethics statement
Ethical approval for the present study was obtained
from the ethics committee of Nanfang Hospital, Southern Medical
University (Guangzhou, China). Written informed consent was
obtained from all patients and all clinical investigations were
conducted according to the principles expressed in the Declaration
of Helsinki. All animal experimental procedures were conducted in
strict accordance with the recommendations of the relevant national
and international guidelines for the care and use of laboratory
animals (35). The protocol was
approved by the Committee on the Ethics of Animal Experiments of
the Department of Laboratory Animal Science, Southern Medical
University. All efforts were made to minimize suffering.
Patient tissue specimens
CRC tissue fragments were obtained from 74 patients
undergoing resection of colon adenocarcinoma between November 2007
and December 2010, including 45 males and 29 females. The patients
were between 28–84 years old (mean age, 56 years), containing 32
cases located on the rectum, 14 cases on the sigmoid colon, 15
cases on the right colon, 9 cases on the left colon and 4 cases on
the transverse colon. Written informed consent was obtained for
tumor tissue collection and its use in pathological and
immunohistochemical studies according to the ethical standards of
the institutional review boards for human research at Nanfang
Hospital, Southern Medical University and Shanxi Provincial Cancer
Hospital (Taiyuan, China). Histological grade, tumor stage and
tumor size were classified according to the standards of the
International Union Against Cancer Tumor-Node-Metastasis
classification system (36). Tissue
samples were fixed by 10% formalin for 24 h at 37°C, embedded in
paraffin, sliced at 5 µm and stained with 0.2% hematoxylin for 3
min and 0.5-1% eosin for 1 min at 37°C. The slices were then
subjected to microscopic pathological diagnosis by two pathologists
(Department of Pathology, Nanfang Hospital, Southern Medical
University), who were unaware of the clinical observations.
Immunohistochemical study
Immunohistochemical staining for CD133 staining was
performed using mouse anti-CD133 antibody (cat. no. AC133; Miltenyi
Biotec GmbH, Bergisch Gladbach, Germany), as described previously
(37). The slides were incubated
with 1% bovine serum albumin (cat. no. B2064; Sigma-Aldrich; Merck
KGaA, Darmstadt, Germany) for 1 h at 4°C to block non-specific
binding. Subsequently, each slide was incubated overnight at 4°C
with anti-CD133 antibody at a dilution of 1:100, washed 3 times
with PBS and then incubated with 50 µl horseradish
peroxidase-labeled goat anti-mouse IgG (cat. no. TA130004; 1:100;
Origene Technologies, Inc., Beijing, China) for 2 h at room
temperature. The results of immunohistochemical CD133 expression
were interpreted by Fromowitz semi-quantitative method (38). The intensity of staining and the
percentage of staining positive cells was recorded in 10 high power
fields, and the combination of the two methods were used to score,
as follows: 0, negative (−); 1–2, positive (+/++); 3, strong
positive (+++). A BX40 Optical microscope (magnification, ×200;
Olympus Corporation, Tokyo, Japan) and MODEL5410 Research Grade
Inverted Universal Material Fluorescent Microscope (Carl Zeiss AG,
Oberkochen, Germany) were used.
Cell culture
The human CRC cell lines SW480, SW620, LoVo, HCT116,
HT29 and Colo205 (American Type Culture Collection, Manassas, VA,
USA) were cultured in RPMI-1640 (Hyclone; GE Healthcare Life
Sciences, Logan, UT, USA) supplemented with 10% fetal bovine serum
(FBS; Gibco; Thermo Fisher Scientific, Inc., Waltham, MA, USA), 100
U/ml penicillin G, and 100 µg/ml streptomycin (Gibco; Thermo Fisher
Scientific, Inc.). All cells were maintained at 37°C in a
humidified 5% CO2 incubator.
CD133+ SW480 cells were selected by MACS
using a CD133 Isolation kit (Miltenyi Biotec GmbH). This was
conducted by centrifuging the cell suspension (300 × g for 10 min
at room temperature), aspirating the supernatant completely and
resuspending the cell pellet in 60 µl sorting buffer (containing
0.01 M PBS and 2 mM ethylenediamine tetraacetic acid) per
1×10⁷ total cells. Subsequently, 20 µl FcR Blocking
reagent and 20 µl CD133 MicroBeads-Tumor Tissue (Miltenyi Biotec
GmbH) was added per 1×10⁷ total cells. Following this,
the cells were mixed well and incubated for 15 min in a
refrigerator (2–8°C) under slow, continuous rotation using a
MACSmix Tube Rotator. The cells were washed twice with sorting
buffer and the supernatant was aspirated completely. Following
this, magnetic separation was conducted. The cell suspension is
loaded onto a MACS Column, which is placed in the magnetic field of
a MACS Separator. The magnetically labeled CD133+ cells
are retained within the column. The unlabeled cells run through;
this cell fraction is thus depleted of CD133+ cells.
After removing the column from the magnetic field, the magnetically
retained CD133+ cells can be eluted as the positively
selected cell fraction. To increase the purity, the positively
selected cell fraction containing the CD133+ cells must
be separated over a second column. MACS Column or MACS Separator
were selected for use according to the number of total cells and
the number of CD133+ cells. The enriched population of
CD133+ cells was then suspended in serum-free culture
system/medium, which contained Dulbecco's modified Eagle's
medium/F12 (cat. no. SH30023.01; Hyclone; GE Healthcare Life
Sciences), B27 (dilution 1:50; cat. no. 17504-044; Invitrogen;
Thermo Fisher Scientific, Inc.), F12 EGF (20 ng/ml; cat. no. E5306;
Sigma-Aldrich; Merck KGaA) and bFGF (10 ng/ml; cat. no. 233-FB-025;
R&D Systems, Inc., Minneapolis, MN, USA).
Flow cytometry assay
CD133 protein expression on the cell membrane was
analyzed by flow cytometry in the 6 human CRC cell lines, in the
logarithmic growth phase. Cells were digested with 0.25% trypsin
and 1 mM EDTA. Following incubation with 10 µl FcR blocking reagent
for 10 min at 4°C (dilution, 1:50; cat. no. 130-092-575; Miltenyi
Biotec GmbH), to reduce unwanted binding of antibody to Fc
receptor-expressing cell, tumor cells were washed twice by washing
buffer (containing 0.01 M PBS, 0.5% bovine serum albumin and 2 mM
ethylenediamine tetraacetic acid) and resuspended at a
concentration of 1×10⁶ cells/ml. Subsequently,
CD133/2-PE antibody (dilution, 1:50; cat. no. 130-112-315; Miltenyi
Biotec GmbH) was added, mixed well and incubated for 10 min in the
dark at 4°C. The CD133/2-PE antibody dilution for labeling of cells
and subsequent analysis by flow cytometry was 1:50 for
1×10⁶ cells/100 µl. Cell membrane CD133 protein
expression was detected with a flow cytometer. Anti-IgG1 antibody
(4°C for 10 min; dilution 1:50; cat. no. 130-117-098; Miltenyi
Biotec GmbH) was utilized as a negative control. Data were acquired
and analyzed using the FlowJo 10.0 software (FlowJo LLC, Ashland,
OR, USA).
MACS
CD133+ and CD133− cells were
separated by MACS using a CD133 Isolation kit, according to the
manufacturer's protocols. After adding 10 µl FcR (dilution, 1:50)
blocking reagent per 1×10⁸ total cells at 37°C for 15
min, cells were immediately incubated with CD133/1-PE antibody
(dilution 1:50; cat. no. 130-110-962; Miltenyi Biotec GmbH)
directly labeled with supermagnetic microbeads for 30 min at 4-8°C.
The cells were then washed by adding 1–2 ml separation buffer and
centrifuged at 300 × g for 10 min at 4–8 °C. The pellet was
resuspended in 500 µl separation buffer and processed to final
separation using a Mini-MACs Separator Column (Miltenyi Biotec
GmbH). Positively-labeled CD133+ cells were flushed with
2 ml separation buffer (containing 0.01 M PBS and 2 mM
ethylenediamine tetraacetic acid) using a plunger fitted to the
column, centrifuged for 5 min at 300 × g at 4–8 °C, and washed with
washing buffer. Cell numbers and viability were determined using a
hemocytometer with the standard trypan blue method (0.4% trypan
blue; Invitrogen; Thermo Fisher Scientific, Inc.) (39). To assess the sorting, selected cells
were incubated with CD133/2-PE antibody and analyzed using flow
cytometry as aforementioned.
Primary xenografts
Non-obese diabetic/severe combined immune deficiency
(NOD/SCID) mice weighing 20–25 g (n=5; male; 10–12 weeks old) were
purchased from the Laboratory Animal Center at Southern Medical
University (Guangzhou, China) and used to evaluate the
tumorigenesis of CD133+ and CD133− SW480
cells sorted by MACS in vivo. Mice were allowed to
acclimatize for 1 week after arrival. All animals were maintained
in a sterile environment with a daily 12/12 h light/dark cycle, the
ambient temperature was maintained at 20–26 °C and the relative
humidity ass 40–70 %. All animals were fed with relatively stable
full-price nutritional feed and sterilized drinking water, which
was added and replaced 3–4 times a week. After resuspension in 100
µl PBS, CD133+ and CD133− SW480 cells
(1×10⁴ cells/ml) were mixed with 100 µl Matrigel
(Becton, Dickinson and Company, Franklin Lakes, NJ, USA) and
injected subcutaneously into the left and right abdominal walls,
respectively (n=5 mice). Tumor volume was observed weekly for 5
weeks. All animal experiments were conducted in strict accordance
with the National Institute of Health Guide for the Care and Use of
Laboratory Animals (35).
RNA extraction and gene microarray
analysis
Total RNA was extracted from CD133+ and
CD133− cells sorted from SW480 cells by MACS using
TRIzol® reagent (Invitrogen; Thermo Fisher Scientific,
Inc.). The quality and quantity of total RNA were estimated using a
NanoDrop 2000c spectrophotometer (Thermo Fisher Scientific, Inc.).
An aliquot of 500 ng total RNA was reverse transcribed into cDNA
using a PrimeScript® RT reagent kit (cat. no. DRR037A;
Takara Bio, Inc., Otsu, Japan).
Microarray analysis was performed according to the
standard protocol (40) provided by
CapitalBio Technology, Inc. (Beijing, China). cDNA labeled with a
fluorescent dye (Cy5 and Cy3-dCTP) was prepared with the Eberwine's
linear RNA amplification method (41) and subsequent enzymatic reaction. As
a measure of technical replication, dye-swap experiments were
performed on each of the biological samples. Arrays were scanned
with a LuxScan 10KA dual channel laser scanner (CapitalBio
Technology, Inc.) and the images obtained were then analyzed using
LuxScan™ 3.0 software (CapitalBio Technology, Inc.). Space-and
intensity-dependent normalization based on the LOWESS program was
employed (42,43). Statistical analysis of Pathway
(https://www.kegg.jp/) and Gene Ontology (GO)
terms was performed in the Molecular Annotation System V4.0
(http://www.capitalbio.com/lifescience/informationsystems/2572.shtml),
a web client program for interactive navigation within the
knowledge bases, by selecting the differentially expressed genes.
Data analysis utilized Pathway and GO saliency statistics. The
results demonstrated the differentially expressed pathways that
were involved in significant Pathway and GO terms.
RT-qPCR
Total RNA was extracted from CD133+ and
CD133− SW480 cells sorted by MACS using TRIzol reagent.
cDNA synthesis was performed using a reverse transcription kit
(Invitrogen; Thermo Fisher Scientific, Inc.), according to the
manufacturer's protocol. RT-qPCR was performed using a
SYBR® Premix Ex Taq™ II kit (cat. no. DRR081A; Takara
Bio, Inc.) with an ABI 7500 RT-qPCR System (Applied Biosystems;
Thermo Fisher Scientific, Inc.) according to the manufacturer's
protocols. The reaction condition was as follows: 95°C for 2 min,
95°C for 15 sec and 60°C for 30 sec for a total of 40 cycles. The
primers used [including p53, AKT1, transforming growth
factor β receptor 2 (TGFBR2), ATP binding cassette subfamily
B member 6 (ABCB6), cyclin dependent kinase 1 (CDC2),
checkpoint kinase 1 (CHEK1), cyclin dependent kinase
inhibitor 1A (CDKN1A) and cyclin B1 (CCNB1)] are
listed in Table I. Expression
levels of the GAPDH were used for normalization and
quantification of gene expression 2−ΔΔCq levels
(44).
 | Table I.Sequence of the amplification primers
in the 5′ to 3′ orientation. |
Table I.
Sequence of the amplification primers
in the 5′ to 3′ orientation.
| Gene | Primer (5′-3′) |
|---|
| CD133 | F:
GACCGACTGAGACCCAA |
|
| R:
TGGTTTGGCGTTGTACTCTG |
| p53 | F:
ATGAGCCGCCTGAGGTTG |
|
| R:
AGCTGTTCCGGAGGCCCA |
| ABCG2 | F:
CTGAGATCCTGAGCCTTTGG |
|
| R:
TGCCCATCACAACATCATCT |
| CHEK1 | F:
TGTTGGATGAAAGGGATAAC |
|
| R:
AAACATCAACTGGTTCTGC |
| CDKN1A | F:
GACTCTCAGGGTCGAAAACG |
|
| R:
GGATTAGGGCTTCCTCTTGG |
| CDC2 | F:
AGCTGCACTCCCAATAATGA |
|
| R:
CGAGAGCAAATCCAAGCCAT |
| CCNB1 | F:
TATGCAGCACCTGGCTAAGA |
|
| R:
CATGCTTCGATGTGGCATAC |
| AKT1 | F:
TAGAGTGTGCGTGGCTCTCA |
|
| R:
CTGAATCCCGAGAGGCCAA |
| ABCB6 | F:
GCACCATCCTCAAGGCTCCGGGCATC |
|
| R:
CCGTTCCATGGTCTGAGGCTTAGTGT |
| TGFBR2 | F:
AGATGGCTCGCTGAACACTACCAA |
|
| R:
AGAATCCTGCTGCCTCTGGTCTTT |
| GAPDH | F:
AAGGACTCATGACCACAGT |
|
| R:
CCATCACGCCACAGTTTCC |
Protein extraction and western
blotting
Total protein was purified from CD133+
and CD133− SW480 cells sorted by MACS. Following adding
radioimmunoprecipitation lysis buffer (containing 0.01 M PBS and 2
mM ethylenediamine tetraacetic acid), samples were centrifuged at
12,000 × g for 20 min at 4°C. Protein concentrations in the
supernatants were measured using a bicinchoninic acid assay kit
(Pierce; Thermo Fisher Scientific, Inc.), according to the
manufacturer's protocols. Western blotting was performed by
electrophoresis of 30 µg protein on a 10% SDS-PAGE followed by
transfer to a polyvinylidene fluoride membrane (EMD Millipore,
Billerica, MA, USA). The membrane was blocked by incubation in
Tris-buffered saline (TBS) containing 0.1% Tween (TBS-T) and 5%
nonfat dry milk for 1 h at room temperature, and washed three times
with TBS-T. The membranes were incubated with antibodies against
extracellular signal-regulated kinase (ERK)1/2, c-Jun N-terminal
kinase (JNK), p38, phosphor (p)-ERK1/2, p-p38, p-JNK (all from the
same kit; cat. no. 9926), p-CDC2, p-p53, p-CHEK1, p-CHEK2,
p-retinoblastoma 1 (Rb1) and p-Rb2 (all from the same kit; cat. no.
9917) (all dilutions, 1:1,000; all from Cell Signaling Technology,
Inc., Danvers, MA, USA), and β-actin and β-tubulin (all dilutions,
1:200; all from Santa Cruz Biotechnology, Inc., Dallas, TX, USA)
overnight at 4°C. The blots were washed three times with TBS-T and
incubated with the appropriate horseradish peroxidase-conjugated
anti-rabbit IgG secondary antibodies (1:2,000; Origene
Technologies, Inc.) for 1 h at room temperature. Following
incubation with the secondary antibody, the membranes were washed
again three times with TBS-T. The blots were developed by enhanced
chemiluminescence (ECL) using a chemiluminescence ECL Western
Blotting Detection kit reagent (BioVision, Inc., Milpitas, CA, USA)
and detected using the LAS-3000 imaging system.
Statistical analysis
Statistical analysis was performed using Microsoft
Office Excel 2007 (Microsoft Corporation, Redmond, WA, USA) and
SPSS 13.0 statistical software (SPSS, Inc., Chicago, IL, USA). The
frequencies of CD133+ expression under different
features of patients were provided. In the association analysis of
CD133 expression with features of patients, the CD133+
expression between two groups were compared using Mann-Whitney
U-test and between multiple groups were compared using
Kruskal-Wallis H-test. If the multiple groups comparison was
significant, a post-hoc test using Mann-Whitney U-test with
Bonferroni's P-value adjust method was performed. The expression of
associated genes and proteins in CD133+ (+/++/+++) and
CD133− cell groups were compared using two independent
samples Student's t-tests. Two-sided P<0.05 was considered to
indicate a statistically significant difference.
Results
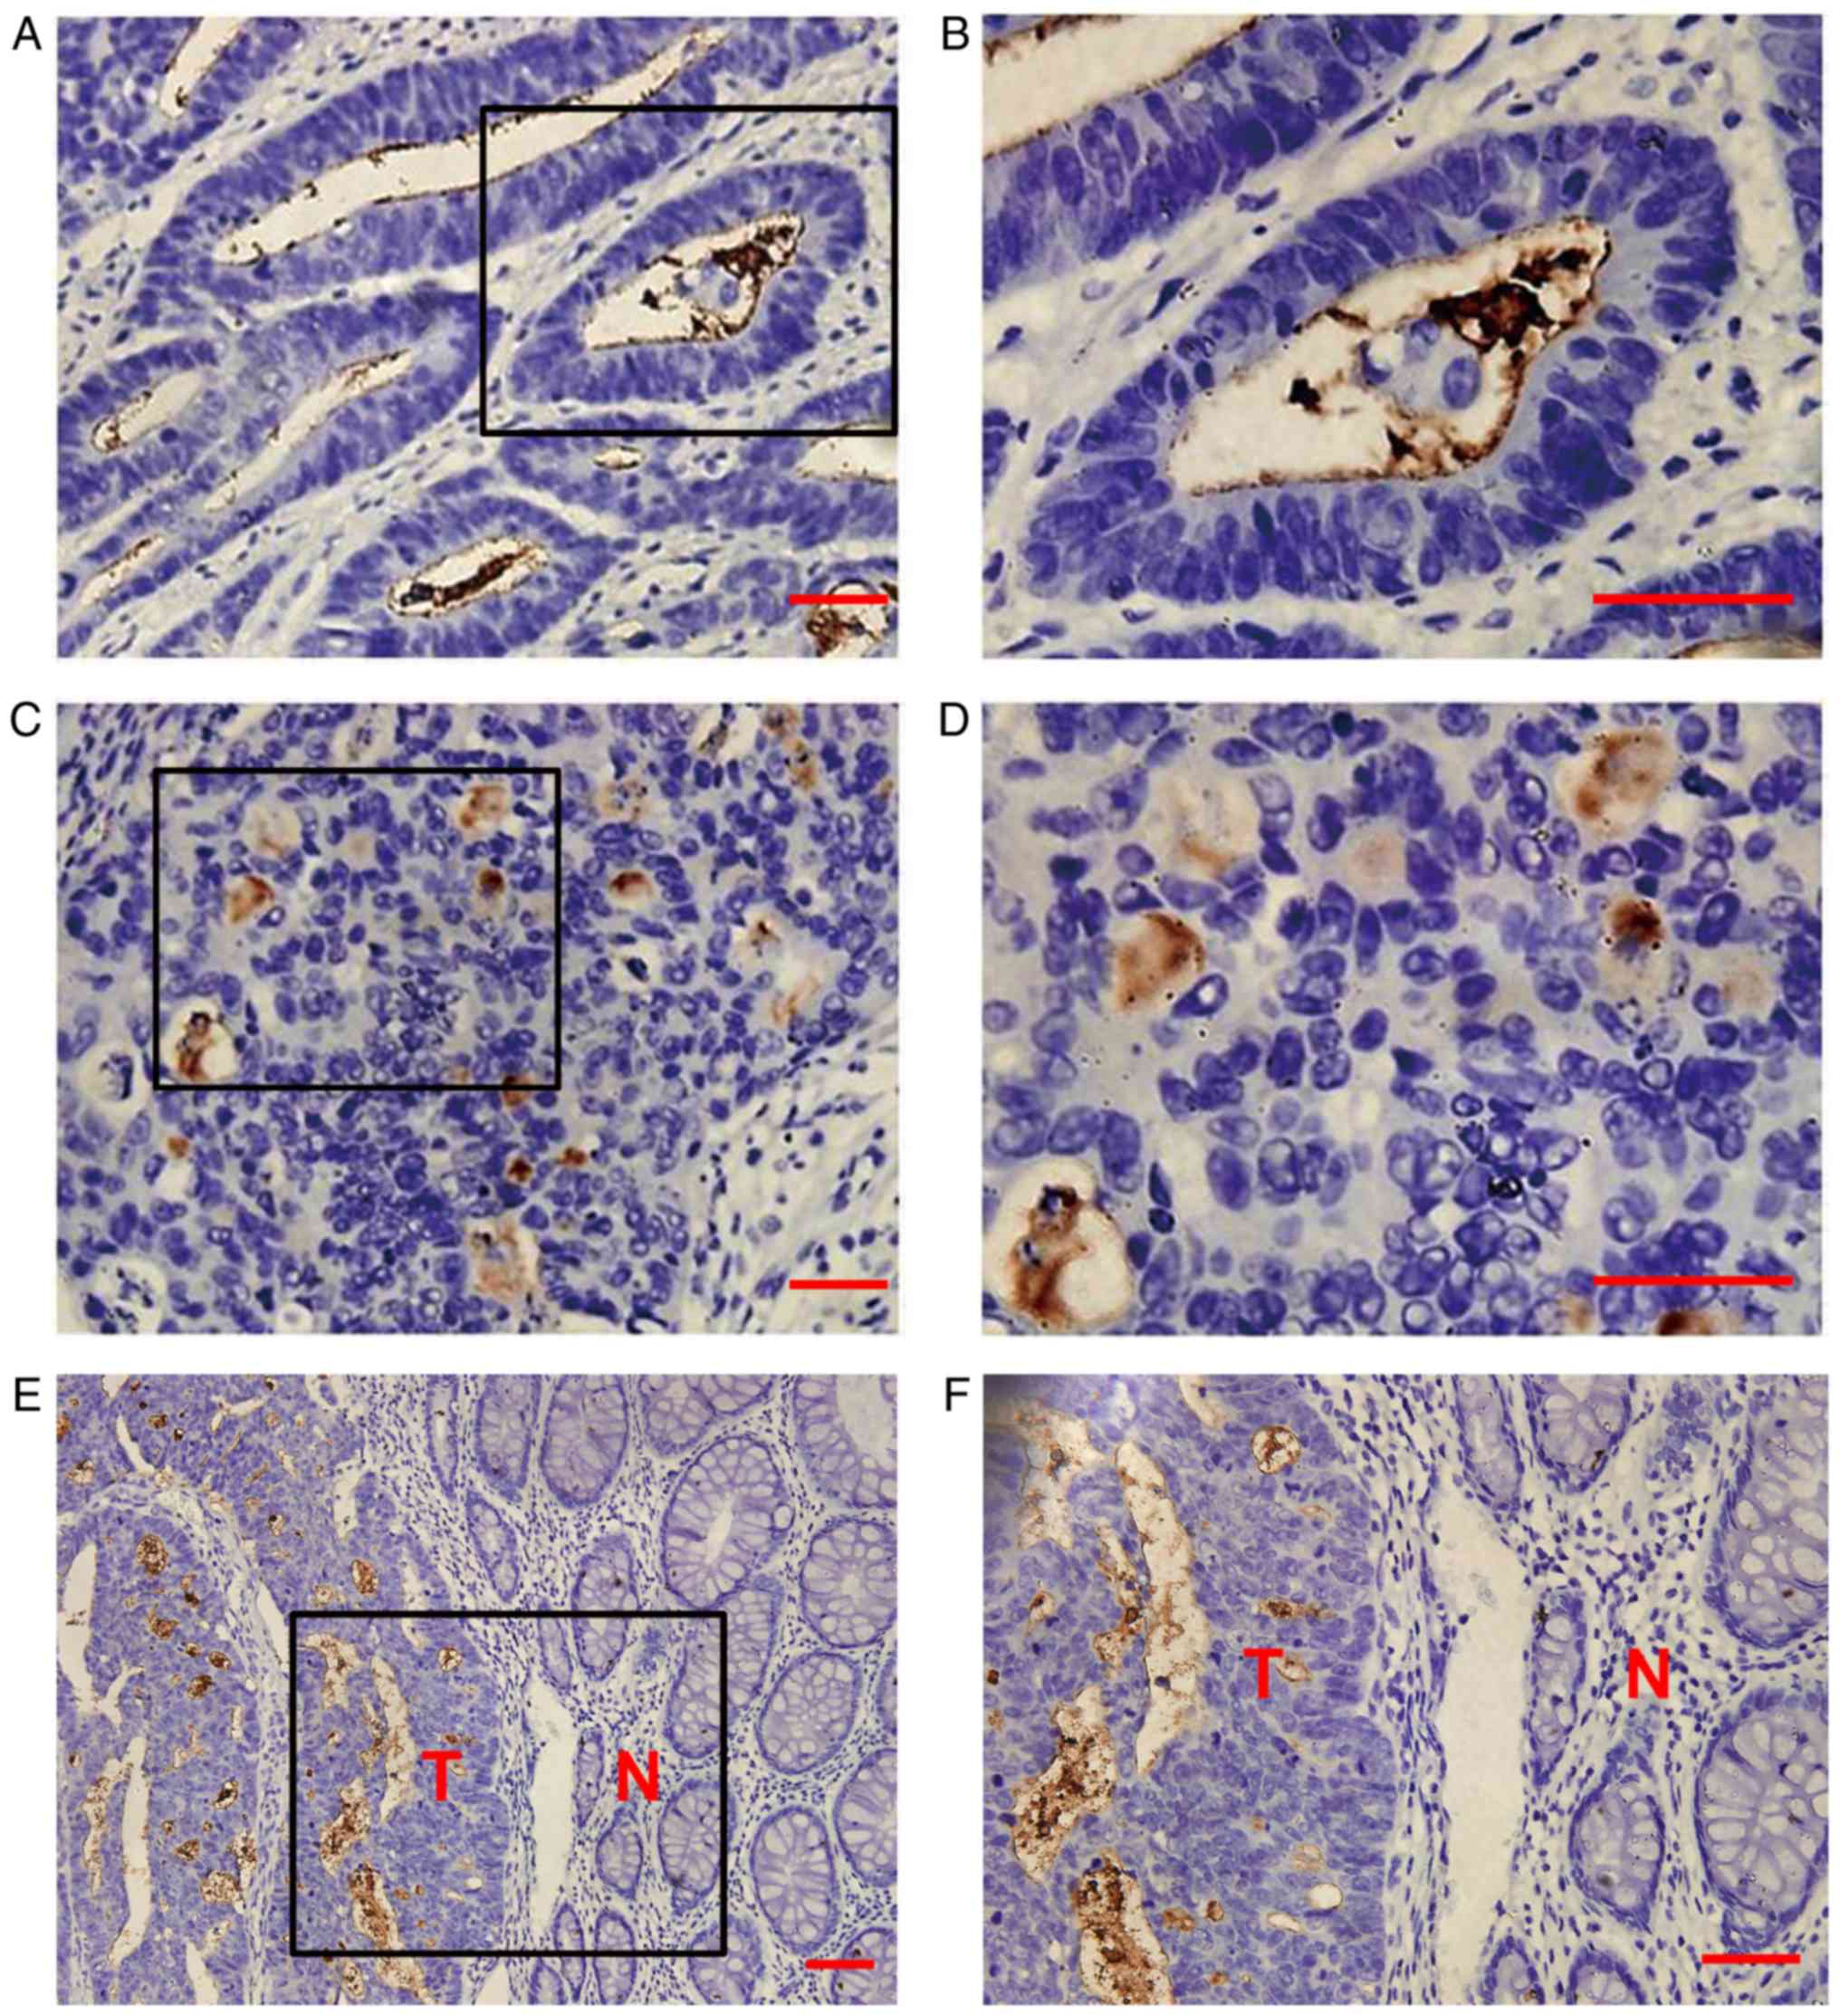
High CD133 expression is associated
with disease progression in CRC
Previous studies on the biological importance of
CSCs identified human CD133 as a representative marker for CSCs
(5,9,24,25).
Although previous studies reported that CD133 expression was
associated with lymph node metastasis (45–47),
there is limited knowledge regarding other clinical outcomes
associated with high-CD133-expressing CRCs. Therefore, CD133
expression levels in CRC tissues from 74 patients were examined by
immunohistochemistry. CD133 protein was overexpressed in 25 tissues
(33.8%) and exhibited reduced expression in para-cancerous tissues
(Fig. 1A-F). Consistent with
previous results, CD133 overexpression was not significantly
associated with age, sex, location or classification, but CD133
expression was significantly increased in patients with poorly
differentiated tumors (P=0.021) and distant metastasis (P=0.007).
The patients were further divided into those with lower stage (no
lymph node involvement or distant metastasis) and higher stage
(presence of lymph node and/or distant metastasis) tumors, and it
was demonstrated that CD133 overexpression was also significantly
associated with tumor stage (P=0.018). These results indicated that
CD133 overexpression is associated with disease progression in CRC
(Table II).
| Table II.Association of CD133 expression with
features of patients with colorectal cancer (n=74). |
Table II.
Association of CD133 expression with
features of patients with colorectal cancer (n=74).
|
|
|
CD133+ |
|
|
|---|
|
|
|
|
|
|
|---|
| Clinicopathological
feature | n | − | +/++ | +++ | χ2 or Z
value | P-value |
|---|
| Sex | 74 |
|
|
| −1.546 | 0.122a |
|
Male | 45 | 33 | 8 | 4 |
|
|
|
Female | 29 | 16 | 9 | 4 |
|
|
| Age (years) |
|
|
|
| 0.026 | 0.872a |
|
≤60 | 38 | 26 | 9 | 3 |
|
|
|
>60 | 36 | 24 | 7 | 5 |
|
|
| Localization |
|
|
|
| 2.967 | 0.563b |
|
Rectum | 32 | 19 | 9 | 4 |
|
|
| Sigmoid
colon | 14 | 11 | 3 | 0 |
|
|
| Right
colon | 15 | 10 | 3 | 2 |
|
|
| Left
colon | 9 | 7 | 2 | 0 |
|
|
|
Transverse colon | 4 | 2 | 2 | 0 |
|
|
| Classification |
|
|
|
| −1.398 | 0.162a |
|
Adenocarcinoma | 66 | 42 | 16 | 8 |
|
|
|
Mucinous adenocarcinoma | 8 | 7 | 1 | 0 |
|
|
| Grade |
|
|
|
| 7.683 | 0.021c |
|
High | 13 | 11 | 2 | 0 |
|
|
|
Moderate | 36 | 24 | 9 | 3 |
|
|
|
Low | 17 | 7 | 5 | 5 |
|
|
| TNM stage |
|
|
|
| 10.115 | 0.018b |
| I | 13 | 11 | 2 | 0 |
|
|
|
IIA+IIB | 30 | 18 | 10 | 2 |
|
|
|
IIIA+IIIB+IIIC | 21 | 17 | 1 | 3 |
|
|
| IV | 10 | 3 | 4 | 3 |
|
|
| Distal
metastasis |
|
|
|
| −2.719 | 0.007a |
|
Positive | 10 | 3 | 4 | 3 |
|
|
|
Negative | 64 | 46 | 13 | 5 |
|
|
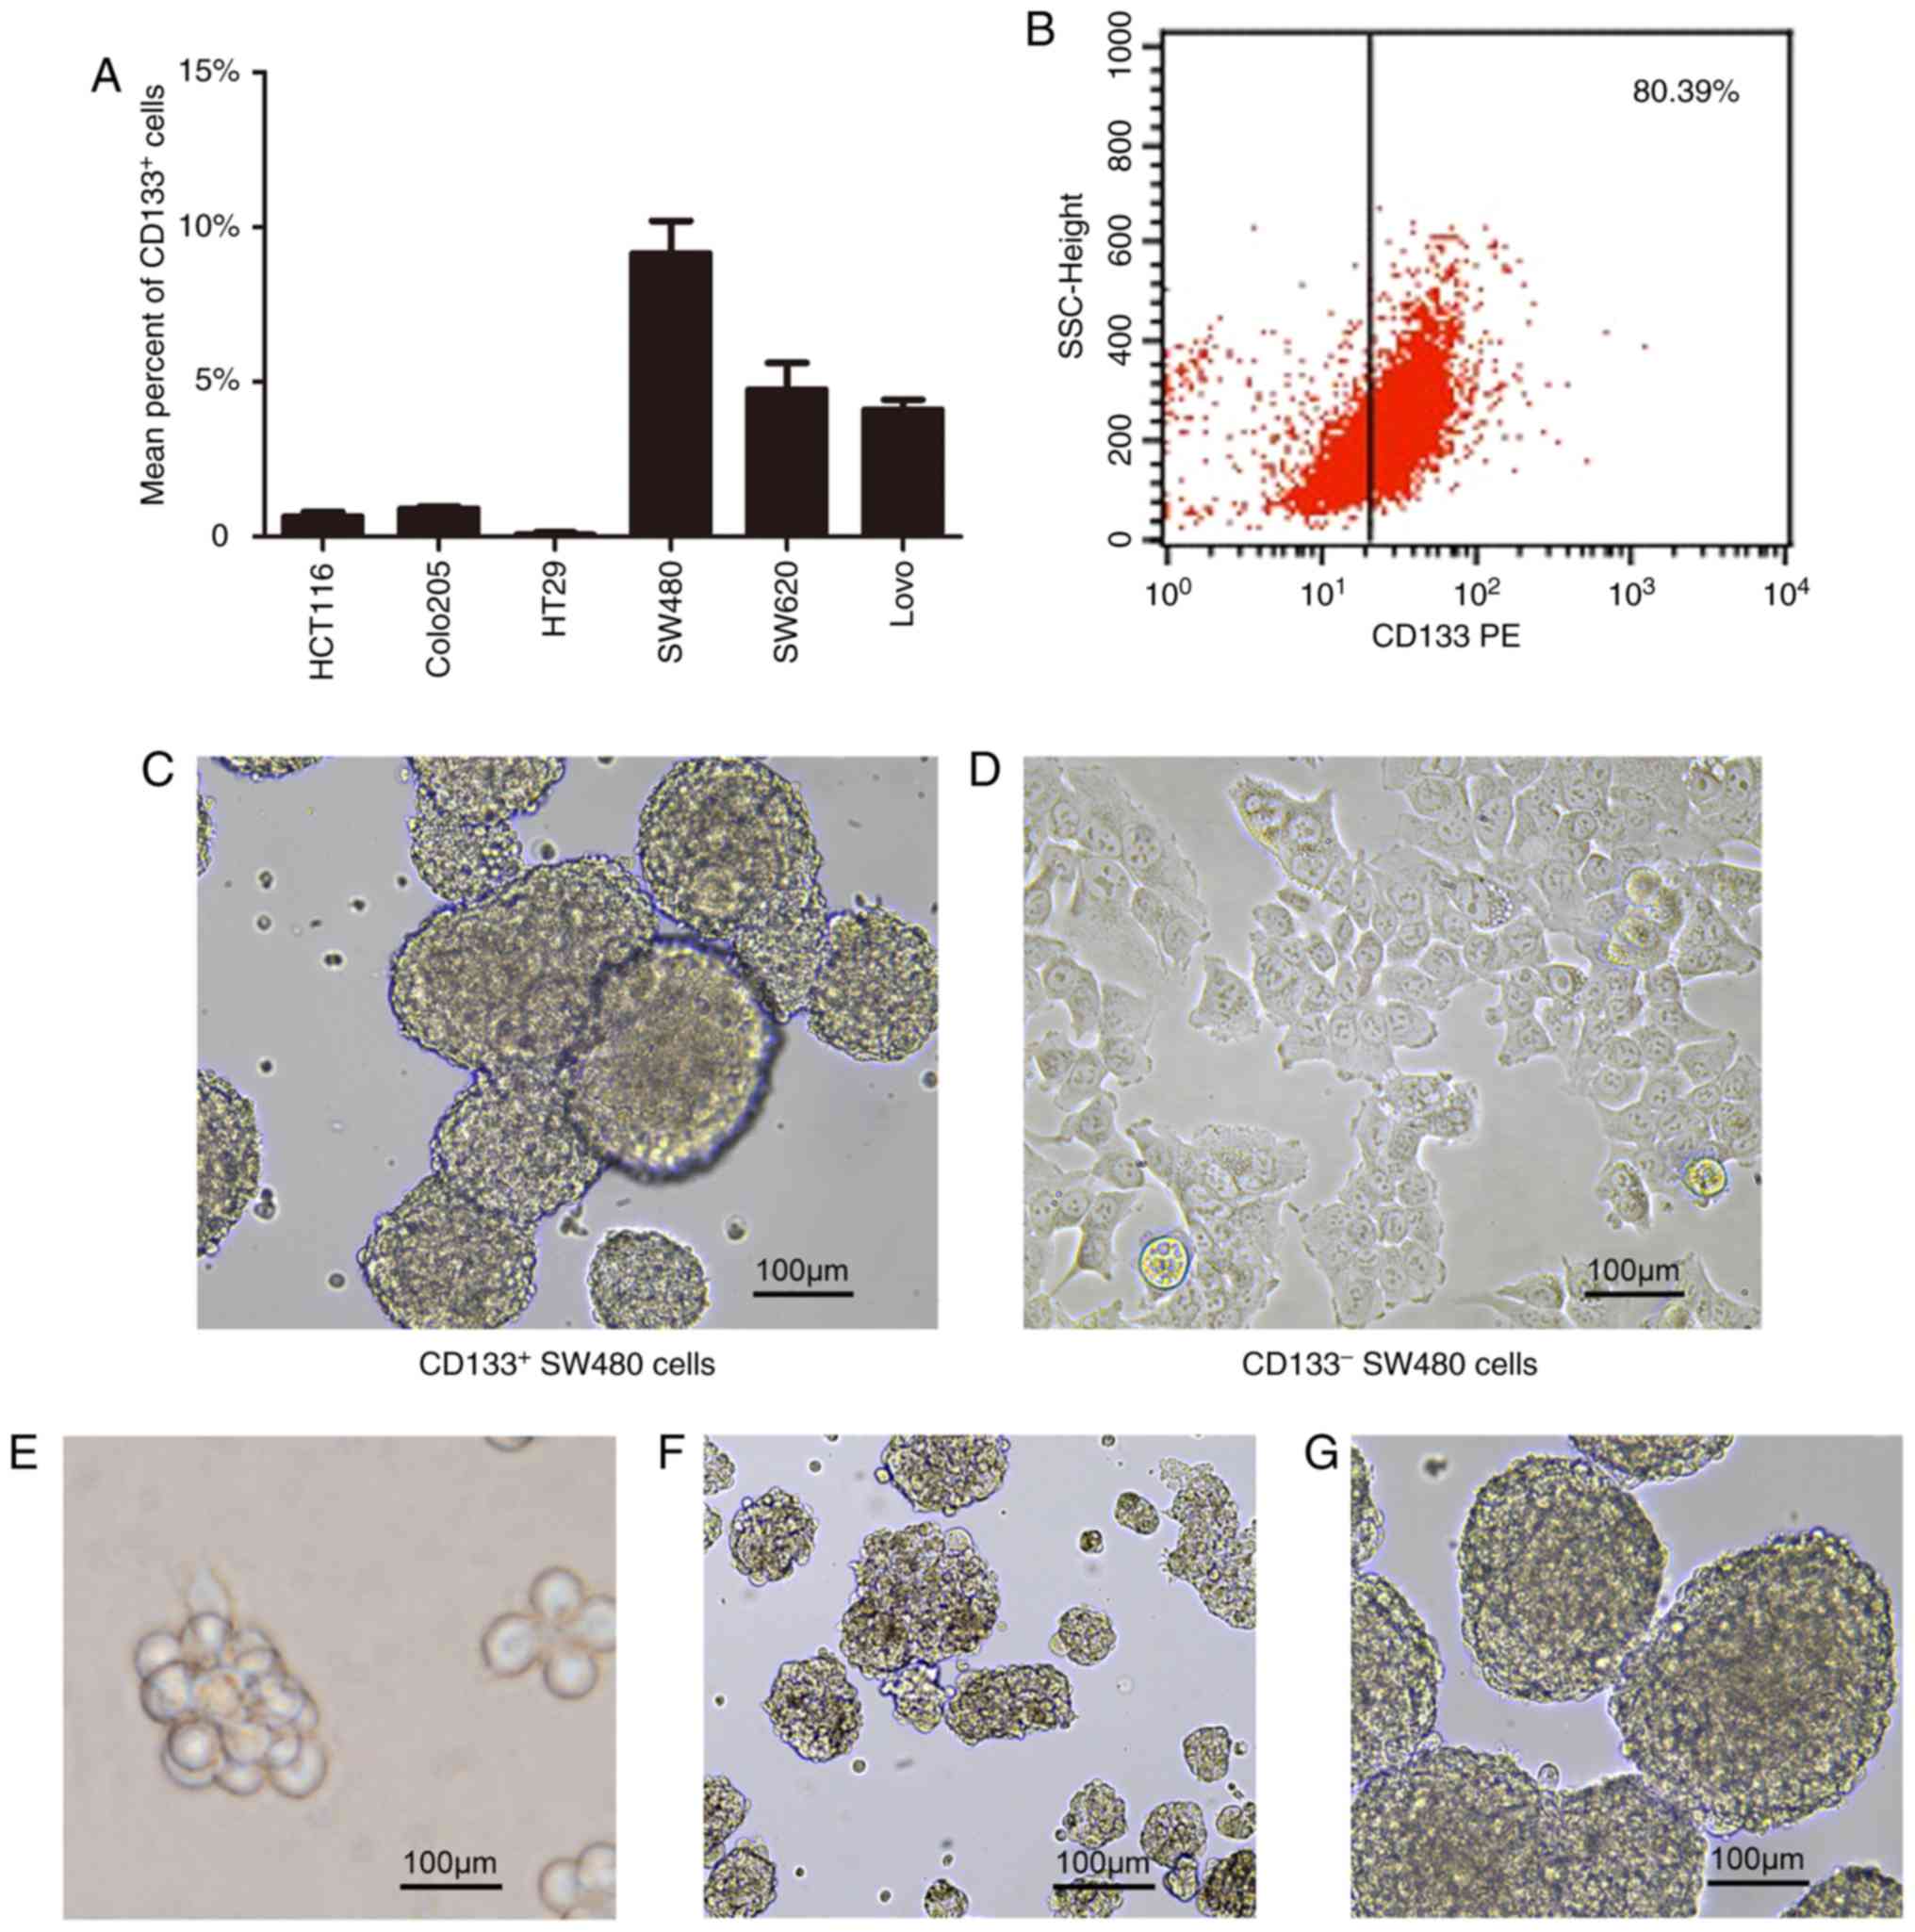
Isolated CD133+ cells
exhibit stem-like features in vitro
The CSCs obtained from CRC cell lines were
characterized by selection in serum-free culture system. Previous
studies demonstrated that CD133 is an appropriate marker for
detecting colon CSCs in primary tumor and cancer cell lines
(32–37). Therefore, the percentage of
CD133+ cells was assessed using flow cytometry. The
proportions of CD133+ cells were increased in SW480,
SW620 and LoVo cell lines, compared with the other three cell lines
examined, with the highest proportion (9.16%) in SW480 cells
(Fig. 2A). CD133+ and
CD133− cells were then purified from SW480 cells by MACS
using a CD133 Isolation kit. The purity of CD133+ cells
after the first separation was ~30%, but this increased
substantially to >80% following the second separation (Fig. 2B). The enriched population of
CD133+ cells was then suspended in serum-free culture
system and grown as single cells, compared with CD133−
cells (Fig. 2C and D). Subsequently
the molecular features of colon CSCs were investigated by examining
the expression of genes involved in stem cell-associated pathways
by RT-qPCR in CD133+ and CD133−
populations.
CD133+ cells obtained from CRC cell lines
have been reported to be able to proliferate as sphere-like
cellular aggregates in serum-free stem cell medium (32). Therefore, the enriched population of
CD133+ cells was suspended in serum-free culture system
and grown as single cells. In the first 2–3 days of culture, the
majority of the cells began to proliferate, while a number of the
cells died, and cell debris was observed at the bottom of the Petri
dishes. On the 5th day, the cells continued to grow and formed
tumor spheres with bright refraction and round shapes, but cell
shapes or cell-cell boundaries could not be accurately
distinguished. Once the size of the spheres reached 75–100 µm, they
could be passaged. As the passage number increased, it was observed
that the size of the tumor spheres remained relatively unchanged
while their shape became more spherical (Fig. 2E-G). In the serum-free culture
system, CRC stem cells were gradually enriched. In order to make
the visual field clearer, enriched CRC stem cells were inoculated
into a 96-well plate and to ensure that there was a single sphere
in each field of view. The spheres were then imaged and their
entire growth process was observed. CD133+ cells
re-cultured in serum-containing medium adhered to the dish walls
and formed a monolayer. These results demonstrated that
CD133+ SW480 cells possessed stem/progenitor cell-like
properties, including differentiation capacity.
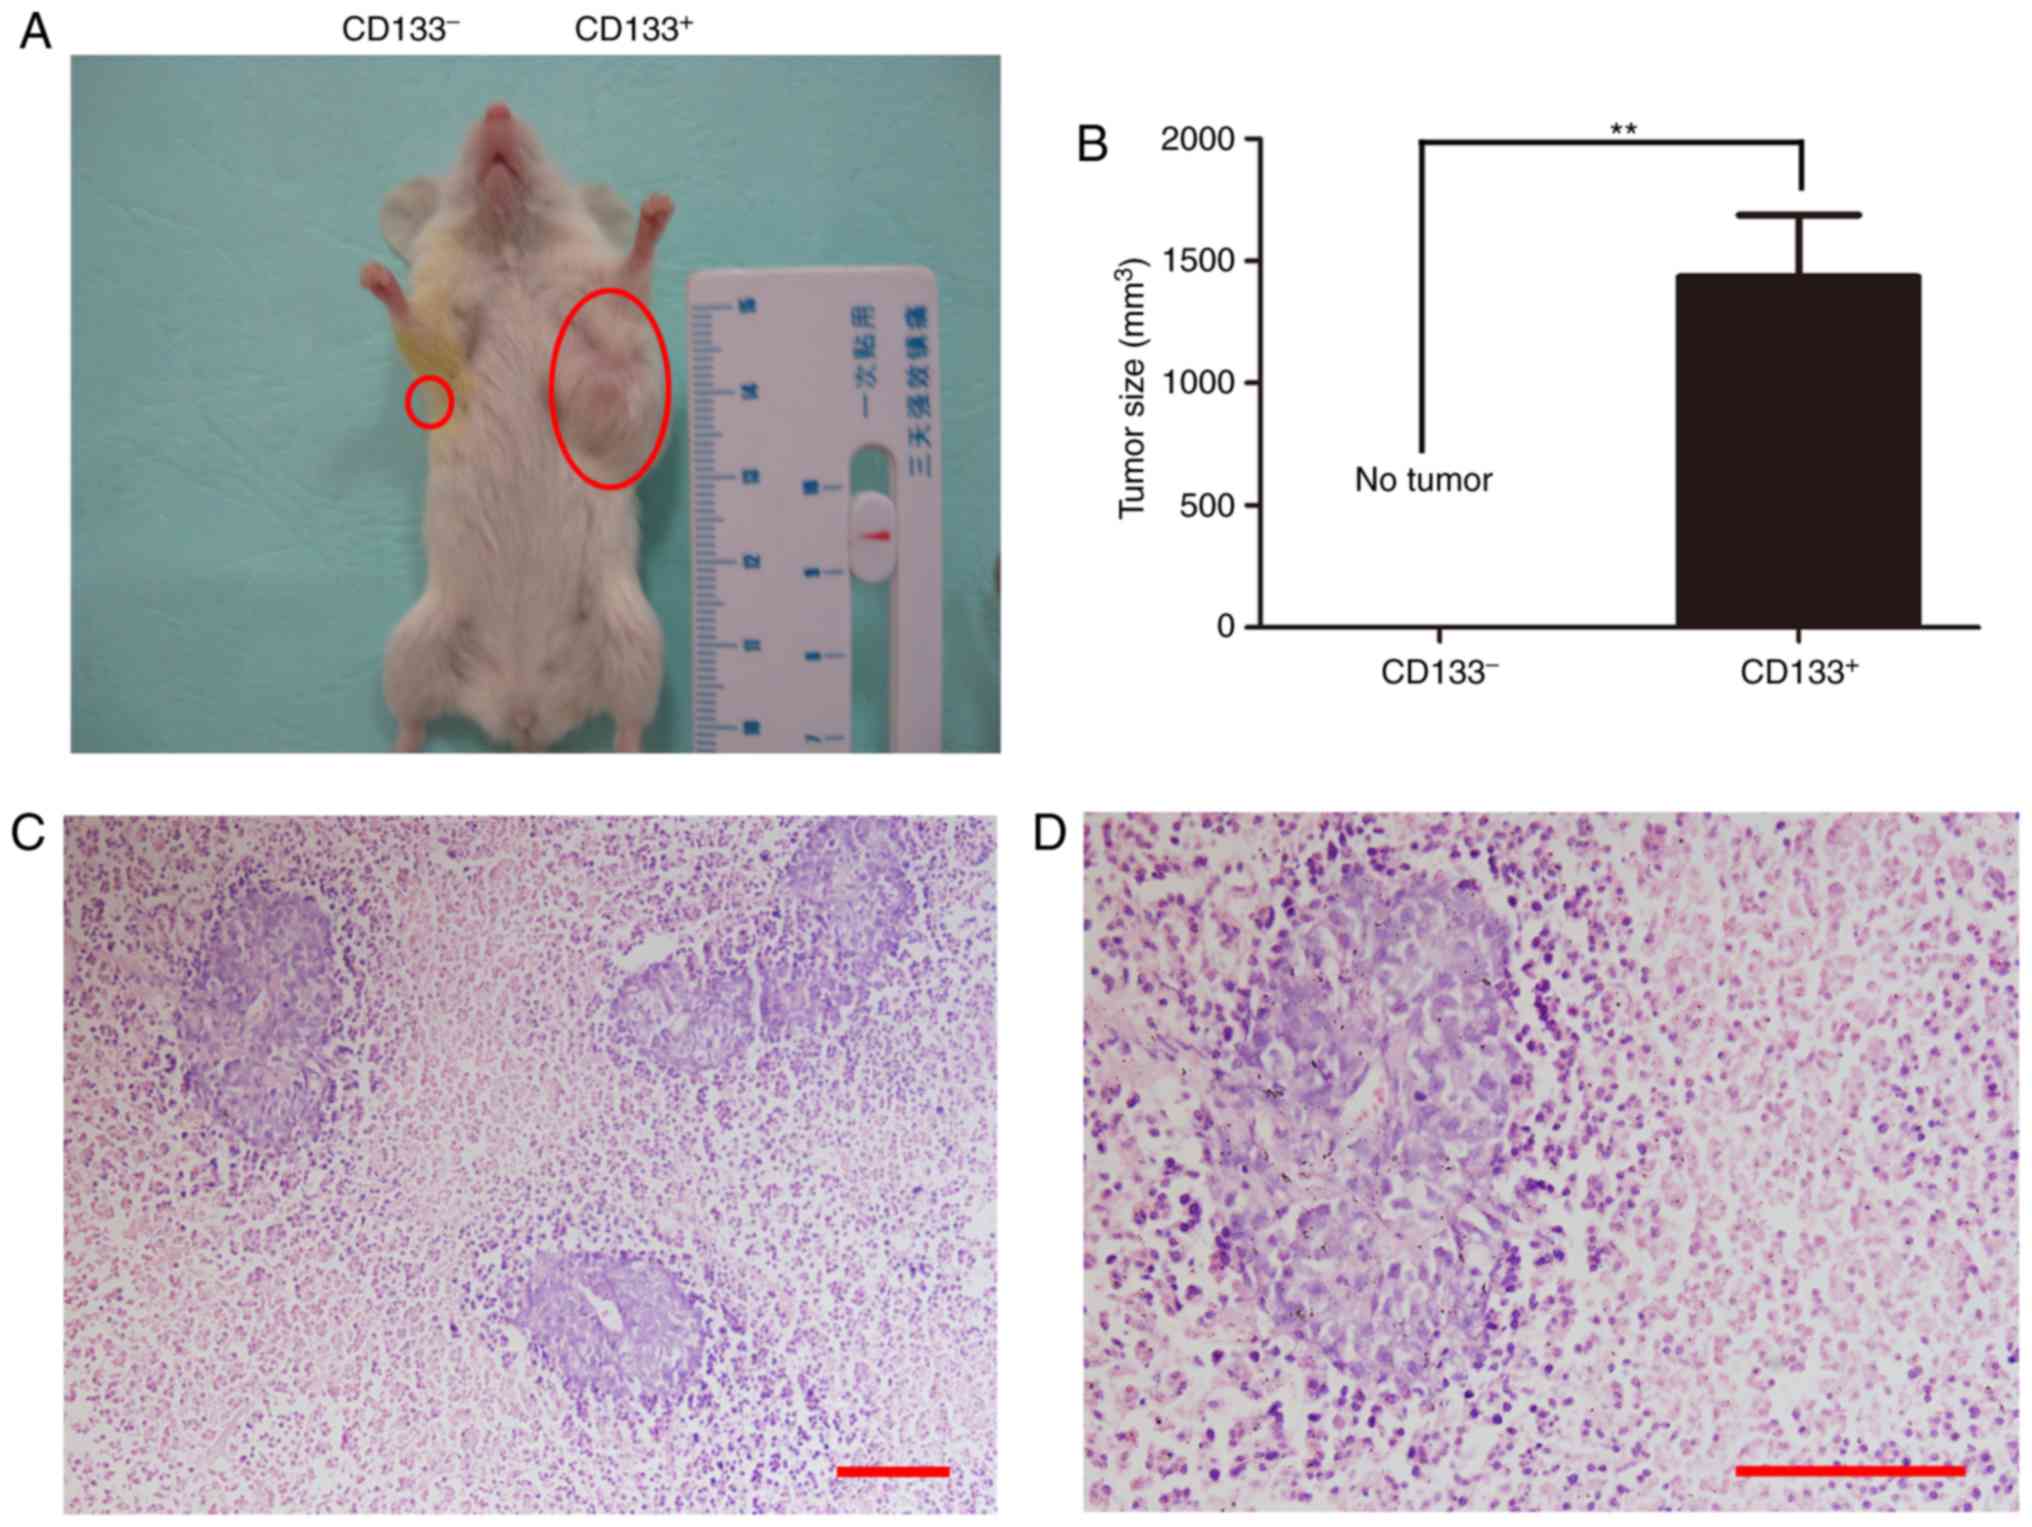
CD133+ cells possess
increased tumorigenic potential in vivo
Additionally, whether CD133+ colon cells
were more tumorigenic than their CD133− counterparts
in vivo was also investigated. Each NOD/SCID mouse was
injected subcutaneously in the left and right abdominal walls with
1×10⁴ CD133+ and CD133− cells,
respectively. Tumors were detected in the left abdominal wall of
NOD/SCID mice 2 weeks after subcutaneous injection of
CD133+ cells, but no tumors in the right wall (Fig. 3A and B). The tumors were >1
cm3 after 3–4 weeks. Transplanted tumors were confirmed
as colon cancer by hematoxylin and eosin staining (Fig. 3C and D). These results demonstrated
that CD133+ cells possessed increased tumorigenic
capacity, compared with CD133− cells.
Gene expression profiles in colon
CSCs
Potential genes associated with the distinct
cellular behaviors of the two cell populations were identified by
generating gene expression profiles of CD133+ and
CD133− SW480 cells using a 22K Human Genome Array. A
total of 21,522 genes were detected and 414 differentially
expressed genes were observed, of which 185 were upregulated and
229 were downregulated in CD133+ cells (Fig. 4A). These genes included BMI1,
which was previously reported to be involved in regulating tumor
growth and the epithelial-mesenchymal transition process (48). A number of ABC transporters
were also upregulated in CD133+ cells, including ABC
subfamily B member 6 (ABCB6), ABCC2, ABCA7 and
ABCF3, which may be associated with drug resistance in
colorectal CSCs. Furthermore, the expression levels of
anti-apoptosis genes, including interferon regulatory factor-3
(IRF-3), IRF-7 and death associated protein kinase 3,
were increased in CD133+ cells, compared with
CD133− cells. Therefore, it was considered that the
anti-apoptotic effect of colorectal CSCs was exerted by activating
or inhibiting particular cell signaling pathways. These genes may
be relevant to the malignant behavior of colorectal CSCs.
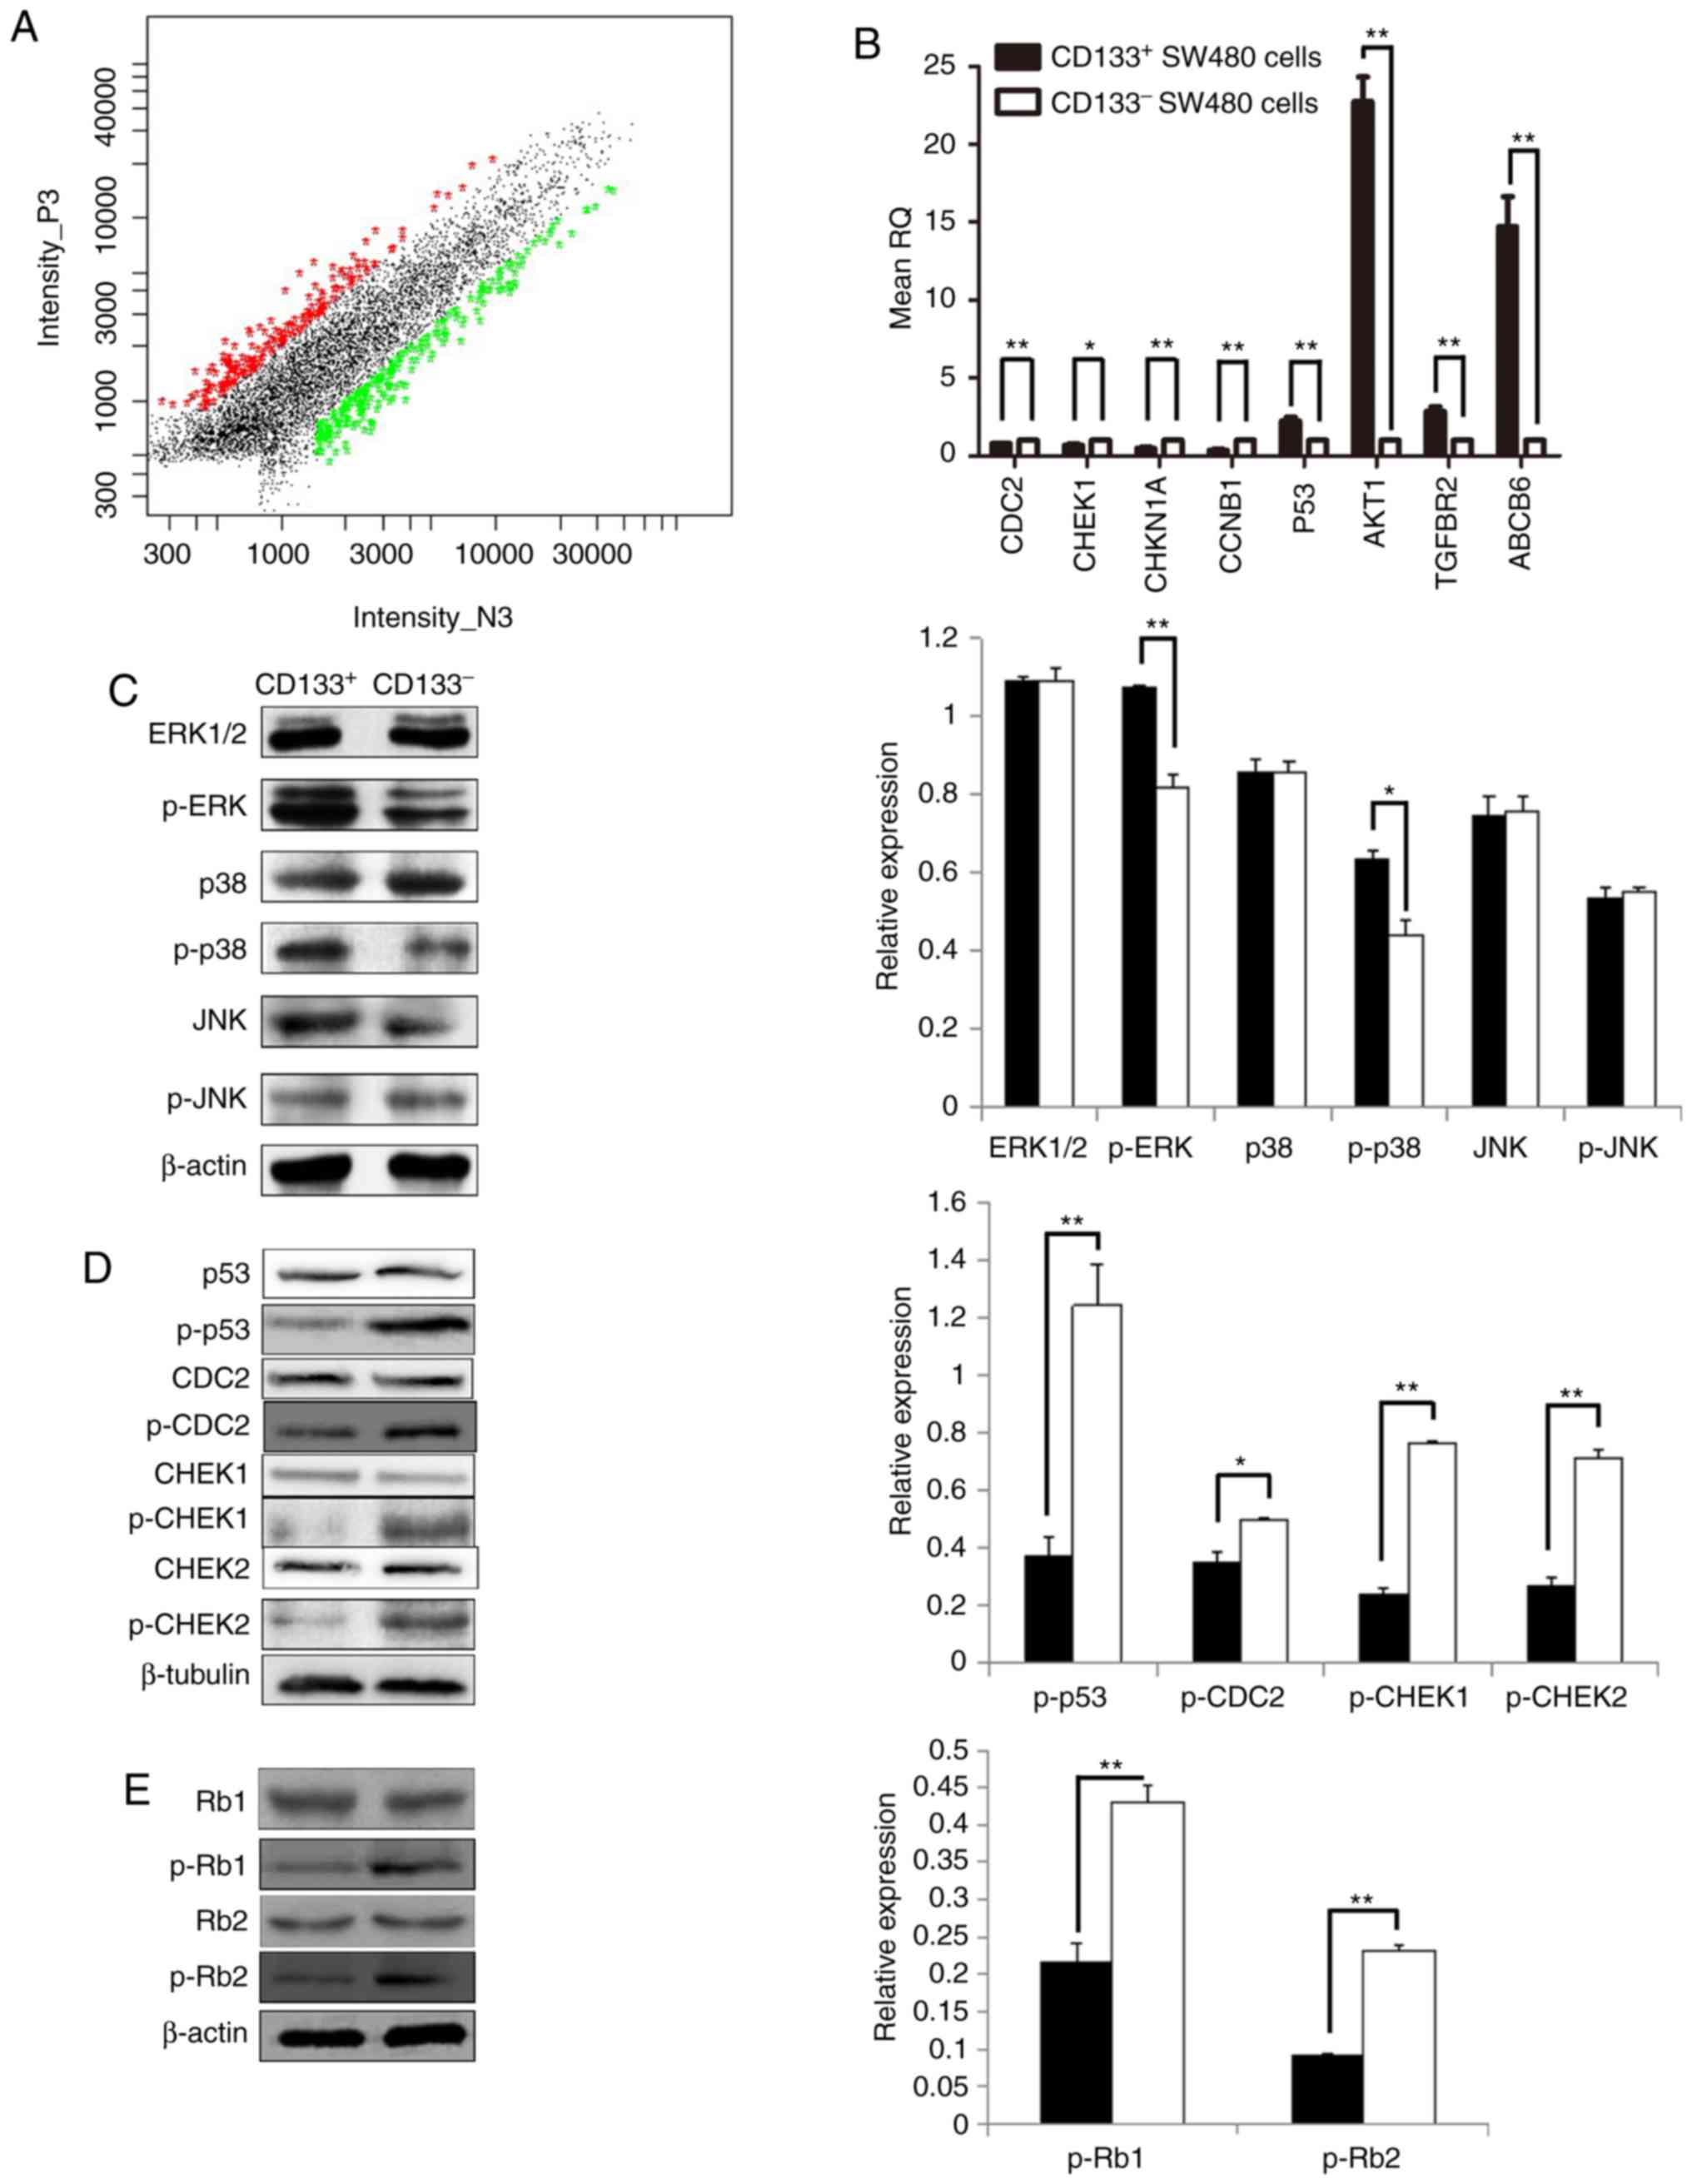 | Figure 4.Gene expression profiles in colon
cancer stem cells. (A) Log-log scatter plot of global complementary
DNA scanning. The gene expression profile of the two types of cells
was examined using the 22K Human Genome Array. (B) Gene expression
in colorectal CD133+ and CD133− SW480 cells.
(C) Expression of proteins associated with the mitogen-activated
protein kinase signaling pathway. (D) Expression of proteins
associated with the p53 signaling pathway. (E) Expression of
proteins p-Rb (Ser795) and p-Rb (Ser807/811) (n=3). Data are
presented as means ± standard deviations. *P<0.05 and
**P<0.01. CD133, cluster of differentiation 133; p-, phospho-;
ERK, extracellular signal-regulated kinase; JNK, c-Jun N-terminal
kinase; CDC2, cyclin dependent kinase 1; CHEK1, checkpoint kinase
1; Rb1, retinoblastoma 1; CDKN1A, cyclin dependent kinase inhibitor
1A; CCNB1, cyclin B1; TGFBR2, transforming growth factor β receptor
2; ABCB6, ATP-binding cassette subfamily B member 6. |
The differentially expressed genes associated with
biological processes in CD133+ and CD133−
cell samples accounted for 55.6%, including transcriptional
regulation, cell cycle, mitosis, transcription, cell division and
protein amino acid phosphorylation. The differentially expressed
genes associated with cell composition accounted for 16.1%,
including nuclear, cytoplasm, cytosol, cell membrane, cell membrane
integrity, cytoplasmic membrane and mitochondrial composition. The
differentially expressed genes associated with molecular function
accounted for 28.3%, including protein binding, nucleic acid
binding, transferase activity, ATP binding, zinc ion binding, GTP
binding and transcription factor activity. GO analysis demonstrated
that the differentially expressed genes were primarily distributed
in the cellular process (14.7%), the physiological process (13.2%),
the metabolism (7.10%), the biological regulation (6.80%), and the
regulation of biological processes (6.22%), cells (5.38%), binding
(4.51%), developmental processes (4.20%), catalytic activity
(4.20%) and other functions.
Gene pathway analysis revealed that the
differentially expressed genes were distributed in multiple
pathways, including the cell cycle, p53, tight junction, glioma,
calcium, insulin, proteasome, gonadotropin-releasing hormone and
MAPK signaling pathways (Table
III). A total of 6 differentially expressed genes associated
with the MAPK signaling pathway and 6 differentially expressed
genes associated with the p53 signaling pathway were identified.
Therefore, it was hypothesized that CD133 regulation of CRC
occurrence and development may be associated with the MAPK and p53
signaling pathways. To examine this hypothesis, the expression
levels of representative genes were examined by RT-qPCR to verify
the results of the cDNA gene chip analysis. The mRNA levels of
p53, AKT1, TGFBR2 and ABCB6 were significantly
increased in CD133+ cells, compared with
CD133− cells (P<0.05; Fig. 4B), while the mRNA levels of CDC2,
CHEK1, CDKN1A and CCNB1 were significantly downregulated
in CD133+ cells (P<0.05; Fig. 4B). These results were consistent
with the gene chip results (with the exception of CHEK1
mRNA), indicating that the microarray results were generally
reliable. Subsequently, the protein expression levels of these key
molecules were examined by western blotting. There were no
significant difference in ERK1/2, p38, JNK and p-JNK protein
expression levels between CD133+ and CD133−
cells. However, expression levels of p-ERK1/2 and p-p38 proteins
were increased in CD133+ cells, compared with
CD133− cells (Fig. 4C).
Furthermore, all the phosphorylated proteins involved in the p53
signaling pathway, including p-p53, p-CDC2, p-CHEK1 (Ser345),
p-CHEK2 (Tyr68), p-Rb (Ser795) and p-Rb (Ser807/811), had reduced
expression in CD133+ cells, compared with
CD133− cells (Fig. 4D and
E). These results indicated that CD133 may assist CRCs to
invade and metastasize by activating the MAPK signaling pathway and
inhibiting the p53 signaling pathway.
| Table III.Pathways associated with differential
genes. |
Table III.
Pathways associated with differential
genes.
| Name | Total | P-value | Q-value | Gene |
|---|
| Cell cycle | 9 |
6.53×10⁻⁹ |
1.2×10⁻⁵ | CDKN1A, YWHAQ,
CCNB1, CHEK1, YWHAG, CCNA2, PCNA, E2F2 and CDC2 |
| p53 signaling
pathway | 6 |
1.01×10⁻⁶ |
1.44×10⁻⁴ | CDKN1A, CCNB1,
CHEK1, PMAIP1, CCNG1 and CDC2 |
| Tight junction | 7 |
4.36×10⁻⁶ |
3.40×10⁻⁵ | MAGI1, TJP3, AKT1,
SPTAN1, PRKCZ, RRAS2 and LLGL2 |
| Glioma | 5 |
1.53×10−05 |
9.58×10⁻⁵ | CDKN, CALM1, AKT1,
E2F2 and CALM2 |
| Pancreatic
cancer | 5 |
2.56×10⁻⁵ |
1.56×10⁻⁴ | TGFBR2, AKT1,
ERBB2, RALBP1 and E2F2 |
| Calcium signaling
pathway | 7 |
7.65×10⁻⁴ |
3.11×10⁻⁵ | GNA11, VDAC2,
CALM1, ERBB2, LTB4R2, CALM2 and NTSR1 |
| Insulin signaling
pathway | 6 |
5.53×10⁻⁵ |
2.78×10⁻⁴ | EIF4E, EXOC7,
CALM1, AKT1, PRKCZ and CALM2 |
| Prostate
cancer | 5 |
6.63×10⁻⁵ |
3.26×10⁻⁴ | CDKN1A, AKT1,
ERBB2, E2 and KLK3 |
| Proteasome | 4 |
8.24×10⁻⁵ |
3.72×10⁻⁴ | PSMA1, PSMD14,
PSMB7 and PSMD6 |
| GnRH signaling
pathway | 5 |
1.67×10⁻⁴ |
6.00×10⁻⁴ | GNA11, CALM1,
PLA2G4B, JMJD7-PLA2G 4B and CALM2 |
| MAPK signaling
pathway | 7 |
3.74×10⁻⁴ |
1.10×10⁻³ | TGFBR2, AKT1,
PLA2G4B, JMJD7-PLA2G4B, CACNA2D2, RRAS2 and RAP1A |
Discussion
CD133 is known as the most frequently used surface
marker for colorectal CSCs (5,45).
However, cell surface molecules other than CD133, including CD44,
CD24, CD166, ALDH1 and epithelial cell adhesion molecule, have also
been considered as putative colorectal CSCs markers (46,47).
Regarding the prognostic values of these markers, numerous
researchers have determined CD133 to be the most clinically
relevant (37,45). Therefore, the clinicopathological
significance of CD133 expression in CRC were examined and it was
demonstrated that CD133 overexpression in CRC is associated with
higher grade, distant metastasis and tumor stage. This indicates
that overexpression of CD133 on the cell membrane may be a
beneficial marker for assisting with predicting the clinical
outcome of patients with CRC.
MACS purified a population of colon CSCs presenting
a CD133 surface phenotype. CD133+ cells exhibited
increased tumorigenic potential in vivo and increased tumor
sphere-forming efficiency in vitro, compared with
CD133− cells, indicating that they retained the
capacities for self-renewal and differentiation.
To understand the biological properties of CSCs,
gene microarray detection of colon CSCs was performed to identify
potential factors involved in stemness maintenance and tumorigenic
ability. The gene expression profile of CD133+ SW480
cells differed from that of CD133− SW480 cells, with 185
genes being upregulated and 229 genes being downregulated. Analysis
of the functions of the differentially expressed genes between
these two cell types revealed that the main distinctions were in
the biological process (55.6%), molecular function (28.3%) and
cellular constituents (16.1%). Further analysis demonstrated that
the primary differences were associated with transcription control,
cell cycle, karyomitosis and protein phosphorylation.
A number of the differentially expressed genes were
associated with tumor development, including BMI1, CHEK1, TGFBR2,
AKT1, CDKN1A, CCNB1 and ABCB6. BMI1, as a member of the polycomb
protein family, was upregulated in CD133+ cells. BMI1
was reportedly overexpressed in glioblastoma and sustained the
self-renewal of malignant glioma and mammary stem cells (48,49),
while inhibition of BMI1 resulted in growth arrest of
pre-established tumors in vivo. However, the exact roles of
BMI1 in the normal colon and in CRC are unclear. It was
hypothesized that overexpression of BMI1 may represent a possible
molecular mechanism for repairing DNA damage in colorectal CSCs.
These results indicated that BMI1 may be a relevant therapeutic
target in CRC.
A number of ABC transporters were also upregulated
in CD133+ cells, including ABCB6, ABCC2, ABCA7 and
ABCF3. Multidrug resistance is known to be the most important
mechanism underlying drug resistance and is another characteristic
of CSCs (50). However, ABCG2,
which is differentially expressed in numerous tumor types, as well
as other genes associated with tumor occurrence, including CHEK1,
TGFBR2, AKT1, CDKN1A and CCNB1, were not overexpressed in
CD133+ cells.
The present results of gene microarray analysis
indicated that the MAPK and p53 signaling pathways were notably
altered in CD133+ SW480 cells. A total of 8 genes
associated with the MAPK and p53 signaling pathways were detected
by RT-qPCR and also identified by gene microarray, except for
CHEK1. The MAPK pathway comprises the primary signaling pathway for
cell proliferation, and previous studies demonstrated that the
activated MAPK signaling pathway serves active roles in cell
adhesion, vasculogenesis, invasion and metastasis in CRC (51). For example, Fang and Richardson
(52) reported that activated MAPK
was associated with the occurrence of colon cancer, while Sunayama
et al (53) confirmed that
the MAPK kinase 1/ERK and phosphoinositide 3-kinase/mechanistic
target of rapamycin pathways were associated with maintenance of
the self-renewal and tumorigenic capacities of glioblastoma CSCs.
The present results demonstrated that p-ERK1/2 and p-p38 were
upregulated in CD133+ cells. These results indicated
that the MAPK signaling pathway may be activated in colorectal
CSCs, and that ERK and p38 may serve important roles in the
proliferation of colorectal CSCs.
p53 is a known tumor suppressor gene with a key role
in the cellular response to stress, which acts as a major
obstructer of tumorigenesis. Post-translational modification of p53
by phosphorylation may be an important mechanism underlying p53
stabilization and function (54–56).
Therefore, p53 was also tested as an accepted cancer suppressor
gene in the present study. p-p53, p-CDC2, p-CHEK1 (Ser68), p-CHEK2
(Tyr68), p-Rb (Ser795), and p-Rb (Ser808/811), which are all
associated with the p53 signaling pathway (57), were all downregulated in colorectal
CSCs. Therefore, it was hypothesized that the p53 signaling pathway
may be inhibited in colorectal CSCs. p53 activity is primarily
modulated by phosphorylation at different sites, and a number of
upstream kinases are involved in this process (58). Melnikova et al (59) determined that ERK1/2 and MAPK were
physically associated with mutant p53 in the nucleus, and
phosphorylation of mutant p53 on serine 15 depended on the level of
ERK1/2 activation. Cordenonsi et al (60) also reported that receptor tyrosine
kinase/Ras/MAPK pathway activity induced p53 N-terminal
phosphorylation. Therefore, it was indicated that activation of the
MAPK signaling pathway may be associated with inhibition of the p53
signaling pathway.
In conclusion, CD133+ SW480 cells exhibit
increased colony-forming ability and invasive capacity, compared
with CD133− cells, in vitro and in vivo.
The present observations further confirmed that CD133 was a CSC
surface marker. By analyzing gene expression profiles, genes that
were differentially expressed in CSCs were identified, which may
therefore be involved in CSC properties. Numerous genes identified
in the present study may also be potential CSC marker candidates,
and their evaluation could thus increase the specificity of CSC
identification. Although further studies are required to identify
the functional roles of these genes in the CSC phenotype and their
association with the CD133 oncogenic mechanism, the present
observations provide a basis for potential future approaches to
clarifying the mechanisms of CRC and for developing novel
tumor-targeting therapies.
Acknowledgements
The authors would like to thank the staff of the
Pathology Departments of Nanfang Hospital, Southern Medical
University (Guangzhou, China) and Shanxi Provincial Cancer Hospital
(Taiyuan, China) for assisting with immunohistochemistry data
acquisition. Additionally, the authors would like to thank the
Center Laboratory of Southern Medical University (Guangzhou, China)
for supplying numerous experimental instruments and equipment.
Funding
The present study was supported by the National
Natural Science Foundation of China (grant no. 81603477), the
Special Science Foundation for Innovation and Development of
Universities of Guangdong Province (grant no. C1032224) and the
Science and Technology Planning Project of Guangdong Province
(grant no. 2015A030302023).
Availability of data and materials
All data generated or analyzed during this study are
included in this published article.
Authors' contributions
BX made contributions to conception and design. YW
and LZ conducted the majority of the experiments, analyzed the data
and wrote the manuscript. QQ, YL and LL were responsible for animal
experiments and cell culture in this experiment. XD was involved in
the colorectal cancer stem cell selection and data analysis. All
authors reviewed and approved the final manuscript.
Ethics approval and consent to
participate
Ethical approval for the present study was obtained
from the ethics committee of Nanfang Hospital, Southern Medical
University (Guangzhou, China). Written informed consent was
obtained from all patients and all clinical investigations were
conducted according to the principles expressed in the Declaration
of Helsinki. All animal experimental procedures were conducted in
strict accordance with the recommendations of the relevant national
and international guidelines for the care and use of laboratory
animals. The protocol was approved by the Committee on the Ethics
of Animal Experiments of the Department of Laboratory Animal
Science, Southern Medical University.
Patient consent for publication
All patients consented for publication.
Competing interests
The authors declare that they have no competing
interests.
Glossary
Abbreviations
Abbreviations:
|
CSC
|
cancer stem cell
|
|
NOD/SCID
|
non-obese diabetic/severe combined
immune deficiency
|
|
RT-qPCR
|
reverse transcription-quantitative
polymerase chain reaction
|
|
MAPK
|
mitogen-activated protein kinase
|
|
CRC
|
colorectal cancer
|
|
MACS
|
magnetic activated cell sorting
|
References
|
1
|
Reya T, Morrison SJ, Clarke MF and
Weissman IL: Stem cells, cancer, and cancer stem cells. Nature.
414:105–111. 2001. View Article : Google Scholar : PubMed/NCBI
|
|
2
|
Sánchez Alvarado A and Yamanaka S:
Rethinking differentiation: Stem cells, regeneration, and
plasticity. Cell. 157:110–119. 2014. View Article : Google Scholar : PubMed/NCBI
|
|
3
|
Sottoriva A, Verhoeff JJ, Borovski T,
McWeeney SK, Naumov L, Medema JP, Sloot PM and Vermeulen L: Cancer
stem cell tumor model reveals invasive morphology and increased
phenotypical heterogeneity. Cancer Res. 70:46–56. 2010. View Article : Google Scholar : PubMed/NCBI
|
|
4
|
Yu Y, Ramena G and Elble RC: The role of
cancer stem cells in relapse of solid tumors. Front Biosci (Elite
Ed). 4:1528–1541. 2012. View
Article : Google Scholar : PubMed/NCBI
|
|
5
|
Zeuner A, Todaro M, Stassi G and De Maria
R: Colorectal cancer stem cells: From the crypt to the clinic. Cell
Stem Cell. 15:692–705. 2014. View Article : Google Scholar : PubMed/NCBI
|
|
6
|
Pattabiraman DR and Weinberg RA: Tackling
the cancer stem cells-what challenges do they pose? Nat Rev Drug
Discov. 13:497–512. 2014. View Article : Google Scholar : PubMed/NCBI
|
|
7
|
Al-Hajj M, Wicha MS, Benito-Hernandez A,
Morrison SJ and Clarke MF: Prospective identification of
tumorigenic breast cancer cells. Proc Natl Acad Sci USA.
100:3983–3988. 2003. View Article : Google Scholar : PubMed/NCBI
|
|
8
|
Choi SA, Lee JY, Phi JH, Wang KC, Park CK,
Park SH and Kim SK: Identification of brain tumour initiating cells
using the stem cell marker aldehyde dehydrogenase. Eur J Cancer.
50:137–149. 2014. View Article : Google Scholar : PubMed/NCBI
|
|
9
|
O'Brien CA, Pollett A, Gallinger S and
Dick JE: A human colon cancer cell capable of initiating tumour
growth in immunodeficient mice. Nature. 445:106–110. 2007.
View Article : Google Scholar : PubMed/NCBI
|
|
10
|
Collins AT, Berry PA, Hyde C, Stower MJ
and Maitland NJ: Prospective identification of tumorigenic prostate
cancer stem cells. Cancer Res. 65:10946–10951. 2005. View Article : Google Scholar : PubMed/NCBI
|
|
11
|
Bao B, Ahmad A, Azmi AS, Ali S and Sarkar
FH: Overview of cancer stem cells (CSCs) and mechanisms of their
regulation: Implications for cancer therapy. Curr Protoc Pharmacol.
Chapter 14: Unit 14.25. 2013. View Article : Google Scholar : PubMed/NCBI
|
|
12
|
Bussolati B, Bruno S, Grange C,
Buttiglieri S, Deregibus MC, Cantino D and Camussi G: Isolation of
renal progenitor cells from adult human kidney. Am J Pathol.
166:545–555. 2005. View Article : Google Scholar : PubMed/NCBI
|
|
13
|
Kim CF, Jackson EL, Woolfenden AE,
Lawrence S, Babar I, Vogel S, Crowley D, Bronson RT and Jacks T:
Identification of bronchioalveolar stem cells in normal lung and
lung cancer. Cell. 121:823–835. 2005. View Article : Google Scholar : PubMed/NCBI
|
|
14
|
Fang D, Nguyen TK, Leishear K, Finko R,
Kulp AN, Hotz S, Van Belle PA, Xu X, Elder DE and Herlyn M: A
tumorigenic subpopulation with stem cell properties in melanomas.
Cancer Res. 65:9328–9337. 2005. View Article : Google Scholar : PubMed/NCBI
|
|
15
|
Hoshi N, Kusakabe T, Taylor BJ and Kimura
S: Side population cells in the mouse thyroid exhibit
stem/progenitor cell-like characteristics. Endocrinology.
148:4251–4258. 2007. View Article : Google Scholar : PubMed/NCBI
|
|
16
|
Kato K, Takao T, Kuboyama A, Tanaka Y,
Ohgami T, Yamaguchi S, Adachi S, Yoneda T, Ueoka Y, Kato K, et al:
Endometrial cancer side-population cells show prominent migration
and have a potential to differentiate into the mesenchymal cell
lineage. Am J Pathol. 176:381–392. 2010. View Article : Google Scholar : PubMed/NCBI
|
|
17
|
Lapidot T, Sirard C, Vormoor J, Murdoch B,
Hoang T, Caceres-Cortes J, Minden M, Paterson B, Caligiuri MA and
Dick JE: A cell initiating human acute myeloid leukaemia after
transplantation into SCID mice. Nature. 367:645–648. 1994.
View Article : Google Scholar : PubMed/NCBI
|
|
18
|
Ginestier C, Hur MH, Charafe-Jauffret E,
Monville F, Dutcher J, Brown M, Jacquemier J, Viens P, Kleer CG,
Liu S, et al: ALDH1 is a marker of normal and malignant human
mammary stem cells and a predictor of poor clinical outcome. Cell
Stem Cell. 1:555–567. 2007. View Article : Google Scholar : PubMed/NCBI
|
|
19
|
Singh SK, Hawkins C, Clarke ID, Squire JA,
Bayani J, Hide T, Henkelman RM, Cusimano MD and Dirks PB:
Identification of human brain tumour initiating cells. Nature.
432:396–401. 2004. View Article : Google Scholar : PubMed/NCBI
|
|
20
|
Suetsugu A, Nagaki M, Aoki H, Motohashi T,
Kunisada T and Moriwaki H: Characterization of CD133+
hepatocellular carcinoma cells as cancer stem/progenitor cells.
Biochem Biophys Res Commun. 351:820–824. 2006. View Article : Google Scholar : PubMed/NCBI
|
|
21
|
Li C, Heidt DG, Dalerba P, Burant CF,
Zhang L, Adsay V, Wicha M, Clarke MF and Simeone DM: Identification
of pancreatic cancer stem cells. Cancer Res. 67:1030–1037. 2007.
View Article : Google Scholar : PubMed/NCBI
|
|
22
|
Su J, Xu XH, Huang Q, Lu MQ, Li DJ, Xue F,
Yi F, Ren JH and Wu YP: Identification of cancer stem-like
CD44+ cells in human nasopharyngeal carcinoma cell line.
Arch Med Res. 42:15–21. 2011. View Article : Google Scholar : PubMed/NCBI
|
|
23
|
Prince ME, Sivanandan R, Kaczorowski A,
Wolf GT, Kaplan MJ, Dalerba P, Weissman IL, Clarke MF and Ailles
LE: Identification of a subpopulation of cells with cancer stem
cell properties in head and neck squamous cell carcinoma. Proc Natl
Acad Sci USA. 104:973–978. 2007. View Article : Google Scholar : PubMed/NCBI
|
|
24
|
Zhou L, Wei X, Cheng L, Tian J and Jiang
JJ: CD133, one of the markers of cancer stem cells in Hep-2 cell
line. Laryngoscope. 117:455–460. 2007. View Article : Google Scholar : PubMed/NCBI
|
|
25
|
Shi C, Tian R, Wang M, Wang X, Jiang J,
Zhang Z, Li X, He Z, Gong W and Qin R: CD44+
CD133+ population exhibits cancer stem cell-like
characteristics in human gallbladder carcinoma. Cancer Biol Ther.
10:1182–1190. 2010. View Article : Google Scholar : PubMed/NCBI
|
|
26
|
Landen CN Jr, Goodman B, Katre AA, Steg
AD, Nick AM, Stone RL, Miller LD, Mejia PV, Jennings NB, Gershenson
DM, et al: Targeting aldehyde dehydrogenase cancer stem cells in
ovarian cancer. Mol Cancer Ther. 9:3186–3199. 2010. View Article : Google Scholar : PubMed/NCBI
|
|
27
|
Cui F, Wang J, Chen D and Chen YJ: CD133
is a temporary marker of cancer stem cells in small cell lung
cancer, but not in non-small cell lung cancer. Oncol Rep.
25:701–708. 2011.PubMed/NCBI
|
|
28
|
Liang D and Shi Y: Aldehyde
dehydrogenase-1 is a specific marker for stem cells in human lung
adenocarcinoma. Med Oncol. 29:633–639. 2012. View Article : Google Scholar : PubMed/NCBI
|
|
29
|
Prud'homme GJ: Cancer stem cells and novel
targets for antitumor strategies. Curr Pharm Des. 18:2838–2849.
2012. View Article : Google Scholar : PubMed/NCBI
|
|
30
|
Pang R, Law WL, Chu AC, Poon JT, Lam CS,
Chow AK, Ng L, Cheung LW, Lan XR, Lan HY, et al: A subpopulation of
CD26+ cancer stem cells with metastatic capacity in
human colorectal cancer. Cell Stem Cell. 6:603–615. 2010.
View Article : Google Scholar : PubMed/NCBI
|
|
31
|
Miraglia S, Godfrey W, Yin AH, Atkins K,
Warnke R, Holden JT, Bray RA, Waller EK and Buck DW: A novel
five-transmembrane hematopoietic stem cell antigen: Isolation,
characterization, and molecular cloning. Blood. 90:5013–5021.
1997.PubMed/NCBI
|
|
32
|
Ricci-Vitiani L, Lombardi DG, Pilozzi E,
Biffoni M, Todaro M, Peschle C and De Maria R: Identification and
expansion of human colon-cancer-initiating cells. Nature.
445:111–115. 2007. View Article : Google Scholar : PubMed/NCBI
|
|
33
|
Pardal R, Clarke MF and Morrison SJ:
Applying the principles of stem-cell biology to cancer. Nat Rev
Cancer. 3:895–902. 2003. View Article : Google Scholar : PubMed/NCBI
|
|
34
|
Dong HJ, Jang GB, Lee HY, Park SR, Kim JY,
Nam JS and Hong IS: The Wnt/β-catenin signaling/Id2 cascade
mediates the effects of hypoxia on the hierarchy of
colorectal-cancer stem cells. Sci Rep. 6:229662016. View Article : Google Scholar : PubMed/NCBI
|
|
35
|
Turner PV, Pekow C, Clark JM, Vergara P,
Bayne K, White WJ, Kurosawa TM, Seok SH and Baneux P: Roles of the
international council for laboratory animal science (ICLAS) and
international association of colleges of laboratory animal medicine
(IACLAM) in the global organization and support of 3Rs advances in
laboratory animal science. J Am Assoc Lab Anim Sci. 54:174–180.
2015.PubMed/NCBI
|
|
36
|
Edge SB, Byrd DR, Compton CC, Fritz AG,
Greene FL and Trotti A: AJCC Cancer Staging Manual. 7th. Springer;
New York, NY: 2010
|
|
37
|
Kojima M, Ishii G, Atsumi N, Fujii S,
Saito N and Ochiai A: Immunohistochemical detection of CD133
expression in colorectal cancer: A clinicopathological study.
Cancer Sci. 99:1578–1583. 2008. View Article : Google Scholar : PubMed/NCBI
|
|
38
|
Fromowitz FB, Viola MV, Chao S, Oravez S,
Mishriki Y, Finkel G, Grimson R and Lundy J: ras p21 expression in
the progression of breast cancer. Hum Pathol. 18:1268–1275. 1987.
View Article : Google Scholar : PubMed/NCBI
|
|
39
|
Louis KS and Siegel AC: Cell viability
analysis using trypan blue: Manual and automated methods. Methods
Mol Biol. 740:7–12. 2011. View Article : Google Scholar : PubMed/NCBI
|
|
40
|
Guo Y, Guo H, Zhang L, Xie H, Zhao X, Wang
F, Li Z, Wang Y, Ma S, Tao J, et al: Genomic analysis of
anti-hepatitis B virus (HBV) activity by small interfering RNA and
lamivudine in stable HBV-producing cells. J Virol. 79:14392–14403.
2005. View Article : Google Scholar : PubMed/NCBI
|
|
41
|
Phillips J and Eberwine JH: Antisense RNA
amplification: A linear amplification method for analyzing the mRNA
population from single living cells. Methods. 10:283–288. 1996.
View Article : Google Scholar : PubMed/NCBI
|
|
42
|
MAQC Consortium, ; Shi L, Reid LH, Jones
WD, Shippy R, Warrington JA, Baker SC, Collins PJ, de Longueville
F, Kawasaki ES, et al: The MicroArray Quality Control (MAQC)
project shows inter- and intraplatform reproducibility of gene
expression measurements. Nat Biotechnol. 24:1151–1161. 2006.
View Article : Google Scholar : PubMed/NCBI
|
|
43
|
Patterson TA, Lobenhofer EK,
Fulmer-Smentek SB, Collins PJ, Chu TM, Bao W, Fang H, Kawasaki ES,
Hager J, Tikhonova IR, et al: Performance comparison of one-color
and two-color platforms within the MicroArray Quality Control
(MAQC) project. Nat Biotechnol. 24:1140–1150. 2006. View Article : Google Scholar : PubMed/NCBI
|
|
44
|
Livak KJ and Schmittgen TD: Analysis of
relative gene expression data using real-time quantitative PCR and
the 2(-Delta Delta C(T)) method. Methods. 25:402–408. 2001.
View Article : Google Scholar : PubMed/NCBI
|
|
45
|
Horst D, Kriegl L, Engel J, Kirchner T and
Jung A: CD133 expression is an independent prognostic marker for
low survival in colorectal cancer. Br J Cancer. 99:1285–1289. 2008.
View Article : Google Scholar : PubMed/NCBI
|
|
46
|
Mărgaritescu C, Pirici D, Cherciu I,
Bărbălan A, Cârtână T and Săftoiu A: CD133/CD166/Ki-67 triple
immunofluorescence assessment for putative cancer stem cells in
colon carcinoma. J Gastrointestin Liver Dis. 23:161–170. 2014.
View Article : Google Scholar : PubMed/NCBI
|
|
47
|
Lugli A, Iezzi G, Hostettler I, Muraro MG,
Mele V, Tornillo L, Carafa V, Spagnoli G, Terracciano L and Zlobec
I: Prognostic impact of the expression of putative cancer stem cell
markers CD133, CD166, CD44s, EpCAM, and ALDH1 in colorectal cancer.
Br J Cancer. 103:382–390. 2010. View Article : Google Scholar : PubMed/NCBI
|
|
48
|
Tu Y, Gao X, Li G, Fu H, Cui D, Liu H, Jin
W and Zhang Y: MicroRNA-218 inhibits glioma invasion, migration,
proliferation, and cancer stem-like cell self-renewal by targeting
the polycomb group gene Bmi1. Cancer Res. 73:6046–6055. 2013.
View Article : Google Scholar : PubMed/NCBI
|
|
49
|
Liu S, Dontu G, Mantle ID, Patel S, Ahn
NS, Jackson KW, Suri P and Wicha MS: Hedgehog signaling and Bmi-1
regulate self-renewal of normal and malignant human mammary stem
cells. Cancer Res. 66:6063–6071. 2006. View Article : Google Scholar : PubMed/NCBI
|
|
50
|
de Jonge-Peeters SD, Kuipers F, de Vries
EG and Vellenga E: ABC transporter expression in hematopoietic stem
cells and the role in AML drug resistance. Crit Rev Oncol Hematol.
62:214–226. 2007. View Article : Google Scholar : PubMed/NCBI
|
|
51
|
Blaj C, Schmidt EM, Lamprecht S, Hermeking
H, Jung A, Kirchner T and Horst D: Oncogenic effects of High MAPK
activity in colorectal cancer mark progenitor cells and persist
irrespective of RAS mutations. Cancer Res. 77:1763–1774. 2017.
View Article : Google Scholar : PubMed/NCBI
|
|
52
|
Fang JY and Richardson BC: The MAPK
signalling pathways and colorectal cancer. Lancet Oncol. 6:322–327.
2005. View Article : Google Scholar : PubMed/NCBI
|
|
53
|
Sunayama J, Matsuda K, Sato A, Tachibana
K, Suzuki K, Narita Y, Shibui S, Sakurada K, Kayama T, Tomiyama A
and Kitanaka C: Crosstalk between the PI3K/mTOR and MEK/ERK
pathways involved in the maintenance of self-renewal and
tumorigenicity of glioblastoma stem-like cells. Stem Cells.
28:1930–1939. 2010. View Article : Google Scholar : PubMed/NCBI
|
|
54
|
Belle JI, Petrov JC, Langlais D, Robert F,
Cencic R, Shen S, Pelletier J, Gros P and Nijnik A: Repression of
p53-target gene Bbc3/PUMA by MYSM1 is essential for the survival of
hematopoietic multipotent progenitors and contributes to stem cell
maintenance. Cell Death Differ. 23:759–775. 2016. View Article : Google Scholar : PubMed/NCBI
|
|
55
|
Vogelstein B, Lane D and Levine AJ:
Surfing the p53 network. Nature. 408:307–310. 2000. View Article : Google Scholar : PubMed/NCBI
|
|
56
|
Li XL, Zhou J, Chen ZR and Chng WJ: P53
mutations in colorectal cancer-molecular pathogenesis and
pharmacological reactivation. World J Gastroenterol. 21:84–93.
2015. View Article : Google Scholar : PubMed/NCBI
|
|
57
|
Vogelstein B and Kinzler KW: Cancer genes
and the pathways they control. Nat Med. 10:789–799. 2004.
View Article : Google Scholar : PubMed/NCBI
|
|
58
|
Fuchs B, O'Connor D, Fallis L, Scheidtmann
KH and Lu X: p53 phosphorylation mutants retain transcription
activity. Oncogene. 10:789–793. 1995.PubMed/NCBI
|
|
59
|
Melnikova VO, Santamaria AB, Bolshakov SV
and Ananthaswamy HN: Mutant p53 is constitutively phosphorylated at
Serine 15 in UV-induced mouse skin tumors: Involvement of ERK1/2
MAP kinase. Oncogene. 22:5958–5966. 2003. View Article : Google Scholar : PubMed/NCBI
|
|
60
|
Cordenonsi M, Montagner M, Adorno M,
Zacchigna L, Martello G, Mamidi A, Soligo S, Dupont S and Piccolo
S: Integration of TGF-beta and Ras/MAPK signaling through p53
phosphorylation. Science. 315:840–843. 2007. View Article : Google Scholar : PubMed/NCBI
|