Introduction
Pituitary tumors represent approximately 10–15% of
intracranial tumors, of which prolactin-secreting pituitary
adenomas (prolactinoma) are the most common subtypes, accounting
for 30–40% of pituitary tumors (1,2). Most of
these tumors are noninvasive, show slow growth and are easily
treated by surgery or medical treatment, including cabergoline and
dopamine agonists. However, a small subset, accounting for 2.5–10%
of pituitary adenomas, are defined as aggressive pituitary tumors
and can exhibit aggressive behaviors, resistance to conventional
treatments and/or temozolomide (TMZ), and multiple recurrences
despite standard therapies combining surgical, medical and
radiotherapy treatment approaches (3,4). Early
identification of aggressive pituitary tumors is challenging but is
of major clinical importance as these tumors are associated with
increased morbidity and mortality (5). Numerous studies have been performed to
explore potential predictive and prognostic biomarkers for the
molecular pathogenesis underlying the aggressive behavior and
malignant transformation of pituitary tumors, yet research results
remain fairly unreliable and controversial (4,6,7).
MicroRNAs (miRNAs/miRs) are a large family of short
endogenous noncoding RNAs, approximately 21–25 nucleotides in
length, that can directly bind to the 3′-untranslated region of
messenger RNA (mRNA), thereby leading to suppression of protein
translation or mRNA degradation (8,9).
Subsequently, miRNAs can negatively regulate the expression of
target genes involved in proliferation, apoptosis, cell cycle
differentiation, invasion and metabolism (9). Aberrant expression of miRNAs contributes
to tumorigenesis, invasion and metastasis by derepressing or
silencing key regulatory proteins in various types of tumors,
including pituitary adenomas (10–12). Many
studies have investigated the roles of miRNAs in pituitary
tumorigenesis, dysfunction, neurodegeneration and metastasis by
comparing tumoral to normal pituitary tissues (13–16).
However, currently, there are few studies that have explored
aggressiveness-associated miRNAs in ‘aggressive’ pituitary tumors,
especially aggressive prolactinoma, one of the most common subtypes
of pituitary adenomas, based on large-scale human tissue
datasets.
In recent years, microarray technology and
bioinformatic analysis have been widely used to help us discover
novel clues to identify reliable and functional miRNAs. In the
present study, differentially expressed miRNAs (DEMs, DE-miRNAs)
between aggressive and nonaggressive prolactin pituitary tumors
were screened using the GSE46294 miRNA expression profile (17). The potential target genes of the top
three most highly upregulated and downregulated DE-miRNAs were
predicted by miRTarBase. Subsequently, Gene Ontology (GO), Kyoto
Encyclopedia of Genes and Genomes (KEGG) pathway enrichment and
protein-protein interaction (PPI) network analyses were performed
to help us understand the molecular mechanisms underlying the
aggressiveness of pituitary tumors. Finally, 20 hub genes were
identified, and an miRNA-hub gene network was constructed by
Cytoscape software. In conclusion, our study aimed to explore the
aggressiveness-associated miRNAs in aggressive prolactin pituitary
tumors and their potential molecular mechanisms based on
bioinformatic analysis and to provide candidate biomarkers for
early diagnosis and individualized treatment of aggressive
prolactin pituitary tumors.
Materials and methods
Microarray data
The Gene Expression Omnibus (GEO, http://www.ncbi.nlm.nih.gov/geo/) is a public
functional genomics data repository of high-throughput gene
expression data, chips and microarrays (18). After extensive data screening in the
GEO database, only the GSE46294 dataset was selected as it compared
the miRNA expression of aggressive and nonaggressive prolactin
pituitary tumors (17). GSE46294,
based on the GPL13264 platform (Agilent-021827 Human miRNA
Microarray), contained four aggressive prolactin pituitary tumor
samples and eight nonaggressive prolactin pituitary tumor
samples.
Data processing
GEO2R (http://www.ncbi.nlm.nih.gov/geo/geo2r/) is an
interactive web tool that can compare different groups of samples
from the GEO series to identify DEMs across experimental conditions
(19). The DEMs between aggressive
and nonaggressive prolactin pituitary tumor samples were screened
using GEO2R. Adjusted P-values (adj. P) were applied to correct the
false-positive results by using the default Benjamini-Hochberg
false discovery rate method. Adj. P<0.01 and |fold change (FC)|
>2 were considered the cut-off values for identifying DEMs. A
DEM hierarchical clustering heat map was constructed using MeV
(Multiple Experiment Viewer, http://mev.tm4.org/), which is a cloud-based
application supporting the analysis, visualization, and
stratification of large genomic data, particularly RNASeq and
microarray data. The potential target genes of the top three most
highly upregulated and downregulated DE-miRNAs were predicted by
miRTarBase (http://mirtarbase.mbc.nctu.edu.tw/php/index.php/),
which is a database for experimentally validated miRNA-target
interactions (20).
Functional and pathway enrichment
analyses
The Database for Annotation, Visualization and
Integrated Discovery (DAVID, http://david.ncifcrf.gov/) is an online tool for gene
functional classification, which is an essential foundation for
high-throughput gene analysis to understand the biological
significance of genes (21). DAVID
was introduced to perform functional annotation and pathway
enrichment analysis, including GO (Gene Ontology) enrichment and
KEGG (Kyoto Encyclopedia of Genes and Genomes) pathway analysis,
for the predicted target genes of 6 selected DEMs (22,23). A
P-value <0.05 was considered statistically significant.
PPI network construction and module
analysis
The target genes obtained from the upregulated and
downregulated DEMs were first mapped to the STRING database
(http://string-db.org) to assess functional
associations among these target genes, with a combined score
>0.4 defined as significant (24).
Then, PPI networks were constructed using Cytoscape, which is a
biological graph visualization software for integrated models of
biologic molecular interaction networks (25). The Molecular Complex Detection (MCODE)
plugin of Cytoscape was used to identify the most significant
module in the PPI networks (26). The
criteria for selection were as follows: Degree cut-off=2, node
score cut-off=0.2, maximum depth=100 and k-core=2. Moreover, GO and
KEGG enrichment analyses were performed using DAVID for genes in
the modules.
Hub gene analysis and miRNA-hub gene
network construction
Hub genes were selected by considering the high
degree of connectivity in the PPI networks analyzed by the
cytohubba plugin of Cytoscape. The top 10 genes with the highest
degree of connectivity were selected as the hub genes of the
upregulated and downregulated DEMs, respectively. Subsequently, GO
and KEGG enrichment analyses were performed for the selected 20 hub
genes. The biological process analysis of hub genes was performed
and visualized using the Biological Networks Gene Oncology tool
(BiNGO) plugin of Cytoscape (27).
The latest information of functional roles of hub genes was
downloaded from GeneCards in Nov. 2018 (https://www.genecards.org/). Subsequently, an
miRNA-hub gene network was constructed by Cytoscape.
Results
Identification of DEMs and their
target genes
Following analysis of the GSE46294 dataset using
GEO2R, a total of 43 DEMs were identified, including 19 upregulated
and 24 downregulated miRNAs between aggressive and nonaggressive
prolactin pituitary tumors. For better visualization, the top 10
most highly upregulated miRNAs and the top 10 most highly
downregulated miRNAs are presented in Table I, and the hierarchical clustering heat
map of the DEMs is presented in Fig.
S1. According to their FC values, hsa-miR-489, hsa-let-7d* and
hsa-miR-138-1* were the top 3 most highly upregulated miRNAs, and
hsa-miR-520b, hsa-miR-875-5p and hsa-miR-671-3p were the top 3 most
highly downregulated miRNAs (Table
I). One hundred seventy potential target genes were predicted
for the top 3 most highly upregulated miRNAs and 680 potential
target genes were predicted for the top 3 most highly downregulated
miRNAs by miRTarBase.
 | Table I.Top 10 upregulated and downregulated
DEMs between aggressive and nonaggressive prolactin pituitary
tumors. |
Table I.
Top 10 upregulated and downregulated
DEMs between aggressive and nonaggressive prolactin pituitary
tumors.
| miRNAs (DEMs) | P-value | t | B | logFC |
|---|
| Upregulated |
|
|
|
|
|
hsa-miR-489 | 0.00677 | 3.25 | −4.58 | 7.07 |
|
hsa-let-7d* | 0.02591 | 2.53 | −4.58 | 6.09 |
|
hsa-miR-138-1* | 0.02569 | 2.54 | −4.58 | 5.26 |
|
hsa-miR-886-3p | 0.00191 | 3.94 | −4.58 | 4.36 |
|
hsa-miR-576-5p | 0.04773 | 2.2 | −4.59 | 3.83 |
|
hsa-miR-135b | 0.01671 | 2.77 | −4.58 | 3.72 |
|
hsa-miR-137 | 0.03877 | 2.32 | −4.59 | 3.29 |
|
hsa-miR-886-3p | 0.00235 | 3.82 | −4.58 | 3.2 |
|
hsa-miR-551b | 0.02074 | 2.66 | −4.58 | 3.04 |
|
hsa-miR-296-3p | 0.04524 | 2.23 | −4.59 | 3.02 |
| Downregulated |
|
|
|
|
|
hsa-miR-520b | 0.00732 | −3.21 | −4.58 | −6.36 |
|
hsa-miR-875-5p | 0.04037 | −2.29 | −4.59 | −5.66 |
|
hsa-miR-671-3p | 0.01453 | −2.85 | −4.58 | −5.49 |
|
hsa-miR-372 | 0.00348 | −3.61 | −4.58 | −5.49 |
|
hsa-miR-586 | 0.02631 | −2.53 | −4.58 | −5.44 |
|
hsa-miR-367* | 0.02421 | −2.57 | −4.58 | −4.84 |
|
hsa-miR-302b | 0.01052 | −3.02 | −4.58 | −4.49 |
|
hsa-miR-187 | 0.0322 | −2.42 | −4.59 | −4.35 |
|
hsa-miR-193b* | 0.02207 | −2.62 | −4.58 | −4.31 |
|
hsa-miR-452* | 0.00322 | −3.65 | −4.58 | −4.17 |
Functional and pathway enrichment
analyses
GO analysis, including biological process (BP),
cellular component (CC) and molecular function (MF), was performed
on the potential target genes of top 3 most highly upregulated
miRNAs (Table II) and the top 3 most
highly downregulated miRNAs (Table
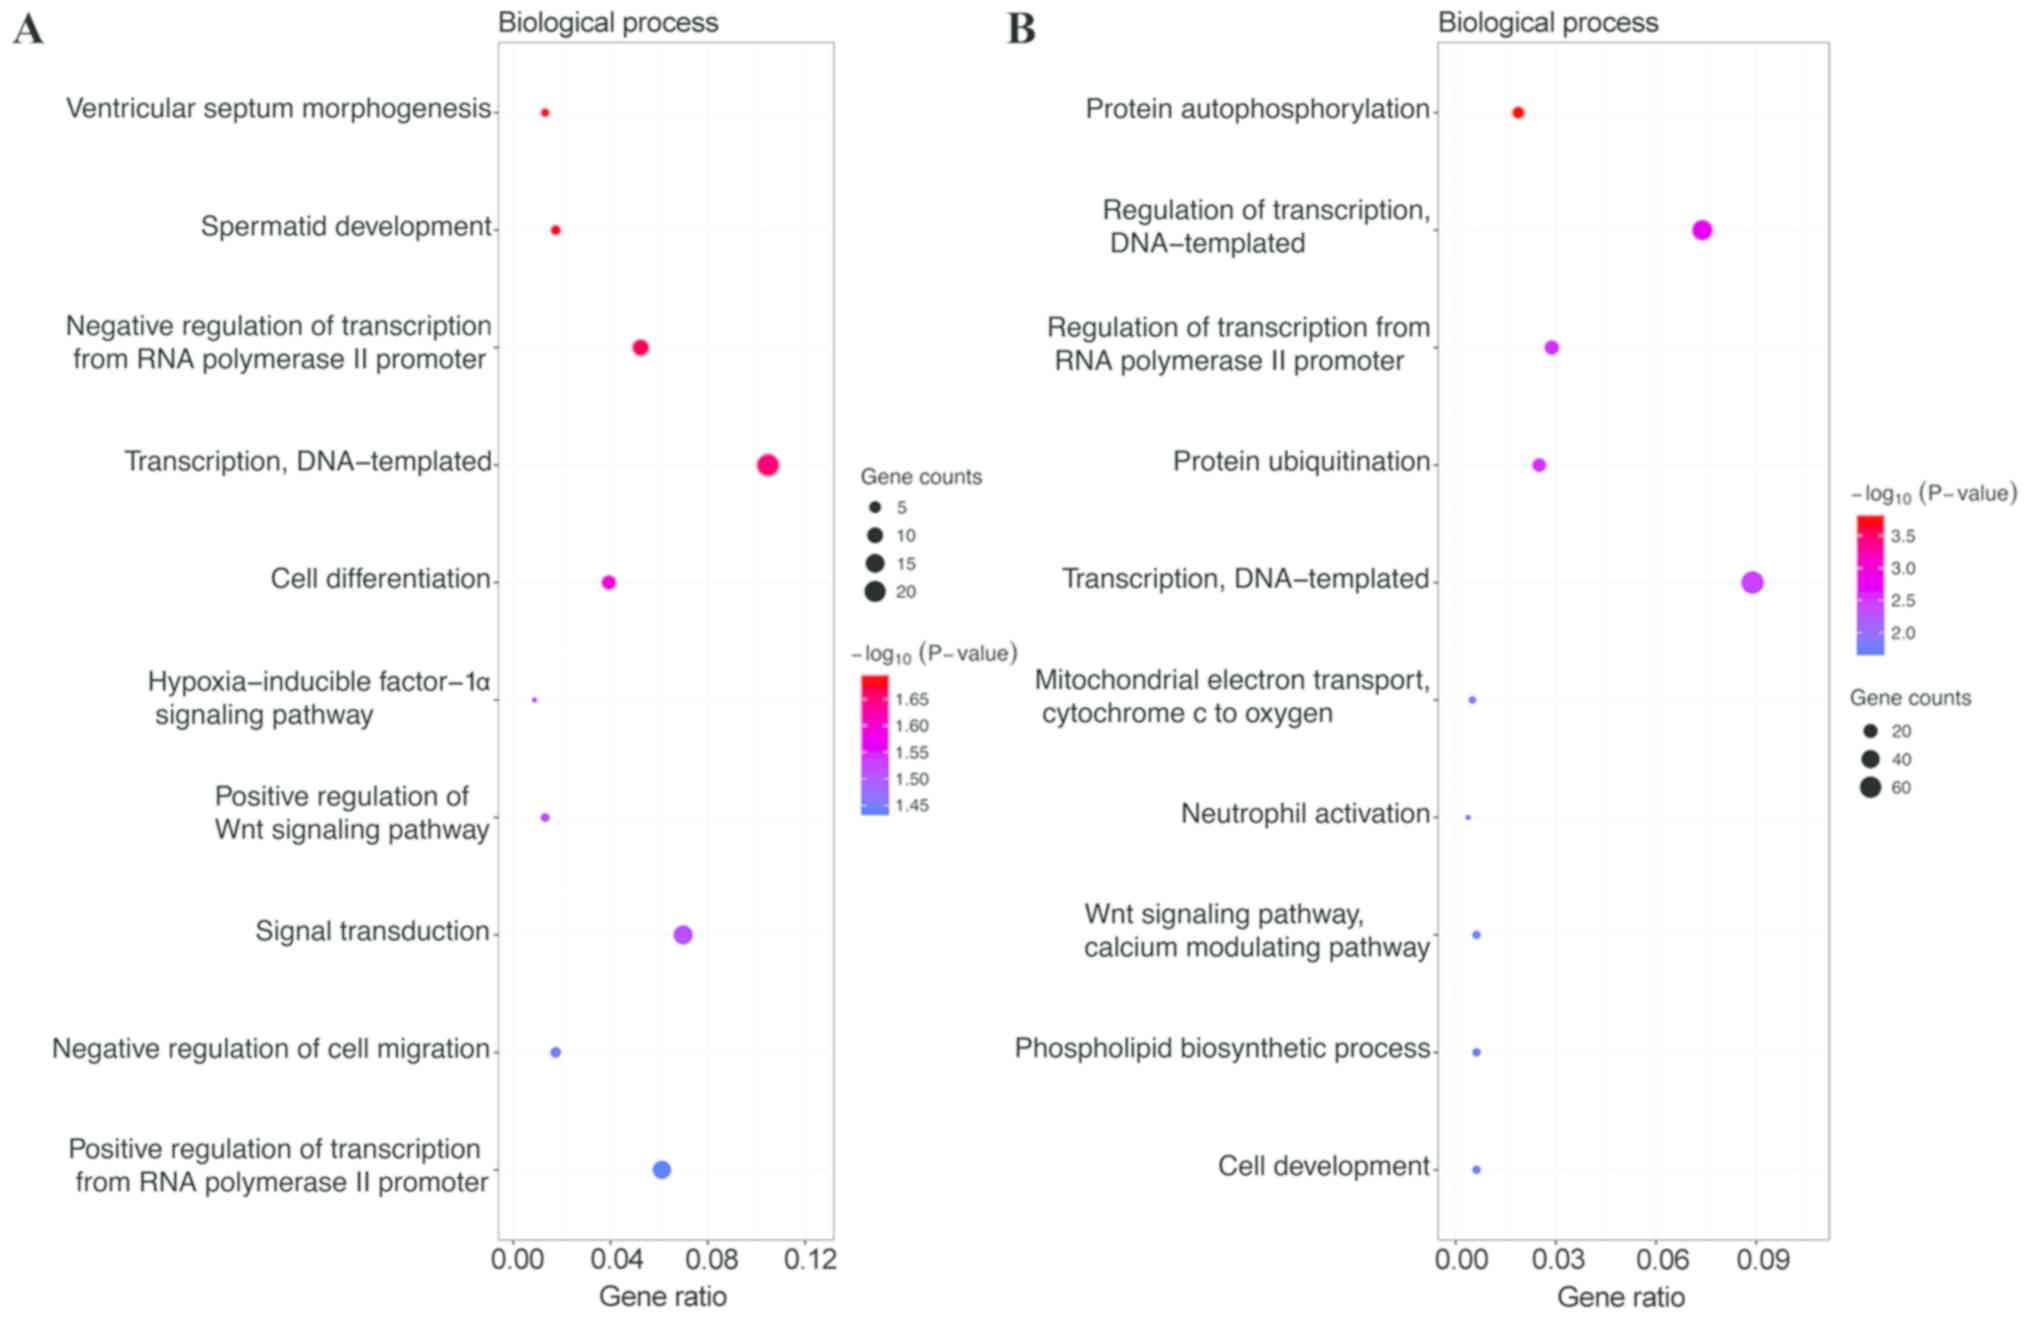
III). GO functional annotation analysis showed that in the BP
category, the target genes of the top 3 most highly upregulated
miRNAs were significantly enriched in DNA-templated transcription,
signal transduction, and positive regulation of transcription from
RNA polymerase II promoter (Fig. 1A),
while the target genes of the top 3 most highly downregulated
miRNAs were enriched in DNA-templated transcription, DNA-templated
regulation of transcription, and regulation of transcription from
RNA polymerase II promoter (Fig. 1B).
In the CC category, the target genes of the top three most highly
upregulated miRNAs were significantly enriched in cytoplasm,
nucleus and cytosol (Fig. 2A), while
the target genes of the top three most highly downregulated miRNAs
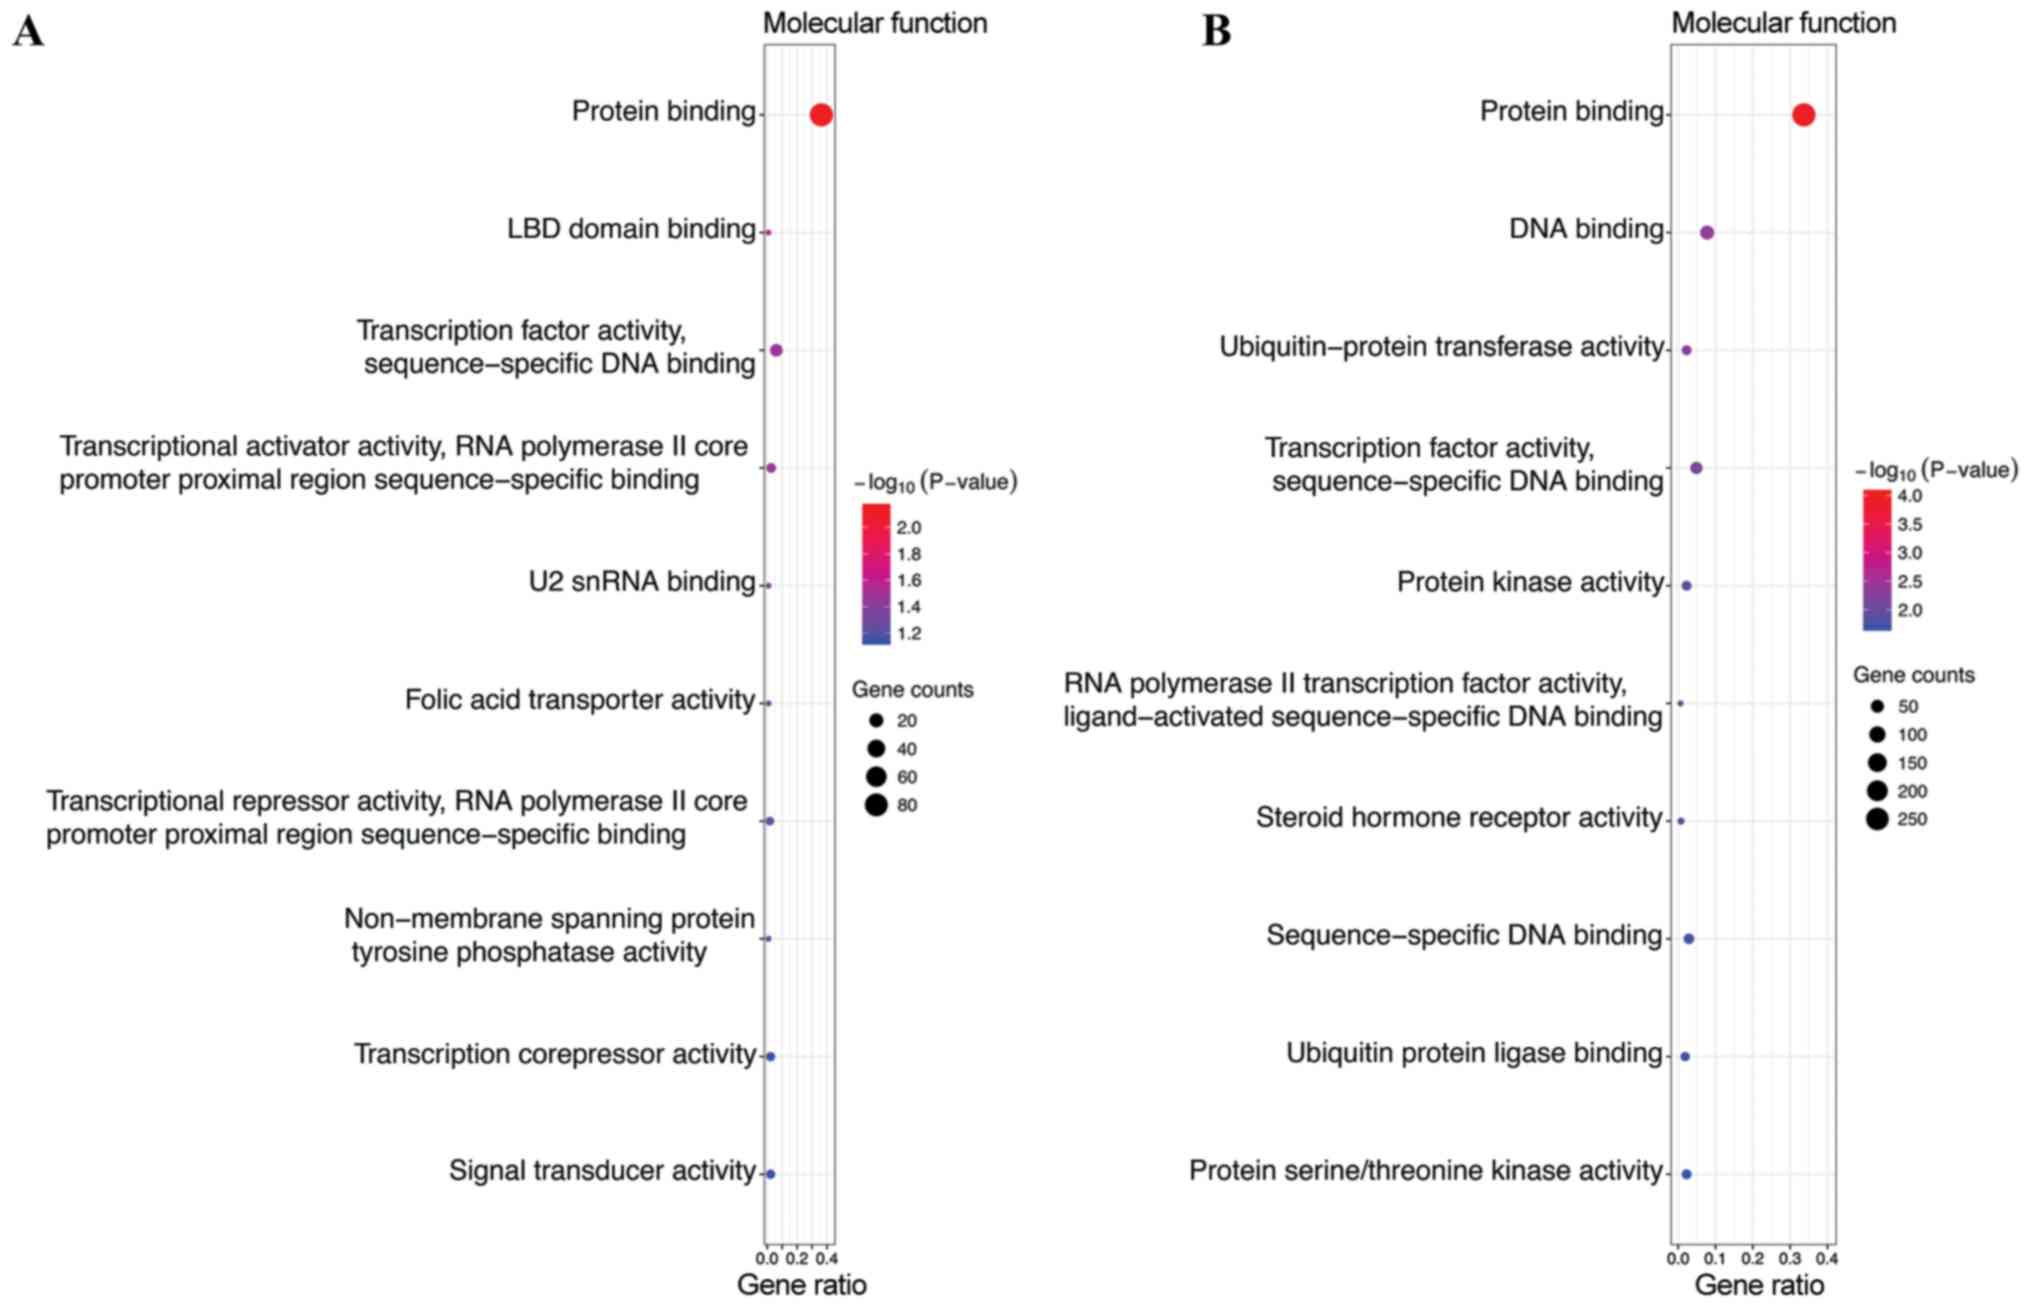
were enriched in nucleus, nucleoplasm and cytosol (Fig. 2B). In the MF category, the target
genes of the top 3 most highly upregulated miRNAs were
significantly enriched in protein binding, transcription factor
activity, sequence-specific DNA binding, transcriptional activator
activity, and RNA polymerase II core promoter proximal region
sequence-specific binding (Fig. 3A),
while the target genes of the top 3 most highly downregulated
miRNAs were enriched in protein binding, DNA binding and
transcription factor activity, and sequence-specific DNA binding
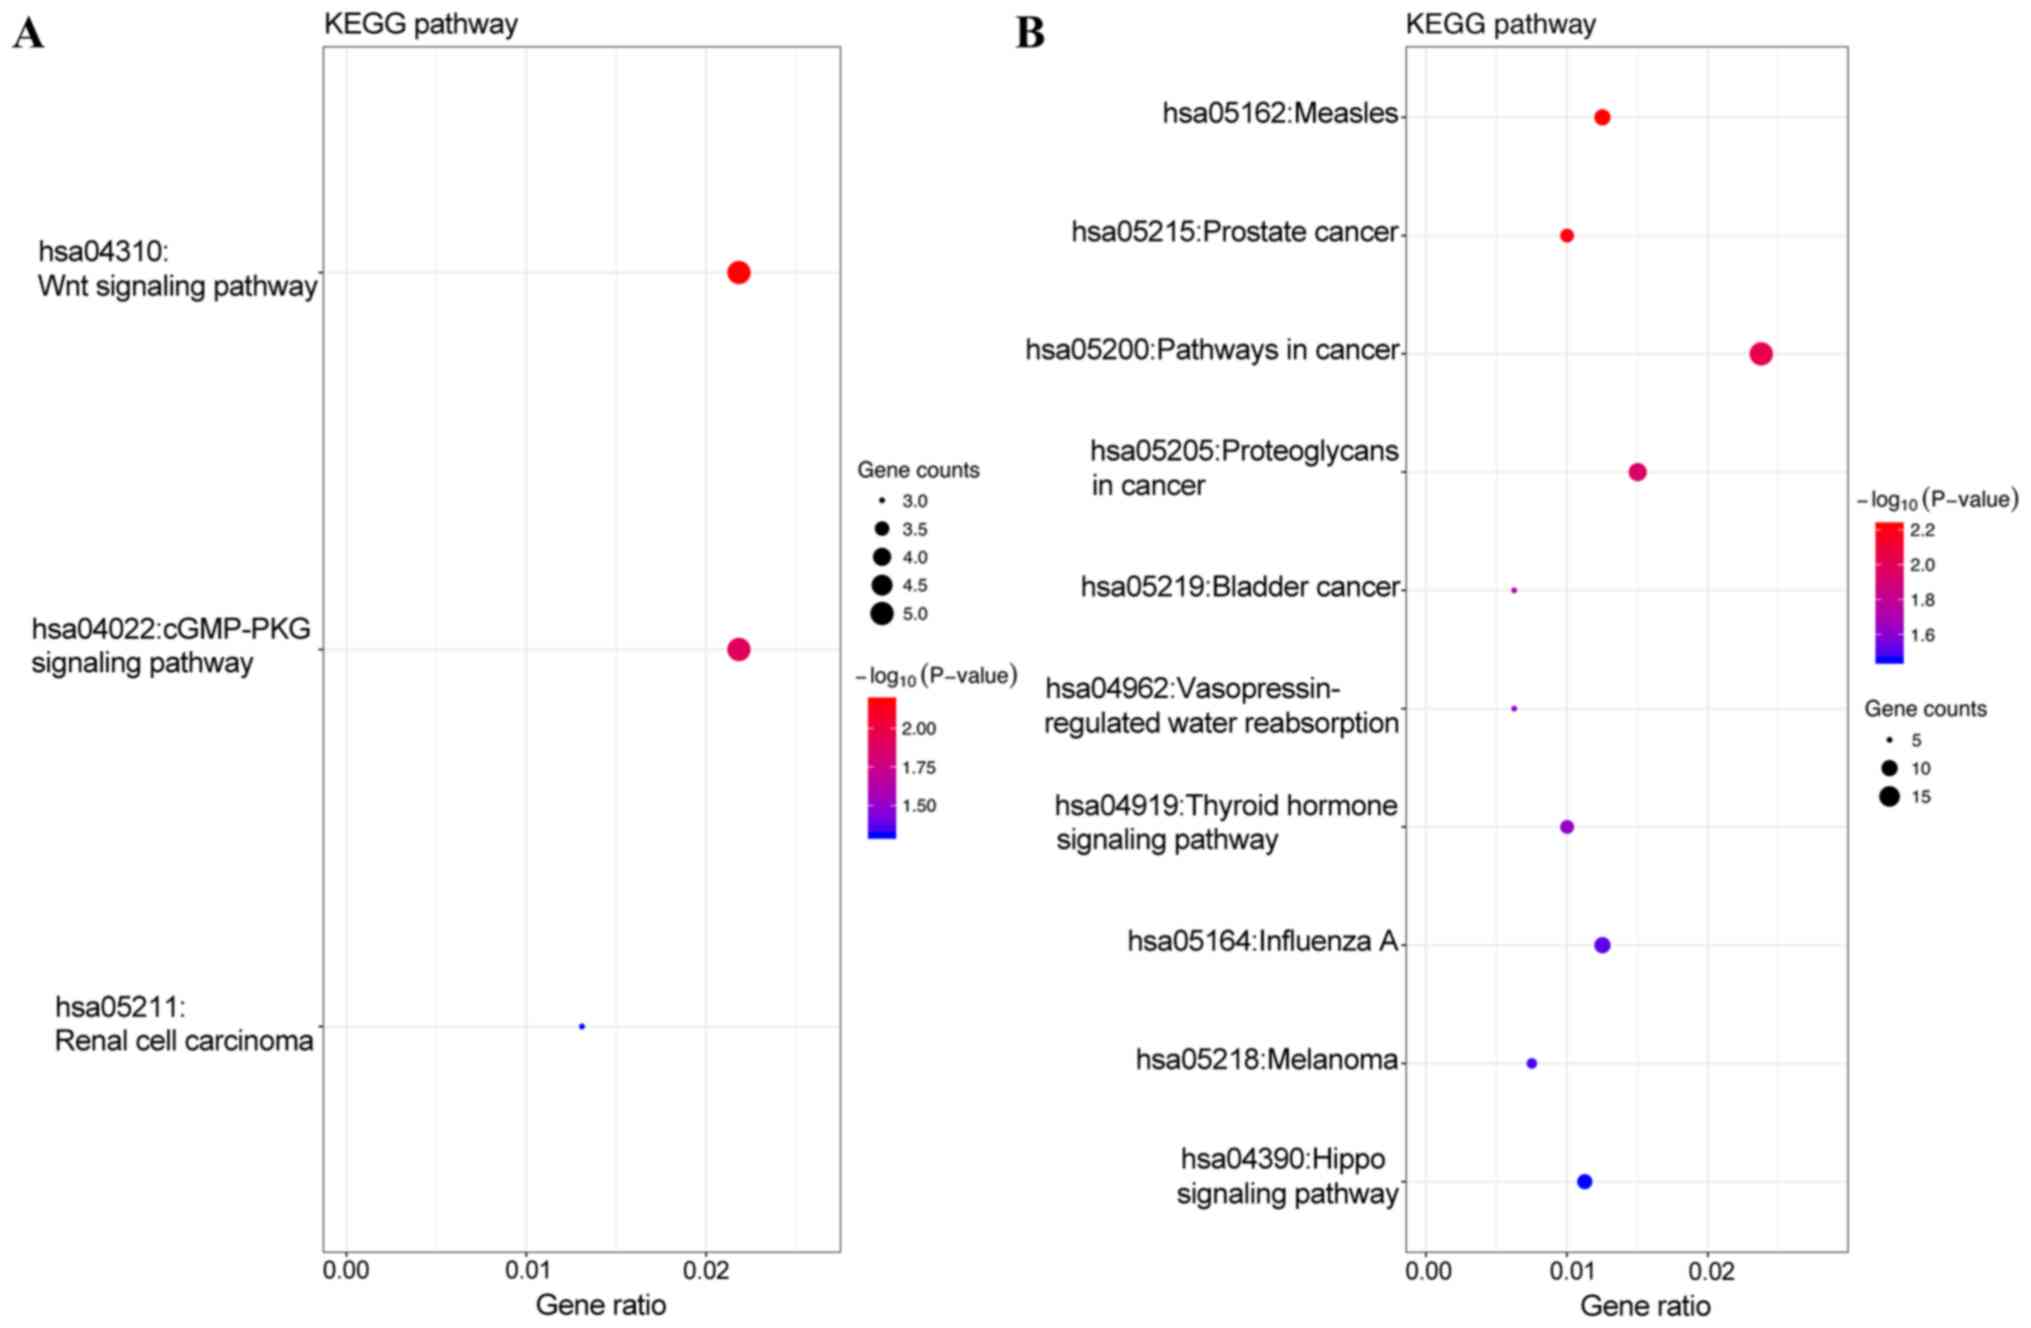
(Fig. 3B). In addition, KEGG pathway
analysis revealed that the target genes of the top 3 most highly
upregulated miRNAs were mainly enriched in the Wnt signaling
pathway, cGMP-PKG signaling pathway and renal cell carcinoma
(Fig. 4A), while the target genes of
the top three most highly downregulated miRNAs were mainly enriched
in pathways in cancer, proteoglycans in cancer, measles and
influenza A (Fig. 4B) (Tables II and III).
| Table II.Functional and pathway enrichment
analysis for target genes of the top 3 upregulated miRNAs. |
Table II.
Functional and pathway enrichment
analysis for target genes of the top 3 upregulated miRNAs.
| Category | Term | Pathway
description | Count | P-value |
|---|
| Upregulated
miRNAs |
|
|
|
|
| GO BP | GO:0060412 | Ventricular septum
morphogenesis | 3 | 0.020464503 |
| GO BP | GO:0007286 | Spermatid
development | 4 | 0.021020749 |
| GO BP | GO:0000122 | Negative regulation
of transcription from RNA polymerase II promoter | 12 | 0.021742388 |
| GO BP | GO:0006351 | Transcription,
DNA-templated | 24 | 0.022393279 |
| GO BP | GO:0030154 | Cell
differentiation | 9 | 0.025194909 |
| GO BP | GO:0097411 | Hypoxia-inducible
factor-1α signaling pathway | 2 | 0.030146509 |
| GO BP | GO:0030177 | Positive regulation
of Wnt signaling pathway | 3 | 0.030678983 |
| GO BP | GO:0007165 | Signal
transduction | 16 | 0.030948235 |
| GO BP | GO:0030336 | Negative regulation
of cell migration | 4 | 0.036066871 |
| GO BP | GO:0045944 | Positive regulation
of transcription from RNA polymerase II promoter | 14 | 0.03646379 |
| GO CC | GO:0005737 | Cytoplasm | 52 | 0.0134897 |
| GO CC | GO:0031519 | PcG protein
complex | 3 | 0.016939042 |
| GO CC | GO:0005634 | Nucleus | 52 | 0.026624876 |
| GO CC | GO:0005794 | Golgi
apparatus | 13 | 0.026655792 |
| GO CC | GO:0005654 | Nucleoplasm | 29 | 0.053523267 |
| GO CC | GO:0031526 | Brush border
membrane | 3 | 0.054869988 |
| GO CC | GO:0000139 | Golgi membrane | 9 | 0.072820488 |
| GO CC | GO:0044798 | Nuclear
transcription factor complex | 2 | 0.078554642 |
| GO CC | GO:0005829 | Cytosol | 32 | 0.094144731 |
| GO MF | GO:0005515 | Protein
binding | 83 | 0.007060503 |
| GO MF | GO:0050693 | LBD domain
binding | 2 | 0.030452531 |
| GO MF | GO:0003700 | Transcription
factor activity, sequence-specific DNA binding | 14 | 0.034027538 |
| GO MF | GO:0001077 | Transcriptional
activator activity, RNA polymerase II core sequence-specific
binding | 6 | 0.035934263 |
| GO MF | GO:0030620 | U2 snRNA
binding | 2 | 0.045331887 |
| GO MF | GO:0008517 | Folic acid
transporter activity | 2 | 0.052686367 |
| GO MF | GO:0001078 | Transcriptional
repressor activity, RNA polymerase II core promoter proximal region
sequence-specific binding | 4 | 0.054345955 |
| GO MF | GO:0004726 | Non-membrane
spanning protein tyrosine phosphatase activity | 2 | 0.059984623 |
| GO MF | GO:0003714 | Transcription
corepressor activity | 5 | 0.071931973 |
| GO MF | GO:0004871 | Signal transducer
activity | 5 | 0.07295342 |
| KEGG | hsa04310 | Wnt signaling
pathway | 5 | 0.006641183 |
| KEGG | hsa04022 | cGMP-PKG signaling
pathway | 5 | 0.01255563 |
| KEGG | hsa05211 | Renal cell
carcinoma | 3 | 0.049309583 |
| Table III.Functional and pathway enrichment
analysis for target genes of the top 3 downregulated miRNAs. |
Table III.
Functional and pathway enrichment
analysis for target genes of the top 3 downregulated miRNAs.
| Category | Term | Description | Count | P-value |
|---|
| Downregulated
miRNAs |
|
|
|
|
| GO
BP | GO:0046777 | Protein
autophosphorylation | 15 | 0.000170888 |
| GO
BP | GO:0006355 | Regulation of
transcription, DNA-templated | 59 | 0.001639464 |
| GO
BP | GO:0006357 | Regulation of
transcription from RNA polymerase II promoter | 23 | 0.002882721 |
| GO
BP | GO:0016567 | Protein
ubiquitination | 20 | 0.002898481 |
| GO
BP | GO:0006351 | Transcription,
DNA-templated | 71 | 0.003602574 |
| GO
BP | GO:0006123 | Mitochondrial
electron transport, cytochrome c to oxygen | 4 | 0.014446477 |
| GO
BP | GO:0042119 | Neutrophil
activation | 3 | 0.017126856 |
| GO
BP | GO:0007223 | Wnt signaling
pathway, calcium modulating pathway | 5 | 0.018278676 |
| GO
BP | GO:0008654 | Phospholipid
biosynthetic process | 5 | 0.019902891 |
| GO
BP | GO:0048468 | Cell
development | 5 | 0.019902891 |
| GO
CC | GO:0005654 | Nucleoplasm | 112 | 6.68468E-07 |
| GO
CC | GO:0005634 | Nucleus | 170 | 0.001202665 |
| GO
CC | GO:0017053 | Transcriptional
repressor complex | 7 | 0.002719148 |
| GO
CC | GO:0005758 | Mitochondrial
intermembrane space | 8 | 0.002811554 |
| GO
CC | GO:0005813 | Centrosome | 22 | 0.003323275 |
| GO
CC | GO:0005739 | Mitochondrion | 50 | 0.006368195 |
| GO
CC | GO:0031463 | Cul3-RING ubiquitin
ligase complex | 7 | 0.007248149 |
| GO
CC | GO:0005829 | Cytosol | 106 | 0.009417134 |
| GO
CC | GO:0015629 | Actin
cytoskeleton | 13 | 0.010602362 |
| GO
CC | GO:0005741 | Mitochondrial outer
membrane | 10 | 0.014535489 |
| GO
MF | GO:0005515 | Protein
binding | 269 | 9.14069E-05 |
| GO
MF | GO:0003677 | DNA binding | 62 | 0.004456722 |
| GO
MF | GO:0004842 | Ubiquitin-protein
transferase activity | 18 | 0.005935513 |
| GO
MF | GO:0003700 | Transcription
factor activity, sequence-specific DNA binding | 39 | 0.006954496 |
| GO
MF | GO:0004672 | Protein kinase
activity | 18 | 0.013435998 |
| GO
MF | GO:0004879 | RNA polymerase II
transcription factor activity, ligand-activated sequence-specific
DNA binding | 5 | 0.013877869 |
| GO
MF | GO:0003707 | Steroid hormone
receptor activity | 6 | 0.015112205 |
| GO
MF | GO:0043565 | Sequence-specific
DNA binding | 23 | 0.017535243 |
| GO
MF | GO:0031625 | Ubiquitin protein
ligase binding | 15 | 0.018757483 |
| GO
MF | GO:0004674 | Protein
serine/threonine kinase activity | 18 | 0.020173241 |
| KEGG | hsa05162 | Measles | 10 | 0.005987506 |
| KEGG | hsa05215 | Prostate
cancer | 8 | 0.006312095 |
| KEGG | hsa05200 | Pathways in
cancer | 19 | 0.009215433 |
| KEGG | hsa05205 | Proteoglycans in
cancer | 12 | 0.011467731 |
| KEGG | hsa05219 | Bladder cancer | 5 | 0.018691786 |
| KEGG | hsa04962 |
Vasopressin-regulated water
reabsorption | 5 | 0.023655555 |
| KEGG | hsa04919 | Thyroid hormone
signaling pathway | 8 | 0.023895596 |
| KEGG | hsa05164 | Iinfluenza A | 10 | 0.030429321 |
| KEGG | hsa05218 | Melanoma | 6 | 0.032052212 |
| KEGG | hsa04390 | Hippo signaling
pathway | 9 | 0.035379929 |
PPI network construction and module
analysis
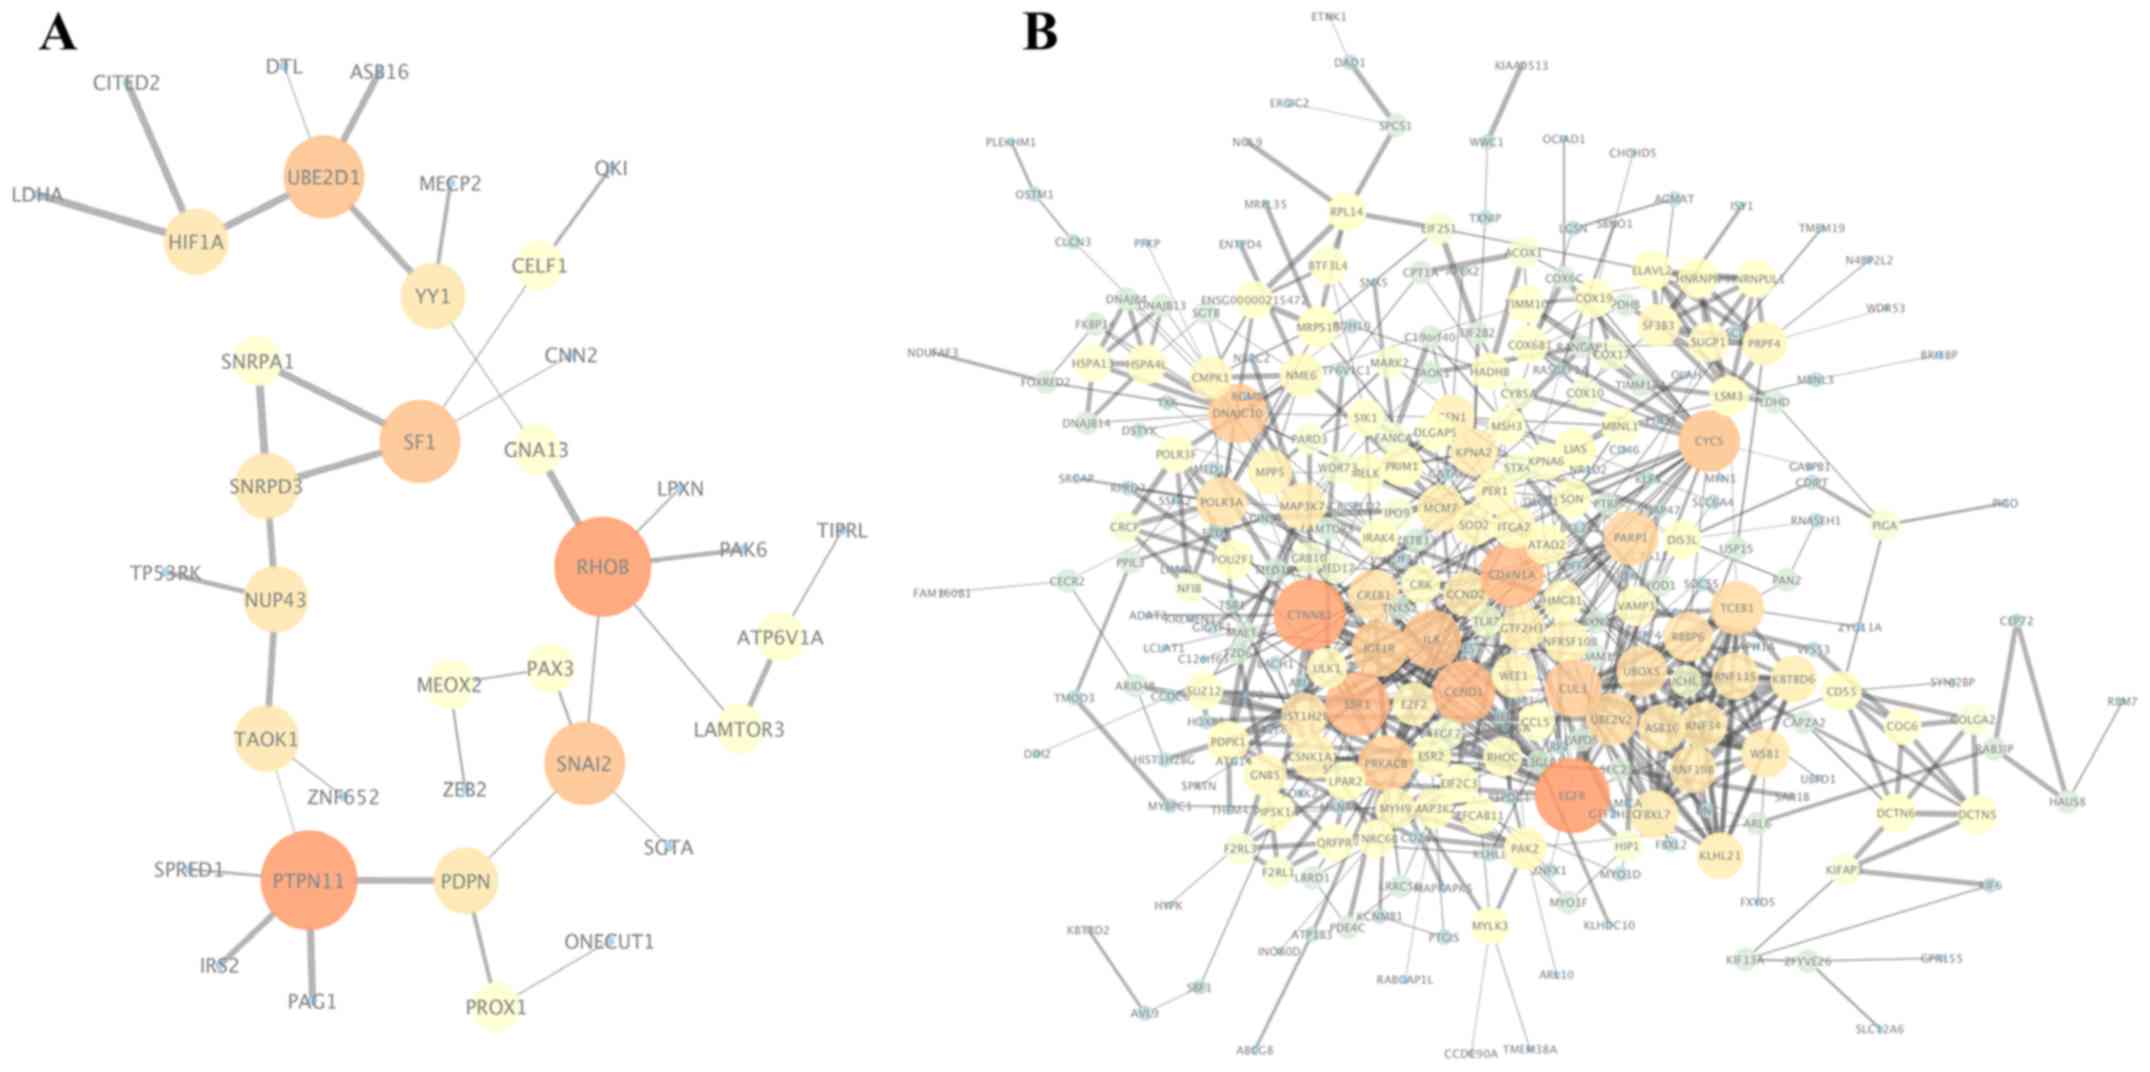
The PPI networks of the target genes of the top 3
most highly upregulated and downregulated DEMs were constructed
(Fig. 5), and the most significant
module was obtained using the MCODE plugin of Cytoscape. The genes
in the most significant module of the upregulated DEMs were SF1,
SNRPD3 and SNRPA1, while the genes in the most
significant module of the downregulated DEMs were RNF34, RNF19B,
ASB16, FBXL7, UBE2V2, RBBP6, KBTBD6, WSB1, KLHL21, CUL3, TCEB1,
UBOX5 and RNF115. Functional analyses of the genes
involved in the module of the downregulated DEMs were performed
using DAVID, showing that genes in this module were mainly enriched
in protein K48-linked ubiquitination (BP), polar microtubule (CC),
ubiquitin-protein transferase activity (MF), and ubiquitin-mediated
proteolysis(KEGG).
Hub gene analysis and miRNA-hub gene
network construction
For the upregulated miRNAs, the hub genes included
RHOB, PTPN11, SNAI2, UBE2D1, SF1, PDPN, NUP43, YY1, HIF1A
and SNRPD3. For the downregulated miRNAs, the hub genes were
EGFR, CTNNB1, ESR1, CDKN1A, CCND1, CYCS, DNAJC10, IL8, CUL3
and IGF1R. The abbreviations, full names and functions of
these 20 hub genes are shown in Table
IV. Among these genes, EGFR (epidermal growth factor
receptor) demonstrated the highest node degrees, which suggested
that EGFR may be a key target associated with prolactin
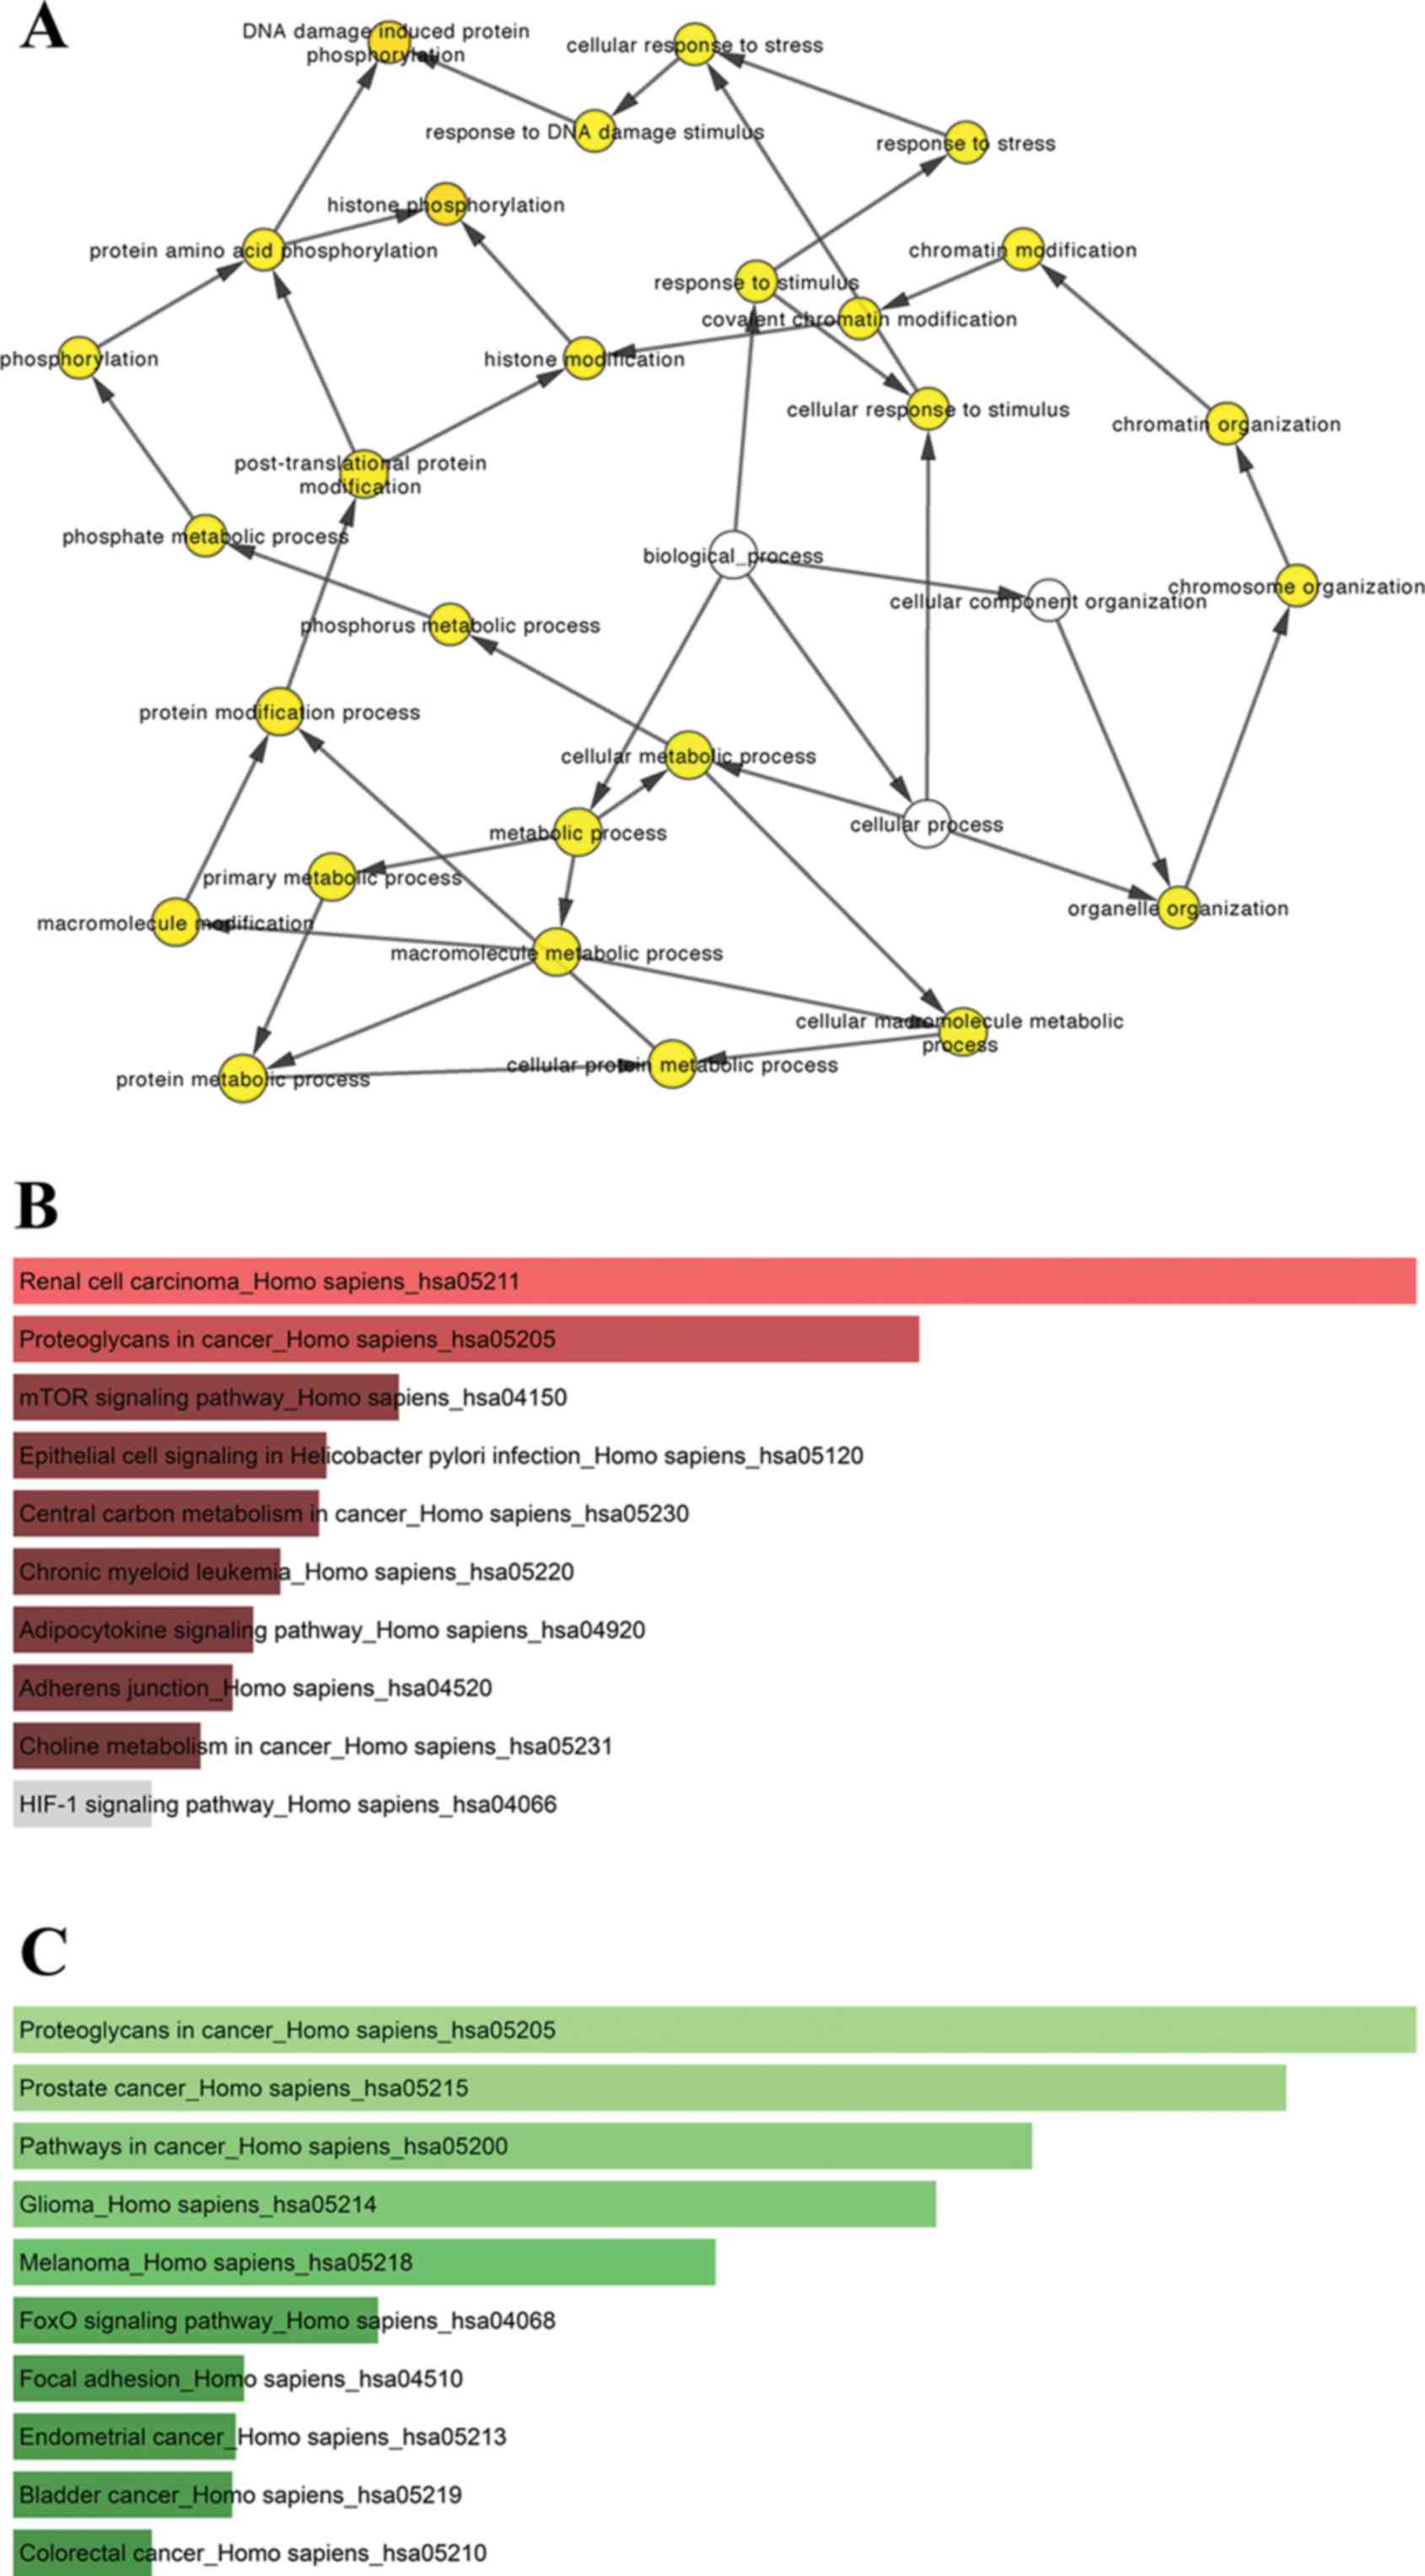
pituitary tumor aggressiveness. Biological process analysis of the
hub genes is shown in Fig. 6A.
Functional and pathway enrichment analyses for the hub genes of the
top 3 upregulated and downregulated miRNAs are presented in
Tables V and VI. As shown in Fig. 6, KEGG analysis showed that the hub
genes of the upregulated miRNAs were mainly enriched in renal cell
carcinoma and proteoglycans in cancer (Fig. 6B, Table
V), while the hub genes of the downregulated miRNAs were mainly
enriched in proteoglycans in cancer, prostate cancer and pathways
in cancer (Fig. 6C, Table VI).
| Table IV.Functional roles of the hub genes of
the top 3 upregulated/downregulated miRNAs identified in the PPI
interaction. |
Table IV.
Functional roles of the hub genes of
the top 3 upregulated/downregulated miRNAs identified in the PPI
interaction.
| Gene symbol | Degree | Full name | Function |
|---|
| Upregulated
miRNAs |
|
|
|
|
RHOB | 16 | Ras homolog family
member B | Protein coding
gene. Among its related pathways are ERK signaling and focal
adhesion. GO annotations related to this gene include GTP binding
and GDP binding. |
|
PTPN11 | 15 | Protein tyrosine
phosphatase, non-receptor type 11 | Protein coding
gene. Among its related pathways are immune response Fcε RI pathway
and EGF/EGFR signaling pathway. GO annotations related to this gene
include protein domain-specific binding and protein tyrosine
phosphatase activity. |
|
SNAI2 | 15 | Snail family
transcriptional repressor 2 | Protein coding
gene. Among its related pathways are ERK signaling and adherens
junction. GO annotations related to this gene include
sequence-specific DNA binding and tran scriptional repressor
activity, RNA polymerase II proximal promoter sequence-specific DNA
binding. |
|
UBE2D1 | 14 | Ubiquitin
conjugating enzyme E2 D1 | Protein coding
gene. Among its related pathways are gene expression and cell
cycle, mitotic. GO annotations related to this gene include ligase
activity and acid-amino acid ligase activity. |
|
SF1 | 14 | Splicing factor
1 | Protein Coding
gene. Among its related pathways are Oct4 in mammalian ESC
pluripotency and mRNA splicing-major pathway. GO annotations
related to this gene include nucleic acid binding and RNA
binding. |
|
PDPN | 14 | Podoplanin | Protein coding
gene. Among its related pathways are cytoskel etal signaling and
response to elevated platelet cytosolic Ca2+. GO
annotations related to this gene include amino acid trans membrane
transporter activity and folic acid transmembrane transporter
activity. |
|
NUP43 | 13 | Nucleoporin 43 | Protein coding
gene. Among its related pathways are cell cycle, mitotic and
transport of the SLBP independent mature mRNA. |
|
YY1 | 13 | YY1 transcription
factor | Protein coding
gene. Among its related pathways are gene expression and
translational control. GO annotations related to this gene include
DNA binding transcription factor activity and transcription
coactivator activity. |
|
HIF1A | 11 | Hypoxia inducible
factor 1 subunit α | Protein coding
gene. Among its related pathways are ERK signaling and central
carbon metabolism in cancer. GO anno tations related to this gene
include DNA binding transcription factor activity and protein
heterodimerization activity. |
| SNRPD3 | 11 | Small nuclear
ribonu cleoprotein D3 polypeptide | Protein coding
gene. Among its related pathways are mRNA splicing-major pathway
and processing of capped intronless pre-mRNA. GO annotations
related to this gene include histone pre-mRNA DCP binding. |
| Downregulated
miRNAs |
|
|
|
|
EGFR | 33 | Epidermal growth
factor receptor | Protein coding
gene. Among its related pathways are ERK signaling and gene
expression. GO annotations related to this gene include identical
protein binding and protein kinase activity. |
|
CTNNB1 | 31 | Catenin β1 | Protein coding
gene. Among its related pathways are ERK signaling and focal
adhesion. GO annotations related to this gene include DNA binding
transcription factor activity and binding. |
|
ESR1 | 25 | Estrogen receptor
1 | Estrogen resistance
and myocardial infarction. Among its related pathways are gene
expression and integrated breast cancer pathway. GO annotations
related to this gene include DNA binding transcription factor
activity and identical protein binding. |
|
CDKN1A | 25 | Cyclin dependent
kinase inhibitor 1A | Protein coding
gene. Among its related pathways are gene expression and Akt
signaling. GO annotations related to this gene include ubiquitin
protein ligase binding and cyclin binding. |
|
CCND1 | 24 | Cyclin D1 | Protein coding
gene. Diseases associated with CCND1 include myeloma, multiple and
Von Hippel-Lindau syndrome. Among its related pathways are ERK
signaling and focal adhesion. GO annotations related to this gene
include protein kinase activity and enzyme binding. |
|
CYCS | 23 | Cytochrome
c, somatic | Protein coding
gene. Diseases associated with CYCS include thrombocytopenia 4 and
autosomal thrombocytopenia with normal platelets. Among its related
pathways are gene expression and activation of caspases through
apoptosome-mediated cleavage. GO annotations related to this gene
include iron ion binding and electron transfer activity. |
|
DNAJC10 | 21 | DNAJ heat shock
protein family (Hsp40) member C10 | Protein coding
gene. Among its related pathways are protein processing in
endoplasmic reticulum. GO annotations related to this gene include
chaperone binding and protein disulfide oxidoreductase
activity. |
|
IL8 | 21 | C-X-C motif
chemokine ligand 8 | Protein coding
gene. Among its related pathways are Akt signaling and rheumatoid
arthritis. GO annotations related to this gene include chemokine
activity and interleukin-8 receptor binding. |
|
CUL3 | 20 | Cullin 3 | Protein Coding
gene. Among its related pathways are RET signaling and Class I MHC
mediated antigen processing and presentation. GO annotations
related to this gene include protein homodimerization activity and
ubiquitin-protein trans ferase activity. |
|
IGF1R | 19 | Insulin like growth
factor 1 receptor | Protein coding
gene. Among its related pathways are ERK signaling and mTOR
pathway. GO annotations related to this gene include identical
protein binding and protein kinase activity. |
| Table V.Functional and pathway enrichment
analysis for the hub genes of the top 3 upregulated miRNAs. |
Table V.
Functional and pathway enrichment
analysis for the hub genes of the top 3 upregulated miRNAs.
| Category | Term | Pathway
description | Genes |
|---|
| Upregulated
miRNAs |
|
|
|
| GO
BP | GO:0032364 | Oxygen
homeostasis | HIF1A |
| GO
BP | GO:0032909 | Regulation of
transforming growth factor β2 production | HIF1A |
| GO
BP | GO:0033483 | Gas
homeostasis | HIF1A |
| GO
BP | GO:0032642 | Regulation of
chemokine production | SNAI2,
HIF1A |
| GO
BP | GO:0046885 | Regulation of
hormone biosynthetic process | HIF1A |
| GO
BP | GO:0043619 | Regulation of
transcription from RNA polymerase II promoter in response to
oxidative stress | HIF1A |
| GO
BP | GO:0070099 | Regulation of
chemokine-mediated signaling pathway | HIF1A |
| GO
BP | GO:0032352 | Positive regulation
of hormone metabolic process | HIF1A |
| GO
BP | GO:0010839 | Negative regulation
of keratinocyte proliferation | SNAI2 |
| GO
BP | GO:0071364 | Cellular response
to epidermal growth factor stimulus | SNAI2,
PTPN11 |
| GO
CC | GO:0031528 | Microvillus
membrane | PDPN |
| GO
CC | GO:0000243 | Commitment
complex | SNRPD3 |
| GO
CC | GO:0005683 | U7 snRNP | SNRPD3 |
| GO
CC | GO:0005687 | U4 snRNP | SNRPD3 |
| GO
CC | GO:0034709 | Methylosome | SNRPD3 |
| GO
CC | GO:0031527 | Filopodium
membrane | PDPN |
| GO
CC | GO:0071437 | Invadopodium | PDPN |
| GO
CC | GO:0031011 | Ino80 complex | YY1 |
| GO
CC | GO:0005685 | U1 snRNP | SNRPD3 |
| GO
CC | GO:0031258 | Lamellipodium
membrane | PDPN |
| GO
MF | GO:0000400 | Four-way junction
DNA binding | YY1 |
| GO
MF | GO:0001227 | Transcriptional
repressor activity, RNA polymerase II transcription regulatory
region sequence-specific binding | YY1,
SNAI2 |
| GO
MF | GO:0019956 | Chemokine
binding | PDPN |
| GO
MF | GO:0043565 | Sequence-specific
DNA binding | YY1, SNAI2,
HIF1A |
| GO
MF | GO:0061631 | Ubiquitin
conjugating enzyme activity | UBE2D1 |
| GO
MF | GO:0000217 | DNA secondary
structure binding | YY1 |
| GO
MF | GO:0061650 | Ubiquitin-like
protein conjugating enzyme activity | UBE2D1 |
| GO
MF | GO:0005158 | Insulin receptor
binding | PTPN11 |
| GO
MF | GO:0035326 | Enhancer
binding | YY1 |
| GO
MF | GO:0001078 | Transcriptional
repressor activity, RNA polymerase II core promoter proximal region
sequence-specific binding | YY1,
SNAI2 |
| KEGG | hsa05211 | Renal cell
carcinoma | PTPN11,
HIF1A |
| KEGG | hsa05205 | Proteoglycans in
cancer | PTPN11,
HIF1A |
| KEGG | hsa04150 | mTOR signaling
pathway | HIF1A |
| KEGG | hsa05120 | Epithelial cell
signaling in Helicobacter pylori infection | PTPN11 |
| KEGG | hsa05230 | Central carbon
metabolism in cancer | HIF1A |
| KEGG | hsa05220 | Chronic myeloid
leukemia | PTPN11 |
| KEGG | hsa04920 | Adipocytokine
signaling pathway | PTPN11 |
| KEGG | hsa04520 | Adherens
junction | SNAI2 |
| KEGG | hsa05231 | Choline metabolism
in cancer | HIF1A |
| KEGG | hsa04066 | HIF-1 signaling
pathway | HIF1A |
| Table VI.Functional and pathway enrichment
analysis for the hub genes of top 3 downregulated miRNAs. |
Table VI.
Functional and pathway enrichment
analysis for the hub genes of top 3 downregulated miRNAs.
| Category | Term | Pathway
description | Genes |
|---|
| Downregulated
miRNAs |
|
|
|
| GO
BP | GO:0070141 | Response to
UV-A | CCND1,
EGFR |
| GO
BP | GO:0097193 | Intrinsic apoptotic
signaling pathway | CDKN1A, CUL3,
DNAJC10, CYCS |
| GO
BP | GO:0032355 | Response to
estradiol | CTNNB1, ESR1,
EGFR |
| GO
BP | GO:1903798 | Regulation of
production of miRNAs involved in gene silencing by miRNA | ESR1,
EGFR |
| GO
BP | GO:0033674 | Positive regulation
of kinase activity | CDKN1A, EGFR,
IGF1R |
| GO
BP | GO:0001934 | Positive regulation
of protein phosphorylation | CDKN1A, CCND1,
EGFR, IGF1R |
| GO
BP | GO:0045737 | Positive regulation
of cyclin-dependent protein serine/threonine kinase activity | CCND1,
EGFR |
| GO
BP | GO:0045740 | Positive regulation
of DNA replication | EGFR,
IGF1R |
| GO
BP | GO:0006367 | Transcription
initiation from RNA polymerase II promoter | CDKN1A, CCND1,
ESR1 |
| GO
BP | GO:0034333 | Adherens junction
assembly | CTNNB1 |
| GO
CC | GO:0030128 | Clathrin coat of
endocytic vesicle | EGFR |
| GO
CC | GO:0030122 | AP-2 adaptor
complex | EGFR |
| GO
CC | GO:0030131 | Clathrin adaptor
complex | EGFR |
| GO
CC | GO:1990907 | β-catenin-TCF
complex | CTNNB1 |
| GO
CC | GO:0005719 | Nuclear
euchromatin | CTNNB1 |
| GO
CC | GO:0000791 | Euchromatin | CTNNB1 |
| GO
CC | GO:0035327 | Transcriptionally
active chromatin | ESR1 |
| GO
CC | GO:0000790 | Nuclear
chromatin | CTNNB1,
ESR1 |
| GO
CC | GO:0005758 | Mitochondrial
intermembrane space | CYCS |
| GO
CC | GO:0016342 | Catenin
complex | CTNNB1 |
| GO
MF | GO:0097472 | Cyclin-dependent
protein kinase activity | CDKN1A,
CCND1 |
| GO
MF | GO:0019900 | Kinase binding | CDKN1A, CCND1,
CTNNB1, ESR1 |
| GO
MF | GO:0004693 | Cyclin-dependent
protein serine/threonine kinase activity | CDKN1A,
CCND1 |
| GO
MF | GO:0004709 | MAP kinase kinase
kinase activity | EGFR,
IGF1R |
| GO
MF | GO:0001223 | Transcription
coactivator binding | ESR1 |
| GO
MF | GO:0044389 | Ubiquitin-like
protein ligase binding | CDKN1A, CUL3,
EGFR |
| GO
MF | GO:0019901 | Protein kinase
binding | CDKN1A, CCND1,
ESR1, EGFR, IGF1R |
| GO
MF | GO:0030331 | Estrogen receptor
binding | CTNNB1,
ESR1 |
| GO
MF | GO:0016671 | Oxidoreductase
activity, acting on a sulfur group of donors, disulfide as
acceptor | DNAJC10 |
| GO
MF | GO:0046934 |
Phosphatidylinositol-4,5-bisphosphate
3-kinase activity | ESR1,
EGFR |
|
KEGG | hsa05205 | Proteoglycans in
cancer | CDKN1A, CCND1,
ESR1, CTNNB1, EGFR, IGF1R |
|
KEGG | hsa05215 | Prostate
cancer | CDKN1A, CCND1,
CTNNB1, EGFR, IGF1R |
|
KEGG | hsa05200 | Pathways in
cancer | CDKN1A, CCND1,
CTNNB1, CYCS, EGFR, IGF1R |
|
KEGG | hsa05214 | Glioma | CDKN1A, CCND1,
EGFR, IGF1R |
|
KEGG | hsa05218 | Melanoma | CDKN1A, CCND1,
EGFR, IGF1R |
|
KEGG | hsa04068 | FoxO signaling
pathway | CDKN1A, CCND1,
EGFR, IGF1R |
|
KEGG | hsa04510 | Focal adhesion | CCND1, CTNNB1,
EGFR, IGF1R |
|
KEGG | hsa05213 | Endometrial
cancer | CCND1, CTNNB1,
EGFR |
|
KEGG | hsa05219 | Bladder cancer | CDKN1A, CCND1,
EGFR |
|
KEGG | hsa05210 | Colorectal
cancer | CCND1, CYCS,
CTNNB1 |
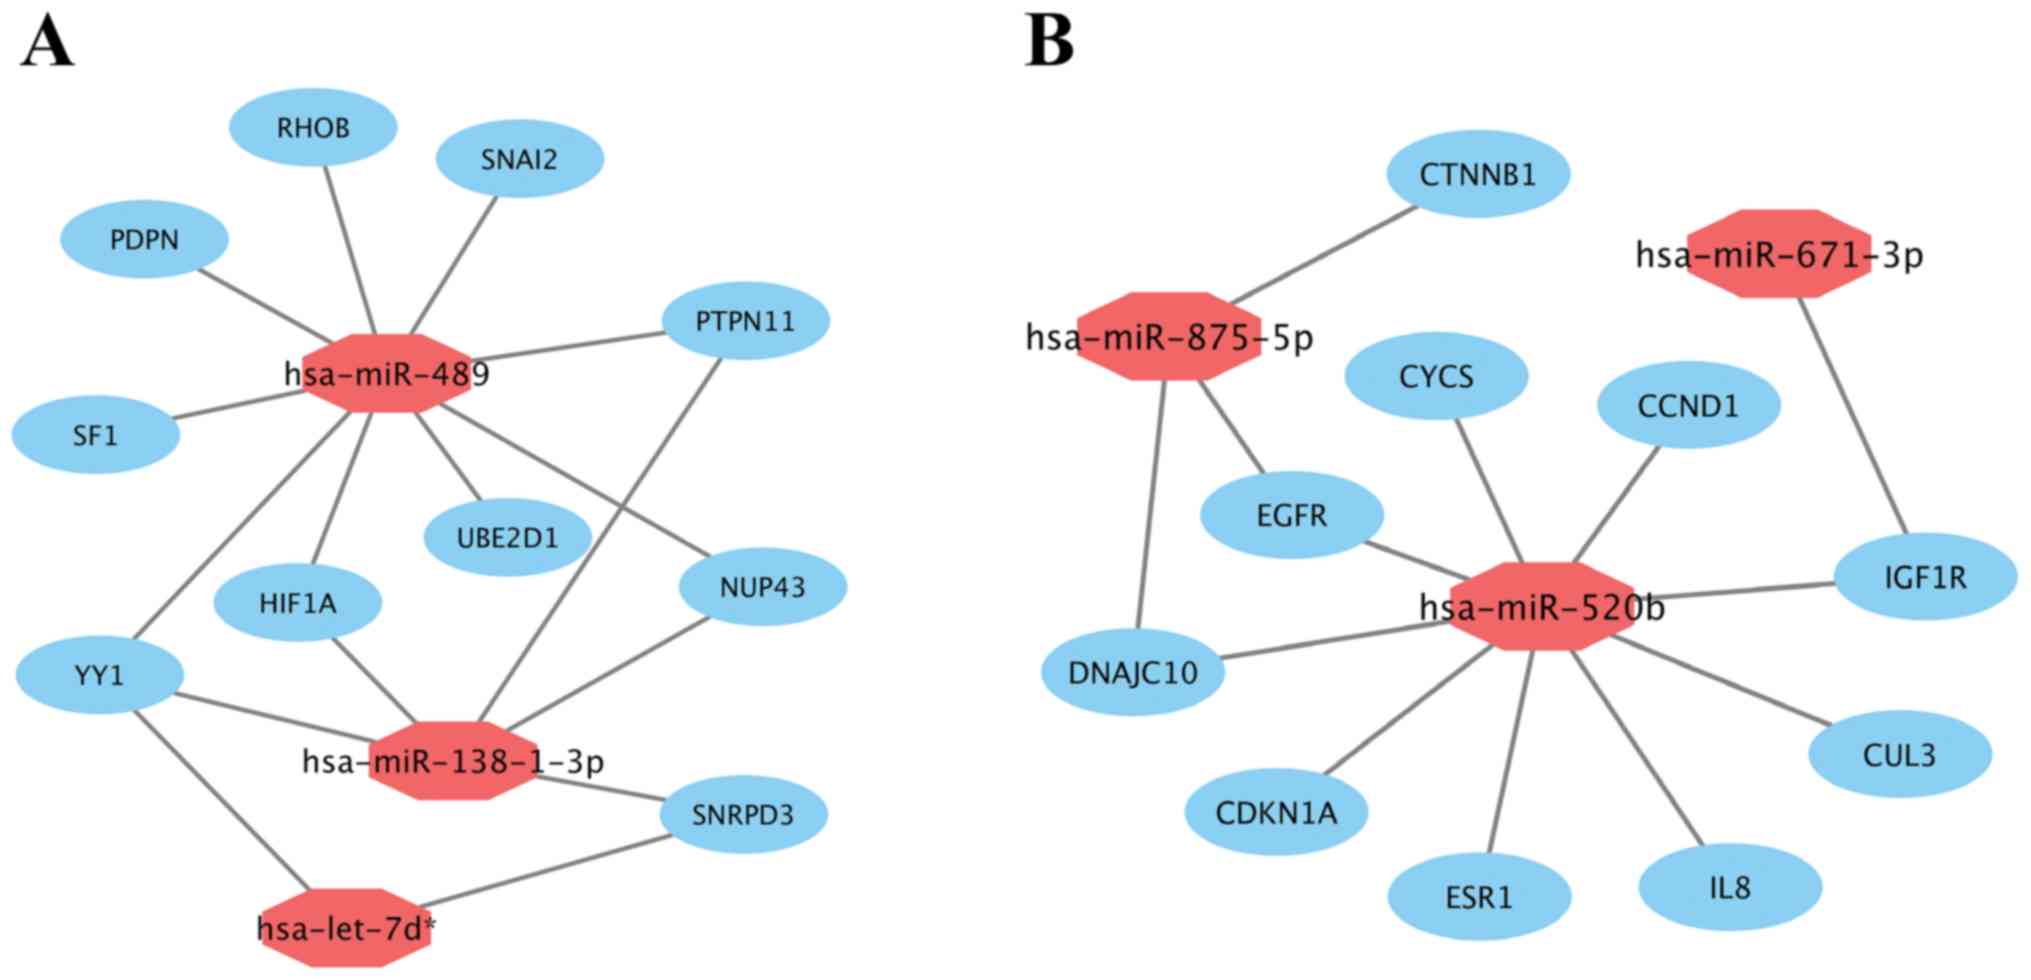
Subsequently, miRNA-hub gene networks were
constructed by Cytoscape (Fig. 7). As
shown in Fig. 7A, hsa-miR-489, the
most highly upregulated DEM, potentially could target 9 (RHOB,
PTPN11, SNAI2, UBE2D1, SF1, PDPN, NUP43, YY1 and HIF1A)
of 10 hub genes. Five hub genes and 2 hub genes potentially were
regulated by upregulated hsa-miR-138-1-3p and hsa-let-7d*,
respectively. Additionally, according to Fig. 7B, hsa-miR-520b, the most highly
downregulated DEM, potentially could also target 9 (EGFR, ESR1,
CDKN1A, CCND1, CYCS, DNAJC10, IL8, CUL3 and IGF1R) of 10
hub genes. Three hub genes and 1 hub gene potentially were
regulated by downregulated hsa-miR-875-5p and hsa-miR-671-3p,
respectively. The results suggested that hsa-miR-489 and
hsa-miR-520b may be the most important regulators of prolactin
pituitary tumor aggressiveness.
Discussion
Prolactin-secreting pituitary adenoma is the most
common (30–40%) subtype of pituitary tumors and commonly presents
with headache, visual disturbances, amenorrhea, galactorrhea,
infertility and hyposexuality (1,2). Most
prolactinomas are noninvasive and easily treated by surgery,
radiotherapy or medical treatment, including cabergoline and
dopamine agonists, which are highly effective drugs for
prolactinoma. However, aggressive prolactin pituitary tumors, with
unknown incidence, are entities whose pathological behaviors lie
between those of benign pituitary adenomas and malignant pituitary
carcinomas. They display a rather distinct aggressive behavior with
marked invasion of nearby anatomical structures, a tendency for
resistance to conventional treatments and/or TMZ, and early
postoperative recurrences (3,4). Extensive research has been performed to
explore potential biomarkers for early diagnosis and treatment of
aggressive pituitary tumors. The Raf/MEK/ERK, PI3K/Akt/mTOR, and
VEGFR pathways were found to be upregulated in pituitary tumors,
suggesting that these pathways may be utilized to control pituitary
tumor growth and progression (28–32).
However, most targeted therapies based on the above pathways have
been administered to patients with aggressive pituitary tumors
without success (32–34). Therefore, further research is needed
to discover aggressiveness-associated biomarkers with diagnostic
and therapeutic value for aggressive prolactin pituitary
tumors.
miRNAs are a group of small, endogenous noncoding
RNAs that can repress protein expression by cleaving mRNA or
inhibiting translation (8,9). Mostly, miRNAs are recognized as having a
significant role in the negative regulation of target gene
expression, which contributes to tumorigenesis, invasion and
metastasis in various types of tumors (10–12).
Recent studies have shown that aberrant miRNA expression is
involved in tumorigenesis and tumor development of pituitary
adenomas, especially prolactin pituitary tumors (13–16).
D'Angelo et al (35) found
that miR-603, miR-34b, miR-548c-3p, miR-326, miR-570 and miR-432
were downregulated in prolactinomas, which can affect the G1-S
transition process. Mussnich et al (36) found that miR-15, miR-26a, miR-196a-2,
miR-16, Let-7a and miR-410 were downregulated in prolactinomas,
which can negatively regulate pituitary cell proliferation. Roche
et al (17) demonstrated that
miR-183 was downregulated in aggressive prolactin tumors and
inhibited tumor cell proliferation by directly targeting KIAA0101,
which is involved in cell cycle activation and the inhibition of
p53-p21-mediated cell cycle arrest. However, few studies, except
for one reported by Roche et al (17) in 2015, have been performed to explore
aggressiveness-associated miRNAs in aggressive prolactin pituitary
tumors based on large-scale human tissue datasets. Additionally,
based on the GSE46294 dataset, our study obtained different DEMs
compared with those reported by Roche et al. The reasons may
be due to different softwares or different algorithms when
analyzing differentially expressed genes or RNAs, and due to the
small sample size of the GSE46294 dataset (37).
In the present study, some aggressiveness-associated
miRNAs were screened by performing a differential expression
analysis based on an miRNA expression profile downloaded from the
GEO database. The potential target genes of the top 3 most highly
upregulated and most highly downregulated DEMs were collectively
enriched for regulation of transcription from RNA polymerase II
promoter, DNA-templated transcription, Wnt signaling pathway,
protein binding, and transcription factor activity
(sequence-specific DNA binding). Moreover, by constructing PPI
networks, we identified the top 10 hub genes with the highest
degree of connectivity with the top 3 most highly upregulated and
downregulated DEMs. Hub genes of the upregulated DEMs were mainly
enriched for proteoglycans in cancer, while hub genes of the
downregulated DEMs were mainly enriched for proteoglycans in
cancer, pathways in cancer, FoxO signaling pathway, and focal
adhesion. Those pathways were all reported by previous studies to
be associated with tumor growth, progression invasion and
metastasis of various tumors (38–40). In
our study, proteoglycan in cancer is the enriched pathway shared by
both upregulated and downregulated DEMs. However, there is little
research on proteoglycan in tumorigenesis, invasiveness and
progression of pituitary tumors. Matano et al reported that
endocan, a novel soluble dermatan sulfate proteoglycan, can
function as a new invasion and angiogenesis marker of pituitary
adenomas (40). More studies are
needed to further research the functions of proteoglycan in
pituitary adenomas, especially aggressive tumors.
Among the 20 hub genes, EGFR demonstrated the
highest node degrees, suggesting that EGFR was a key target
associated with the aggressiveness of prolactin pituitary tumors,
which is consistent with previous studies (4,41).
EGFR encodes a transmembrane glycoprotein that is located on
the cell surface and binds to epidermal growth factor (EGF).
Binding of the protein to a ligand induces receptor dimerization
and tyrosine autophosphorylation, leading to cell proliferation.
EGFR involvement in the tumorigenesis and invasion of
pituitary tumors, especially aggressive prolactinomas, has been
reported by previous studies, and mutations in this gene can be
utilized as potential targets in the treatment of aggressive
prolactinomas. As reported in the literature, tyrosine kinase
inhibitors (TKIs), such as lapatanib, sunitinib and erlotinib, have
been trialed as first- or second-line treatments based on the VEGFR
pathway, but most of them have failed (4,29–32,34). In
addition, in the present study, we found that EGFR may be
negatively modulated by hsa-miR-520b using the miRTarBase database;
furthermore, hsa-miR-520b can be regulated by EGFR due to
its association with the biological process regulation of
production of miRNAs involved in gene silencing by miRNA (30–32). This
interesting finding may allow the use of this potential pathway for
the diagnosis or treatment of aggressive prolactinomas in the
future.
Subsequently, by constructing an miRNA-hub gene
network, we found that most hub genes were potentially modulated by
hsa-miR-489 and hsa-miR-520b, suggesting that these miRNAs may be
the most important regulators of prolactin pituitary tumor
aggressiveness. Recent studies demonstrated that hsa-miR-489 acts
as a tumor suppressor in hepatocellular carcinoma (42), gastric cancer (43), breast cancer (44), glioma (45), hypopharyngeal squamous cell carcinoma
(46), bladder cancer (47) and colorectal cancer (48). Downregulation of miR-489 was reported
to be associated with the tumorigenesis, invasion, and metastasis
of various tumors, suggesting an important role for hsa-miR-489 in
predicting prognosis and acting as a drug target. However, the
roles of hsa-miR-489 in pituitary tumors, especially aggressive
prolactinomas, have not been previously studied. Additionally,
hsa-miR-520b was reported to have a suppressive effect on tumor
cell proliferation, migration, invasion and
epithelial-to-mesenchymal transition (EMT) in colorectal cancer
(49), glioblastoma (50), hepatoma (51), head-neck cancer (52), breast cancer (53), lung cancer (54) and gastric cancer (55). Expression of hsa-miR-520b is lower in
tumor tissues than in normal tissues, significantly promoting the
proliferation, migration, and invasion of tumor cells. Unlike other
tumors, Liang et al (56)
reported that hsa-miR-520b was upregulated in nonfunctioning and
gonadotropin-secreting pituitary adenomas relative to normal
pituitaries, which indicated that miR-520b functions as a tumor
inducer in benign pituitary adenoma (56). However, whether hsa-miR-520b acts as a
promoter or suppressor in aggressive prolactin pituitary tumors has
not been previously studied. According to our study, we speculate
that upregulation of hsa-miR-489 suppresses aggressiveness and
progression, while downregulation of hsa-miR-520b promotes the
aggressiveness and progression of aggressive prolactinomas. Such
ambivalent miRNA expression might be one of the reasons that
aggressive prolactin pituitary tumors lie on the spectrum between
‘benign’ pituitary adenomas and ‘malignant’ pituitary carcinomas.
It will be extremely meaningful to authenticate the functions of
hsa-miR-489 and hsa-miR-520b and elucidate the mechanisms by which
they regulate aggressive behaviors, resistance to treatments and
early recurrence in aggressive prolactin pituitary tumors.
There are some limitations of the present study.
First, the sample size of GSE46294 is rather small (only 12
samples), which may cause some bias when identifying the
differentially expressed miRNAs. Second, the expression of the
differentially expressed miRNAs was not validated by RT-qPCR
analysis with our clinical pituitary samples. Further studies are
needed to experimentally verify the results of this study.
In conclusion, we successfully identified one key
target gene, EGFR, and two crucial miRNAs, hsa-miR-489 and
hsa-miR-520b, associated with aggressiveness based on bioinformatic
analysis. These findings may provide potential candidate biomarkers
for the early diagnosis and individualized treatment of aggressive
prolactin pituitary tumors. However, further research is needed to
experimentally verify the results of this study.
Supplementary Material
Supporting Data
Acknowledgements
Not applicable.
Funding
Not applicable.
Availability of data and materials
The GSE46294 datasets analyzed during the present
study are available in the GEO repository (http://www.ncbi.nlm.nih.gov/geo/). The potential
target genes of DEMs were predicted by miRTarBase (http://mirtarbase.mbc.nctu.edu.tw/). The DAVID
database (http://david.ncifcrf.gov/) was used
to perform functional annotation and pathway enrichment analysis
for genes. The STRING database (http://string-db.org) was used to assess functional
associations among genes.
Authors' contributions
All authors conceived and designed the study. LG, XG
and CF performed data curation and analysis. KD and WL analyzed and
interpreted the results. ZW and BX drafted and reviewed the
manuscript. All authors read and approved the final manuscript.
Ethics approval and consent to
participate
Not applicable.
Patient consent for publication
Not applicable.
Competing interests
The authors declare that they have no competing
interests.
Glossary
Abbreviations
Abbreviations:
|
miRNAs
|
microRNAs
|
|
DEMs
|
differentially expressed miRNAs
|
|
PPI
|
protein-protein interaction
|
|
TMZ
|
temozolomide
|
|
mRNA
|
messenger RNA
|
|
DE-miRNAs
|
differentially expressed miRNAs
|
|
GO
|
Gene Ontology
|
|
KEGG
|
Kyoto Encyclopedia of Genes and
Genomes
|
|
GEO
|
Gene Expression Omnibus
|
|
DAVID
|
Database for Annotation, Visualization
and Integrated Discovery
|
|
MCODE
|
Molecular Complex Detection
|
|
BiNGO
|
Biological Networks Gene Oncology
tool
|
|
BP
|
biological process
|
|
CC
|
cellular component
|
|
MF
|
molecular function
|
|
EGFR
|
epidermal growth factor receptor
|
|
EGF
|
epidermal growth factor
|
|
TKI
|
tyrosine kinase inhibitor
|
References
|
1
|
Kaltsas GA, Nomikos P, Kontogeorgos G,
Buchfelder M and Grossman AB: Clinical review: Diagnosis and
management of pituitary carcinomas. J Clin Endocrinol Metab.
90:3089–3099. 2005. View Article : Google Scholar : PubMed/NCBI
|
|
2
|
Fernandez A, Karavitaki N and Wass JA:
Prevalence of pituitary adenomas: A community-based,
cross-sectional study in Banbury (Oxfordshire, UK). Clin Endocrinol
(Oxf). 72:377–382. 2010. View Article : Google Scholar : PubMed/NCBI
|
|
3
|
Dai C, Feng M, Liu X, Ma S, Sun B, Bao X,
Yao Y, Deng K, Wang Y, Xing B, et al: Refractory pituitary adenoma:
A novel classification for pituitary tumors. Oncotarget.
7:83657–83668. 2016. View Article : Google Scholar : PubMed/NCBI
|
|
4
|
Raverot G, Burman P, McCormack A, Heaney
A, Petersenn S, Popovic V, Trouillas J and Dekkers OM; European
Society of Endocrinology, : European society of endocrinology
clinical practice guidelines for the management of aggressive
pituitary tumours and carcinomas. Eur J Endocrinol. 178:G1–G24.
2018. View Article : Google Scholar : PubMed/NCBI
|
|
5
|
Heaney A: Management of aggressive
pituitary adenomas and pituitary carcinomas. J Neurooncol.
117:459–468. 2014. View Article : Google Scholar : PubMed/NCBI
|
|
6
|
Lasolle H, Cortet C, Castinetti F, Cloix
L, Caron P, Delemer B, Desailloud R, Jublanc C, Lebrun-Frenay C,
Sadoul JL, et al: Temozolomide treatment can improve overall
survival in aggressive pituitary tumors and pituitary carcinomas.
Eur J Endocrinol. 176:769–777. 2017. View Article : Google Scholar : PubMed/NCBI
|
|
7
|
Losa M, Bogazzi F, Cannavo S, Ceccato F,
Curtò L, De Marinis L, Iacovazzo D, Lombardi G, Mantovani G, Mazza
E, et al: Temozolomide therapy in patients with aggressive
pituitary adenomas or carcinomas. J Neurooncol. 126:519–525. 2016.
View Article : Google Scholar : PubMed/NCBI
|
|
8
|
Shukla GC, Singh J and Barik S: MicroRNAs:
Processing, maturation, target recognition and regulatory
functions. Mol Cell Pharmacol. 3:83–92. 2011.PubMed/NCBI
|
|
9
|
Treiber T, Treiber N and Meister G:
Regulation of microRNA biogenesis and its crosstalk with other
cellular pathways. Nat Rev Mol Cell Biol. 20:5–20. 2019. View Article : Google Scholar : PubMed/NCBI
|
|
10
|
Croce CM and Calin GA: miRNAs, cancer, and
stem cell division. Cell. 122:6–7. 2005. View Article : Google Scholar : PubMed/NCBI
|
|
11
|
Berindan-Neagoe I, Monroig Pdel C,
Pasculli B and Calin GA: MicroRNAome genome: A treasure for cancer
diagnosis and therapy. CA Cancer J Clin. 64:311–336. 2014.
View Article : Google Scholar : PubMed/NCBI
|
|
12
|
Lu J, Getz G, Miska EA, Alvarez-Saavedra
E, Lamb J, Peck D, Sweet-Cordero A, Ebert BL, Mak RH, Ferrando AA,
et al: MicroRNA expression profiles classify human cancers. Nature.
435:834–838. 2005. View Article : Google Scholar : PubMed/NCBI
|
|
13
|
Feng Y, Mao ZG, Wang X, Du Q, Jian M, Zhu
D, Xiao Z, Wang HJ and Zhu YH: MicroRNAs and target genes in
pituitary adenomas. Horm Metab Res. 50:179–192. 2018. View Article : Google Scholar : PubMed/NCBI
|
|
14
|
Di Ieva A, Butz H, Niamah M, Rotondo F, De
Rosa S, Sav A, Yousef GM, Kovacs K and Cusimano MD: MicroRNAs as
biomarkers in pituitary tumors. Neurosurgery. 75:181–189;
discussion 188–189. 2014. View Article : Google Scholar : PubMed/NCBI
|
|
15
|
Zhang QJ and Xu C: The role of microRNAs
in the pathogenesis of pituitary tumors. Front Biosci (Landmark
Ed). 21:1–7. 2016. View
Article : Google Scholar : PubMed/NCBI
|
|
16
|
Wei Z, Zhou C, Liu M, Yao Y, Sun J, Xiao
J, Ma W, Zhu H and Wang R: MicroRNA involvement in a metastatic
non-functioning pituitary carcinoma. Pituitary. 18:710–721. 2015.
View Article : Google Scholar : PubMed/NCBI
|
|
17
|
Roche M, Wierinckx A, Croze S, Rey C,
Legras-Lachuer C, Morel AP, Fusco A, Raverot G, Trouillas J and
Lachuer J: Deregulation of miR-183 and KIAA0101 in aggressive and
malignant pituitary tumors. Front Med (Lausanne).
2:542015.PubMed/NCBI
|
|
18
|
Edgar R, Domrachev M and Lash AE: Gene
expression omnibus: NCBI gene expression and hybridization array
data repository. Nucleic Acids Res. 30:207–210. 2002. View Article : Google Scholar : PubMed/NCBI
|
|
19
|
Barrett T, Wilhite SE, Ledoux P,
Evangelista C, Kim IF, Tomashevsky M, Marshall KA, Phillippy KH,
Sherman PM, Holko M, et al: NCBI GEO: Archive for functional
genomics data sets-update. Nucleic Acids Res 41 (Database Issue).
D991–D995. 2013.
|
|
20
|
Chou CH, Shrestha S, Yang CD, Chang NW,
Lin YL, Liao KW, Huang WC, Sun TH, Tu SJ, Lee WH, et al: miRTarBase
update 2018: A resource for experimentally validated
microRNA-target interactions. Nucleic Acids Res 46D. D296–D302.
2018. View Article : Google Scholar
|
|
21
|
Huang da W, Sherman BT and Lempicki RA:
Systematic and integrative analysis of large gene lists using DAVID
bioinformatics resources. Nat Protoc. 4:44–57. 2009. View Article : Google Scholar : PubMed/NCBI
|
|
22
|
Kanehisa M, Furumichi M, Tanabe M, Sato Y
and Morishima K: KEGG: New perspectives on genomes, pathways,
diseases and drugs. Nucleic Acids Res 45D. D353–D361. 2017.
View Article : Google Scholar
|
|
23
|
Ashburner M, Ball CA, Blake JA, Botstein
D, Butler H, Cherry JM, Davis AP, Dolinski K, Dwight SS, Eppig JT,
et al: Gene ontology: Tool for the unification of biology. The gene
ontology consortium. Nat Genet. 25:25–29. 2000. View Article : Google Scholar : PubMed/NCBI
|
|
24
|
von Mering C, Huynen M, Jaeggi D, Schmidt
S, Bork P and Snel B: STRING: A database of predicted functional
associations between proteins. Nucleic Acids Res. 31:258–261. 2003.
View Article : Google Scholar : PubMed/NCBI
|
|
25
|
Shannon P, Markiel A, Ozier O, Baliga NS,
Wang JT, Ramage D, Amin N, Schwikowski B and Ideker T: Cytoscape: A
software environment for integrated models of biomolecular
interaction networks. Genome Res. 13:2498–2504. 2003. View Article : Google Scholar : PubMed/NCBI
|
|
26
|
Bandettini WP, Kellman P, Mancini C,
Booker OJ, Vasu S, Leung SW, Wilson JR, Shanbhag SM, Chen MY and
Arai AE: MultiContrast delayed enhancement (MCODE) improves
detection of subendocardial myocardial infarction by late
gadolinium enhancement cardiovascular magnetic resonance: A
clinical validation study. J Cardiovasc Magn Reson. 14:832012.
View Article : Google Scholar : PubMed/NCBI
|
|
27
|
Maere S, Heymans K and Kuiper M: BiNGO: A
cytoscape plugin to assess overrepresentation of gene ontology
categories in biological networks. Bioinformatics. 21:3448–3449.
2005. View Article : Google Scholar : PubMed/NCBI
|
|
28
|
Dworakowska D and Grossman AB: The
pathophysiology of pituitary adenomas. Best Pract Res Clin
Endocrinol Metab. 23:525–541. 2009. View Article : Google Scholar : PubMed/NCBI
|
|
29
|
Fukuoka H, Cooper O, Ben-Shlomo A, Mamelak
A, Ren SG, Bruyette D and Melmed S: EGFR as a therapeutic target
for human, canine, and mouse ACTH-secreting pituitary adenomas. J
Clin Invest. 121:4712–4721. 2011. View Article : Google Scholar : PubMed/NCBI
|
|
30
|
Fukuoka H, Cooper O, Mizutani J, Tong Y,
Ren SG, Bannykh S and Melmed S: HER2/ErbB2 receptor signaling in
rat and human prolactinoma cells: Strategy for targeted
prolactinoma therapy. Mol Endocrinol. 25:92–103. 2011. View Article : Google Scholar : PubMed/NCBI
|
|
31
|
Vlotides G, Siegel E, Donangelo I, Gutman
S, Ren SG and Melmed S: Rat prolactinoma cell growth regulation by
epidermal growth factor receptor ligands. Cancer Res. 68:6377–6386.
2008. View Article : Google Scholar : PubMed/NCBI
|
|
32
|
Cooper O, Mamelak A, Bannykh S, Carmichael
J, Bonert V, Lim S, Cook-Wiens G and Ben-Shlomo A: Prolactinoma
ErbB receptor expression and targeted therapy for aggressive
tumors. Endocrine. 46:318–327. 2014. View Article : Google Scholar : PubMed/NCBI
|
|
33
|
Donovan LE, Arnal AV, Wang SH and Odia Y:
Widely metastatic atypical pituitary adenoma with mTOR pathway
STK11(F298L) mutation treated with everolimus therapy. CNS Oncol.
5:203–209. 2016. View Article : Google Scholar : PubMed/NCBI
|
|
34
|
Ortiz LD, Syro LV, Scheithauer BW, Ersen
A, Uribe H, Fadul CE, Rotondo F, Horvath E and Kovacs K: Anti-VEGF
therapy in pituitary carcinoma. Pituitary. 15:445–449. 2012.
View Article : Google Scholar : PubMed/NCBI
|
|
35
|
D'Angelo D, Palmieri D, Mussnich P, Roche
M, Wierinckx A, Raverot G, Fedele M, Croce CM, Trouillas J and
Fusco A: Altered microRNA expression profile in human pituitary GH
adenomas: Down-regulation of miRNA targeting HMGA1, HMGA2, and
E2F1. J Clin Endocrinol Metab. 97:E1128–E1138. 2012. View Article : Google Scholar : PubMed/NCBI
|
|
36
|
Mussnich P, Raverot G, Jaffrain-Rea ML,
Fraggetta F, Wierinckx A, Trouillas J, Fusco A and D'Angelo D:
Downregulation of miR-410 targeting the cyclin B1 gene plays a role
in pituitary gonadotroph tumors. Cell Cycle. 14:2590–2597. 2015.
View Article : Google Scholar : PubMed/NCBI
|
|
37
|
Finotello F and Di Camillo B: Measuring
differential gene expression with RNA-seq: Challenges and
strategies for data analysis. Brief Funct Genomics. 14:130–142.
2015. View Article : Google Scholar : PubMed/NCBI
|
|
38
|
Farhan M, Wang H, Gaur U, Little PJ, Xu J
and Zheng W: FOXO signaling pathways as therapeutic targets in
cancer. Int J Biol Sci. 13:815–827. 2017. View Article : Google Scholar : PubMed/NCBI
|
|
39
|
Xu F, Zhang J, Hu G, Liu L and Liang W:
Hypoxia and TGF-β1 induced PLOD2 expression improve the migration
and invasion of cervical cancer cells by promoting
epithelial-to-mesenchymal transition (EMT) and focal adhesion
formation. Cancer Cell Int. 17:542017. View Article : Google Scholar : PubMed/NCBI
|
|
40
|
Matano F, Yoshida D, Ishii Y, Tahara S,
Teramoto A and Morita A: Endocan, a new invasion and angiogenesis
marker of pituitary adenomas. J Neurooncol. 117:485–491. 2014.
View Article : Google Scholar : PubMed/NCBI
|
|
41
|
Cooper O, Vlotides G, Fukuoka H, Greene MI
and Melmed S: Expression and function of ErbB receptors and ligands
in the pituitary. Endocr Relat Cancer. 18:R197–R211. 2011.
View Article : Google Scholar : PubMed/NCBI
|
|
42
|
Lin Y, Liu J, Huang Y, Liu D, Zhang G and
Kan H: microRNA-489 plays an anti-metastatic role in human
hepatocellular carcinoma by targeting matrix metalloproteinase-7.
Transl Oncol. 10:211–220. 2017. View Article : Google Scholar : PubMed/NCBI
|
|
43
|
Zhang B, Ji S, Ma F, Ma Q, Lu X and Chen
X: miR-489 acts as a tumor suppressor in human gastric cancer by
targeting PROX1. Am J Cancer Res. 6:2021–2030. 2016.PubMed/NCBI
|
|
44
|
Chai P, Tian J, Zhao D, Zhang H, Cui J,
Ding K and Liu B: GSE1 negative regulation by miR-489-5p promotes
breast cancer cell proliferation and invasion. Biochem Biophys Res
Commun. 471:123–128. 2016. View Article : Google Scholar : PubMed/NCBI
|
|
45
|
Xu D, Liu R, Meng L, Zhang Y, Lu G and Ma
P: Long non-coding RNA ENST01108 promotes carcinogenesis of glioma
by acting as a molecular sponge to modulate miR-489. Biomed
Pharmacother. 100:20–28. 2018. View Article : Google Scholar : PubMed/NCBI
|
|
46
|
Kikkawa N, Hanazawa T, Fujimura L, Nohata
N, Suzuki H, Chazono H, Sakurai D, Horiguchi S, Okamoto Y and Seki
N: miR-489 is a tumour-suppressive miRNA target PTPN11 in
hypopharyngeal squamous cell carcinoma (HSCC). Br J Cancer.
103:877–884. 2010. View Article : Google Scholar : PubMed/NCBI
|
|
47
|
Li J, Qu W, Jiang Y, Sun Y, Cheng Y, Zou T
and Du S: miR-489 suppresses proliferation and invasion of human
bladder cancer cells. Oncol Res. 24:391–398. 2016. View Article : Google Scholar : PubMed/NCBI
|
|
48
|
Gao S, Liu H, Hou S, Wu L, Yang Z, Shen J,
Zhou L, Zheng SS and Jiang B: miR-489 suppresses tumor growth and
invasion by targeting HDAC7 in colorectal cancer. Clin Transl
Oncol. 20:703–712. 2018. View Article : Google Scholar : PubMed/NCBI
|
|
49
|
Xiao J, Li G, Zhou J, Wang S, Liu D, Shu
G, Zhou J and Ren F: MicroRNA-520b functions as a tumor suppressor
in colorectal cancer by inhibiting defective in cullin neddylation
1 domain containing 1 (DCUN1D1). Oncol Res. 26:593–604. 2018.
View Article : Google Scholar : PubMed/NCBI
|
|
50
|
Liu X, Wang F, Tian L, Wang T, Zhang W, Li
B and Bai YA: MicroRNA-520b affects the proliferation of human
glioblastoma cells by directly targeting cyclin D1. Tumour Biol.
37:7921–7928. 2016. View Article : Google Scholar : PubMed/NCBI
|
|
51
|
Zhang W, Kong G, Zhang J, Wang T, Ye L and
Zhang X: MicroRNA-520b inhibits growth of hepatoma cells by
targeting MEKK2 and cyclin D1. PLoS One. 7:e314502012. View Article : Google Scholar : PubMed/NCBI
|
|
52
|
Lu YC, Cheng AJ, Lee LY, You GR, Li YL,
Chen HY and Chang JT: miR-520b as a novel molecular target for
suppressing stemness phenotype of head-neck cancer by inhibiting
CD44. Sci Rep. 7:20422017. View Article : Google Scholar : PubMed/NCBI
|
|
53
|
Hu N, Zhang J, Cui W, Kong G, Zhang S, Yue
L, Bai X, Zhang Z, Zhang W, Zhang X and Ye L: miR-520b regulates
migration of breast cancer cells by targeting hepatitis B
X-interacting protein and interleukin-8. J Biol Chem.
286:13714–13722. 2011. View Article : Google Scholar : PubMed/NCBI
|
|
54
|
Jin K, Zhao W, Xie X, Pan Y, Wang K and
Zhang H: miR-520b restrains cell growth by targeting HDAC4 in lung
cancer. Thorac Cancer. 9:1249–1254. 2018. View Article : Google Scholar : PubMed/NCBI
|
|
55
|
Li S, Zhang H, Ning T, Wang X, Liu R, Yang
H, Han Y, Deng T, Zhou L, Zhang L, et al: miR-520b/e regulates
proliferation and migration by simultaneously targeting EGFR in
gastric cancer. Cell Physiol Biochem. 40:1303–1315. 2016.
View Article : Google Scholar : PubMed/NCBI
|
|
56
|
Liang S, Chen L, Huang H and Zhi D: The
experimental study of miRNA in pituitary adenomas. Turk Neurosurg.
23:721–727. 2013.PubMed/NCBI
|