Introduction
Breast cancer is the most common form of cancer and
the leading cause of cancer-related deaths among females worldwide
(1). The development of breast cancer
therapies is expensive and slow. Additionally, substantial
heterogeneity exists within and between well-established breast
cancer subtypes and drug responses (2). Three distinct features can be used to
group breast tumors based on the following: Morphological criteria
(e.g., ductal, lobular, invasive and in situ); expression of
the estrogen receptor (ER), progesterone receptor (PR), and Her2
receptor tyrosine kinase (Her2); or molecular phenotypes, based on
comprehensive mRNA similarities (e.g., luminal and basal).
Approximately one-fourth of breast tumors are ‘triple-negative’
[ER−/PR−/Her2−; triple-negative
breast cancer (TNBC)] and usually have a basal molecular phenotype.
Due to chemotherapy resistance and the lack of TNBC-targeted
therapeutics, patient prognosis is grim. Conversely, 20% of breast
cancer patients suffer from Her2+ breast cancer. This
patient population requires expensive targeted therapy. Therefore,
effective breast cancer treatments are desired by doctors and
patients.
Ferroptosis is a recently recognized form of
regulated cell death. It is morphologically characterized by the
presence of mitochondria that are smaller than normal in size.
Ferroptosis can be induced by experimental compounds (e.g.,
erastin) or clinical drugs (e.g., sorafenib and artemisinin) in
cancer cells and certain normal cells (e.g., kidney tubule cells,
fibroblasts and T cells) (3–5). Ferroptosis is characterized by the
accumulation of lipid peroxidation products and toxic reactive
oxygen species (ROS) derived from iron metabolism and can be
pharmacologically inhibited by iron chelators (e.g., deferoxamine)
and lipid peroxidation inhibitors (e.g., ferrostatin-1 and
liproxstatin-1) (5,6). Iron metabolism and lipid peroxidation
signaling are increasingly being recognized as central mediators of
ferroptosis (7). The inhibition of
cystine/glutamate antiporters (system xc−)
and increasing accumulation of iron are involved in the induction
of ferroptosis (5). xCT is a
functional subunit of system xc− that
regulates the exchange of glutamate and cystine in cells. xCT is a
light chain encoded by the SLC7A11 gene that comprises system
xc−, and thus, xCT expression can be used as
a surrogate of system xc− expression
(8).
Sulfasalazine (SAS) is broadly used to treat chronic
inflammation in the gut, joints, and retina. In addition to
inhibiting the NF-κB signaling pathway, SAS inhibits the system
xc− transporter (9). Given that the disruption of system
xc−-mediated cystine uptake by erastin is
sufficient to induce ferroptosis, treatment of cancer cells (e.g.,
HT1080) with SAS can also trigger ferroptosis (10). However, the effect of SAS on iron
metabolic pathways in ferroptosis is not clear. Previous studies
have revealed that SAS can induce ferroptosis in pancreatic cancer
cells, and thus, ferroptosis may be a new option for treating
pancreatic cancer (11).
Nevertheless, whether SAS can induce ferroptosis in different
breast cancer cells has not been clearly reported.
Investigations on this topic may confirm whether SAS
can induce ferroptosis in different breast cancer cells and lead to
an improved molecular understanding of how SAS induces ferroptosis,
especially the relationship of SAS with iron metabolism. ER
expression is an important basis of breast cancer molecular
phenotyping. Transferrin receptor (TFRC) is a key factor in iron
metabolism (12). When exploring the
relationship between ER and TFRC, it was revealed that ER can
inhibit TFRC expression. Since ER is differentially expressed in
various breast cancer subtypes, it is possible that this inhibition
can lead to differences in the sensitivity of breast cancer cells
to SAS-induced ferroptosis. Therefore, a novel relationship between
ER and TFRC in the regulation of ferroptosis with important
information regarding SAS-mediated anticancer therapy is presented.
The purpose of the present study was to determine whether SAS can
induce ferroptosis in breast cancer cells. It was hypothesized that
breast cancer cells have different sensitivities to SAS since the
different expression levels of ER in breast cancer cells have
different inhibitory effects on TFRC.
Materials and methods
Cell culture
MDA-MB-231, T47D, BT549 and MCF7 human breast cancer
cells were purchased from the American Type Culture Collection
(ATCC) and grown in medium supplemented with 10% heat-inactivated
fetal bovine serum (HI-FBS), 100 µg/ml streptomycin, and 100
units/ml penicillin (Invitrogen; Thermo Fisher Scientific, Inc.) in
a humidified incubator with 5% CO2 at 37°C.
Detection of ROS
The intracellular ROS level in the form of cellular
peroxides was assessed using a Reactive Oxygen Species Assay Kit
(Beyotime Institute of Biotechnology) after treatment with or
without SAS (Abcam) and liproxstatin-1 (MedChemExpress). In the
liproxstatin-1-treatment group, the cells were treated with 300 nM
liproxstatin-1 for 24 h before the addition of SAS. The cells were
collected, exposed to 10 µM 2′,7′-dichlorofluorescein diacetate
(DCFH-DA), and incubated at 37°C for 20 min. The cells were washed
three times with PBS, and fluorescence intensity was analyzed by
flow cytometry (excitation at 488 nm; emission at 525 nm). ROS
levels were expressed as the mean fluorescence intensity of 20,000
cells. Three independent experiments were performed.
RNA isolation and real-time PCR
(RT-PCR)
Total RNA from MDA-MB-231 and T47D cells was
extracted with a total RNA extraction kit and reverse-transcribed
using the PrimeScript RT reagent kit (Promega Corporation).
Quantitative RT-PCR was performed using SYBR Premix Ex Taq™ II
(Takara Bio, Inc.) in a 10-µl PCR mixture on a Bio-Rad CFX96
Real-Time PCR system (Bio-Rad Laboratories, Inc.) according to the
manufacturer's standard protocols. An initial cycling for 2 min at
95°C, followed by 39 cycles at 95°C for 30 sec, 30 sec at 58°C and
20 sec at 72°C. The primer sequences were as follows: Divalent
metaltransporter 1 (DMT1) forward, 5′-AGCTCCACCATGACAGGAACCT-3′ and
reverse, 5′-TGGCAATAGAGCGAGTCAGAACC-3′; TFRC forward,
5′-ATCGGTTGGTGCCACTGAATGG-3′ and reverse,
5′-ACAACAGTGGGCTGGCAGAAAC-3′; glyceraldehyde 3-phosphate
dehydrogenase (GAPDH) forward, 5′-TGACTTCAACAGCGACACCCA-3′ and
reverse, 5′-CACCCTGTTGCTGTAGCCAAA-3′; and estrogen receptor 1
(ESR1) forward, 5′-GGTCAGTGCCTTGTTGGATG-3′ and reverse,
5′-CAGGTTGGTGAGTAAGC-3′. Three independent experiments were
performed for each group. Relative gene expression was normalized
to GAPDH and calculated using the 2−ΔΔCq method
(13).
Cell viability assay
Cell growth and SAS-mediated inhibition were
detected using the Cell Counting Kit-8 (CCK-8; Beyotime Institute
of Biotechnology). According to the manufacturer's instructions,
cells were plated at a density of 2.5×10⁴/well in
96-well plates with or without different concentrations of SAS, and
cell viability was assessed at 24 h. The absorbance of each well
was measured at a wavelength of 450 nm using a Synergy H1
microplate reader (BioTek Instruments, Inc.). Empty wells served as
blank controls. The test was performed three times under the same
operating conditions. The cells were treated with SAS at
concentrations of 0.1, 0.5, 1.0, 1.5, 2.0, and 3.0 mM, and cell
viability was determined using the CCK-8 assay at 24 h. The half
maximal inhibitory concentration (IC50) of SAS for
different cells was calculated according to the standard curve.
Western blot analysis
Cell were washed twice with cold PBS and harvested.
Protein lysates were prepared from MDA-MB-231 and T47D cells using
a protein extraction kit (Nanjing KeyGen Biotech. Co. Ltd.).
Protein concentrations were assessed using a BCA Protein Assay kit
(Beyotime Institute of Biotechnology). Equal amounts of proteins
(40 µg/lane) from each group were separated by sodium dodecyl
sulfate polyacrylamide gel electrophoresis on 12.5% gels (Bio-Rad
Laboratories, Inc.) and transferred to polyvinylidene difluoride
membranes (EMD Millipore). After blocking with 5% skim milk for 1 h
at room temperature, the membranes were incubated with specific
primary antibodies at 4°C overnight. Then, after washing three
times with Tris-buffered saline containing Tween-20, the membranes
were incubated with horseradish peroxidase-conjugated secondary
antibodies for 1 h at room temperature. Proteins were visualized by
chemiluminescence using enhanced chemiluminescent substrate
(Beyotime Institute of Biotechnology). Immunoreactive bands were
examined using the ChemiDoc Imaging System (Bio-Rad Laboratories,
Inc.). The following antibodies were used: Rabbit anti-xCT antibody
(cat. no. 12691S; dilution 1:800; Cell Signaling Technology, Inc.);
rabbit anti-glutathione peroxidase 4 (GPX4) antibody (cat. no.
SAB2108670; dilution 1:1,000; Sigma-Aldrich; Merck KGaA); rabbit
anti-ESR1 (cat. no. 13258; dilution 1:1,000) and rabbit anti-TFRC
(cat. no. 13113; dilution 1:1,000; both from Cell Signaling
Technology, Inc.); and rabbit anti-GAPDH (cat. no. ATGA0181;
dilution 1:1,000; 4A Biotech Co., Ltd.). Horseradish
peroxidase-conjugated goat anti-rabbit antibodies were used as
secondary antibodies (cat. no. 7074S; dilution 1:1,000; Cell
Signaling Technology, Inc.). GAPDH was used as an internal control
for each membrane.
Electron microscopy
After the indicated treatment, cells on a 100-mm
dish were fixed in 2.5% glutaraldehyde in 0.1 M PBS (pH 7.4) at
room temperature for 1 h, post-fixed in 1% OsO4 in 0.1 M
PBS (pH 7.4) at room temperature for 1 h, dehydrated using a graded
series of ethanol and embedded with epoxy resin and sectioned.
Ultrathin (60-nm) sections were collected on grids and stained with
uranyl acetate and lead citrate. Images were obtained using an
H-7100 transmission electron microscope (Hitachi, Ltd.).
siRNA transfection assay
Cells were plated in six-well plates and transfected
with specific siRNAs using Lipofectamine™ 2000
transfection reagent (Invitrogen; Thermo Fisher Scientific, Inc.)
according to the manufacturer's instructions. Two siRNA sequences
were used to ensure the accuracy of the experiment. The sequences
of siRNA were as follows: ESR1-siRNA1 (sense
5′-GGAGGAUGUUGAAACACAATT-3′, antisense 5′-UUGUGUUUCAACAUUCUCCTT-3′)
and ESR1-siRNA2 (sense 5′-GGAUUUGACCCUCCAUGAUTT-3′, antisense
5′-AUCAUGGAGGGUCAAAUCCTT-3′). All siRNA oligomers were purchased
from Shanghai GenePharma Co., Ltd.
Immunohistochemistry (IHC)
The human tissues were fixed with 4% formaldehyde
buffer, the fixed time of the specimens was 12–24 h at room
temperature 15–28°C. Deparaffinized specimens were then sectioned
at 4-µm-thick slices. The slices were autoclaved at 115°C for 5 min
for antigen retrieval in citric acid buffer (pH 6.0) and quenched
for endogenous peroxidase activity with 0.3%
H2O2 solution for 10–15 min. Then, the
samples were blocked for nonspecific binding with normal goat serum
for 10–15 min and incubated with the specific rabbit primary
antibody against TFRC (cat. no. PB9233; dilution 1:700; Boster
Biological Technology Co., Ltd.) overnight at 4°C. Subsequently,
the sections were treated with the goat anti-rabbit antibody for 30
min at room temperature. After staining with diaminobenzidine (DAB)
(cat. no. PV-9000; Beijing Zhongshan Golden Bridge Biotechnology
Co., Ltd.; OriGene Technologies), images were captured using a
Nikon Eclipse 80i microscope (Nikon Corporation).
Mitochondrial membrane potential
assay
The mitochondrial membrane potential (MMP) was
assayed using tetramethylrhodamine methyl ester (TMRM) according to
the manufacturer's instructions (AAT Bioquest, Inc.). TMRM is
readily sequestered by healthy mitochondria, but its fluorescence
is rapidly lost when the MMP dissipates. Cells were seeded in
confocal dishes before treatment with or without SAS. The cells
were washed twice with PBS and incubated for 20 min at 37°C with
100 nM TMRM for staining mitochondria and then carefully washed
three times with PBS. To ensure the accuracy of MMP detection, cell
activity should be maintained when staining for TMRM; the cells
should not be killed by reagents such as formaldehyde. Finally, the
cells were analyzed by confocal fluorescence microscopy (Nikon
N-SIM; Nikon Corporation) to assess the intensity of red
fluorescence (excitation at 549 nm; emission at 573 nm).
Collection of clinical tissue samples
and RNA extraction
In the present study, clinical tissue samples were
collected from 87 patients with breast cancer, and RNA was
extracted. The human breast cancer specimens used in this study
were collected in the operating room of the Department of Endocrine
and Breast Surgery, First Affiliated Hospital of Chongqing Medical
University, from July 2015 to June 2017. All clinical specimens
were diagnosed by clinical and pathological examinations, and all
patient information data were true and valid. The First Affiliated
Hospital of Chongqing Medical University Ethics Committee reviewed
and approved the use of human tissue specimens and all patients
provided written informed consent. Additional information for these
patients is provided in Table I. RNA
from the tissue samples from 87 patients was extracted with a total
RNA extraction kit and reverse-transcribed using the PrimeScript RT
reagent kit (Promega Corp.).
 | Table I.Characteristics of all patients
(n=87). |
Table I.
Characteristics of all patients
(n=87).
| Parameters | Number (%) |
|---|
| Age (years) |
|
|
<50 | 30 (34.5) |
|
≥50 | 57 (65.5) |
| Subtypes of
cancer |
|
|
TNBC | 20 (23.0) |
|
Her2 | 21 (24.1) |
| Luminal
A | 22 (25.3) |
| Luminal
B | 24 (27.6) |
| Tumor size |
|
| <2
cm | 23 (26.4) |
| 2–4
cm | 58 (66.7) |
| >4
cm | 6 (6.9) |
| Histological
grade |
|
| I | 2 (2.4) |
| II | 57 (55.0) |
|
III | 17 (15.0) |
|
Unknown | 11(27.6) |
| ER
statusa |
|
|
Positive | 46 (52.9) |
|
Negative | 41 (47.1) |
| PR
statusa |
|
|
Positive | 43 (49.4) |
|
Negative | 44 (50.6) |
| Her2 status |
|
|
Positive | 32 (36.8) |
|
Negative | 55 (63.2) |
| Ki-67(%) |
|
|
<14 | 28 (32.2) |
|
≥14 | 59 (67.8) |
Bioinformatics analysis
Data was downloaded from The Cancer Genome Atlas
(TCGA) database (https://cancergenome.nih.gov) for 1,208 breast cancer
samples. TFRC expression was analyzed in different subtypes of
breast cancer cells and the correlation between TFRC and ESR1 with
ggstatspot (a package in R, version 3.5.1). TFRC expression in
cancer tissues and normal tissues was determined using Gene
Expression Profiling Interactive Analysis (GEPIA; http://gepia.cancer-pku.cn/index.html).
Statistical analysis
All experiments were independently performed at
least three times. The mean ± SD was determined for each group.
Statistical analyses were performed using one-way analysis of
variance (ANOVA) for multiple group comparisons or Student's t-test
for individual comparisons. Multiple comparisons between the groups
were performed using the Student-Newman-Keuls method. Statistical
significance was considered at P<0.05.
Results
SAS reduces breast cancer cell
growth
The effects of SAS on breast cancer were
investigated. Different human breast cancer cell lines (MDA-MB-231
and T47D, representing TNBC and ER+ breast cancer,
respectively) were used. Previous studies have reported that higher
levels of SAS can reduce glioma cell growth (14). Both breast cancer cell lines were
treated with two different concentrations of SAS for 24 h.
Microscopic observation revealed that cell growth and viability
were significantly inhibited. The two cell lines displayed a
significant reduction in cell viability in response to 1.0 and 2.0
mM SAS (Fig. S1). To better
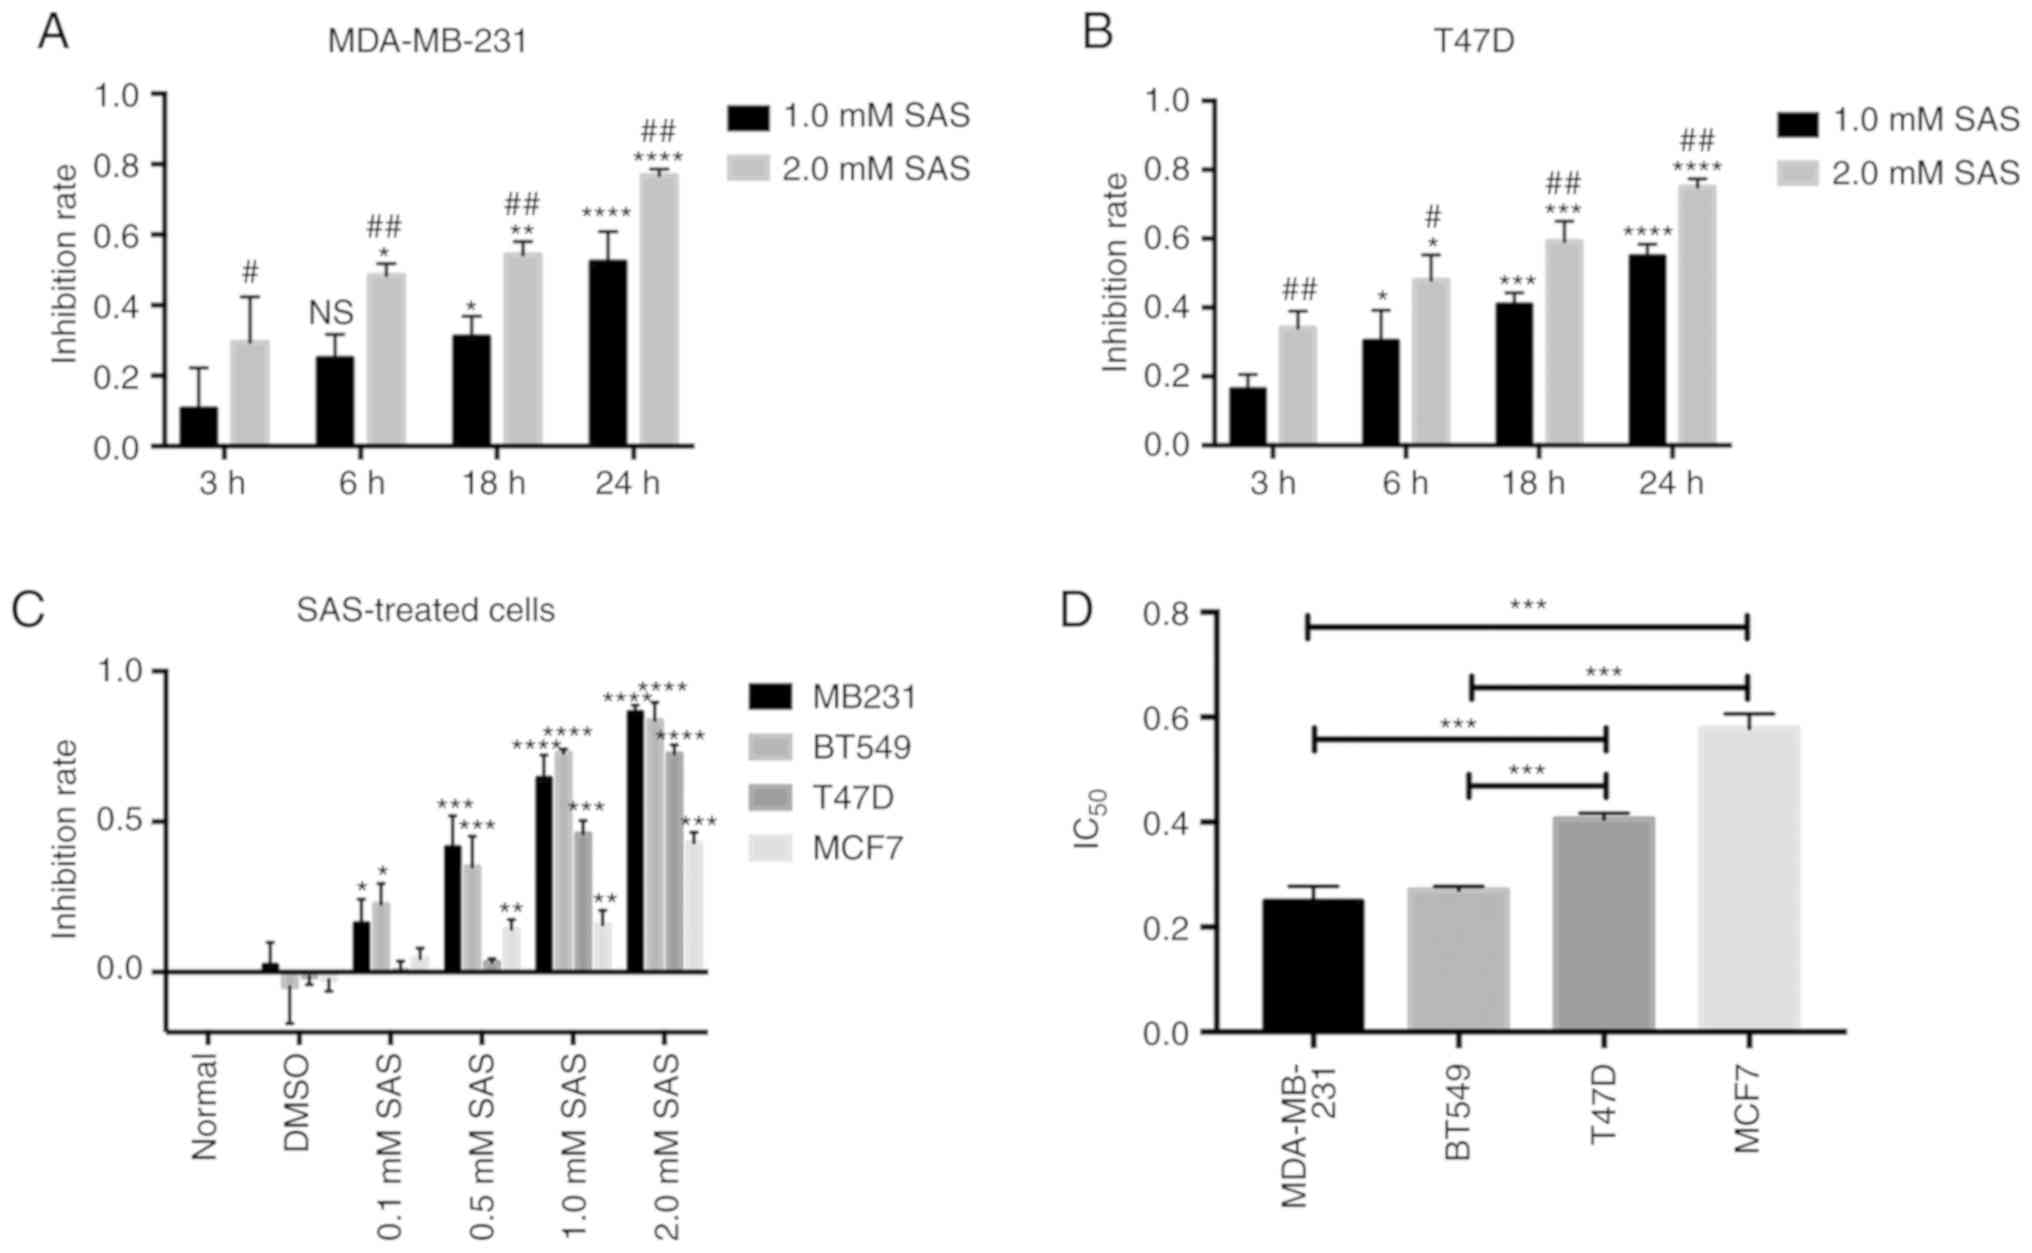
understand the effect of SAS in breast cancer cells, the inhibition
rate for MDA-MB-231 cells was determined by treating the cells with
1.0 or 2.0 mM SAS at 3, 6, 12 and 24 h. In fact, 2.0 mM SAS induced
death in >70% of the breast cancer cells in a time-dependent
manner, peaking at 24 h. With an increase in SAS treatment time,
the cell growth inhibition rate also increased, and the inhibition
rate in the 2.0 mM group was higher than that in the 1.0 mM group
(Fig. 1A). Similar results were
obtained in T47D cells (Fig. 1B). To
confirm the effects of SAS in breast cancer, two other breast
cancer lines (BT549 and MCF7, representing TNBC and ER+
breast cancer, respectively) were included. The four breast cancer
cell lines were treated with different concentrations of SAS for 24
h. The inhibition rates were dependent on the SAS concentration
(Fig. 1C). From the trend indicated
in the figure, ER+ breast cancer cells (T47D and MCF7)
were less sensitive to SAS than TNBC cells (MDA-MB-231 and BT549)
at the same concentrations. To confirm our hypothesis, the half
maximal inhibitory concentration (IC50) of the four cell
lines for SAS, was examined. The results revealed that the
IC50 values of MDA-MB-231 and BT549 cells were
significantly lower than those of T47D and MCF7 cells (Fig. 1D). Therefore, SAS reduced the growth
of breast cancer cells; however, the sensitivity varied for
different breast cancer cells.
Ferroptosis is induced by SAS in
breast cancer cells
It was demonstrated that SAS could reduce cell
growth, however, whether this effect was due to ferroptosis
required more evidence. A large and growing body of literature has
demonstrated that xCT and GPX4 play important roles in ferroptosis
(15). Previous studies have
indicated that inhibition of xCT triggers ferroptosis and that GPX4
plays a role in preventing ferroptosis (5). Traditionally, western blotting has been
used to assess the expression of xCT and GPX4. A clear decreasing
trend in xCT and GPX4 expression with an increasing concentration
of SAS were observed. Similar results were obtained in MDA-MB-231
and T47D cells (Fig. 2A). The
accumulation of ROS in cells is a direct cause of ferroptosis
(16). Flow cytometry is currently
the most popular method for detecting ROS. MDA-MB-231 cells treated
with 1.0 or 2.0 mM SAS displayed increased ROS production than
untreated and negative control cells (Fig. 2B). Similar results were obtained in
T47D cells (Fig. 2C). Detailed flow
cytometric data is revealed in Fig.
S1.
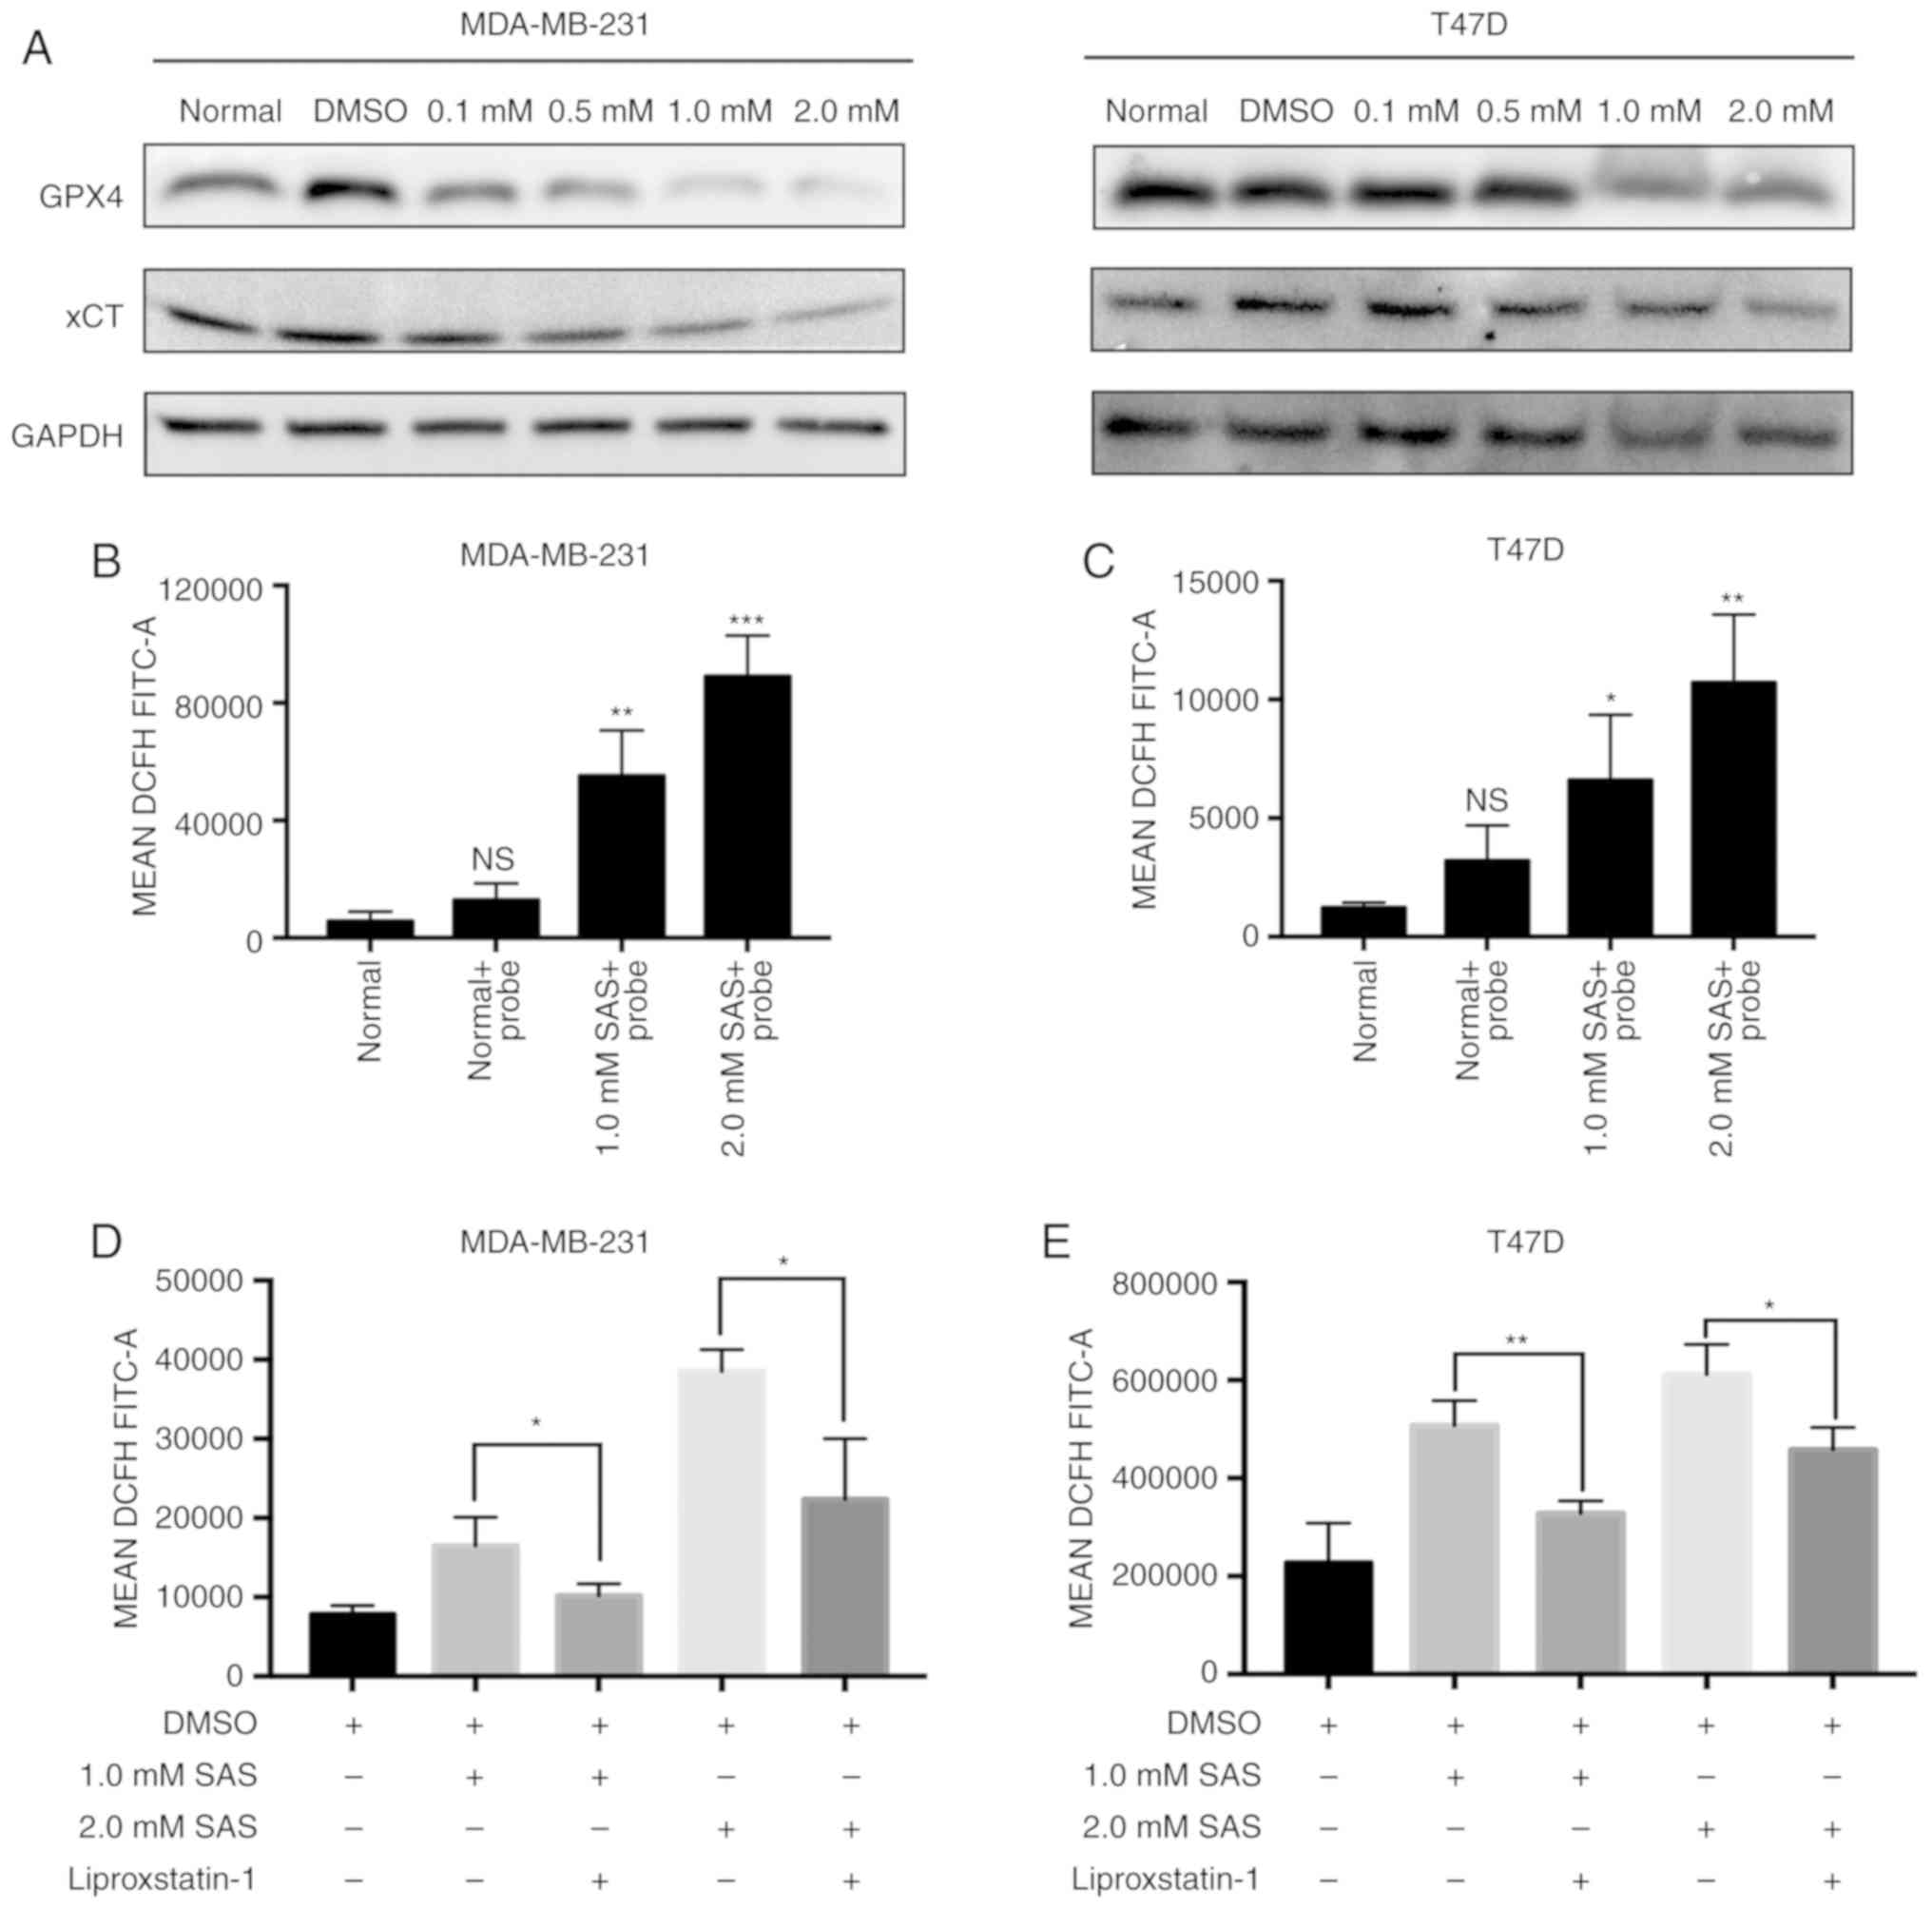 | Figure 2.Ferroptosis is induced by SAS in
breast cancer cells. (A) Expression of GPX4, xCT and GAPDH in
MDA-MB-231 and T47D cells treated with 0.1, 0.5, 1.0 and 2.0 mM SAS
for 24 h was detected by western blotting. (B) ROS accumulation in
MDA-MB-231 cells without the DCFH-DA probe and treated with 1.0 and
2.0 mM SAS and exposed to the DCFH-DA probe was determined using
flow cytometry. Bar graphs represent the mean ± SD. **P<0.01 and
***P<0.005 compared with the normal group. ns, indicates no
significant difference. (C) ROS accumulation in T47D cells without
the DCFH-DA probe and treated with 1.0 and 2.0 mM SAS and exposed
to the DCFH-DA probe was determined using flow cytometry. Bar
graphs represent the mean ± SD. *P<0.05 and **P<0.01 compared
to normal group. ns, indicates no significant difference. (D)
MDA-MB-231 cells were treated with 1.0 or 2.0 mM SAS with or
without liproxstatin-1. Flow cytometry was used to detect ROS
accumulation in at least three independent experiments. Bar graphs
represent the mean ± SD. *P<0.05. (E) T47D cells were treated
with 1.0 or 2.0 mM with or without liproxstatin-1. Flow cytometry
was used to detect ROS accumulation in at least three independent
experiments. Bar graphs represent the mean ± SD. *P<0.05 and
**P<0.01. SAS, sulfasalazine; GPX4, glutathione peroxidase 4;
ROS, reactive oxygen species; DCFH-DA, 2′,7′-dichlorofluorescein
diacetate. |
Many studies have revealed that iron is closely
related to oxidative stress. If iron ions cannot bind to proteins
or other ligands in an appropriate manner, they can catalyze the
formation of metabolically toxic ROS through the H:O: Dependent
Fenton reaction. Iron chelators (DFO) and ferroptosis-specific
inhibitors (liproxstatin-1) have no significant effects on other
forms of cell death (7). Therefore,
these reagents can be used to confirm that the death mode caused by
SAS is ferroptosis. Liproxstatin-1 prevents ROS accumulation and
cell death in cells. Moreover, liproxstatin-1 inhibits ferroptosis
induced by ferroptosis-inducing agents (FINs; a series of small
molecule inducers, e.g., erastin) in vitro (17). Liproxstatin-1 has also been used to
determine whether SAS-induced cell death is ferroptosis (18). The results, as revealed in Fig. 2D, indicated that SAS-induced ROS
generation can be inhibited by liproxstatin-1 in MDA-MB-231 cells;
similar results were obtained in T47D cells (Fig. 2E).
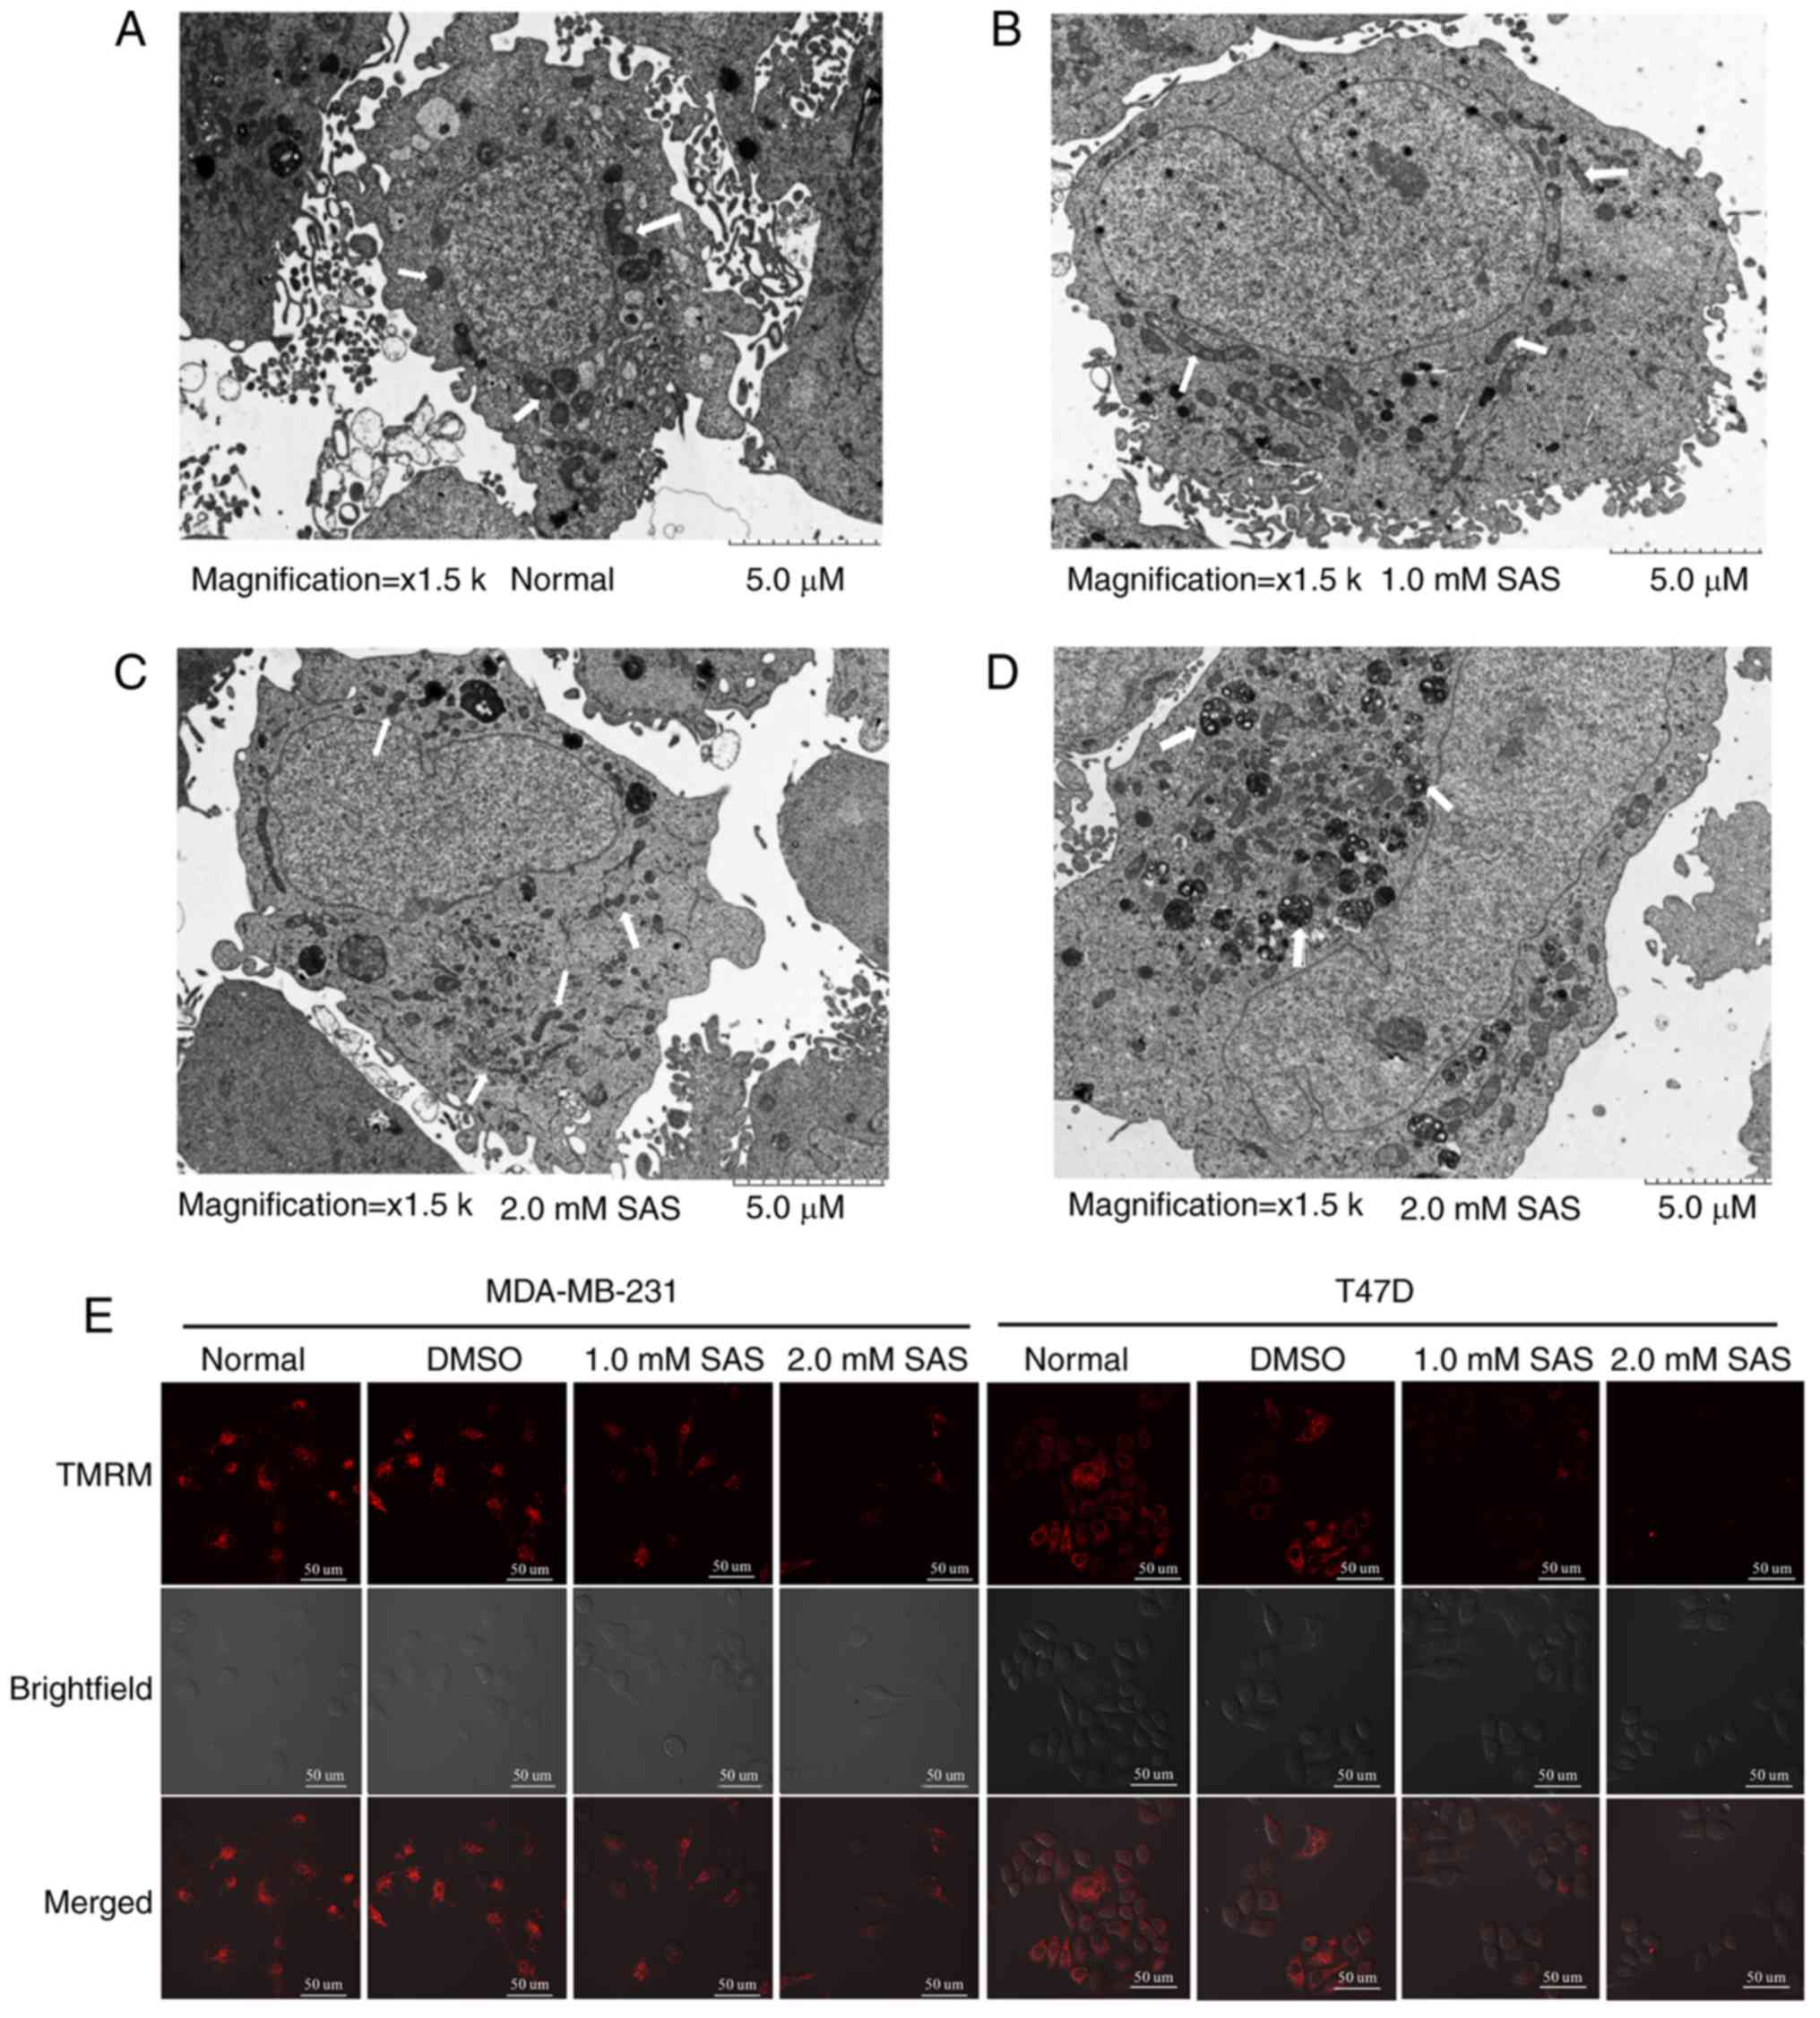
Change in mitochondrial morphology is also a
characteristic of ferroptosis (19).
Transmission electron microscopy revealed that compared with
untreated cells (Fig. 3A), T47D cells
treated with 1.0 mM SAS for 24 h had shrunken mitochondria with
increased membrane density (Fig. 3B).
The white arrow in the figure indicates the mitochondria of T47D
cells. This phenomenon was more pronounced in cells treated with
2.0 mM SAS for 24 h (Fig. 3C).
Notably, numerous autophagosomes were found in cells treated with
2.0 mM SAS (Fig. 3D), indicating that
SAS may induce autophagy. Literature studies have indicated that
ferroptosis may be related to autophagy (20). However, further research is required
to demonstrate this hypothesis. The same positive result was not
obtained in MDA-MB-231 cells. Next, MMP was examined using the
probe TMRM, which accumulates in the mitochondria and produces
bright red fluorescence in living cells. Confocal microscopy
analysis of red fluorescence intensity revealed that compared with
untreated cells, SAS-treated MDA-MB-231 cells displayed a reduction
in red fluorescence; similar results were obtained for T47D cells
(Fig. 3E). These data indicated that
SAS induced mitochondrial depolarization, consistent with the
morphological characteristics of ferroptosis observed by
transmission electron microscopy. In summary, the mode of death
caused by SAS was in fact ferroptosis.
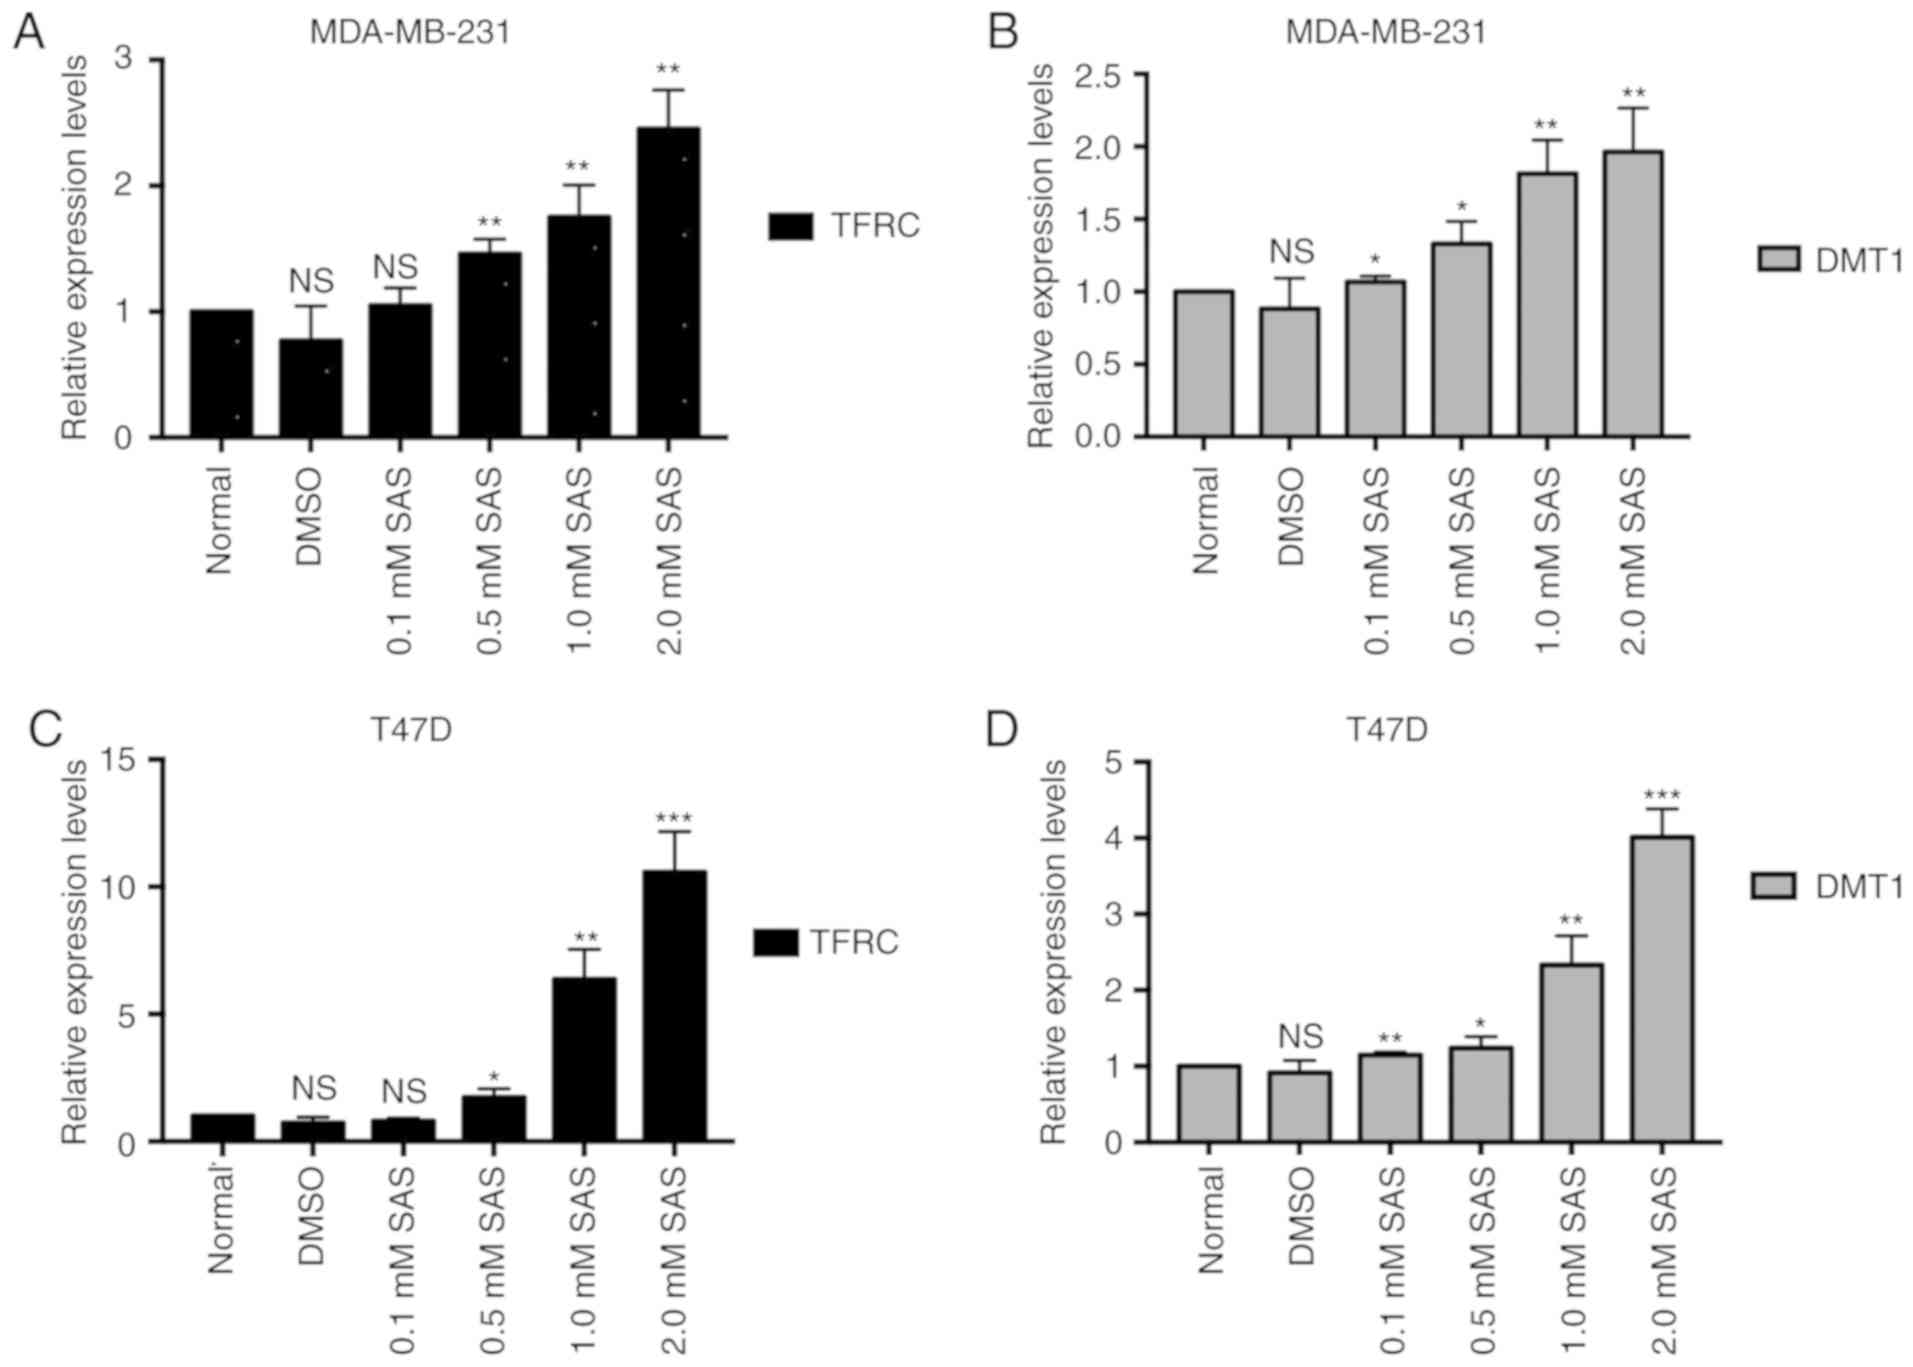
TFRC and DMT1 are activated after the
SAS treatment of breast cancer cells
Iron metabolism and lipid peroxidation signaling are
increasingly being recognized as central mediators of ferroptosis
(21). Fe3+ is imported
into cells through the membrane protein TFRC and then sequestered
in endosomes. In the endosome, Fe3+ is reduced to
ferrous iron (Fe2+). DMT1, also known as natural
resistance-associated macrophage protein 2, belongs to the soluble
carrier family member (solute carrier family 11 member 2, SLC11A2)
and is a proton-dependent metal ion transporter. DMT1 can mediate
transmembrane transport, including Cu2+,
Fe2+, Zn2+, and Mn2+ ions and is
considered to be a transporter of various divalent metal ions in
mammalian cells. When the concentration of metal ions in the body
changes, DMT1 expression may change accordingly, and it plays an
important physiological role in the metabolism and balance of
divalent metal ions in cells. The literature indicates that DMT1
mediates the release of Fe2+ from the endosome into a
labile iron pool in the cytoplasm (22). Therefore, the accumulation of iron in
cells is closely related to TFRC and DMT1. However, the role of SAS
in iron metabolic pathways is unknown. To explore the function of
SAS in iron metabolic pathways, RT-PCR was used to detect the
expression of TFRC and DMT1 in cells treated with different
concentrations of SAS. As revealed in Fig. 4A and B, as the SAS concentration
increased, the expression of TFRC and DMT1 increased in MDA-MB-231
cells. Consistent with the results in MDA-MB-231 cells, TFRC and
DMT1 expression also increased in T47D cells in response to
increasing SAS concentrations (Fig. 4C
and D), indicating that SAS may activate TFRC and DMT1 to
induce ferroptosis.
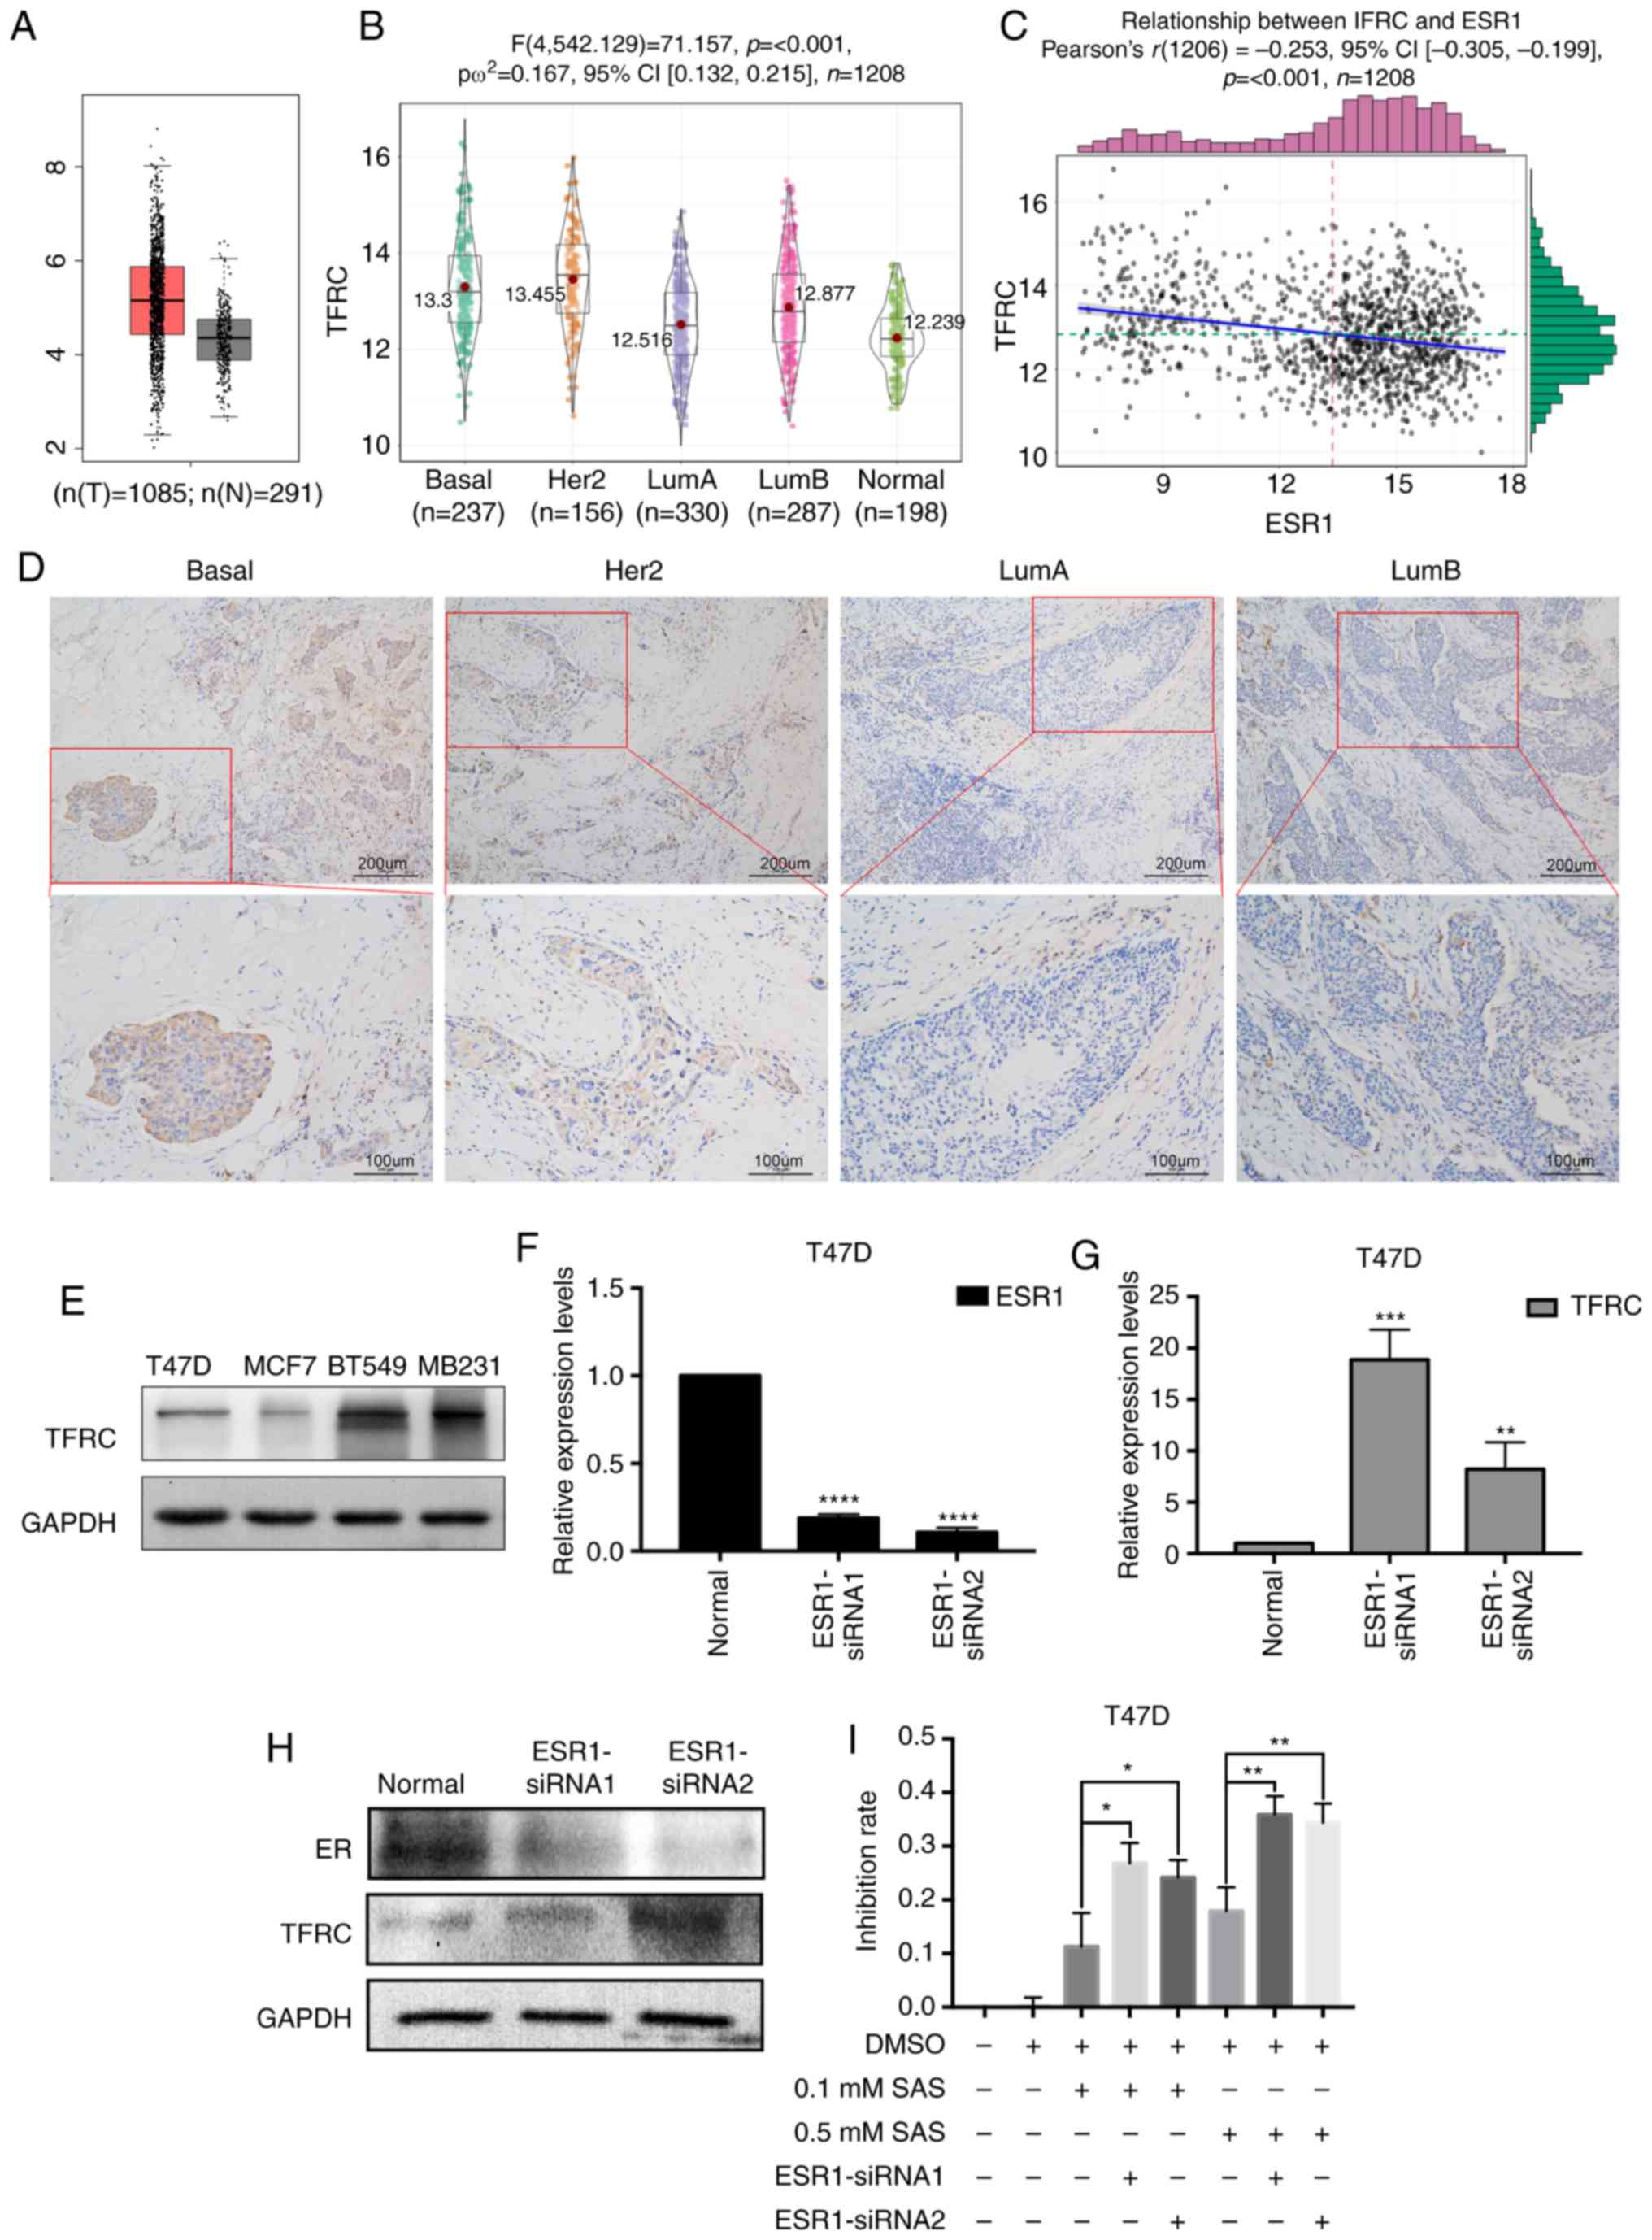
ER inhibits TFRC expression in breast
cancer cells
TFRC is a key factor in iron metabolism, and after
determining the role of TFRC in ferroptosis in breast cancer cells,
its expression in breast cancer tissues was also investigated.
First, TFRC expression was determined in cancer tissues and normal
tissues using GEPIA. As revealed in Fig.
5A, TFRC expression in tumor tissues was significantly higher
than that in normal tissues. TFRC expression was detected in
different breast cancer tissues using immunohistochemistry. Next,
bioinformatics was used to analyze TFRC expression in breast cancer
subtypes. As revealed in Fig. 5B,
TFRC expression in basal (TNBC usually has a basal molecular
phenotype) and Her2 subtypes was higher than that in luminal and
normal subtypes. The expression of ER is negative in TNBC and
Her2+ breast cancer. Therefore, the relationship between
ER and TFRC was determined. Bioinformatics was used again to
analyze the correlation between TFRC and ER. Notably, a negative
correlation between TFRC and ER (Fig.
5C) was revealed. This result may explain why T47D cells are
less sensitive than MDA-MB-231 cells to SAS-induced ferroptosis
(Fig. 1D). To obtain more convincing
results, clinical samples of different tissue types were selected
for IHC. The results revealed that TFRC expression was
significantly higher in breast cancer tissues of basal and
Her2+ cells than in luminal type cancer tissues. This
finding was consistent with the results of our previous
bioinformatics analysis (Fig. 5D).
Similar results were obtained in different breast cancer cells.
TFRC expression was lower in ER+ breast cancer cell
lines (T47D and MCF7) than in TNBC cells (BT549 and MB231)
(Fig. 5E). Due to the different TFRC
expression levels, the sensitivity to SAS-induced ferroptosis
varies. The difference in TFRC expression may be due to differences
in ER expression in different breast cancer cells. To verify our
speculation, siRNAs were used to knockdown ESR1 (the gene encodes
the ER) in T47D cells. As revealed in Fig. 5F and H, the expression of ER was
successfully knocked down at both the RNA and protein levels. In
response to ER knockdown, an increase in TFRC expression (Fig. 5G and H) was observed. These results
demonstrated that ER may inhibit TFRC. As revealed in Fig. 1C, MDA-MB-231 and T47D cells had the
greatest difference in sensitivity to SAS at concentrations of 0.1
and 0.5 mM. Therefore, these two concentrations were selected for
the following experiments. Low concentrations of SAS (0.1 and 0.5
mM) were used to treat ER-knockdown T47D cells. Subsequently, CCK-8
assays were used to assess the SAS-mediated inhibition of T47D
cells. The inhibition rate was significantly increased after
knocking down ER (Fig. 5I).
Collectively, our findings indicated that ER has a protective
effect on SAS-induced ferroptosis, and the inhibition of TFRC
expression may be one of the underlying mechanisms. To determine
TFRC expression in breast cancer tissues, 87 clinical tissue
samples from patients with breast cancer were collected and total
RNA was extracted. RT-PCR was used to detect TFRC expression in
these different breast cancer tissues. Concurrently, to identify
new relationships between TFRC and clinical characteristics, the
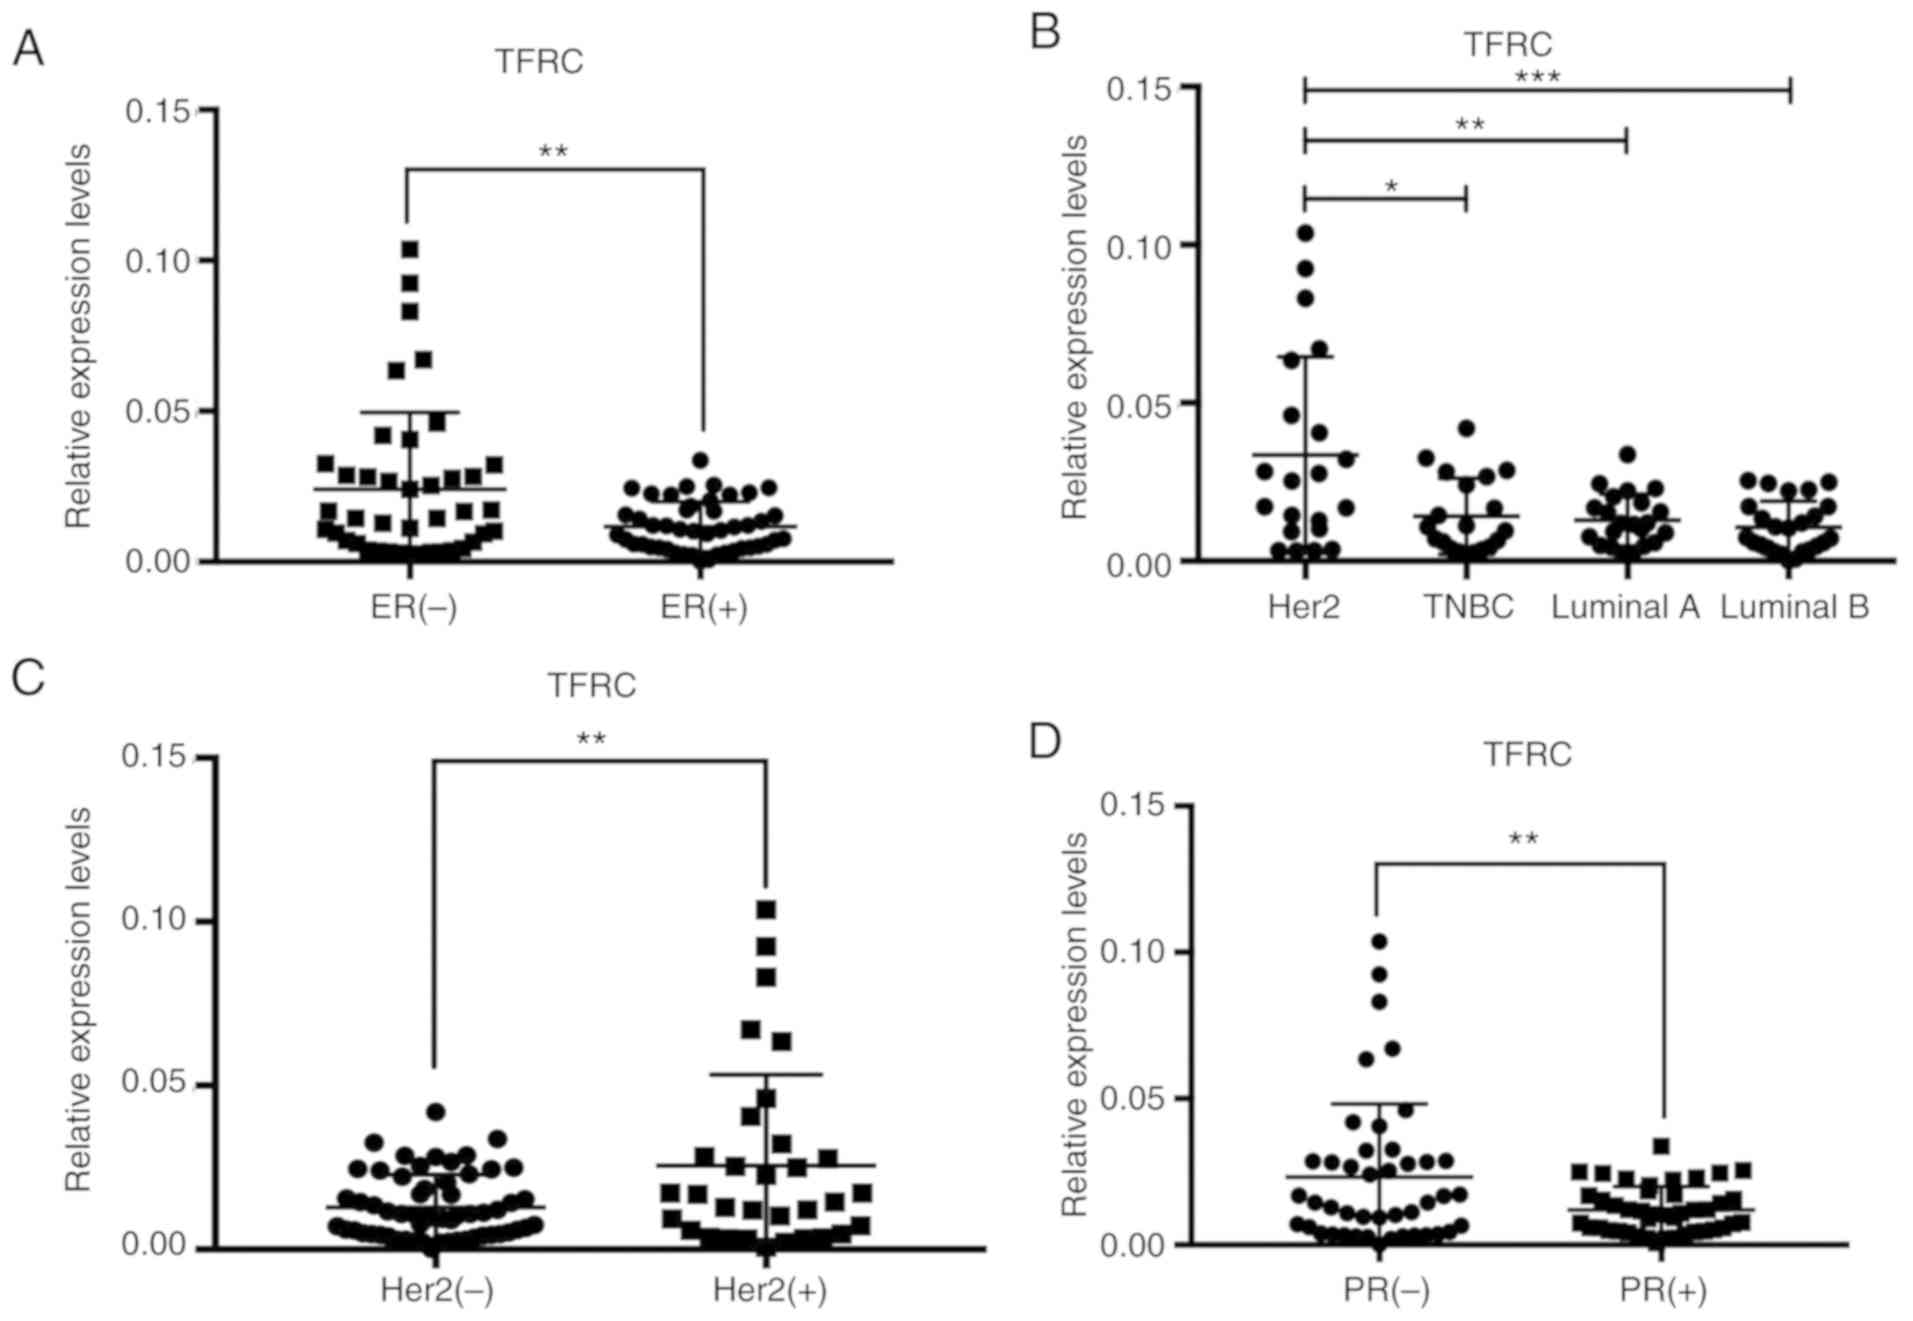
clinical data was analyzed. As revealed in Fig. 6A, TFRC was expressed at lower levels
in ER+ breast cancer tissues than in ER−
breast cancer tissues, indicating that ER may inhibit TFRC. This
result was consistent with our findings in the in vitro cell
experiments. TFRC expression in tissues representing different
breast cancer subtypes was also consistent with TCGA database
analysis results. Compared with other subtypes, the Her2 subtype
had the highest expression of TFRC (Fig.
6B). Indicative of the relationship between the Her2 gene and
TFRC, a high expression of TFRC in Her2+ breast cancer
tissues (Fig. 6C) was observed.
Estrogen is a messenger that must bind to cellular receptors to
function. Once combined with estrogen, the ER is activated and
transported into the nucleus. After gene transcription leads to PR
synthesis, PR synthesis must be achieved by the action of ER
synthesis. PR synthesis occurs in conjunction with ER synthesis.
Therefore, if the PR is expressed, the ER must also be expressed.
Therefore, the expression patterns of the two receptors are
similar. The expression of TFRC in PR− breast cancer
tissues was higher than that in PR+ breast cancer
tissues (Fig. 6D). The relationship
between TFRC expression and TNM stage, histological grade and Ki-67
expression was also explored, however, no significant associations
were revealed (Fig. S1).
Discussion
Research on ferroptosis has been continuing at a
steady pace since this phenomenon was discovered in 2012. From
numerous previous studies, it is recognized that iron metabolism
and lipid peroxidation are two important pathways leading to
ferroptosis (7). The inhibition of
system xc− plays a role during the beginning
of lipid peroxidation, which triggers ferroptosis. System
xc− is a heterodimeric cell surface amino
acid antiporter composed of the twelve-pass transmembrane
transporter protein SLC7A11(xCT) linked by a disulfide bridge to
the single-pass transmembrane regulatory protein SLC3A2 (23). Therefore, it is common to detect the
expression of system xc− by assessing the
level of xCT. System xc− imports
extracellular cystine into cells in exchange for intracellular
glutamate (5,22).
xCT is highly expressed in diverse malignancies,
including TNBC and is induced by chemotherapy (24,25).
Previous studies have indicated that targeting the novel MUC1-C/xCT
pathway could represent a potential therapeutic approach for
promoting TNBC cell death (26). A
breakthrough study published in 2013 stated that xCT inhibition
with the clinically approved anti-inflammatory agent SAS decreases
tumor growth, thereby revealing a therapeutic target in breast
cancer patients with the poorest prognosis and identifying a lead
compound for rapid and effective drug development (25). The study clearly stated that xCT is a
compelling therapeutic target for TNBC and that the combination of
SAS and carboplatin is very effective for TNBC and may even be
recommended for clinical use. However, the study did not explain
the relationship between SAS and ferroptosis or address the role of
SAS in other molecular subtypes of breast cancer.
Many small molecules or drugs, such as erastin, SAS,
and sorafenib, have been revealed to trigger ferroptosis by
inhibiting xCT. Notably, the molecular structures of the three
drugs are very similar (15). SAS, a
widely used drug for chronic inflammation, can have the same effect
as antitumor drugs such as sorafenib, and is therefore of research
interest. Inhibition of the NF-κB signaling pathway may be one of
the underlying mechanisms (27). Even
more notable is the fact that SAS can induce cell death in a
variety of malignancies, such as pancreatic cancer (11) and glioma (14). Recently, Tang et al reported
that cystine deprivation triggered necrosis in TNBC cells (28), and Wang and Yang revealed that ADR
increased the expression of SLC7A11 in TNBC, while the inhibition
of the SLC7A11 antiporter system sensitized TNBC cells to ADR
(29). These results indicated that
SLC7A11 is a potential target for the enhancement of the anticancer
efficacy of conventional therapies in patients with TNBC. However,
these studies are limited to TNBC and SLC7A11 (xCT) and do not
address other molecular subtypes of breast cancer or explore iron
metabolism pathways.
Iron is essential for the execution of ferroptosis.
Both membrane permeable and membrane impermeable iron chelators
prevent cells from undergoing ferroptosis, irrespective of whether
it is induced by erastin, RSL3 or a physiological stimulus such as
a high concentration of extracellular glutamate (30,31).
Likewise, ferroptosis induced by erastin or Cys2 deprivation can be
prevented by the genetic silencing of the TFRC gene, which encodes
the transferrin receptor required for the uptake of
transferrin-iron complexes into cells (32). These results firmly establish the need
for iron in ferroptosis. However, how iron promotes ferroptosis
inside the cell remains unclear. A recent study revealed that
clinically approved SAS enhanced the death of pancreatic cancer
cells induced by piperlongumine (PL) and that the combined effects
were abrogated by ferroptosis inhibitors and DFO (33). Therefore, it was hypothesized that the
activity of SAS is related to the iron metabolic pathway.
In the present study, using microscopy and CCK-8
analysis, it was demonstrated that SAS could inhibit the growth of
TNBC cells (MDA-MB-231) and ER+ breast cancer cells
(T47D). It was also revealed that these two cell lines had
different sensitivities to SAS. However, whether this growth
inhibition is due to ferroptosis required more evidence. Western
blotting was used to detect the expression of GPX4 and xCT. Flow
cytometry was used to determine changes in ROS, and changes in
mitochondrial morphology were detected by transmission electron
microscopy. Confocal fluorescence microscopy was used to observe
the changes in the MMP. By combining the results of these
experiments, it was confirmed that SAS in fact triggered
ferroptosis in different breast cancer cells. This result was
consistent with the findings of previous studies, revealing that
SAS-induced ferroptosis is caused by the inhibition of xCT and an
increase in the accumulation of ROS. The present research has some
limitations, including the lack of evidence from in vivo
experiments. Several in vivo experiments were attempted,
however the results were all negative. The primary explanation for
this result is that SAS is a drug mainly used for gastrointestinal
inflammation, and it is absorbed in the gastrointestinal tract.
When SAS reaches the tumor, the drug concentration is very low, and
it will not affect tumor growth in vivo. A large body of
literature was searched and relevant experiments were revealed in a
study published in 2013 (25). This
study revealed that SAS can reduce the volume of breast tumors
in vivo, which can be used as a supplement to our research.
Iron metabolism, another important pathway for ferroptosis, has not
been reported to be affected by SAS. Therefore, a preliminary
exploration of the relationship between SAS and iron metabolism was
performed. As revealed in Fig. 4, the
expression of TFRC and DMT1 increased with increasing
concentrations of SAS, indicating that SAS may activate TFRC and
DMT1 to induce ferroptosis.
Unlike previous studies, the present study was not
limited to TNBC. When the present results were reviewed, an
interesting phenomenon was observed. The ER+ breast
cancer cell line T47D did not behave the same as the TNBC cell line
MDA-MB-231 (Fig. 1C). This finding
may be related to differences in the expression of xCT in different
cell lines (25). However, the most
important difference between T47D and MDA-MB-231 cells was the
expression of the ER. To confirm this notable phenomenon, two other
breast cancer lines (BT549 and MCF7, representing TNBC and
ER+ breast cancer, respectively) were included. Notably,
similar results as with MDA-MB-231 and T47D cells were obtained.
Therefore, it was hypothesized that ER has a potential inhibitory
effect on SAS-induced ferroptosis.
ER was then knocked down in T47D cells with siRNAs
and the cells were treated with a low dose of SAS for 24 h, and the
growth inhibition rate in the cells was assessed. Notably, the
inhibition rate for T47D cells was increased after ER-specific
siRNA transfection. However, it is still unclear how ER functions.
Bioinformatics analysis indicated that ER expression may be
associated with TFRC expression. After knocking down ER, RT-PCR was
used to detect some of the key factors in ferroptosis. Among the
many factors, TFRC expression was revealed to be significantly
increased (Fig. 5G); the same effect
was observed at the protein level (Fig.
5H). Usually, expression in in vitro cell experiments
may differ from expression in tissues; thus, the expression at the
histological level was verified. To this end, 87 clinical tissue
samples were collected as well as their related information. It was
revealed that TFRC was expressed at lower levels in ER+
breast cancer tissues than in ER− breast cancer tissues.
Similar results were observed for PR+ and PR−
breast cancer tissues. In contrast, TFRC was more highly expressed
in Her2− breast cancer tissues than Her2−
breast cancer tissues. Thus, ER inhibits the expression of TFRC. It
is worth mentioning that the presence of SAS does not alter the
expression of TFRC in different breast cancer cells. Simply put,
the two are not causal. TFRC expression in TNBC and ER+
breast cancer cells does not change due to the presence or absence
of SAS. TFRC expression is altered by the different expression
levels of ER in different breast cancer cells (TFRC is highly
expressed in low-ER TNBC cells and is low in ER+ breast
cancer). TFRC expression varies in breast cancer, which in turn
produces different sensitivities to SAS in the different breast
cancer cells. It is not SAS that changes the expression of TFRC. In
conclusion, SAS can trigger ferroptosis in breast cancer cells,
especially cells with low ER expression. Therefore, SAS is a
potential agent for breast cancer treatment.
The present study still has some limitations.
Firstly, due to the characteristics of the mitochondrial membrane
potential detection experiment, DAPI could not be used to stain the
nucleus. The purpose of our experiment was to detect mitochondrial
membrane potential. For the accuracy of the experiment, cell
activity should be maintained during the labeling process. Staining
of the nucleus of living cells with DAPI was attempted; however,
DAPI could penetrate the cell membrane and enter the nucleus. Of
note, if the cells were fixed with formaldehyde and the
permeability of the cell membrane was increased with some relevant
reagents, then DAPI could enter the cells to stain the nucleus.
However, this process would kill the cells, and the authenticity of
the results could not be guaranteed. For a variety of complex
reasons, only a preliminary exploration of the increase in iron
metabolism caused by SAS was performed. In a future study, the
effects of SAS on iron will be explored, e.g., by detecting changes
in the accumulation of iron in cells. Another key issue is where
the ER participates in the effects of SAS on TFRC. This question is
in fact difficult to answer from our current experimental results
since the relationship between the ER and TFRC has not been
observed in previous studies. This phenomenon was only revealed; to
determine a mechanism, siRNA was used to knock down the ER and
detect TFRC expression. The results were confirmed by
bioinformatics technology and finally verified by clinical tissue
samples. However, the specific mechanisms and locations of
participation are not very clear in the present findings. In our
subsequent research, through the analysis of STRING (https://string-db.org), it was revealed that the
relationship between ER and TFRC may be through AKT1, SRC, p53 as
well as other genes. Therefore, the answer to this question may be
addressed in future studies. In addition, a high expression of TFRC
in Her2+ breast cancer tissue samples was revealed. A
study by Miller et al revealed that an iron-regulatory gene
signature predicted outcomes in breast cancer (34). Therefore, iron metabolism is closely
related to the occurrence and development of breast cancer.
However, the exact relationship between the Her2 gene and TFRC
remains unknown. These issues are worthy of further study. Finally,
the present experiments did not use normal breast epithelial cells
for comparison for the following reasons. The main purpose of our
study was to investigate the role of SAS in breast cancer, rather
than the role in normal breast tissue. In addition, TFRC expression
in normal tissues and cancer tissues was also compared by
bioinformatics in Fig. 5A.
Conversely, it is difficult to find a suitable cell line as a
representative of the normal epithelium of the breast. It has been
reported that MCF10A cells (cells used as normal controls in many
studies) are not representative of normal breast cancer cells
(35).
In conclusion, the present study proposed for the
first time that SAS can induce ferroptosis in breast cancer cells
not only by the inhibition of xCT but also by the activation of
iron metabolism. Furthermore, the inhibitory effect of ER on TFRC
may explain why breast cancer cells with different molecular types
have different sensitivities to SAS-induced ferroptosis. The
present results further revealed the functions of the ER in the
ferroptosis network and indicated SAS as a potential agent for
breast cancer treatment.
Supplementary Material
Supporting Data
Acknowledgements
Not applicable.
Funding
The present study was supported by grants from the
National Natural Science Foundation of China (nos. 81772979 and
81472658) and the Chongqing Graduate Research and Innovation
Project (CYS17157).
Availability of data and materials
The datasets used during the present study are
available from the corresponding author upon reasonable
request.
Authors' contributions
HY and CY conceived the study, conducted most of the
experiments and drafted the manuscript together. LJ, SG, RC, KL,
FQ, KT and YF participated in the collection of clinical samples
and analyzed the bioinformatics data. FL and SL conducted the
statistical analysis of clinical data and analyzed a large amount
of experimental data. All the authors read and approved the
manuscript and agree to be accountable for all the aspects of the
research in ensuring that the accuracy or integrity of any part of
the work are appropriately investigated and resolved.
Ethics approval and consent to
participate
The First Affiliated Hospital of Chongqing Medical
University Ethics Committee reviewed and approved the use of human
tissue specimens and all patients provided written informed
consent.
Patient consent for publication
Not applicable.
Competing interests
The authors declare that they have no competing
interests.
References
|
1
|
Torre LA, Bray F, Siegel RL, Ferlay J,
Lortet-Tieulent J and Jemal A: Global cancer statistics, 2012. CA
Cancer J Clin. 65:87–108. 2015. View Article : Google Scholar : PubMed/NCBI
|
|
2
|
Weigelt B and Reis-Filho JS: Histological
and molecular types of breast cancer: Is there a unifying taxonomy?
Nat Rev Clin Oncol. 6:718–730. 2009. View Article : Google Scholar : PubMed/NCBI
|
|
3
|
Houessinon A, François C, Sauzay C,
Louandre C, Mongelard G, Godin C, Bodeau S, Takahashi S, Saidak Z,
Gutierrez L, et al: Metallothionein-1 as a biomarker of altered
redox metabolism in hepatocellular carcinoma cells exposed to
sorafenib. Mol Cancer. 15:382016. View Article : Google Scholar : PubMed/NCBI
|
|
4
|
Ooko E, Saeed ME, Kadioglu O, Sarvi S,
Colak M, Elmasaoudi K, Janah R, Greten HJ and Efferth T:
Artemisinin derivatives induce iron-dependent cell death
(ferroptosis) in tumor cells. Phytomedicine. 22:1045–1054. 2015.
View Article : Google Scholar : PubMed/NCBI
|
|
5
|
Dixon SJ, Lemberg KM, Lamprecht MR, Skouta
R, Zaitsev EM, Gleason CE, Patel DN, Bauer AJ, Cantley AM, Yang WS,
et al: Ferroptosis: An iron-dependent form of nonapoptotic cell
death. Cell. 149:1060–1072. 2012. View Article : Google Scholar : PubMed/NCBI
|
|
6
|
Xie Y, Hou W, Song X, Yu Y, Huang J, Sun
X, Kang R and Tang D: Ferroptosis: Process and function. Cell Death
Differ. 23:369–379. 2016. View Article : Google Scholar : PubMed/NCBI
|
|
7
|
Dixon SJ and Stockwell BR: The role of
iron and reactive oxygen species in cell death. Nat Chem Biol.
10:9–17. 2014. View Article : Google Scholar : PubMed/NCBI
|
|
8
|
Lewerenz J, Hewett SJ, Huang Y, Lambros M,
Gout PW, Kalivas PW, Massie A, Smolders I, Methner A, Pergande M,
et al: The cystine/glutamate antiporter system x(c)(−) in health
and disease: From molecular mechanisms to novel therapeutic
opportunities. Antioxid Redox Signal. 18:522–555. 2013. View Article : Google Scholar : PubMed/NCBI
|
|
9
|
Gout PW, Buckley AR, Simms CR and
Bruchovsky N: Sulfasalazine, a potent suppressor of lymphoma growth
by inhibition of the x(c)-cystine transporter: A new action for an
old drug. Leukemia. 15:1633–1640. 2001. View Article : Google Scholar : PubMed/NCBI
|
|
10
|
Dixon SJ, Patel DN, Welsch M, Skouta R,
Lee ED, Hayano M, Thomas AG, Gleason CE, Tatonetti NP, Slusher BS
and Stockwell BR: Pharmacological inhibition of cystine-glutamate
exchange induces endoplasmic reticulum stress and ferroptosis.
Elife. 3:e025232014. View Article : Google Scholar : PubMed/NCBI
|
|
11
|
Lo M, Ling V, Low C, Wang YZ and Gout PW:
Potential use of the anti-inflammatory drug, sulfasalazine, for
targeted therapy of pancreatic cancer. Curr Oncol. 17:9–16.
2010.PubMed/NCBI
|
|
12
|
Basuli D, Tesfay L, Deng Z, Paul B,
Yamamoto Y, Ning G, Xian W, McKeon F, Lynch M, Crum CP, et al: Iron
addiction: A novel therapeutic target in ovarian cancer. Oncogene.
36:4089–4099. 2017. View Article : Google Scholar : PubMed/NCBI
|
|
13
|
Livak KL and Schmittgen TD: Analysis of
relative gene expression data using real-time quantitative PCR and
the 2(-Delta Delta C(T)) method. Methods. 25:402–408. 2001.
View Article : Google Scholar : PubMed/NCBI
|
|
14
|
Sehm T, Fan Z, Ghoochani A, Rauh M,
Engelhorn T, Minakaki G, Dörfler A, Klucken J, Buchfelder M,
Eyüpoglu IY and Savaskan N: Sulfasalazine impacts on ferroptotic
cell death and alleviates the tumor microenvironment and
glioma-induced brain edema. Oncotarget. 7:36021–36033. 2016.
View Article : Google Scholar : PubMed/NCBI
|
|
15
|
Cao JY and Dixon SJ: Mechanisms of
ferroptosis. Cell Mol Life Sci. 73:2195–2209. 2016. View Article : Google Scholar : PubMed/NCBI
|
|
16
|
NaveenKumar SK, SharathBabu BN, Hemshekhar
M, Kemparaju K, Girish KS and Mugesh G: The role of reactive oxygen
species and ferroptosis in heme-mediated activation of human
platelets. ACS Chem Biol. 13:1996–2002. 2018. View Article : Google Scholar : PubMed/NCBI
|
|
17
|
Friedmann Angeli JP, Schneider M, Proneth
B, Tyurina YY, Tyurin VA, Hammond VJ, Herbach N, Aichler M, Walch
A, Eggenhofer E, et al: Inactivation of the ferroptosis regulator
Gpx4 triggers acute renal failure in mice. Nat Cell Biol.
16:1180–1191. 2014. View Article : Google Scholar : PubMed/NCBI
|
|
18
|
Bogacz M and Krauth-Siegel RL:
Tryparedoxin peroxidase-deficiency commits trypanosomes to
ferroptosis-type cell death. ELife. 7(pii): e375032018. View Article : Google Scholar : PubMed/NCBI
|
|
19
|
Wei G, Sun J, Hou Z, Luan W, Wang S, Cui
S, Cheng M and Liu Y: Novel antitumor compound optimized from
natural saponin Albiziabioside A induced caspase-dependent
apoptosis and ferroptosis as a p53 activator through the
mitochondrial pathway. Eur J Med Chem. 157:759–772. 2018.
View Article : Google Scholar : PubMed/NCBI
|
|
20
|
Kang R, Zhu S, Zeh HJ, Klionsky DJ and
Tang D: BECN1 is a new driver of ferroptosis. Autophagy.
14:2173–2175. 2018. View Article : Google Scholar : PubMed/NCBI
|
|
21
|
Torti SV, Manz DH, Paul BT,
Blanchette-Farra N and Torti FM: Iron and cancer. Annu Rev Nutr.
38:97–125. 2018. View Article : Google Scholar : PubMed/NCBI
|
|
22
|
Yanatori I and Kishi F: DMT1 and iron
transport. Free Radic Biol Med. 133:55–63. 2018. View Article : Google Scholar : PubMed/NCBI
|
|
23
|
Sato H, Tamba M, Ishii T and Bannai S:
Cloning and expression of a plasma membrane cystine/glutamate
exchange transporter composed of two distinct proteins. J Biol
Chem. 274:11455–11458. 1999. View Article : Google Scholar : PubMed/NCBI
|
|
24
|
Lo M, Wang YZ and Gout PW: The
x(c)-cystine/glutamate antiporter: A potential target for therapy
of cancer and other diseases. J Cell Physiol. 215:593–602. 2008.
View Article : Google Scholar : PubMed/NCBI
|
|
25
|
Timmerman LA, Holton T, Yuneva M, Louie
RJ, Padró M, Daemen A, Hu M, Chan DA, Ethier SP, van t Veer LJ, et
al: Glutamine sensitivity analysis identifies the xCT antiporter as
a common triple-negative breast tumor therapeutic target. Cancer
Cell. 24:450–465. 2013. View Article : Google Scholar : PubMed/NCBI
|
|
26
|
Hasegawa M, Takahashi H, Rajabi H, Alam M,
Suzuki Y, Yin L, Tagde A, Maeda T, Hiraki M, Sukhatme VP and Kufe
D: Functional interactions of the cystine/glutamate antiporter,
CD44v and MUC1-C oncoprotein in triple-negative breast cancer
cells. Oncotarget. 7:11756–11769. 2016. View Article : Google Scholar : PubMed/NCBI
|
|
27
|
Gout PW, Buckley AR, Simms CR and
Bruchovsky N: Sulfasalazine, a potent suppressor of lymphoma growth
by inhibition of the x(c)-cystine transporter: A new action for an
old drug. Leukemia. 15:1633–1640. 2001. View Article : Google Scholar : PubMed/NCBI
|
|
28
|
Tang X, Ding CK, Wu J, Sjol J, Wardell S,
Spasojevic I, George D, McDonnell DP, Hsu DS, Chang JT and Chi JT:
Cystine addiction of triple-negative breast cancer associated with
EMT augmented death signaling. Oncogene. 36:4235–4242. 2017.
View Article : Google Scholar : PubMed/NCBI
|
|
29
|
Wang F and Yang Y: Retraction Note to:
Suppression of the xCT-CD44v antiporter system sensitizes
triple-negative breast cancer cells to doxorubicin. Breast Cancer
Res Treat. 151:4792015. View Article : Google Scholar : PubMed/NCBI
|
|
30
|
Yang WS, SriRamaratnam R, Welsch ME,
Shimada K, Skouta R, Viswanathan VS, Cheah JH, Clemons PA, Shamji
AF, Clish CB, et al: Regulation of ferroptotic cancer cell death by
GPX4. Cell. 156:317–331. 2014. View Article : Google Scholar : PubMed/NCBI
|
|
31
|
Yang WS and Stockwell BR: Synthetic lethal
screening identifies compounds activating iron-dependent,
nonapoptotic cell death in oncogenic-RAS-harboring cancer cells.
Chem Biol. 15:234–245. 2008. View Article : Google Scholar : PubMed/NCBI
|
|
32
|
Gao M, Monian P, Quadri N, Ramasamy R and
Jiang X: Glutaminolysis and transferrin regulate ferroptosis. Mol
Cell. 59:298–308. 2015. View Article : Google Scholar : PubMed/NCBI
|
|
33
|
Yamaguchi Y, Kasukabe T and Kumakura S:
Piperlongumine rapidly induces the death of human pancreatic cancer
cells mainly through the induction of ferroptosis. Int J Oncol.
52:1011–1022. 2018.PubMed/NCBI
|
|
34
|
Miller LD, Coffman LG, Chou JW, Black MA,
Bergh J, D'Agostino R Jr, Torti SV and Torti FM: An iron regulatory
gene signature predicts outcome in breast cancer. Cancer Res.
71:6728–6737. 2011. View Article : Google Scholar : PubMed/NCBI
|
|
35
|
Qu Y, Han B, Yu Y, Yao W, Bose S, Karlan
BY, Giuliano AE and Cui X: Evaluation of MCF10A as a reliable model
for normal human mammary epithelial cells. PLoS One.
10:e01312852015. View Article : Google Scholar : PubMed/NCBI
|