Introduction
Gastric cancer is the fifth most common malignancy,
and the third leading cause of cancer-related death worldwide, with
approximately 952,000 new cases and 723,000 deaths per year. It is
most prevalent in East Asia. The occurrence and development of
gastric cancer is a multi-stage, multi-step process, which is the
result of accumulation of multiple genetic variants (1,2).
Melatonin (N-acetyl 5-methoxytryptamine, MLT)
is a neuroendocrine hormone synthesized and secreted mainly by the
pineal gland. MLT is also synthesized in some peripheral organs
including gastrointestinal organs (3)
and skin (4,5), with higher levels than that noted in the
serum. MLT exerts a variety of receptor-mediated or
receptor-independent physiological functions (6): Regulation of the circadian rhythm,
inhibition of the development of the reproductive system,
regulation of bone growth, inhibition of tumorigenesis, regulation
of the immune system, scavenging of free radical antioxidants, and
exhibition of anti-inflammatory and neuroprotective effects
(5,7–9). A large
number of studies have shown that MLT can inhibit a variety of
malignancies such as gastric (10),
liver (11), breast (12) and oral cancer (13) by promoting tumor cell apoptosis,
arresting the cell cycle, inhibiting proliferation, regulating
antitumor immunity, scavenging free radicals, and competitively
inhibiting estrogen receptors. Our previous experiments established
the different concentrations of MLT which were able to intervene in
a murine model of gastric cancer, and it was found that MLT reduced
tumor volume and weight, achieved antitumor effects, and directly
downregulated CD4+CD25+ Treg cells and Foxp3
expression in gastric cancer tissue (14). Different concentrations of MLT have
been found to inhibit the proliferation of human gastric cancer
cell lines MGC-803, SGC-7901 (15)
and AGS (16), and the murine gastric
cancer MFC cell line (14) in a
time-dose dependent manner. Selective addition of Treg cells or
CD4+CD25− T cells to co-cultures revealed
that MLT inhibited the proliferation of MFC gastric cancer cells in
a dose-dependent manner (17).
Transforming growth factor β (TGF-β) is a
polypeptide growth factor with various biological activities, and
is widely distributed in various types of tissues. In mammals,
TGF-β has three isoforms: TGF-β1, 2 and 3, of which TGF-β1 is most
abundant in the TGF-β family (18).
The role of TGF-β in the development of tumors is dual. Initially,
it inhibits the growth of tumor cells; however, when tumor cells
lose their sensitivity it promotes tumor cell growth by affecting
the extracellular matrix, cell adhesion, neovascularization, the
immune response, and other aspects of tumor growth (19). Proietti et al (20) found that the expression of TGF-β1 in
MCF-7 human breast cancer cells was significantly upregulated after
MLT intervention for 72 h, and was completely inhibited by an
anti-TGF-β1 neutralizing antibody, indicating MLT mediates late
apoptosis of MCF-7 tumor cells.
However, studies on the effects of MLT on gastric
cancer and on the expression of TGF-β1 are rare. The present study
was constructed as a continuation of previous research (14–17,21). The
aim of this study was to investigate the role of TGF-β1 in the
MLT-mediated inhibition of the proliferation of gastric cancer
cells in vitro and in vivo.
Materials and methods
MFC cell culture
The murine foregastric carcinoma cell line (MFC)
derived from strain-615 mice was purchased from the Chinese Academy
of Sciences, Shanghai Institute for Biological Science (Shanghai,
China). MFC cells were cultured in Roswell Park Memorial Institute
(RPMI)-1640 medium supplemented with 10% fetal bovine serum (FBS).
The cells were maintained at 37°C in a 5% CO2 atmosphere
in a humidified incubator. The cells were passaged every three days
by using trypsin digestion. All cell culture reagents were
purchased from Gibco/Invitrogen (Thermo Fisher Scientific, Inc.,
Waltham, MA, USA).
Experimental animal model design and
specimen preparation
Six- to 8-week old inbred strain-615 mice
(H-2Kk) used in these experiments [specific
pathogen-free (SPF) grade, weighing 20–25 g) were purchased from
Tianjin Institute of Hematology, The Chinese Academy of Medical
Science. The totel number of mice were 50, half were males and half
were females. Ethical approval was obtained for the use of animals
prior to the start of the study from the Fujian Medical University
Animal Welfare and Ethics Committee (FJMUIACUC2018-003), which is
located in Fuzhou, Fujian Province, China. All the animals were
maintained under laboratory conditions with equal periods of light
and dark (08:00-20:00) and the acclimation period was about one
week. Then 40 mice were subcutaneously inoculated with
5×10⁴ MFC cells under the right axilla. One week after
inoculation, the tumor-bearing mice model was successfully
established as follows: Group A, normal control mice (n=10); Group
B, tumor-bearing control mice with a daily intraperitoneal
injection of 100 mg/kg saline water which included 0.5% absolute
ethanol (n=10); Group C, tumor-bearing mice with saline water daily
which included low dosage 25 mg/kg MLT (Sigma-Aldrich; Merck KGaA)
and MLT was reconstituted in 0.5% absolute ethanol (n=10); Group D,
tumor-bearing mice with saline water daily which included medium
dosage 50 mg/kg MLT and MLT was reconstituted in 0.5% absolute
ethanol (n=10); Group E, tumor-bearing mice with saline water daily
which included high dosage 100 mg/kg MLT daily and MLT was
reconstituted in 0.5% absolute ethanol (n=10). MLT was administered
to the assigned groups at 17:00 every day for one week by
intraperitoneal injection. Peripheral blood and tumor tissue
samples were collected one day after the final MLT injection.
First, the mice were anesthetized with 2% pentobarbital sodium, 40
mg/kg, and the route of administration of the anesthetic was
intraperitoneal injection, then the peripheral blood was taken.
Finally, the mice were euthanized by intraperitoneal injection of
2% pentobarbital sodium 100 mg/kg after the longest diameter of the
tumor was approximately 20 mm and the largest tumor volume reached
~0.9 cm3 (14). After the
confirmation of death, the skin in the right armpit of the
strain-615 mice were cut, and the tumor tissue was stripped
completely. Peripheral blood was centrifuged at 3,000 × g for 8
min, and then the upper serum was aspirated and stored at −80°C.
The tumor tissues were divided into two parts. One was stored in
cryovials and immediately put into liquid nitrogen for subsequent
RNA extraction experiments. The other was stored in 4%
paraformaldehyde for subsequent paraffin-embedding experiments.
Cell culture model
MFC cells were seeded at a density of
3×10⁵ cells/well in 6-well plates, 2 ml of medium per
well. After cells became adherent, MFC cells were treated with 2 or
4 mM MLT, and the blank control was set up. The concentrations of 2
and 4 mM were determined according to our previous research
(14,21). The 2-mM MLT intervention group was
observed once daily at six time-points of 24–144 h, while the 4-mM
MLT intervention group was observed at three daily time-points of
24–72 h. The experiment was repeated at least thrice.
Real-time quantitative RT-PCR for
detection of TGF-β1 mRNA expression in tumor tissues and MFC
cells
Total RNA was isolated using TRIzol reagent
(Invitrogen; Thermo Fisher Scientific, Inc.) according to the
manufacturer's instructions. First-strand cDNA was generated from 2
mg of each RNA preparation by reverse transcription using the First
Strand cDNA Synthesis kit (Promega). Real-time quantitative
polymerase chain reaction (PCR) for the analysis of tumor tissues
and MFC cells for expression of TGF-β1 and
glyceraldehyde-3-phosphate dehydrogenase (GAPDH) genes and cDNA was
amplified using the dye SYBR-Green (Stratagene) on a StepOnePlus
Real-Time PCR System (Applied Biosystems; Thermo Fisher Scientific,
Inc.). The PCR cycling conditions (40 cycles) were as follows: 30
sec at 95°C; for 1 min at 60°C. The fold-change in expression of
each gene was calculated using the (2−ΔΔCq) method
(22). Product quality of PCR was
monitored using post-PCR melting curve analysis at the end of the
amplification cycles. The primers were as follows: TGF-β1 (213 bp),
5′-AATACAGGGCTTTCGATTCAGC-3′ and 5′-TAGTTGGTATCCAGGGCTCTCC-3′;
GAPDH (231 bp), 5′-CCGAGAATGGGAAGCTTGTC-3′ and
5′-TTCTCGTGGTTCACACCCATC-3′.
Immunohistochemistry to detect TGF-β1
expression in tumor tissues and MFC cells
Tumor tissues or MFC cells were fixed with 4%
paraformaldehyde. Immunohistochemistry or immunocytochemical
staining method for TGF-β1 expression was carried out. The sections
were incubated at 4°C with a primary antibody against TGF-β1 (cat.
no. ab92486; Abcam; dilution 1:150) overnight. After washing with
PBS three times, the sections were incubated with the biotinylated
antibody for 1 h, and then incubated in Elite ABC reagent (Vector
Laboratories). Subsequently, the sections were stained with
3,3-diaminobenzidine (DAB, Sigma-Aldrich; Merck KGaA). Images were
captured with a Leica DM 4000B photomicroscope (magnification,
×400; Leica Microsystems). Then positive areas of stained cells and
average optical, that is, mean optical density of cytoplasm in
stained cells were quantified using the image analysis software
ImageJ (NIH; National Institutes of Health).
Peripheral serum ELISA assay
Serum was collected as described above, and the
TGF-β1 protein levels in the serum were quantified by enzyme-linked
immunosorbent assay (ELISA) methods. The serum samples were
collected and centrifuged at 12,000 × g at 4°C for 10 min, and then
ELISA analysis was performed according to the manufacturer's
instructions (TGF-β1-ELISA kit; Invitrogen; Thermo Fisher
Scientific, Inc.). The values of optical density (OD; A450 values)
were measured at 450 nm. The standard curve was determined by the
SPSS 22.0 statistical software (IBM Corp.) and then the content of
TGF-β1 was determined in the samples.
Cell proliferation and viability
assay
MFC cells were plated into 96-well plates (5,000
cells/well). The cells were treated as follows. For the control
group, 50 ng/ml of control solution was added to 100 ng/ml TGF-β1
(PeproTech Inc.) and cultured for 24–144 h. In the cell
experimental groups, MFC cells were plated into 96-well plates
(1×10⁴ cells/well) and treated as follows: control
group, 2 mM MLT + anti-TGF-β1 antibody; experimental group, 4 mM
MLT + anti-TGF-β1 antibody, 1 µg/ml (R&D Systems), then
cultured for 24–144 or 24–72 h, respectively. Cell viability and
proliferation were assayed using a Cell Counting Kit-8 (CCK-8;
Tongren Biochemistry) according to the manufacturer's protocol.
Briefly, the cells were incubated with a CCK-8 solution (10
ml/well) for 1 h before cell density was determined by measuring
the absorbance at 450 nm using a Varioskan Flash (Thermo
Scientific, Inc.).
Cell transfection of TGF-β1 siRNA
Different fragments of TGF-β1 siRNA and negative
control fragments were synthesized by Shanghai GenePharma Co., Ltd.
The sequences of siRNA were as follows: NC sense,
5′-UUCUCCGAACGUGUCACGUTT-3′ and antisense,
5′-ACGUGACACGUUCGGAGAATT-3′; TGF-β1–87 (TGF-β1A) sense,
5′-CGAAGGCAUUACAGUGUUUTT-3′ and antisense,
5′-AAACACUGUAAUGCCUUCGTT-3′; TGF-β1–273 (TGF-β1B) sense,
5′-GGGCAGUUACUACAACAUATT-3′ and antisense,
5′-UAUGUUGUAGUAACUGCCCTT-3′; TGF-β1–426 (TGF-β1C) sense,
5′-CACUUAUGCUGAUGGUCUATT-3′ and antisense,
5′-UAGACCAUCAGCAUAAGUGTT-3′. MFC cells were seeded in a 6-well
plate at a density of 3×10⁵ per well, and cultured
overnight. Transfection was performed when the cell confluency
reached 30–50%, and MFC cells were transfected with siRNA for the
negative control (NC) or siRNA TGF-β1 using PolyPlus siRNA
transfection reagent (Invitrogen; Thermo Fisher Scientific, Inc.)
according to the manufacturer's instructions. In brief, siRNA (100
pmol) was mixed with transfection reagent in Opti-MEM serum-free
media (Invitrogen; Thermo Fisher Scientific, Inc.) and incubated
for 20 min at room temperature. The siRNA/transfection reagent
mixture (TGF-β1A or B or C) was added to the cells for 24 h.
Verification of siRNA
interference
The most effective siRNA reagent was selected by
real-time quantitative reverse transcription PCR (RT-qPCR) and
western blot analysis. After 48 and 72 h of transfection, total RNA
was extracted from each group, and the expression of TGF-β1 mRNA
was detected by RT-qPCR. The method was the same as that described
above. After 48 and 72 h of transfection, the total protein of each
group was extracted. Protein concentrations were measured using the
enhanced BCA protein assay kit (Beyotime Institute of
Biotechnology) and TGF-β1 protein expression was verified by
western blot analysis. Equal amounts of 30 µg protein were
separated by 12% sodium dodecyl sulfate-polyacrylamide gel
electrophoresis (110 V, 1.5 h) and the membranes were blotted by
wet transfer (110 V, 1.5 h, 4°C) on polyvinylidene fluoride
membranes (EMD Millipore). The membranes were blocked in
Tris-buffered saline containing 0.5% bovine serum albumin (BSA).
The membranes were then incubated with the primary antibody
overnight at 4°C: Anti-TGF-β1 (cat. no. ab92486; dilution 1:100)
and anti-β-actin (cat. no. ab8227; dilution 1:1,000) (purchased
from Abcam). The membranes were washed with Tris-buffered saline
Tween-20 (TBST) and then incubated for 2 h at room temperature with
a secondary antibody goat anti-rabbit IgG (cat. no. ab98505;
dilution 1:5,000; Abcam). After washing with TBST, the membranes
were exposed to X-ray film (1–15 min) for visualization of the
immunoreactive bands. Densitometric analysis of specific bands was
performed using Quantity One software 4.3.0 (Bio-Rad
Laboratories).
Cellular group set-up and viability
assay
The cellular experiment was divided into eight
groups: 2 or 4 mM MLT-treated groups (a1 or a2), 2 or 4 mM MLT +
siRNA negative control groups (b1 or b2), 2 or 4 mM MLT + siRNA
TGF-β1 groups (c1 or c2) and 2 or 4 mM MLT + siRNA TGF-β1 +
anti-TGF-β1 groups (d1 or d2). Control and a duplicate well were
set up and the experiment was performed thrice. For each, 0.25 µl
Lipofectamine 2000 was diluted with 25 µl serum-free medium and
incubated for 5 min at room temperature. Then, 0.25 µl siRNA was
diluted with 25 µl serum-free medium, and the rest of the procedure
was the same as above. After the intervention, cells were
stimulated with 2 or 4 mM MLT. Then, the absorbance at 450 nm using
a Varioskan Flash (Thermo Scientific, Inc.) was continuously
measured 3 times at 24, 48 and 72 h after dosing.
Propidium iodide (PI) staining
Six-well plated MFC cells were stimulated with 2 or
4 mM MLT. The experiment was divided into the same eight groups as
above. Then, the cells were collected at 24, 48 and 72 h after
dosing and stained with propidium iodide (PI; BD Pharmingen; BD
Biosciences). PI staining was performed according to the
manufacturer's instructions. The cells were collected, and the
cells were washed once with PBS, centrifuged at 700 × g for 5 min,
and the cells were resuspended in a staining buffer to adjust the
cell concentration to approximately 106 cells/ml, then
taking 100 µl of the cell suspension and added 2 µl of PI staining
dye. This was mixed gently, place at 4°C for 5 min in the dark,
then the distribution of cells in the three major phases of the
cell cycle (G0/G1 vs. S vs. G2) was determined by flow
cytometry.
Statistical analysis
Results are presented as the mean values ± standard
error of the mean (SEM), the repeated number of trials of all the
experiments was three. ANOVA test was used to compare the
difference in mean between multiple groups. The comparison between
groups was performed by Bonferroni correction. Differences were
considered to be statistically significant at P<0.05. All
analyses were performed using SPSS Statistics (Windows), version
22.0 (IBM Corp.).
Results
Melatonin upregulates the expression
of TGF-β1 in tumor tissue and downregulates expression in the
peripheral serum of gastric cancer-bearing mice
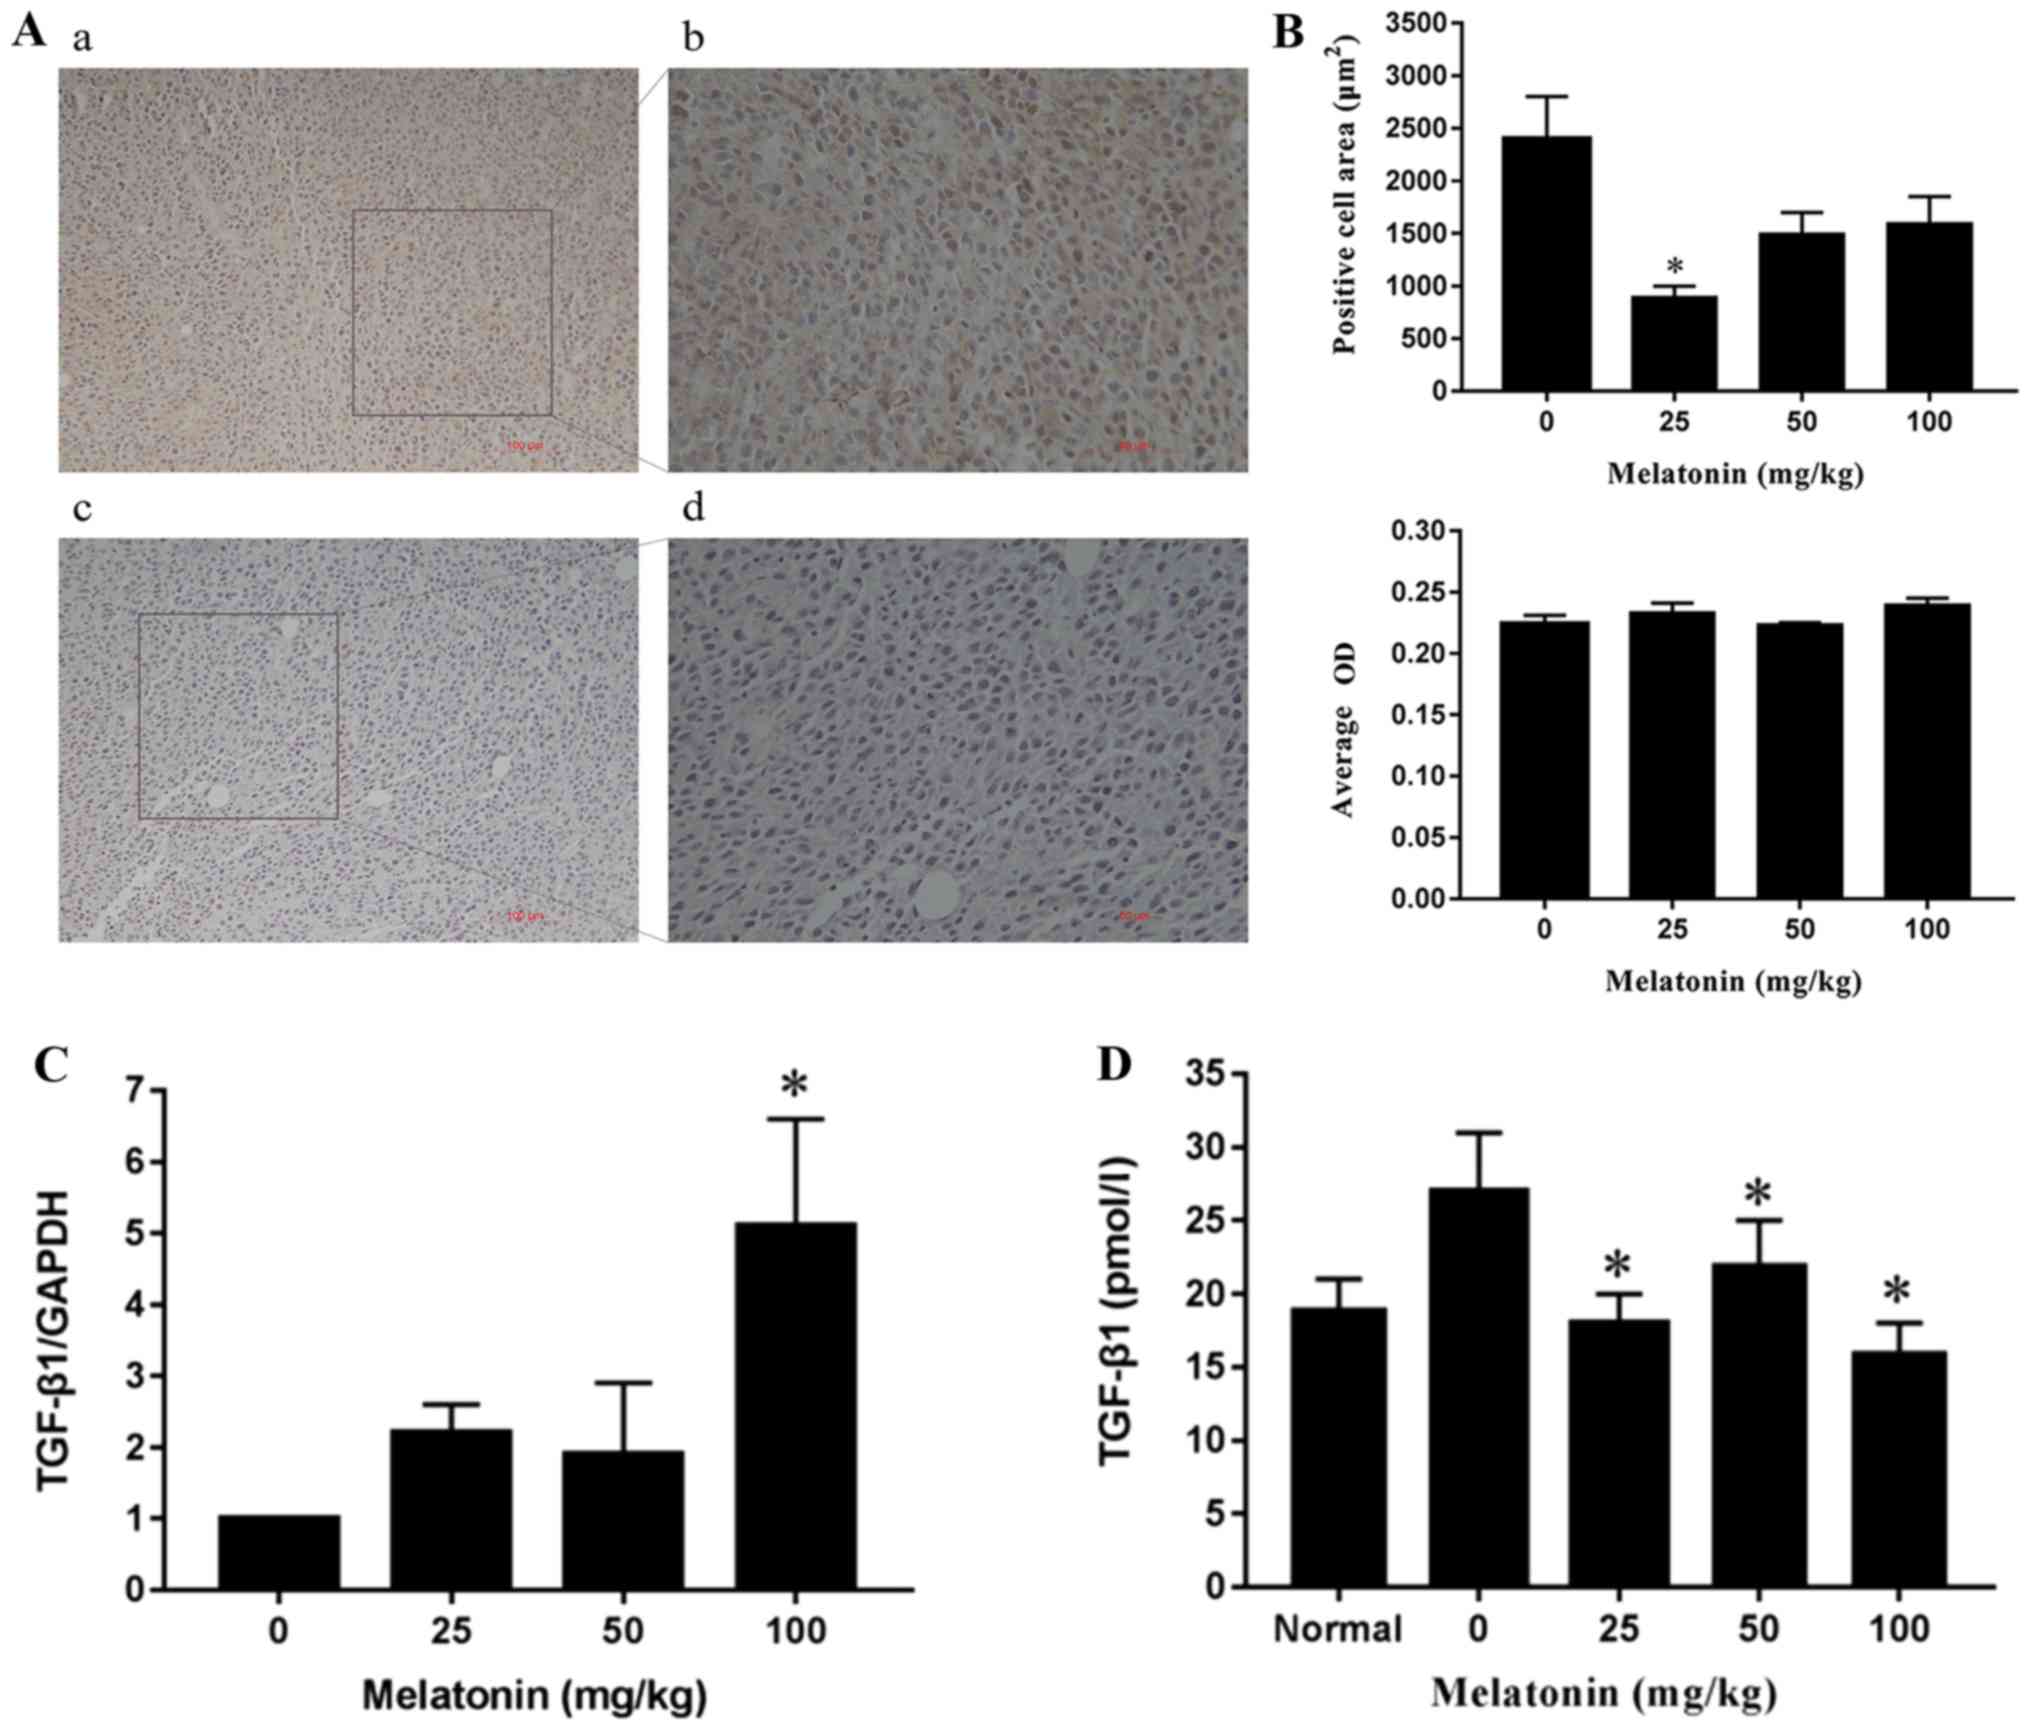
The results showed that TGF-β1 expression was
positive in the tumor tissues (Fig.
1A), while the area consisting of TGF-β1-positive cells did not
differ significantly in the tumor tissues between the medium (50
mg/kg) and high dosage (100 mg/kg) MLT group (Fig. 1B). The average optical density (OD) of
the four groups showed no significant differences (P>0.05,
Fig. 1B). Compared with the negative
control group, the expression of TGF-β1 mRNA in the high dosage
(100 mg/kg) group was significantly increased (P<0.05), but not
in the low (25 mg/kg) and medium dosage (50 mg/kg) groups (Fig. 1C). Furthermore, compared with the
negative control group, TGF-β1 concentration in the peripheral
serum in the low, medium and high dosage MLT groups was
significantly decreased (P<0.05, Fig.
1D).
Melatonin upregulates the expression
of TGF-β1 mRNA in MFC gastric cancer cells and TGF-β1 inhibits MFC
cell proliferation activity
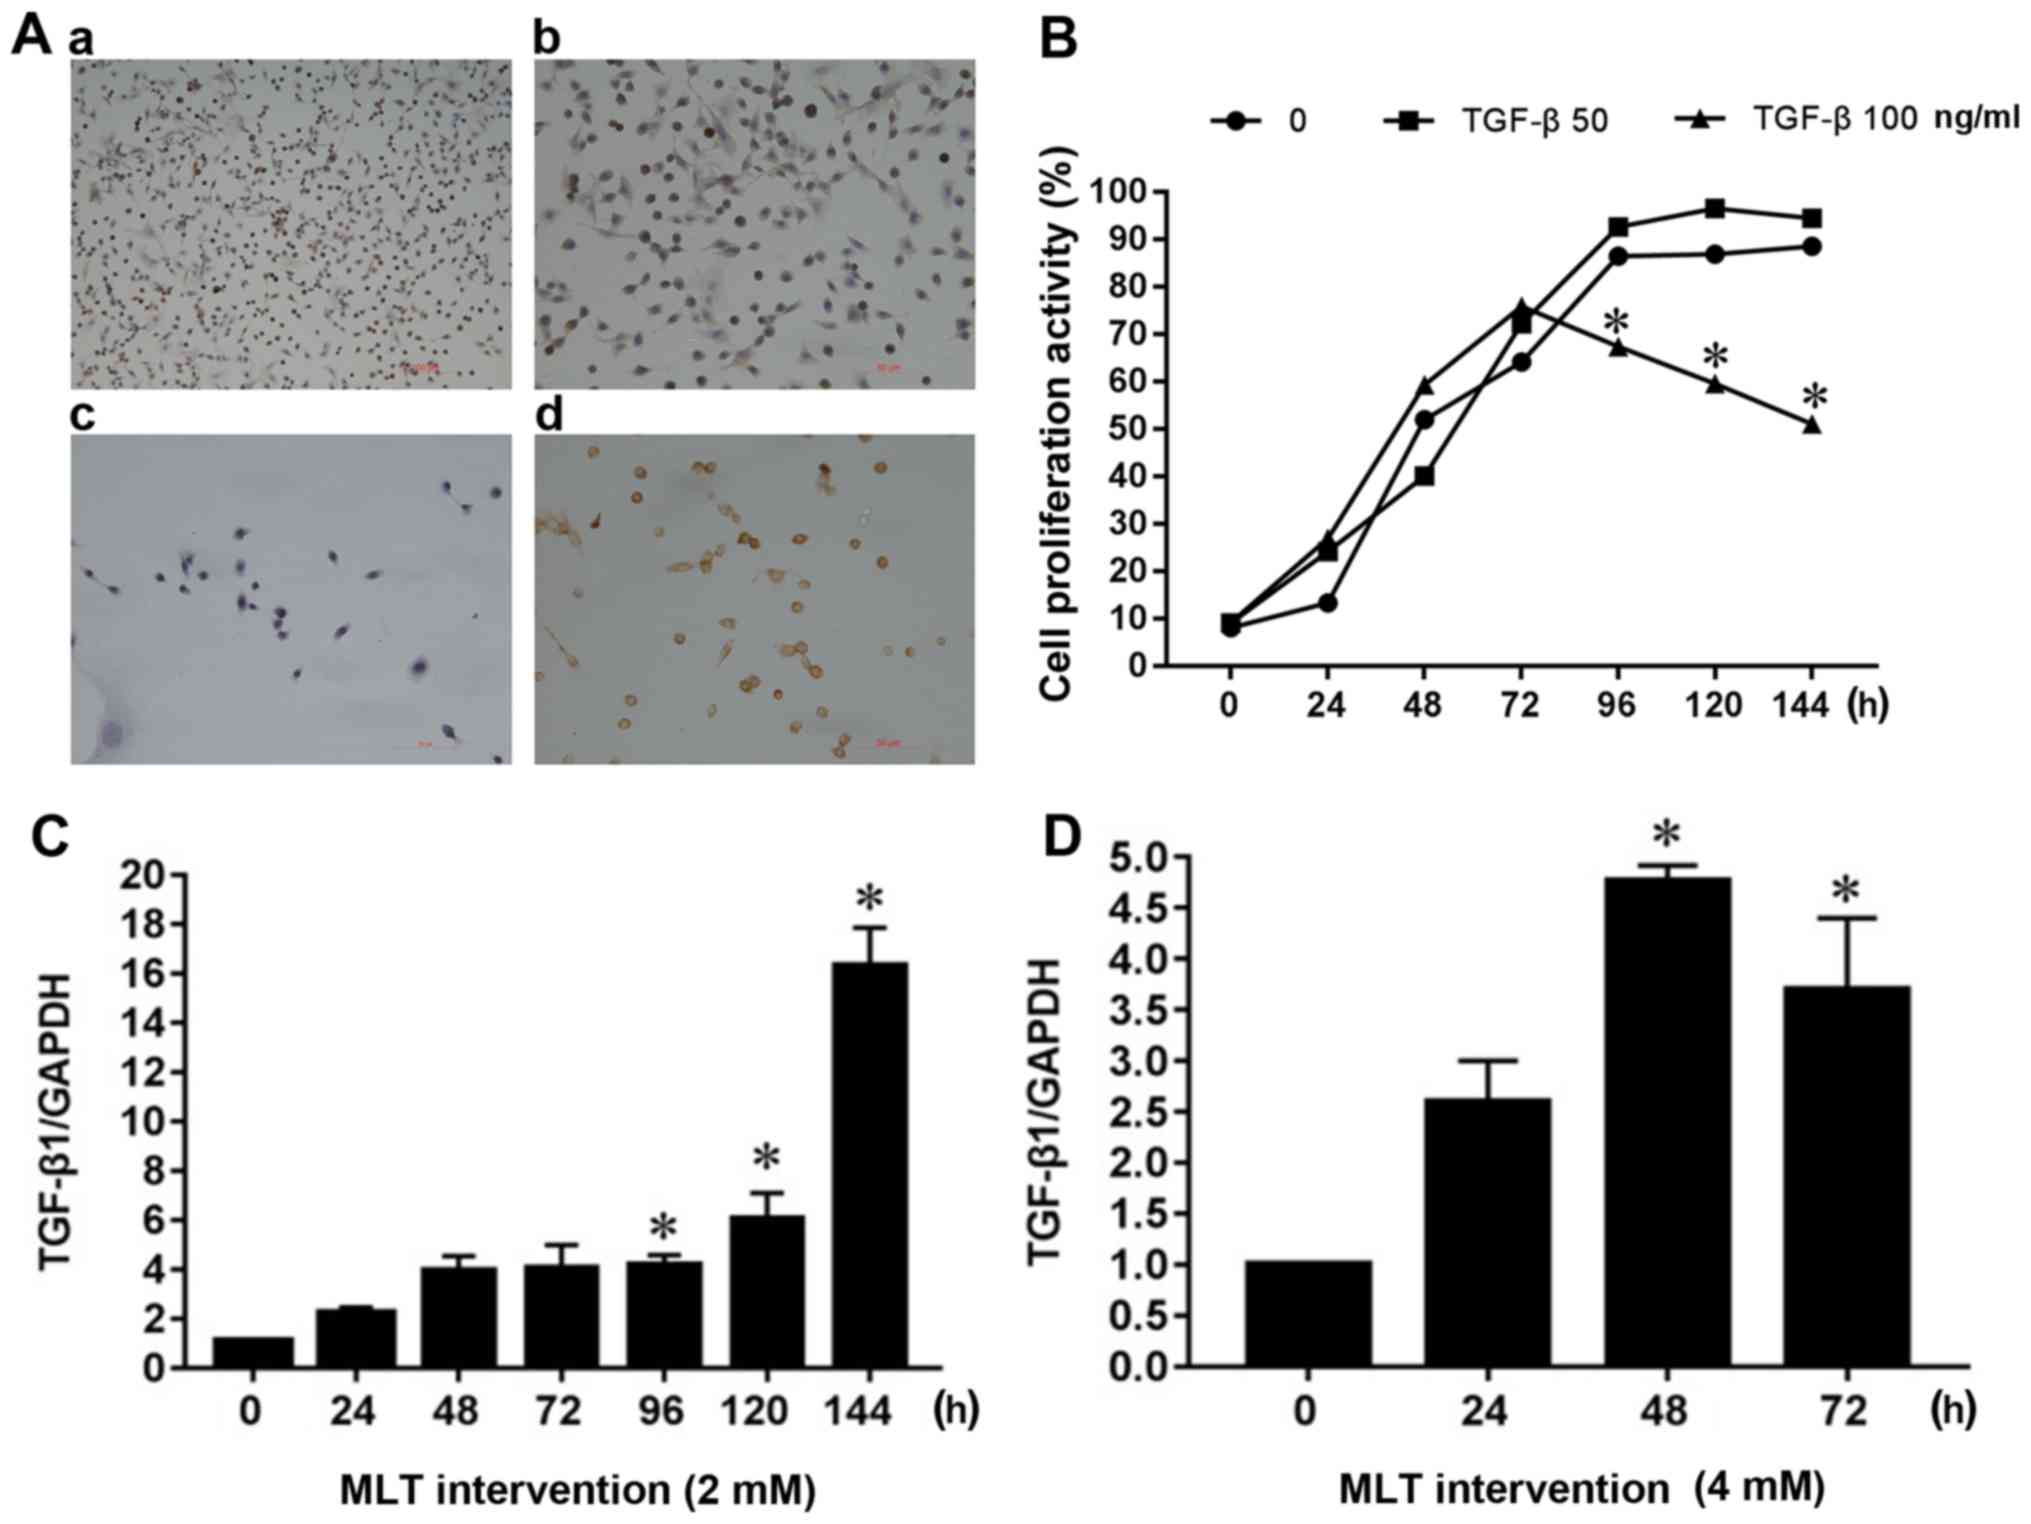
TGF-β1 expression was found to be positive in MFC
cells in vitro (Fig. 2A). In
addition, 50 or 100 ng/ml TGF-β1 protein was added to the cellular
supernatant to explore whether TGF-β1 affects the proliferation
activity of MFC cells. As shown in Fig.
2B, MFC cell growth of the blank control reached a plateau
after 96 h, such that the addition of 50 ng/ml TGF-β1 had no
significant effect on cell proliferation. However, 100 ng/ml TGF-β1
significantly inhibited cell proliferation in a
concentration-dependent manner after 96 h of cell growth. Compared
with the blank control group, the expression of TGF-β1 mRNA was
significantly increased after 96 h of the 2 mM MLT intervention
(Fig. 2C). TGF-β1 mRNA expression did
not change significantly after 24 h of 4 mM MLT intervention, but
after 48 and 72 h, TGF-β1 mRNA expression increased significantly,
peaking after 48 h of MLT intervention (Fig. 2D); a difference that was statistically
significant (P<0.05).
Anti-TGF-β1 neutralizing antibodies
inhibit the toxic effect of melatonin in MFC cells
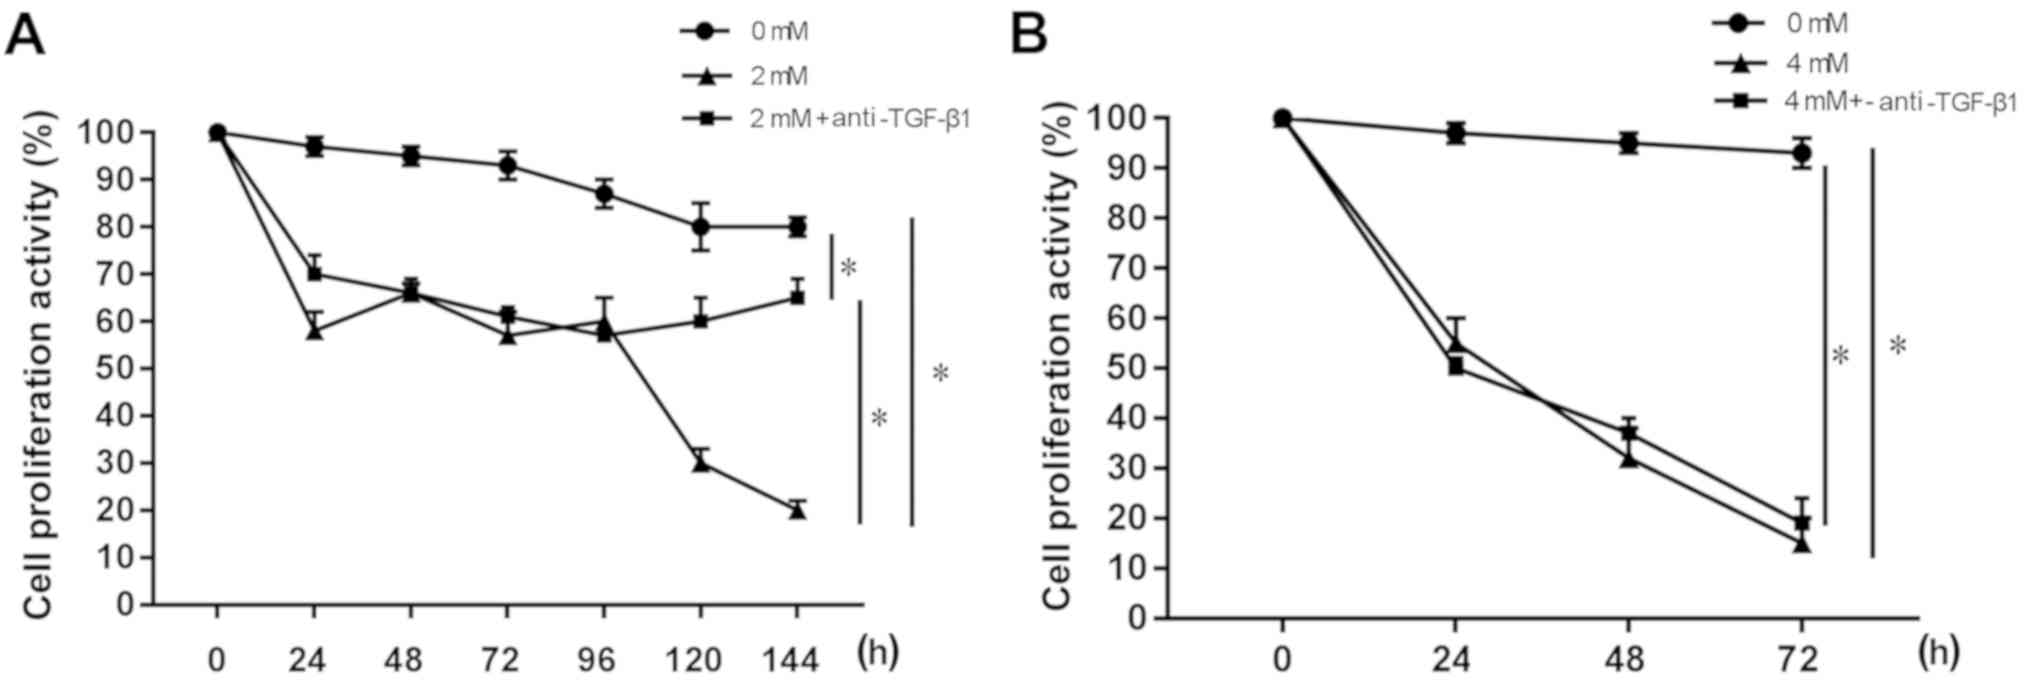
The anti-TGF-β1 neutralizing antibody was found to
block TGF-β1 secretion, thereby inhibiting the toxicity of MLT in
the MFC cells. As shown in Fig. 3A,
compared with the 0 mM MLT blank control group, cell proliferation
activity decreased after 24 h in the 2 mM MLT group and 2 mM MLT +
anti-TGF-β1 group (P<0.05). However, after the addition of the
anti-TGF-β1 neutralizing antibody, the cell proliferation activity
was increased significantly at 120 and 144 h compared with the 2 mM
MLT group (P<0.05). The results of MLT at a concentration of 4
mM are shown in Fig. 3B. Compared
with the 0 mM MLT blank control group, cell proliferation activity
was significantly decreased after 24 h in the 4 mM MLT group and 4
mM MLT + anti-TGF-β1 group (P<0.05), and the effect was
time-dependent. The addition of the anti-TGF-β1 neutralizing
antibody did not affect the toxicity of MLT to MFC cells, and there
were no differences between the two groups.
The melatonin-mediated inhibition of
the proliferation activity of MFC cells was abrogated by blocking
the TGF-β1 signaling pathway
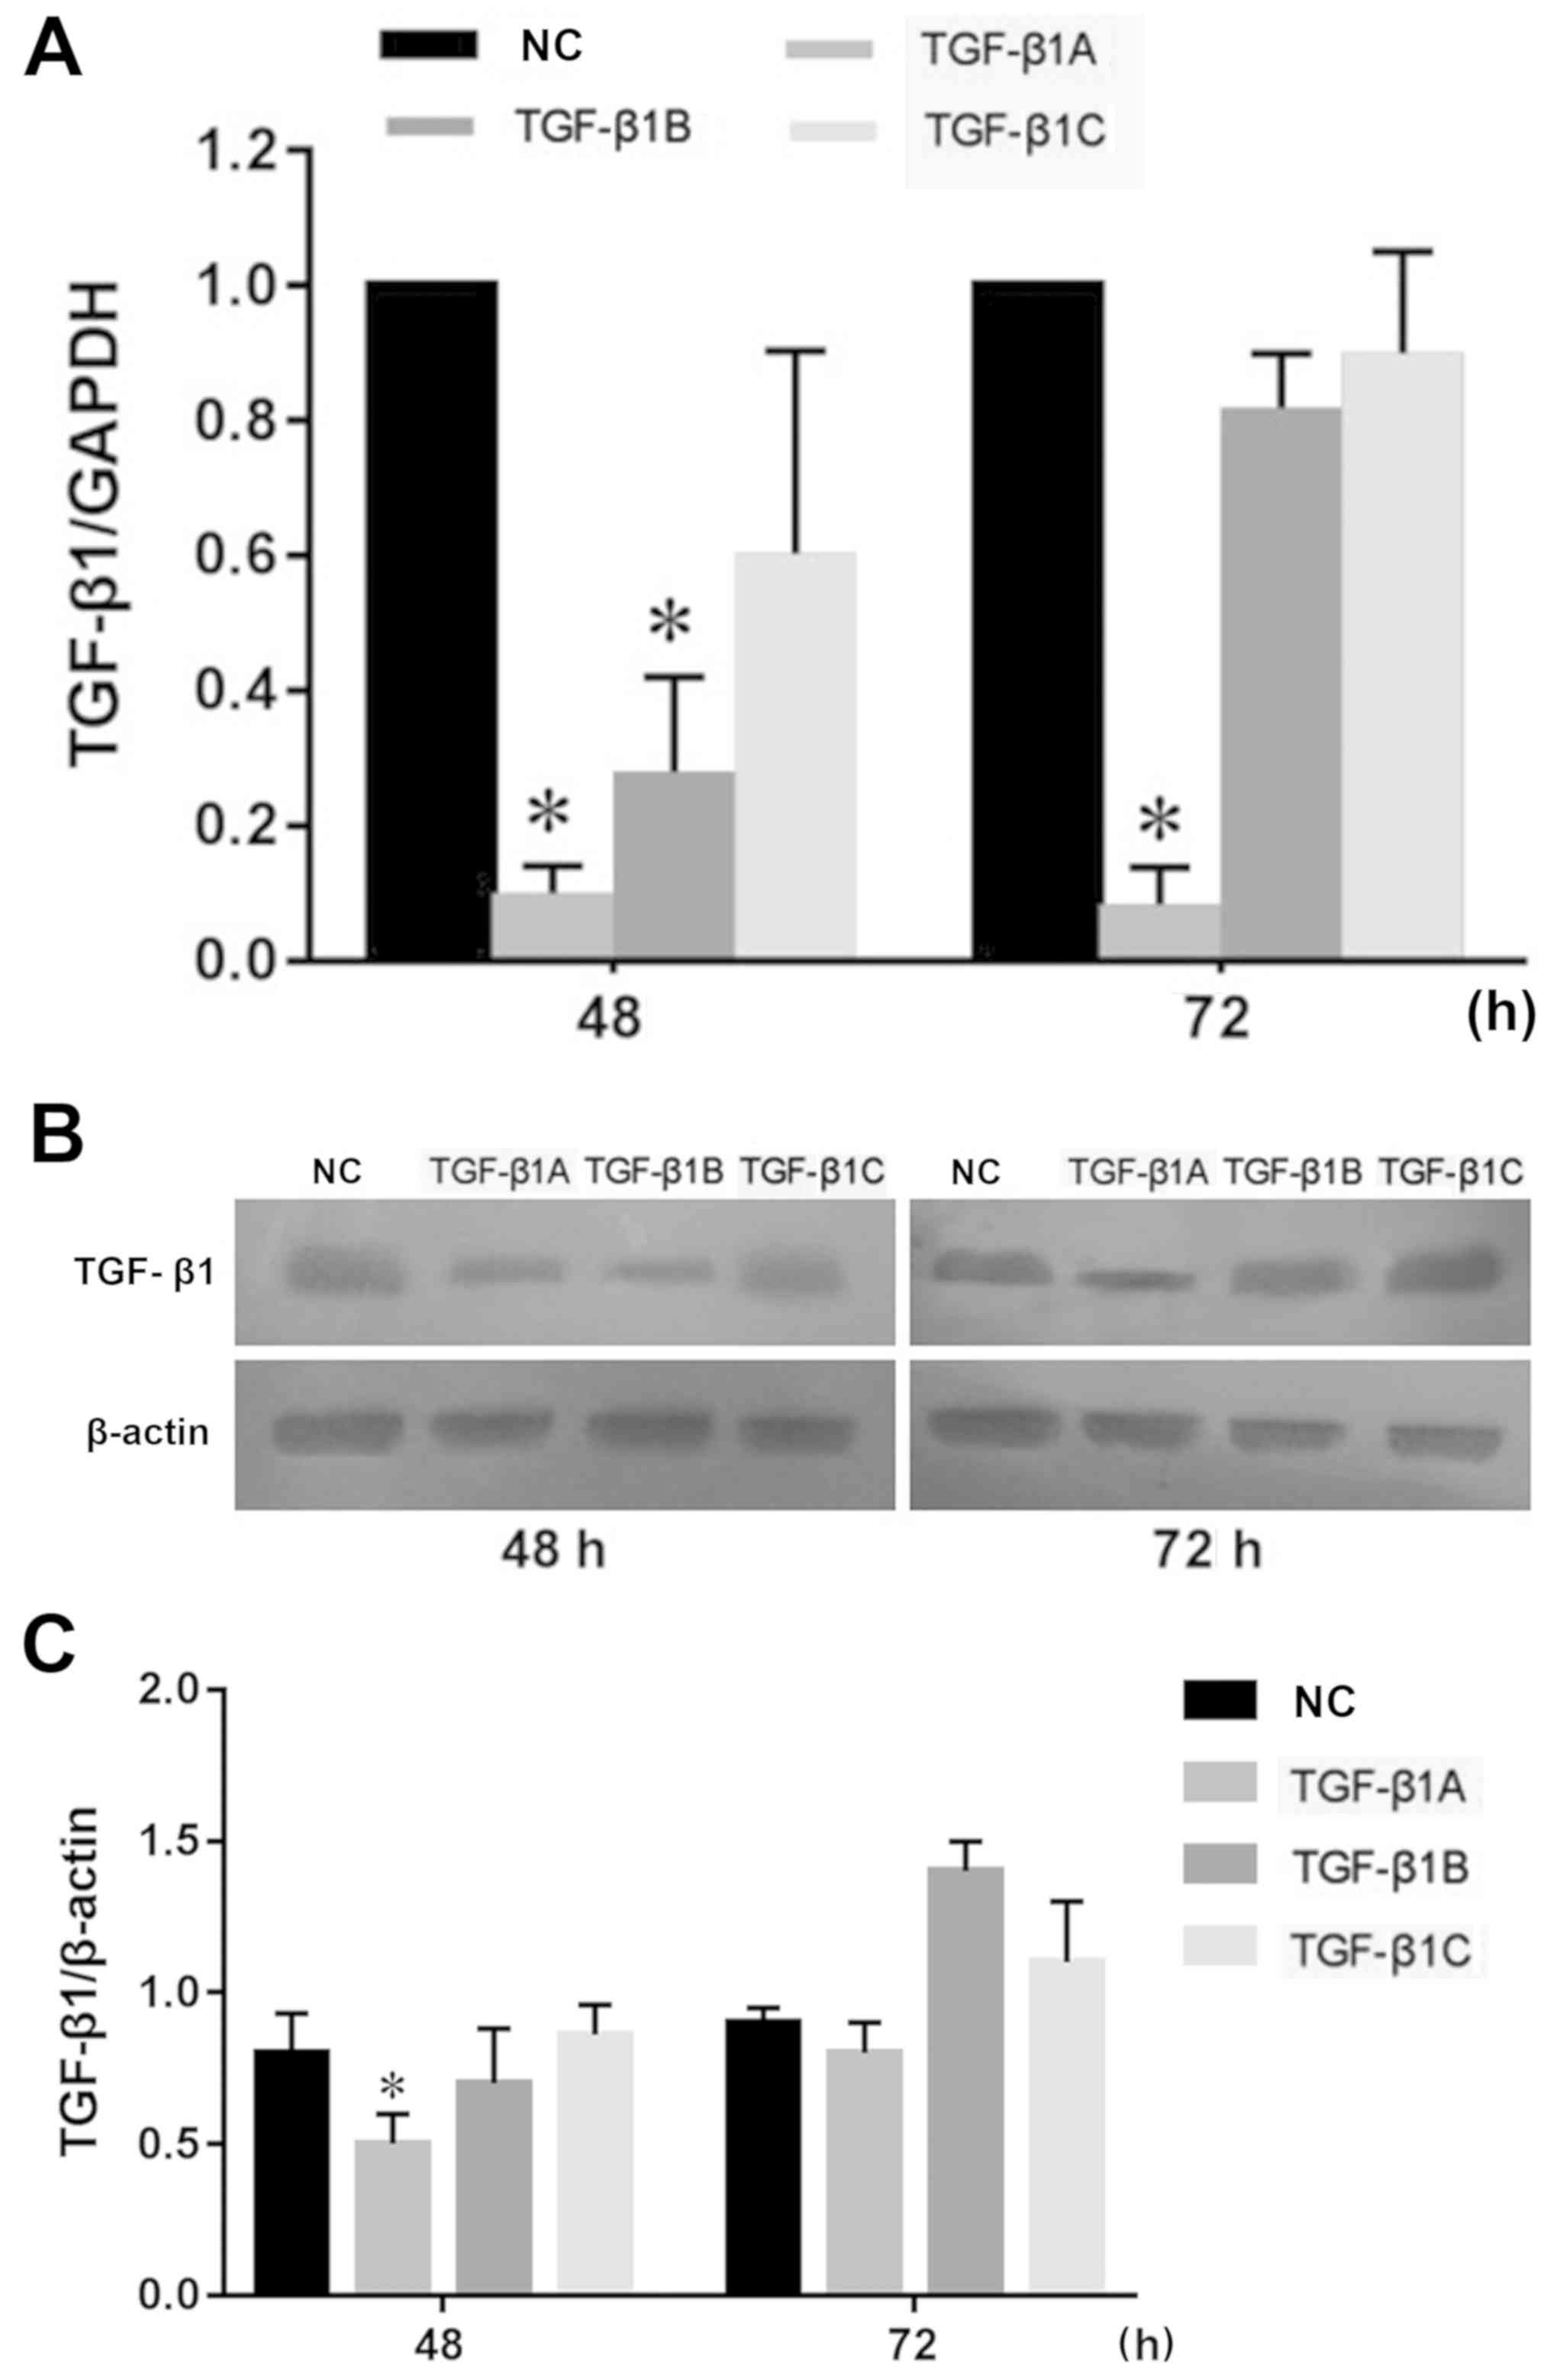
Since TGF-β1 is a secreted protein, in order to
study the effect of partial or complete blockage of the TGF-β1
signaling pathway on MLT-induced MFC cell proliferation, both
siRNA-mediated TGF-β1 silencing and anti-TGF-β1 neutralizing
antibody were used to block the TGF-β1 secretory pathway. The
results (Fig. 4A and C) showed that
the expression of TGF-β1A decreased significantly compared with the
negative control at 48 h in MFC cells, thus the siRNA-TGF-β1A
reagent was selected for subsequent cellular experiments.
Experimental results are shown in Fig.
5. The proliferation activity of the four MFC cell groups [(a1)
2 mM MLT-treated group; (b1) 2 mM MLT + siRNA negative control
group; (c1) 2 mM MLT + siRNA TGF-β1 group; (d1) 2 mM MLT + siRNA
TGF-β1 + anti-TGF-β1 group] were decreased significantly after 24 h
following 2 mM MLT intervention, and the effect was not
time-dependent (Fig. 5A). There was
no significant difference in cell viability between groups a1, b1
and c1, while the cell viability of group d1 (2 mM MLT + siRNA
TGF-β1 + anti-TGF-β1) differed significantly from the other three
groups. After 72 h, the cell proliferation activity of group d1 was
significantly increased (P<0.05). The proliferation activity of
the four MFC cell groups [(a2) 4 mM MLT-treated group; (b2) 4 mM
MLT + siRNA negative control group; (c2) 4 mM MLT + siRNA TGF-β1
group; (d2) 4 mM MLT + siRNA TGF-β1 + anti-TGF-β1 group] were
significantly decreased after 24 h following 4 mM MLT intervention,
and was time-dependent (Fig. 5B).
There was no significant difference in cell viability between
groups a2 and b2 (P>0.05) or between groups c2 and b2
(P>0.05). However, groups d2 and a2 did differ significantly,
and in group a2, the cell proliferation activity was significantly
increased at 48 and 72 h.
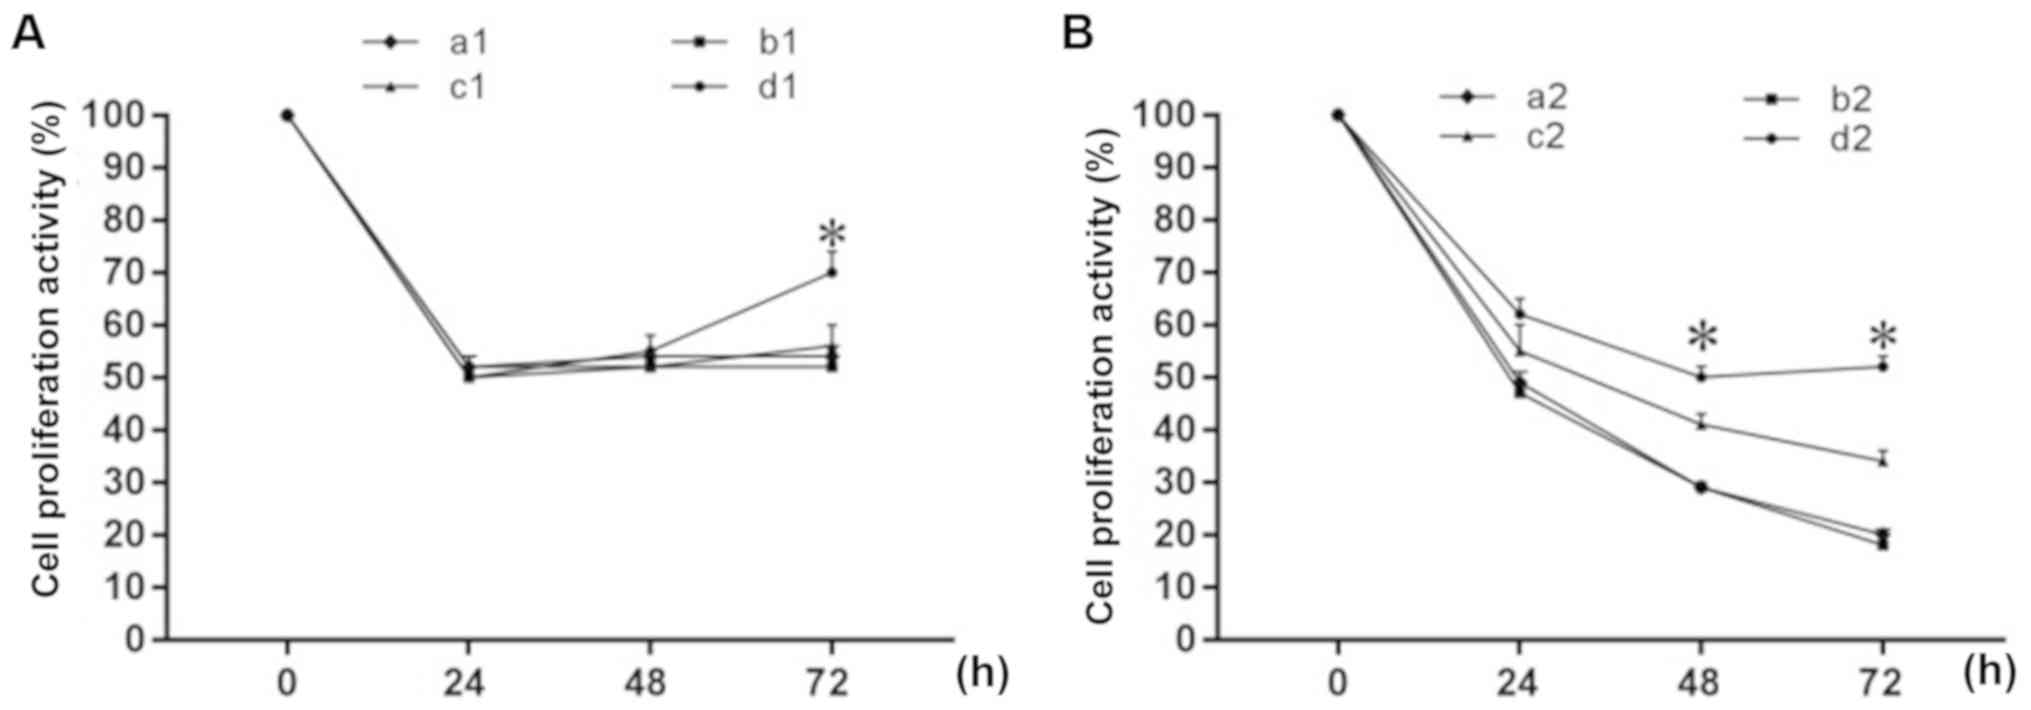 | Figure 5.Effect of MLT on MFC cell
proliferation activity following obstruction of the TGF-β1
signaling pathway. Groups: (A) (a1) 2 mM MLT, (b1) 2 mM MLT + NC,
(c1) 2 mM MLT + siRNA TGF-β1, (d1) 2 mM MLT + siRNA TGF-β1 +
anti-TGF-β1. (B) (a2) 4 mM MLT, (b2) 4 mM MLT + NC, (c2) 4 mM MLT +
siRNA TGF-β1, (d2) 4 mM MLT+ siRNA TGF-β1 + anti-TGF-β1. Percentage
of cell proliferation activity was determined by CCK-8 assay.
*P<0.05 vs. the control group. MLT, melatonin; TGF-β1,
transforming growth factor β1; NC, negative control; siRNA, small
interfering RNA; CCK-8, Cell Counting Kit-8. |
Melatonin-mediated promotion of cell
cycle arrest of the MFC cells was antagonized by blocking the
TGF-β1 signaling pathway
TGF-β1 plays an important regulatory role in cell
growth and differentiation, thus this study investigated the effect
of MLT on the cell cycle of MFC cells when the TGF-β1 signaling
pathway was partially or completely blocked. The results of the
experiment are shown in Fig. 6.
Fig. 6A shows that at an MLT
concentration of 2 mM, at 24, 48 and 72 h time-points,
respectively, compared with group a1 and b1, the percentage of G1
phase cells of the c1 and d1 groups was significantly lower
(P<0.05), and the percentage of S phase cells of the c1 and d1
groups was significantly higher than that of group a1 and b1
control, while the difference in the G2 stage was not significant.
There was no significant difference in the cell cycle distribution
between group a1 and b1 at the same time-point (P>0.05).
Fig. 6B shows that at an MLT
concentration of 4 mM, at the 24 h time-point, the percentage of
cells in the d2 group in S phase was significantly higher than that
of the other three groups, and the percentage of cells in the G1
phase was significantly lower (P<0.05), while the G2 phase was
not significantly different. The effect of MLT on the other three
groups (a2, b2 and c2) was not significantly different at the same
time-point. At the 48 and 72 h time-points, respectively, there
were no significantly differences in the cell cycle distribution
between the four groups at the same time-point.
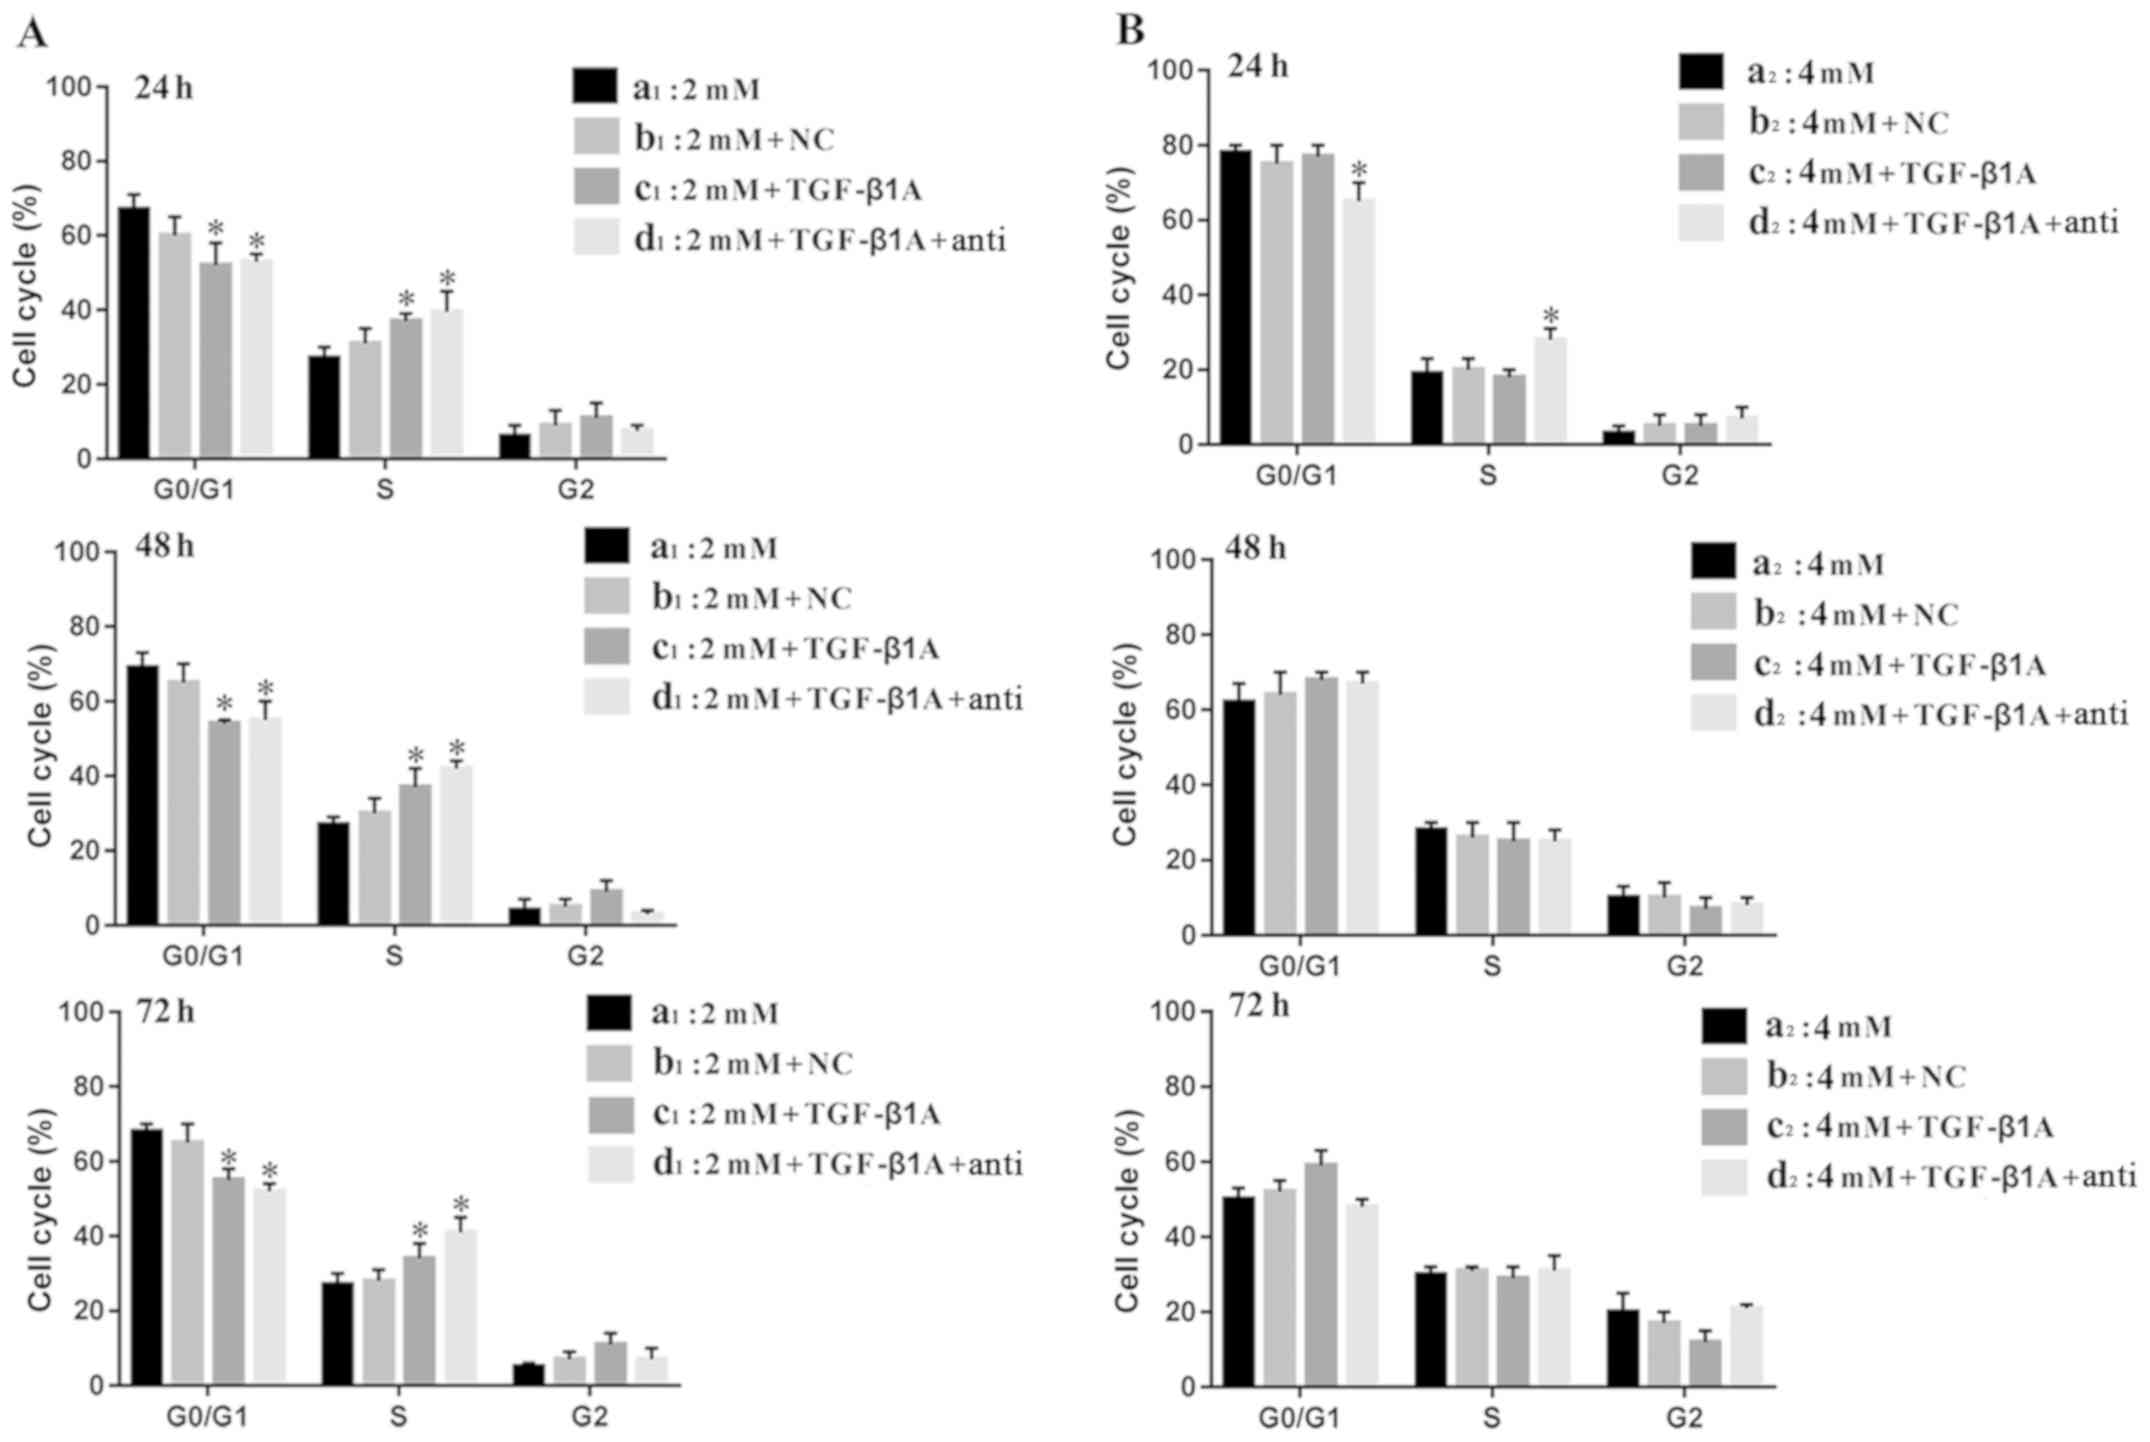 | Figure 6.Effect of MLT on the cell cycle
distribution of MFC cells following obstruction of the TGF-β1
signaling pathway at 24, 48 and 72 h. (A) Groups: (a1) 2 mM MLT,
(b1) 2 mM MLT + NC, (c1) 2 mM MLT + siRNA TGF-β1, (d1) 2 mM MLT +
siRNA TGF-β1 + anti-TGF-β1. (B) Groups: (a2) 4 mM MLT, (b2) 4 mM
MLT + NC, (c2) 4 mM MLT + siRNA TGF-β1, (d2) 4 mM MLT + siRNA
TGF-β1 + anti-TGF-β1. *P<0.05 vs. the control group. MLT,
melatonin; TGF-β1, transforming growth factor β1; NC, negative
control; siRNA, small interfering RNA. |
Discussion
TGF-β is a polypeptide growth factor with various
biological activities, and regulates a number of processes such as
cell proliferation and differentiation, metastasis,
neovascularization, and immunosuppression. Any abnormality in the
TGF-β signaling pathway induces tumor growth. Previous studies
(23,24) have shown that TGF-β1 acts as a tumor
suppressor in the early stages of normal epithelial cell growth and
tumorigenesis, and acts as a tumor promoter during malignant
progression. These different effects may be due to an early immune
response that results in the secretion of a large amount of TGF-β1
to prevent the transformation of normal cells into tumor cells.
However, the loss of TGF-β1 receptor expression or loss of function
at a later stage allows tumor cells to escape the growth inhibition
of TGF-β1, resulting in tumor cell proliferation. Studies have
shown that TGF-β1-induced gastric epithelial-mesenchymal transition
(EMT) can promote the invasion and metastasis of gastric cancer
cells in vitro (25–28).
This study demonstrated that a high concentration of
melatonin (MLT) increases TGF-β1 gene expression in tumor tissue.
The main roles of TGF-β1 in a healthy organism are to inhibit
epithelial-derived cell growth, regulate the immune response, and
suppress immune function. The mouse MFC gastric cancer cell line is
an epithelial-derived cell line. It has been shown that most
epithelial-derived tumors are resistant to TGF-β1-induced cell
growth inhibition, and this occurrence of tolerance is considered
to be an important step in the development of malignant cells. A
high concentration of MLT can increase the secretion of TGF-β1 in
tumor tissue, and as such inhibit normal benign epithelial cells
from transforming into malignant cells, and prevent the invasion
and metastasis of malignant cells (29,30). In
addition, in vivo experiments have shown that the
concentration of TGF-β1 in the serum of mice with gastric cancer is
significantly increased, and administration of MLT reduces it to a
normal level. Other studies have also found that the concentration
of TGF-β1 in serum of patients with early and advanced gastric
cancer is significantly higher than that of healthy controls
(24,31).
In vitro experiments showed that a low
concentration (2 mM) of MLT significantly decreased the
proliferation activity of MFC cells after 96 h of intervention, and
the expression of TGF-β1 mRNA was upregulated, and this effect was
antagonized by anti-TGF-β1 neutralizing antibody. A high
concentration (4 mM) of MLT significantly decreased the
proliferation of MFC cells after only 24 h. After 48 h of
intervention, the expression of TGF-β1 mRNA was upregulated, but it
could not be inhibited by anti-TGF-β1 neutralizing antibody. At the
same time, it was found that the proliferation of gastric cancer
cells was significantly inhibited by adding 100 ng/ml TGF-β1 to the
supernatant of MFC cells for 96 h. Furthermore, anti-TGF-β1
neutralizing antibody was found to inhibit the secretion of TGF-β1
in the supernatant. A prior study also found that MLT inhibited
TGFβ1-induced epithelial-mesenchymal transition in the A549 human
alveolar epithelial cell line (32).
Neutralizing antibodies, especially monoclonal
antibodies, are commonly used to block the secretion of TGF-β1 in
tumor cells. To investigate the role of TGF-β1 in the MLT-mediated
inhibition of the proliferation of gastric cancer cells, we
partially or completely blocked TGF-β1 secretion, and divided cells
into four groups: MLT-treated group, MLT + saline group, MLT +
TGF-β1 siRNA group, and MLT + TGF-β1 siRNA + anti-TGF-β1 group. The
result showed that partial blocking did not antagonize the
inhibition of MLT on the proliferation of gastric cancer cells over
a short period, and the combination of TGF-β1 siRNA and anti-TGF-β1
completely blocked TGF-β1 signaling in MFC cells and restored the
proliferative activity. Wang et al (33) transfected TGF-β1 siRNA into the breast
cancer cell line MDA-231 to inhibit the expression of TGF-β1. The
results showed that the migration, invasion, and angiogenesis of
tumor cells were significantly reduced in vitro. TGF-β1
siRNA/MDA-231 cells treated with 5 ng/ml TGF-β1 for 24 h exhibited
restored tumor cell invasive ability. TGF-β1 treatment did not
increase migration, invasion, or angiogenesis in the TGF-β1
siRNA/MDA-231 cells when treated with 25 µM PD98059 or transfected
with S100A4 siRNA before TGF-β1 treatment, which is similar to our
findings.
The 4 mM MLT-treated group showed a significant
difference after 48 h, while the cell viability of the 2 mM
MLT-treated group recovered within 72 h of dosing. The
proliferative state of cells is related to the cell cycle. The
transition from G1 phase to S phase is an important checkpoint of
cell cycle regulation. A cell that is blocked in G1 phase or G2
phase enters S phase for a prolonged time, resulting in the
inhibition of cell proliferation (34). Therefore, in this study we observed
cell cycle changes and found that siRNA-mediated TGF-β1 silencing
for 24, 48 and 72 h, respectively, significantly increased the S
phase duration of MFC cells inhibited by a low concentration of
MLT, while significantly shortening the G1 phase which resulted in
an increase in cell proliferation. After 24 h of combined
application, the combination of a high concentration of MLT
inhibited the cell cycle, and the population of S phase MFC cells
was significantly increased, and the cell activity was increased.
Similar to previous studies (16),
cell growth was inhibited by MLT treatment in a time-dependent
manner, and MLT effectively blocked human gastric cancer MFC cells
in the G1/S phase of the cell cycle.
In conclusion, MLT inhibits the proliferation of
gastric cancer cells in vitro and in vivo by
increasing the expression of TGF-β. siRNA-mediated TGF-β1 silencing
and anti-TGF-β1 neutralizing antibody completely blocked the TGF-β1
pathway, and significantly antagonized the MLT-mediated inhibition
of the growth and proliferation of gastric cancer cells in a short
period, which increased the cell proliferation activity and
promoted the transition from G1 phase to S phase of gastric cancer
cells, suggesting that TGF-β1 is involved in the regulation of
proliferation of tumor cells. One of the pathways involved in the
MLT-mediated inhibition of gastric cancer cells is the TGF-β1
signaling pathway.
Acknowledgements
Not applicable.
Funding
The present study was supported by the Natural
Science Foundation of Fujian Provincial Department of Science and
Technology (nos. 2017J01530 and 2016J01535); the Key and Guide
Project of Science and Technology Commission of Fujian Province of
China (no. 2018Y0039); the National Natural Sciences Foundation
Projects of China (no. 81302601); the Young and Middle-Aged Key
Personnel Training Program of Fujian Provincial Health and Family
Planning Commission (no. 2016-ZQN-51); the Special Funds for
Education and Scientific Research of Fujian Provincial Department
of Finance (no. 2018B012).
Availability of data and materials
The datasets used during the present study are
available from the corresponding author upon reasonable
request.
Authors' contributions
RXZ was involved in the study concept, design and
supervision and provided final approval of the version to be
published. HL was involved in the drafting of the manuscript, the
analysis and interpretation of the data, performed the experiments
and obtained funding. YZ, HZ and RC were involved in performing the
experiments, the analysis and interpretation of the data. KFW, JS
and RXW assisted with the experimental design, the data
interpretation and acquisition of funding. All authors read and
approved the final manuscript and agree to be accountable for all
aspects of the research in ensuring that the accuracy or integrity
of any part of the work are appropriately investigated and
resolved.
Ethics approval and consent to
participate
All experimental protocols were approved by the
Fujian Medical University Animal Welfare and Ethics Committee
provided approval for this study (FJMUIACUC2018-003), which is
located in Fuzhou, Fujian Province, China.
Patient consent for publication
Not applicable.
Competing interests
The authors state that they have no competing
interests.
References
|
1
|
Torre LA, Bray F, Siegel RL, Ferlay J,
Lortet-Tieulent J and Jemal A: Global cancer statistics, 2012. CA
Cancer J Clin. 65:87–108. 2015. View Article : Google Scholar : PubMed/NCBI
|
|
2
|
Sano T, Coit DG, Kim HH, Roviello F,
Kassab P, Wittekind C, Yamamoto Y and Ohashi Y: Proposal of a new
stage grouping of gastric cancer for TNM classification:
International Gastric Cancer Association staging project. Gastric
Cancer. 20:217–225. 2017. View Article : Google Scholar : PubMed/NCBI
|
|
3
|
Bbenik GA: Localization, physiological
significance and possible clinical implication of gastrointestinal
melatonin. Biol Signals Recept. 10:350–366. 2001. View Article : Google Scholar : PubMed/NCBI
|
|
4
|
Slominski AT, Zmijewski MA, Semak I, Kim
TK, Janjetovic Z, Slominski RM and Zmijewski JW: Melatonin,
mitochondria, and the skin. Cell Mol Life Sci. 74:3913–3925. 2017.
View Article : Google Scholar : PubMed/NCBI
|
|
5
|
Slominski AT, Hardeland R, Zmijewski MA,
Slominski RM, Reiter RJ and Paus R: Melatonin: A cutaneous
perspective on its production, metabolism, and functions. J Invest
Dermatol. 138:490–499. 2018. View Article : Google Scholar : PubMed/NCBI
|
|
6
|
Slominski RM, Reiter RJ,
Schlabritz-Loutsevitch N, Ostrom RS and Slominski AT: Melatonin
membrane receptors in peripheral tissues: Distribution and
functions. Mol Cell Endocrinol. 351:152–166. 2012. View Article : Google Scholar : PubMed/NCBI
|
|
7
|
Li T, Ni L, Zhao Z, Liu X, Lai Z, Di X,
Xie Z, Song X, Wang X, Zhang R and Liu C: Melatonin attenuates
smoking-induced hyperglycemia via preserving insulin secretion and
hepatic glycogen synthesis in rats. J Pineal Res. 64:e124752018.
View Article : Google Scholar : PubMed/NCBI
|
|
8
|
Li Y, Li S, Zhou Y, Meng X, Zhang JJ, Xu
DP and Li HB: Melatonin for the prevention and treatment of cancer.
Oncotarget. 8:39896–39921. 2017.PubMed/NCBI
|
|
9
|
Wei X, Qi Y, Jia N, Zhou Q, Zhang S and
Wang Y: Hyperbaric oxygen treatment sensitizes gastric cancer cells
to melatonin-induced apoptosis through multiple pathways. J Cell
Biochem. 119:6723–6731. 2018. View Article : Google Scholar : PubMed/NCBI
|
|
10
|
Zhang S, Qi Y, Zhang H, He W, Zhou Q, Gui
S and Wang Y: Melatonin inhibits cell growth and migration, but
promotes apoptosis in gastric cancer cell line, SGC7901. Biotech
Histochem. 88:281–289. 2013. View Article : Google Scholar : PubMed/NCBI
|
|
11
|
Ordoñez R, Carbajo-Pescador S,
Prieto-Dominguez N, García-Palomo A, González-Gallego J and Mauriz
JL: Inhibition of matrix metalloproteinase 9 and nuclear factor
kappa B contribute to melatonin prevention of motility and
invasiveness in HepG2 liver cancer cells. J Pineal Res. 56:20–30.
2014. View Article : Google Scholar : PubMed/NCBI
|
|
12
|
Proietti S, Cucina A, Dobrowolny G,
D'Anselmi F, Dinicola S, Masiello MG, Pasqualato A, Palombo A,
Morini V, Reiter RJ and Bizzarri M: Melatonin downregulates MDM2
gene expression and enhances p53 acetylation in MCF-7 cells. J
Pineal Res. 57:120–129. 2014. View Article : Google Scholar : PubMed/NCBI
|
|
13
|
Cutando A, López Valverde A, De Vicente J,
Gimenez JL, Carcía IA and DE Diego RG: Action of melatonin on
squamous cell carcinoma and other tumors of the oral cavity
(Review). Oncol Lett. 7:923–926. 2014. View Article : Google Scholar : PubMed/NCBI
|
|
14
|
Liu H, Xu L, Wei JE, Xie MR, Wang SE and
Zhou RX: Role of CD4+CD25+ regulatory T cells
in melatonin-mediated inhibition of murine gastric cancer cell
growth in vivo and in vitro. Anat Rec (Hoboken). 294:781–788. 2011.
View Article : Google Scholar : PubMed/NCBI
|
|
15
|
Wang RX, Liu H, Xu L, Zhang H and Zhou RX:
Melatonin downregulates nuclear receptor RZR/RORγ expression
causing growth-inhibitory and anti-angiogenesis activity in human
gastric cancer cells in vitro and in vivo. Oncol
Lett. 12:897–903. 2016. View Article : Google Scholar : PubMed/NCBI
|
|
16
|
Song J, Ma SJ, Luo JH, Zhang H, Wang RX,
Liu H, Li L, Zhang ZG and Zhou RX: Melatonin induces the apoptosis
and inhibits the proliferation of human gastric cancer cells via
blockade of the AKT/MDM2 pathway. Oncol Rep. 39:1975–1983.
2018.PubMed/NCBI
|
|
17
|
Liu H, Jiang JH, Xu L, Gong X and Zhou RX:
Proliferation inhibition and apoptosis induction of melatonin in
mouse MFC progastric cells in vitro and in vivo. Chin J Anat.
42:794–799. 2011.
|
|
18
|
Patil AS, Sable RB and Kothari RM: An
update on transforming growth factor-β (TGF-β): Sources, types,
functionsand clinical applicability for cartilage/bone healing. J
Cell Physiol. 226:3094–3103. 2011. View Article : Google Scholar : PubMed/NCBI
|
|
19
|
Pickup M, Novitskiy S and Moses HL: The
roles of TGFβ in the tumour microenvironment. Nat Rev Cancer.
13:788–799. 2013. View
Article : Google Scholar : PubMed/NCBI
|
|
20
|
Proietti S, Cucina A, D'Anselmi F,
Dinicola S, Pasqualato A, Lisi E and Bizzarri M: Melatonin and
vitamin D3 synergistically down-regulate Akt and MDM2 leading to
TGFβ-1-dependent growth inhibition of breast cancer cells. J Pineal
Res. 50:150–158. 2011.PubMed/NCBI
|
|
21
|
Xu L, Liu H, Zhang H, Wang RX, Song J and
Zhou RX: Growth-inhibitory activity of melatonin on murine
foregastric carcinoma cells in vitro and the underlying molecular
mechanism. Anat Rec (Hoboken). 296:914–920. 2013. View Article : Google Scholar : PubMed/NCBI
|
|
22
|
Livak KJ and Schmittgen TD: Analysis of
relative gene expression data using real-time quantitative PCR and
the 2(-Delta Delta C(T)) method. Methods. 25:402–408. 2001.
View Article : Google Scholar : PubMed/NCBI
|
|
23
|
Liang X, Liang X, Zeng J, Wang L, Shen L,
Ma X, Li S, Wu Y, Ma L, Ci X, et al: Histone demethylase RBP2
promotes malignant progression of gastric cancer through
TGF-β1-(p-Smad3)-RBP2-E-cadherin-Smad3 feedback circuit.
Oncotarget. 6:17661–17674. 2015. View Article : Google Scholar : PubMed/NCBI
|
|
24
|
Tas F, Yasasever CT, Karabulut S, Tastekin
D and Duranyildiz D: Serum transforming growth factor-beta1 levels
may have predictive and prognostic roles in patients with gastric
cancer. Tumour Biol. 36:2097–2103. 2015. View Article : Google Scholar : PubMed/NCBI
|
|
25
|
Li C, Song L, Zhang Z, Bai XX, Cui MF and
Ma LJ: MicroRNA-21 promotes TGF-β1-induced epithelial-mesenchymal
transition in gastric cancer through up-regulating PTEN expression.
Oncotarget. 7:66989–67003. 2016.PubMed/NCBI
|
|
26
|
Gen Y, Yasui K, Kitaichi T, Iwai N,
Terasaki K, Dohi O, Hashimoto H, Fukui H, Inada Y, Fukui A, et al:
ASPP2 suppresses invasion and TGF-β1-induced epithelial-mesenchymal
transition by inhibiting Smad7 degradation mediated by E3 ubiquitin
ligase ITCH in gastric cancer. Cancer Lett. 398:52–61. 2017.
View Article : Google Scholar : PubMed/NCBI
|
|
27
|
Zhu J and Wen K: Astragaloside IV inhibits
TGF-β1-induced epithelial- mesenchymal transition through
inhibition of the PI3K/Akt/NF-κB pathway in gastric cancer cells.
Phytother Re. 32:1289–1296. 2018. View
Article : Google Scholar
|
|
28
|
Ma HY, Liu XZ and Liang CM: Inflammatory
microenvironment contributes to epithelial-mesenchymal transition
in gastric cancer. World J Gastroenterol. 22:6619–6628. 2016.
View Article : Google Scholar : PubMed/NCBI
|
|
29
|
Gonzalez-Moreno O, Lecanda J, Green JE,
Segura V, Catena R, Serrano D and Calvo A: VEGF elicits
epithelial-mesenchymal transition (EMT) in prostate intraepithelial
neoplasia (PIN)-like cells via an autocrine loop. Exp Cell Res.
316:554–567. 2010. View Article : Google Scholar : PubMed/NCBI
|
|
30
|
Wu Q, Hou X, Xia J, Qian X, Miele L,
Sarkar FH and Wang Z: Emerging roles of PDGF-D in EMT progression
during tumorigenesis. Cancer Treat Rev. 39:640–646. 2013.
View Article : Google Scholar : PubMed/NCBI
|
|
31
|
Ma GF, Miao Q, Zeng XQ, Luo TC, Ma LL, Liu
YM, Lian JJ, Gao H and Chen SY: Transforming growth factor-β1 and
-β2 in gastric precancer and cancer and roles in tumor-cell
interactions with peripheral blood mononuclear cells in vitro. PLoS
One. 8:e542492013. View Article : Google Scholar : PubMed/NCBI
|
|
32
|
Yu N, Sun YT, Su XM, He M, Dai B and Kang
J: Melatonin attenuates TGFβ1-induced epithelial-mesenchymal
transition in lung alveolar epithelial cells. Mol Med Rep.
14:5567–5572. 2016. View Article : Google Scholar : PubMed/NCBI
|
|
33
|
Wang XG, Meng Q, Qi FM and Yang QF:
Blocking TGF-β inhibits breast cancer cell invasiveness via
ERK/S100A4 signal. Eur Rev Med Pharmacol Sci. 18:3844–3853.
2014.PubMed/NCBI
|
|
34
|
Chatterjee A, Mukhopadhyay S, Tung K,
Patel D and Foster DA: Rapamycin-induced G1 cell cycle arrest
employs both TGF-β and Rb pathways. Cancer Lett. 360:134–140. 2015.
View Article : Google Scholar : PubMed/NCBI
|