Introduction
Hepatocellular carcinoma (HCC) is one of the most
common malignant tumors of the digestive tract. Even after surgical
resection and standardized treatment, the recurrence rate and
metastasis rate of this tumor remain high. Therefore, prognostic
prediction of the clinical outcome of HCC patients is still a
challenge for clinicians (1,2). Although studies have suggested using
different histological parameters to predict the prognosis of liver
cancer cases, the new cancer classification system (3) that uses molecular markers to interpret
the prognosis of liver cancer patients has broad prospects.
lncRNAs play an important role in cancer research as
they are involved in many aspects in the biological activity of
tumors, such as transcription, epigenetic regulation, and mRNA
expression, and are reported to play a suppressive role in breast
as well as other cancers (4,5). They may form pathways by interacting
with miRNAs or mRNAs in human cancers. For example, lncRNA OIP5-AS1
was found to interact with miR-186a to inhibit ZEB1 expression in
HCC which impaired tumor cell metastasis, and lncRNA HOXA-AS2 was
found to suppress endothelium inflammation by regulating the
activity of NF-κB signaling (6,7). In the
present study, lncRNA ZNF385D-AS2 was selected for research. lncRNA
ZNF385D-AS2 may exert a regulatory function in various types of
diseases and could regulate biological activities. Recently, lncRNA
ZNF385D-AS2 has been suggested as a biomarker of novel stage in
colorectal cancer progression although definite research is
limited; however, whether ZNF385D-AS2 could also be a specific
marker in liver cancer remains to be elucidated.
The aim of this study was to identify the
pathological roles of ZNF385D-AS2 in liver cancer. In the present
study, through a retrospective analysis of data from The Cancer
Genome Atlas-Liver Hepatocellular Carcinoma (TCGA-LIHC) cohort and
tissue chip data (GEO-GSE54236), we evaluated the potential
prognostic significance of ZNF385D-AS2 in patients with liver
cancer and assessed the independent prognostic value of ZNF385D-AS2
expression for overall survival of liver cancer patients. Then,
Gene Set Enrichment Analysis (GSEA) was performed to gain further
insight into the biological functions and proteins related to the
ZNF385D-AS2 regulatory mechanism. Co-expression and ceRNA
predictive analysis methods were performed to obtain 59 gene sets
most closely related to ZNF385D-AS2. Finally, we also used tissue
chip data (GEO-GSE54236) to analyze functional enrichment and
enriched ZNF385D-AS2 targets for consistent upregulated and
downregulated gene sets, using Circos plots to reveal them.
Materials and methods
Data acquisition and collection
The data of liver cancer patients and RNA-seq
expression results were downloaded with RTCGA Toolbox package in R
(version 3.5.3) (8). The gene
microarray with cancer tissue data (GSE54236) (9,10) was
downloaded from the GEO database (https://www.ncbi.nlm.nih.gov/geo/) (11).
Statistical analyses
SPSS software 23.0 (IBM Corporation, Armonk, NY,
USA) was used for data analysis. Boxplots were used for discrete
variables to measure the expression differences, and Chi-square
tests were used to examine the correlation between ZNF385D-AS2
expression and clinical data (12).
Receiver-operating characteristic curve (ROC) was drawn by ‘p-ROC
package’ to evaluate the capability of diagnosis. We divided
patients into high and low ZNF385D-AS2 expression groups using the
optimal cutoff value of overall survival (OS) as determined by the
Youden index. Kaplan-Meier curves were used to compare the
differences in the OS and relapse-free survival (RFS) by using
survival package in R (13).
Univariate Cox analysis was used to select the related variables.
Then, multivariate Cox analysis was applied for the influence of
ZNF385D-AS2 expression on OS and RFS of the patients (14).
Gene set enrichment analysis
(GSEA)
GSEA is a computational method that determines
whether an a priori defined set of genes shows statistically
significant concordant differences between two biological states.
In this study, GSEA was performed by using GSEA software 3.0 from
the Broad Institute (UC San Diego, San Diego, CA, USA) (http://software.broadinstitute.org/gsea/index.jsp)
(15). The gene expression data were
RNA-seq data from TCGA-LIHC and GEO database. The gene set of ‘c2.
cp.biocarta.v6.2.symbols.gmt’, ‘c3. cp.biocarta.v6.2.symbols.gmt’,
‘c5.cp.biocarta.v6.2.symbols. gmt’ and ‘h.all.v6.2.symbols.gmt’,
which summarizes and represents specific, well-defined biological
states or processes, was downloaded from the Molecular Signatures
Database (http://software.broadinstitute.org/gsea/msigdb/index.jsp)
(15). The normalized enrichment
score (NES) was acquired by analyzing with permutations for 1,000
times. A gene set was considered to be significantly enriched at a
normal P-value <0.05 and false discovery rate (FDR)
<0.25.
Gene enrichment and functional
annotation evaluation
The Database for Annotation, Visualization, and
Integrated Discovery (DAVID; http://david.abcc.ncifcrf.gov/) and KO-Based
Annotation System (KOBAS) (http://kobas.cbi.pku.edu.cn/) were used to conduct
relevant pathway analysis (16,17), and
Gene Ontology (GO) analysis was performed for the functional
annotation of the predicted genes (17). Three GO terms [biological process
(BP), cellular component (CC) and molecular function (MF)] were
utilized to identify the enrichment of target genes. In addition,
Kyoto Encyclopedia of Genes and Genomes (KEGG) pathway analysis was
performed for the functional annotation of these genes. GO terms
and KEGG pathway with P-values <0.05 were considered
statistically significant. The enrichment map of annotation
analysis was drawn using Cytoscape (version 3.3.1) (http://www.cytoscape.org/cy3.html) and R (version
3.5.3).
Co-expression genes and ceRNA pattern
predictive analysis
In order to analyze the specific functions of lncRNA
ZNF385D-AS2, it was necessary to analyze the interaction between
lncRNAs and the coding genes as well as the interacting miRNAs
(18). Based on data from the
TCGA-LIHC and GEO (GSE54236) databases, using the Pearson and
Spearman correlation analysis based on the Logistic function
(‘WGCNA’ package in R), the co-expression relationship between
ZNF385D-AS2 and the coding genes and miRNAs were identified, and
the co-expression network between ZNF385D-AS2 and the coding genes
and miRNAs were mapped in Cytoscape. At the same time, comparative
analysis of several lncRNA databases, such as NONCODE (http://www.noncode.org/), LncRBase (http://starbase.sysu.edu.cn/), Co-LncRNA (http://www.biobigdata.com/Co-LncRNA/),
was carried out to identify the miRNAs that exhibited regulatory
relationships with ZNF385D-AS2 and mRNAs which these miRNAs may
regulate. After comparing the data from the TCGA and GEO databases,
the possible ceRNA patterns in HCC were predicted and plotted which
were also mapped in Cytoscape. Circos plots was generated based on
the remappings from these two predicted results. Circos plots were
generated using the Circos visualization tool in R (‘RCircos’
package in R) (19).
Results
Patient characteristics
Both gene expression and clinical data of patients
with liver cancer were downloaded from The Cancer Genome Atlas
(TCGA-LIHC) database (9,10). The total number of patients was 427.
After initial screening, we omitted 13 normal samples and 74 tumor
samples with missing or unclear information, and the remaining 303
tumor samples and 37 normal samples were available. The detailed
clinical characteristics, including age, sex, TNM stage, survival
status, pathological status, and ethnic compositions are shown in
Table I.
 | Table I.Demographic and clinical
characteristics of the The Cancer Genome Atlas-Liver Hepatocellular
Carcinoma (TCGA-LIHC) cohort (N=303). |
Table I.
Demographic and clinical
characteristics of the The Cancer Genome Atlas-Liver Hepatocellular
Carcinoma (TCGA-LIHC) cohort (N=303).
| Characteristics | Number of samples, n
(%) |
|---|
| Age (years) | n | Percentage (%) |
| ≤55 | 107 | 35.31 |
|
>55 | 196 | 64.69 |
| Sex |
|
|
|
Female | 92 | 30.36 |
| Male | 211 | 69.64 |
| T stage |
|
|
| T1 | 153 | 50.50 |
| T2 | 76 | 25.08 |
| T3 | 63 | 20.79 |
| T4 | 10 | 3.30 |
| Unknown | 1 | 0.33 |
| M stage |
|
|
| M0 | 229 | 75.78 |
| M1 | 3 | 0.99 |
| Mx | 71 | 23.43 |
| N stage |
|
|
| N0 | 220 | 72.61 |
| N1 | 3 | 0.99 |
| Nx | 80 | 26.40 |
| Stage |
|
|
| I | 153 | 50.50 |
| II | 74 | 24.42 |
|
III | 72 | 23.76 |
| IV | 4 | 1.32 |
| Histologic
grade |
|
|
| G1 | 42 | 13.86 |
| G2 | 144 | 47.52 |
| G3 | 105 | 34.65 |
| G4 | 12 | 3.96 |
| Vital status |
|
|
|
Living | 217 | 71.62 |
|
Deceased | 86 | 28.38 |
| Race |
|
|
|
Asian | 150 | 49.50 |
|
Black | 8 | 2.64 |
|
Caucasian | 139 | 45.87 |
|
Unknown | 6 | 1.98 |
| ZNF385D-AS2
expression |
|
|
|
Low | 184 | 60.73 |
|
High | 119 | 39.27 |
| Total | 303 | 100 |
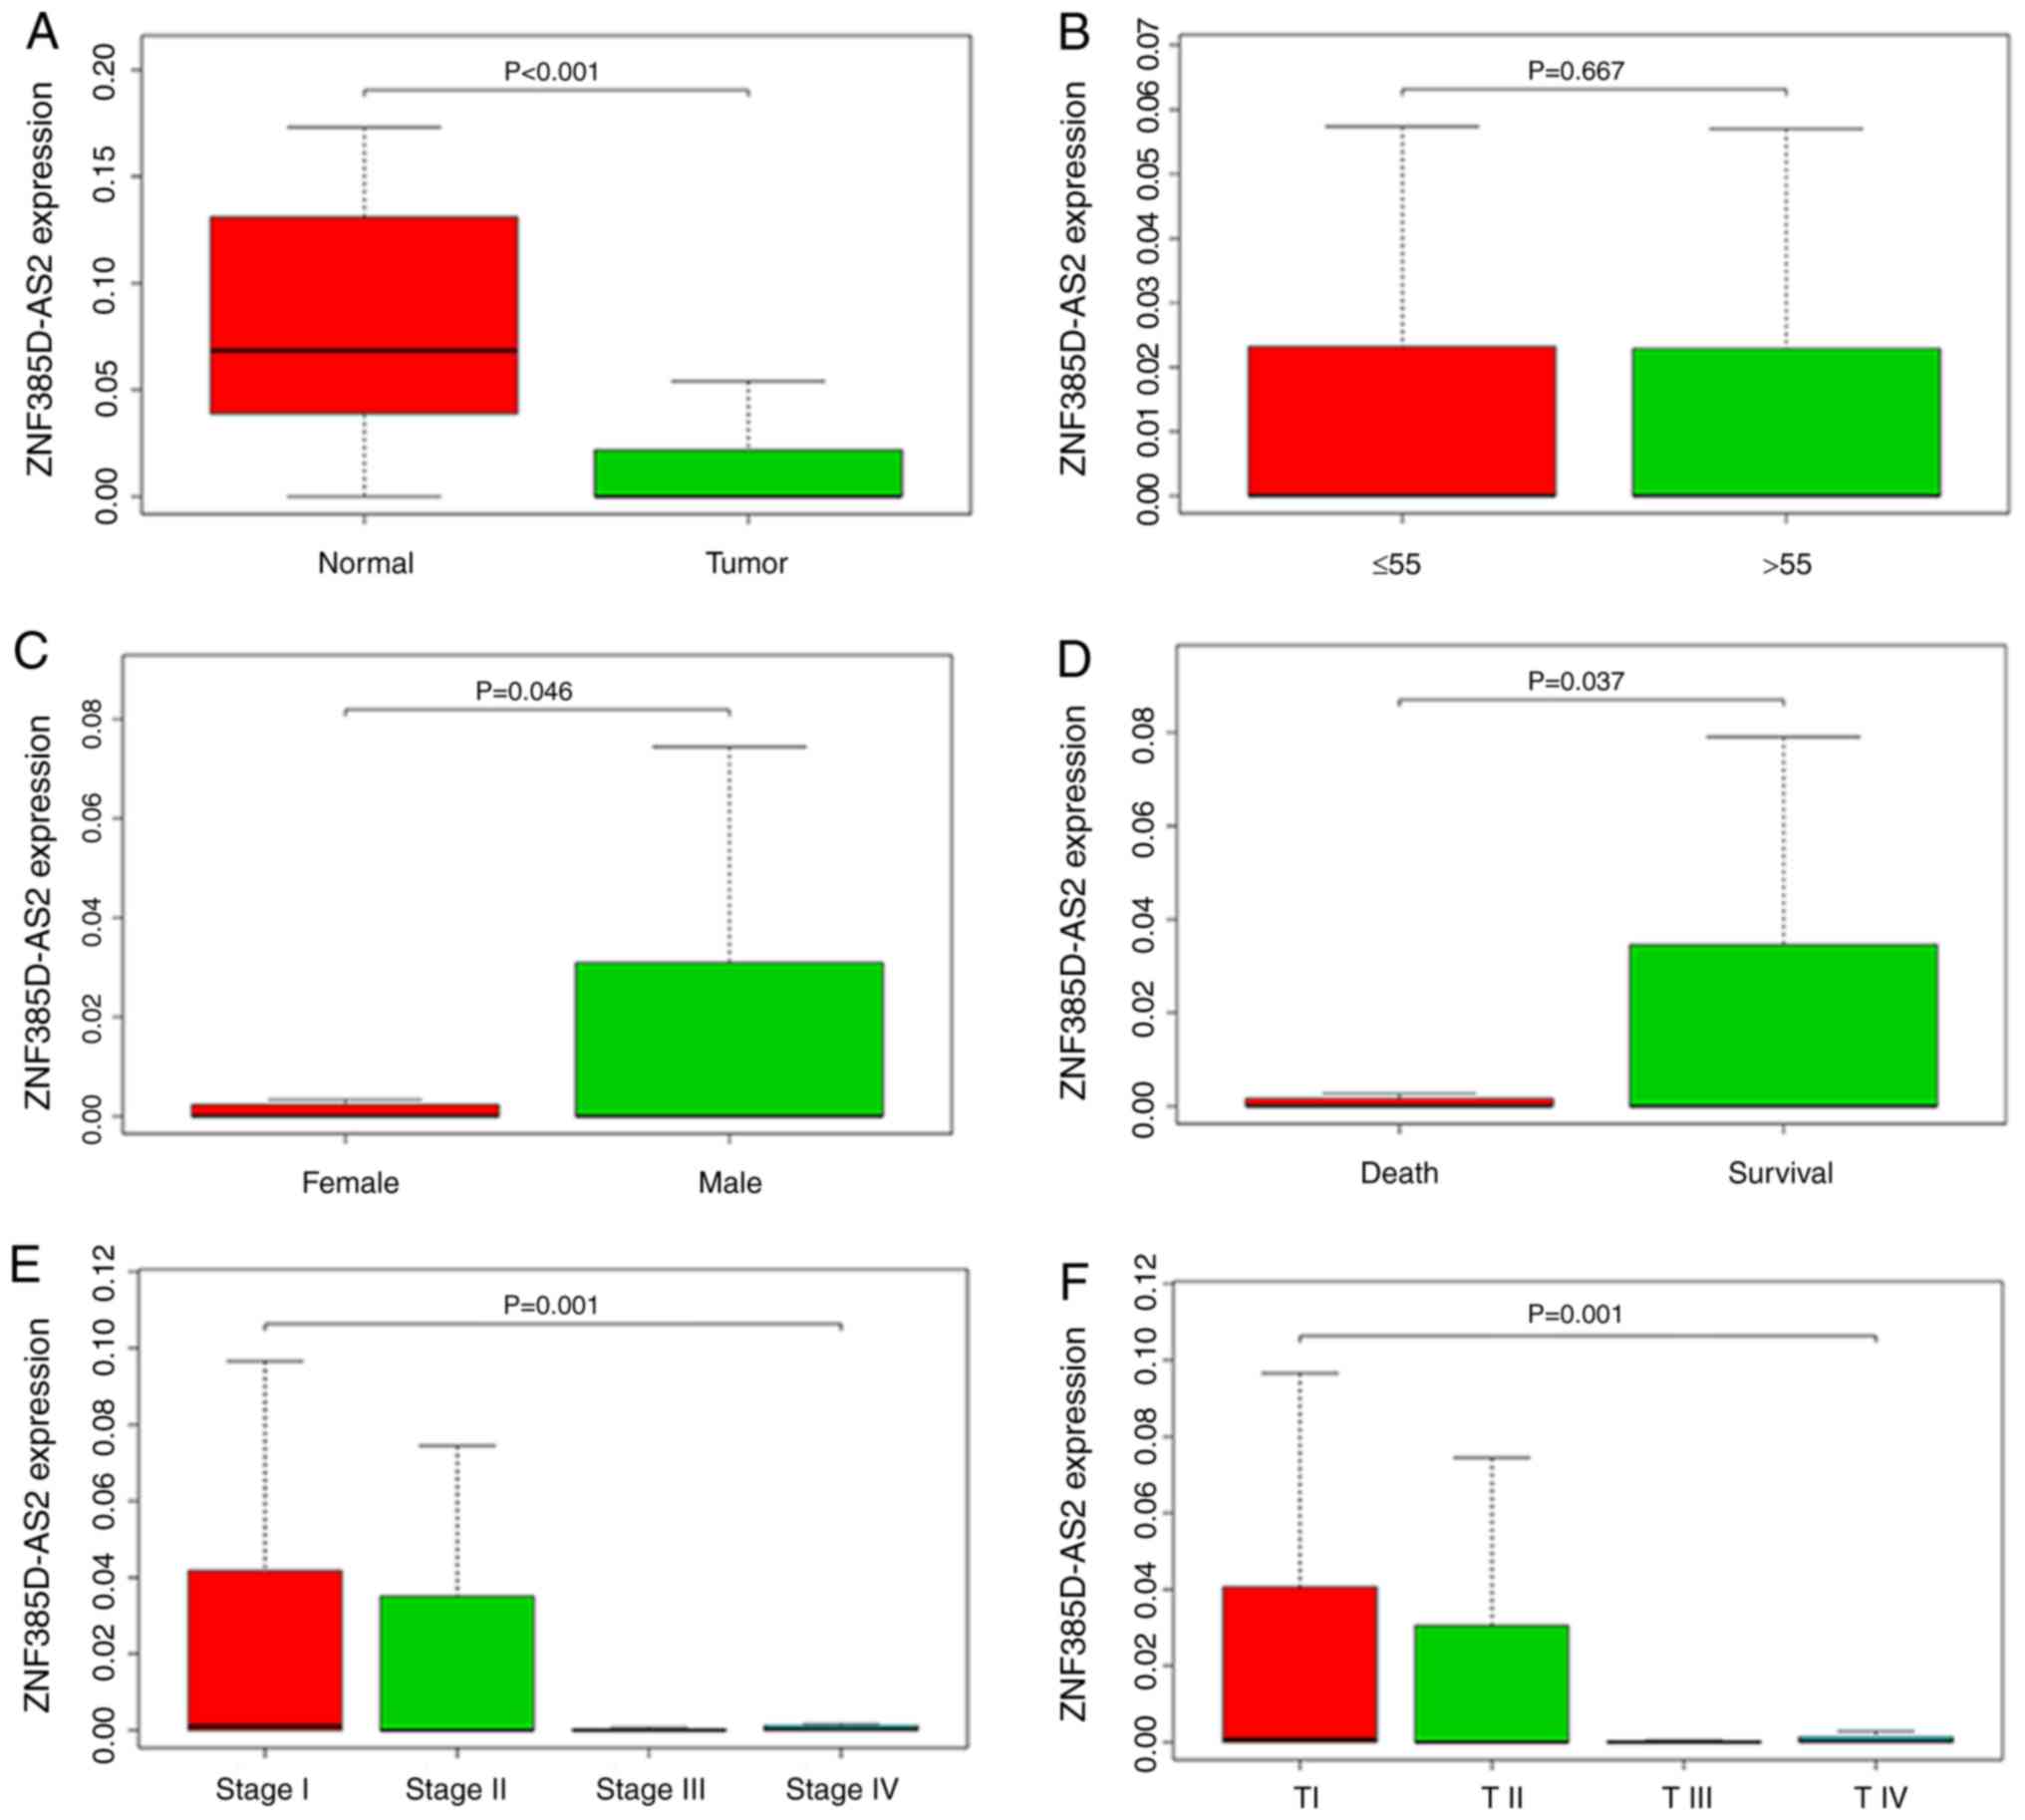
Low expression of lncRNA ZNF385D-AS2
in HCC
Using boxplots, we measured the differences in
ZNF385D-AS2 expression in liver cancer patients and control
subjects. As shown in Fig. 1A, we
evaluated the overall expression trend of ZNF385D-AS2 in liver
cancer, then found that ZNF385D-AS2 expression was significantly
lower in primary HCC tissues than that in normal liver tissues
(P<0.001). Moreover, as shown in Fig.
1A-K, there was differential ZNF385D-AS2 expression in the
groups according to sex (P=0.046; Fig
1C), vital status (P=0.037; Fig.
1D), clinical stage (P=0.001; Fig.
1E), T stage (P=0.001; Fig. 1F)
and survival time (P=0.033; Fig. 1K).
Of note, differences in ZNF385D-AS2 expression were observed
according to patient age as well as the TNM stage of cancer, and
clinicopathological parameters (Fig.
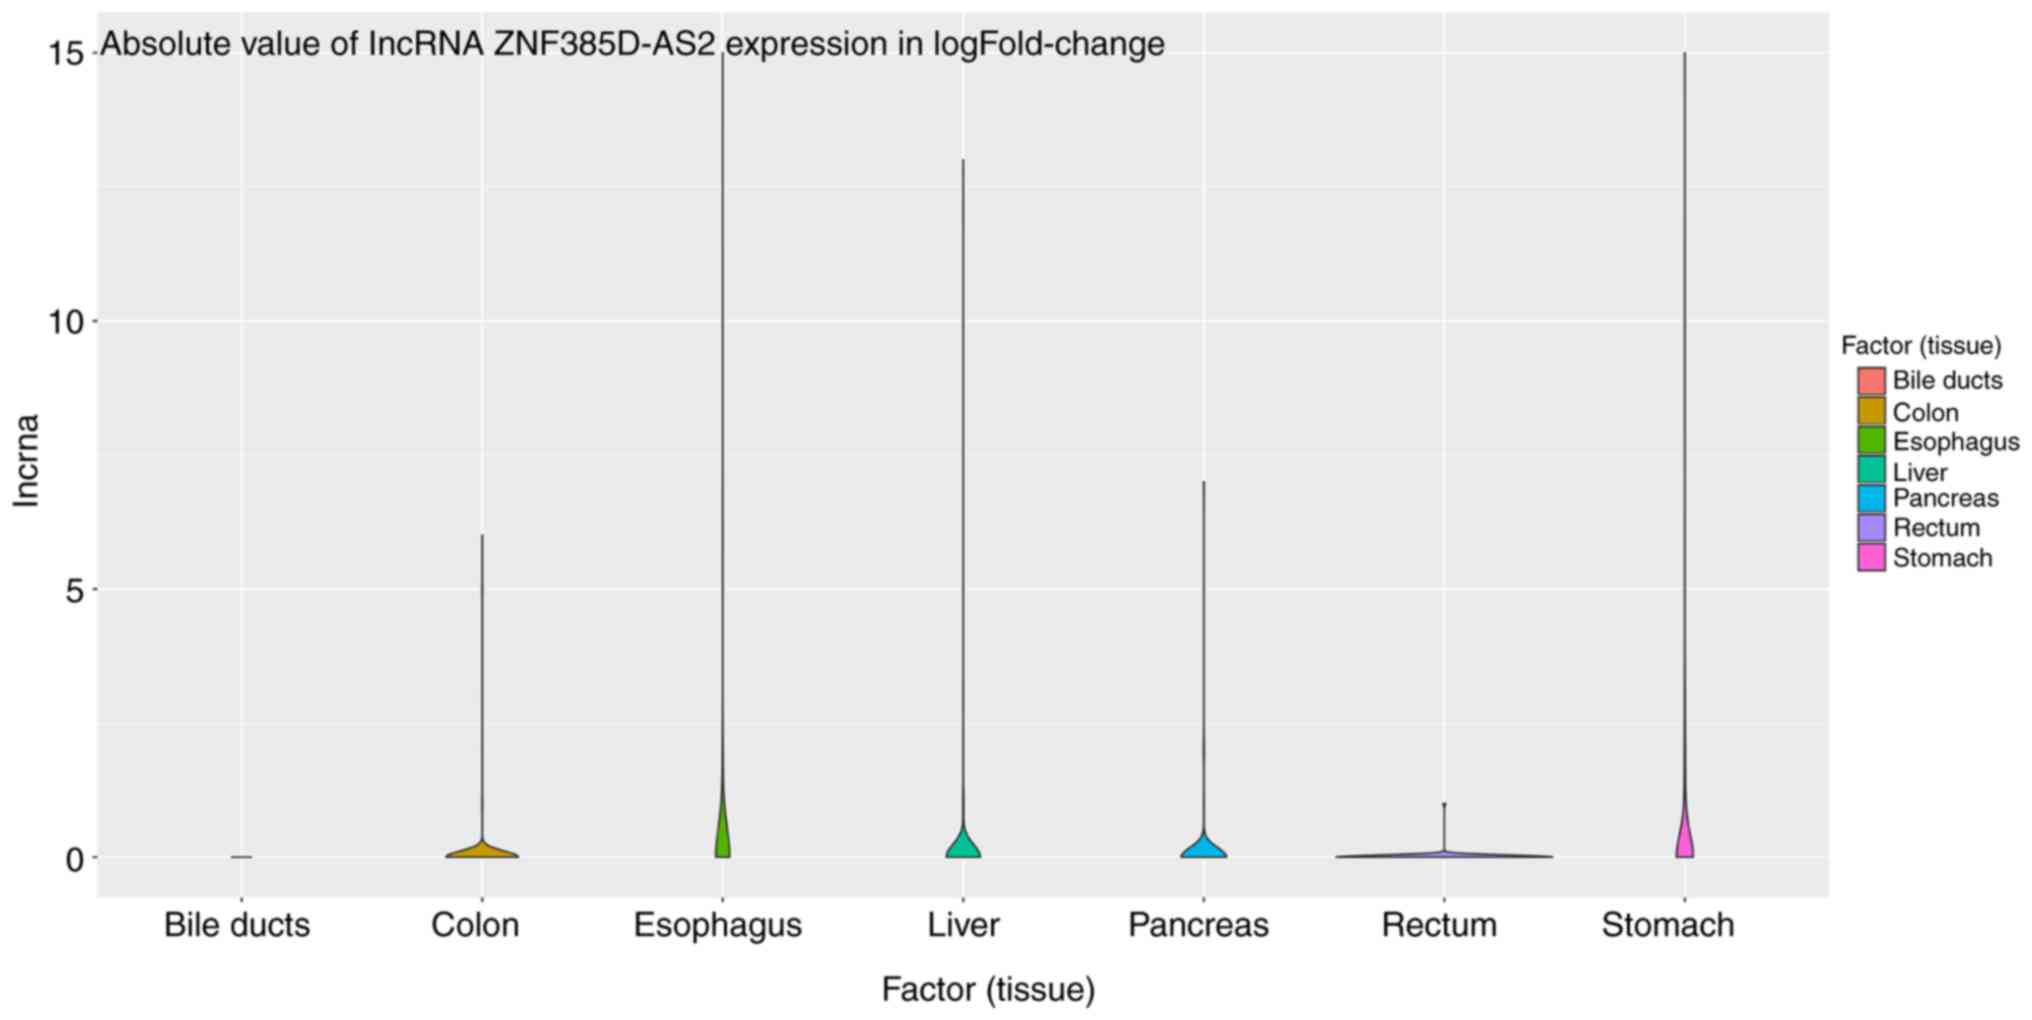
1). We also collected data on the expression of ZNF385D-AS2 in
several common digestive tumors based on TCGA database. After
horizontal comparison, we found that except for cholangiocarcinoma
and rectal cancer, the expression of ZNF385D-AS2 was reduced in
most digestive system tumors (Fig.
2).
Correlation between ZNF385D-AS2
expression and clinical features of the HCC samples
According to Chi-square tests, the correlation
between the clinical features and the expression of ZNF385D-AS2 was
analyzed and is documented in Table
II. The expression of ZNF385D-AS2 was highly associated with
sex (χ2=3.846, P=0.050), T stage (χ2=3.875,
P=0.049), M stage (χ2=4.221, P=0.040), N stage (Fisher's
exact text, P<0.001) and clinical stage (χ2=4.365,
P=0.037).
| Table II.Correlation of lncRNA ZNF385D-AS2
expression in HCC tissues and clinicopathologic variables of the
HCC samples (N=303). |
Table II.
Correlation of lncRNA ZNF385D-AS2
expression in HCC tissues and clinicopathologic variables of the
HCC samples (N=303).
|
|
|
| ZNF385D-AS2
expression |
|
|
|---|
|
|
|
|
|
|
|
|---|
| Clinical
characteristics | Variables | No. of
patients | High, n | Low, n | χ2 | P-value |
|---|
| Age (years) | ≤55 | 107 | 53 | 54 | 0.006 | 0.938 |
|
| >55 | 196 | 98 | 98 |
|
|
| Sex | Female | 92 | 38 | 54 | 3.846 | 0.050 |
|
| Male | 211 | 113 | 98 |
|
|
| T stage | T1 | 153 | 84 | 69 | 3.875 | 0.049 |
|
| T2 | 76 | 36 | 40 |
|
|
|
| T3 | 63 | 23 | 40 |
|
|
|
| T4 | 10 | 7 | 3 |
|
|
| M stage | M0 | 229 | 107 | 122 | 4.221 | 0.040 |
|
| M1 | 3 | 2 | 1 |
|
|
|
| Mxa | 71 | 42 | 29 |
|
|
| N stage | N0 | 220 | 106 | 114 |
|
<0.001b |
|
| N1 | 3 | 0 | 3 |
|
|
|
| Nxa | 80 | 34 | 46 |
|
|
| Grade | G1 | 42 | 24 | 18 | 2.038 | 0.564 |
|
| G2 | 144 | 69 | 75 |
|
|
|
| G3 | 105 | 47 | 58 |
|
|
|
| G4 | 12 | 5 | 7 |
|
|
| Stage | Stage I/II | 227 | 121 | 106 | 4.356 | 0.037 |
|
| Stage III/IV | 76 | 30 | 46 |
|
|
| Fustat | Surviving | 217 | 102 | 115 | 3.055 | 0.081 |
|
| Deceased | 86 | 50 | 36 |
|
|
| Race | Asian | 150 | 77 | 73 | 0.004 | 0.950 |
|
| Other race | 147 | 76 | 71 |
|
|
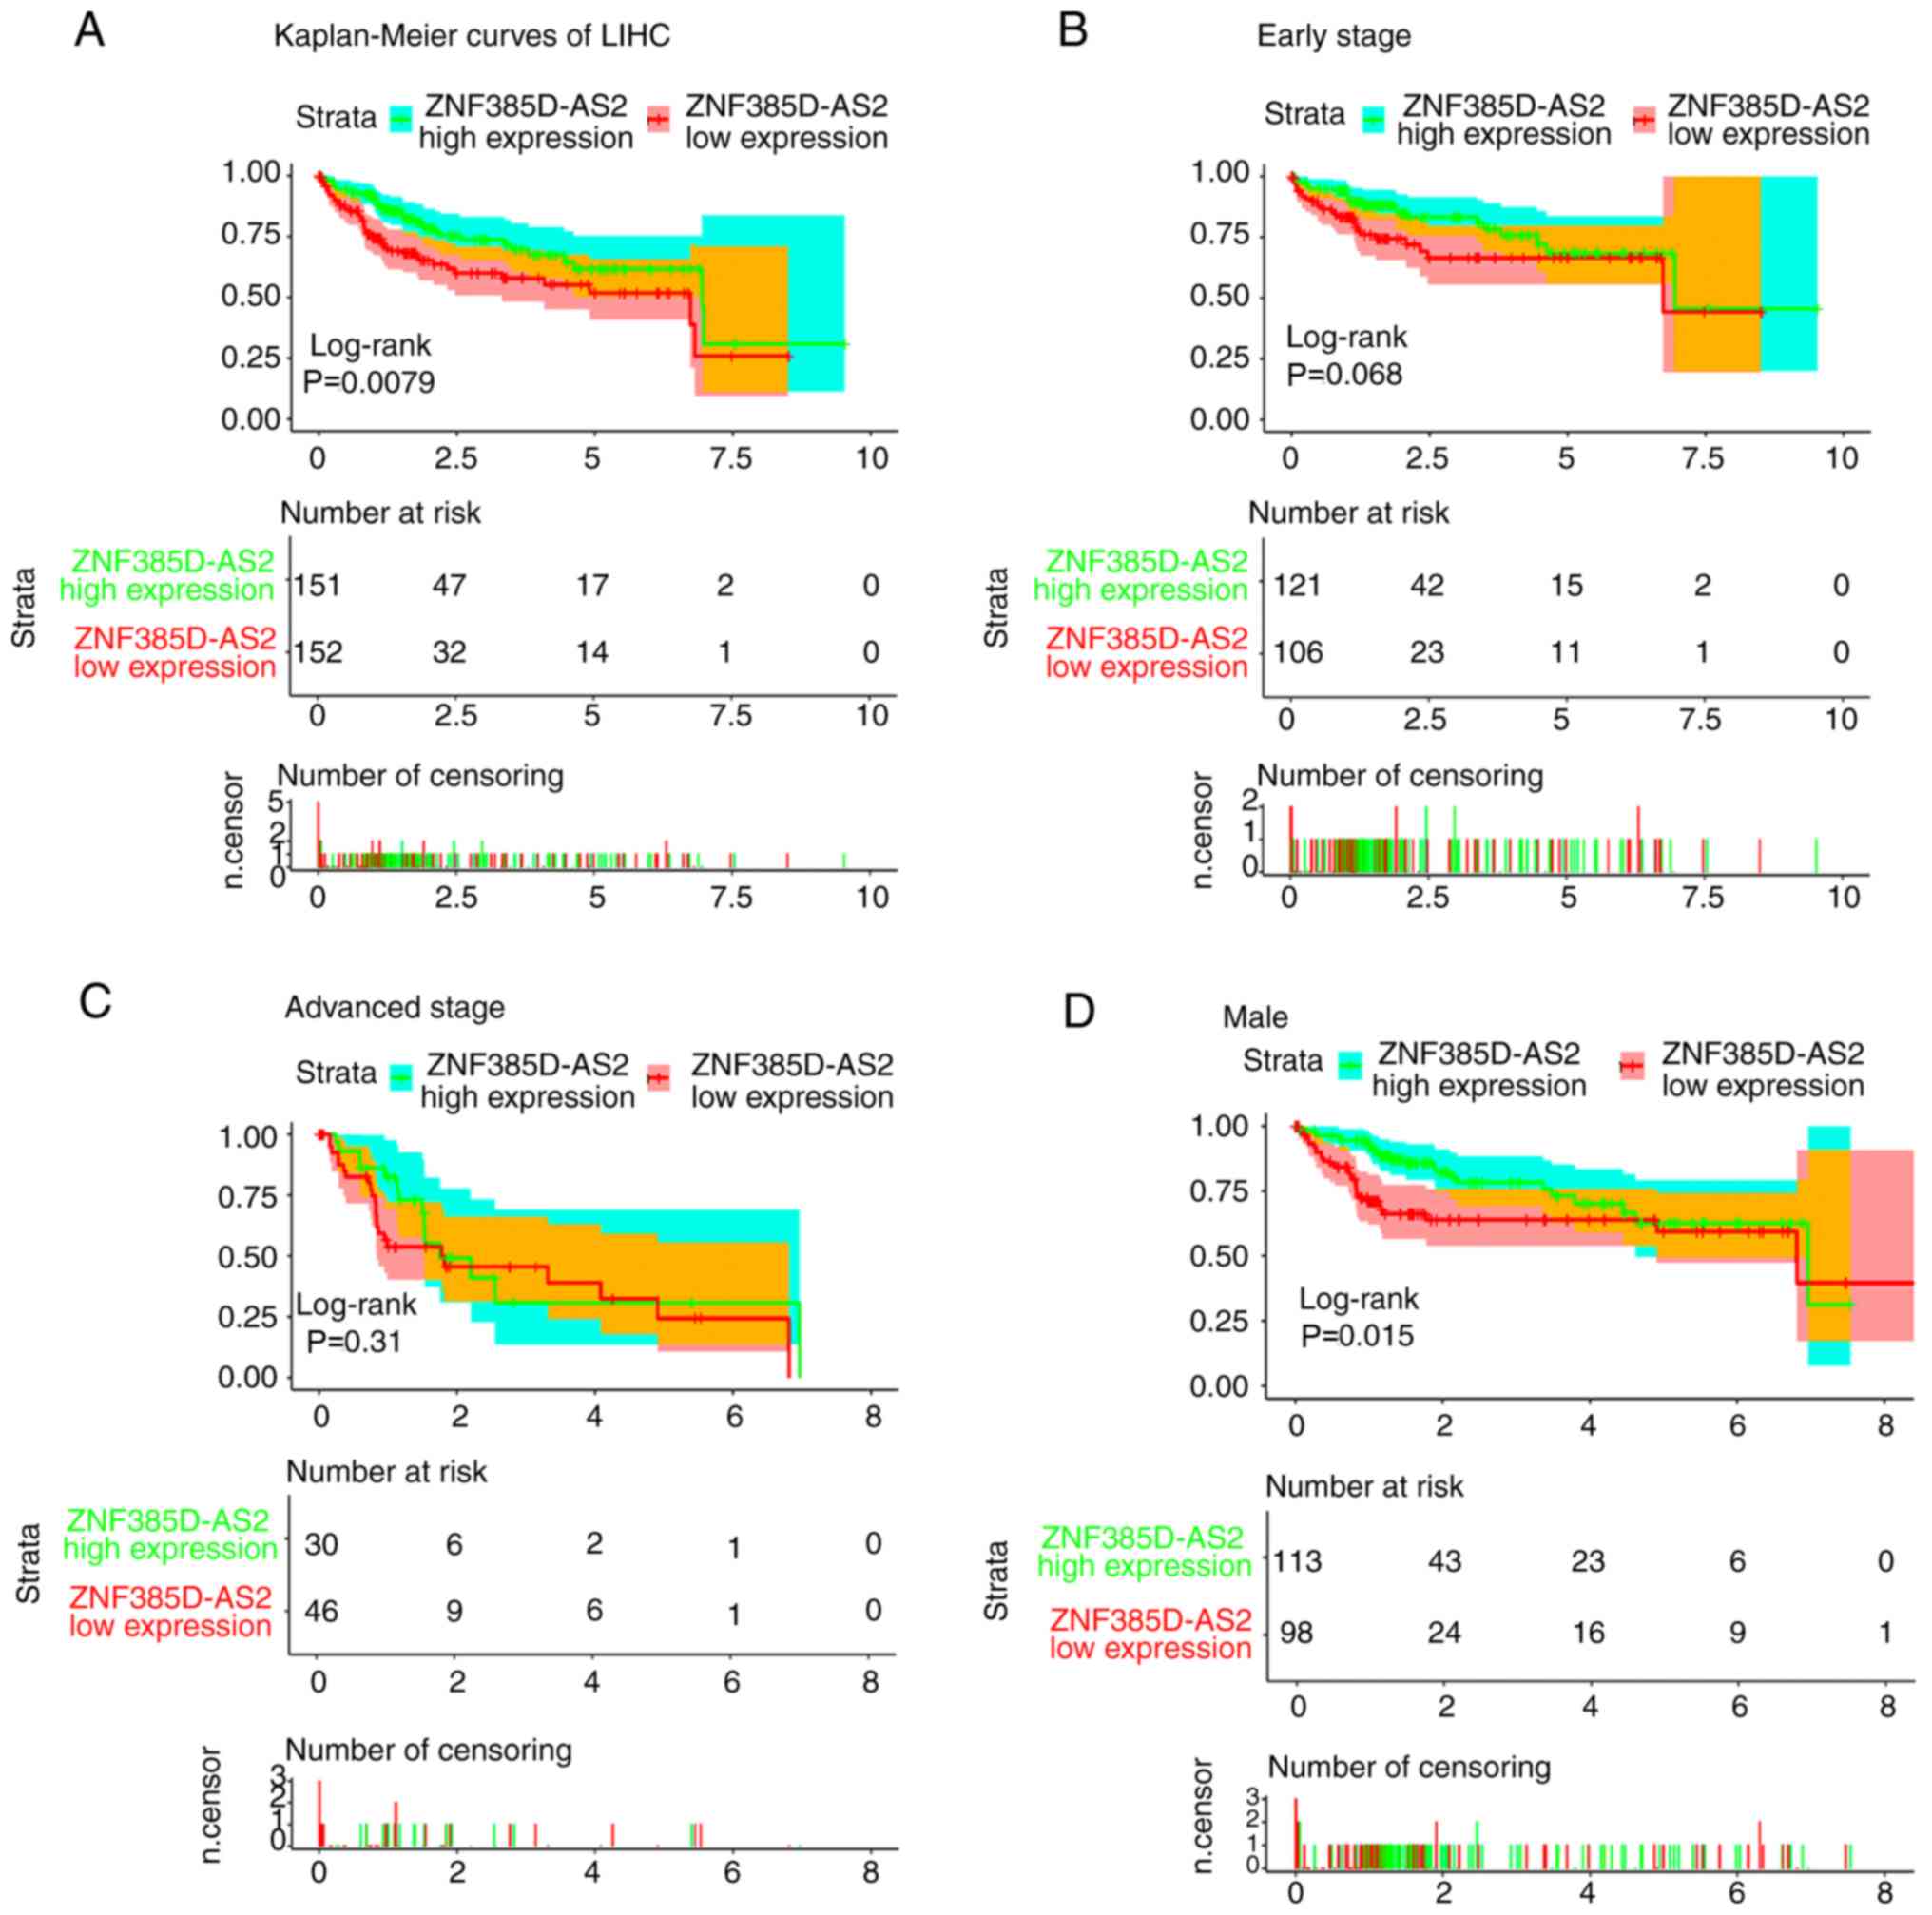
Low ZNF385D-AS2 expression is an
independent prognostic factor for poor survival
We generated Kaplan-Meier curves of overall survival
(OS), and log-rank tests showed that ZNF385D-AS2 low-expression was
associated with poor OS (P=0.0079; Fig.
3A). Further subgroup analysis (Fig.
3A-O) showed that ZNF385D-AS2 low-expression was associated
with the poor OS of patients with sex (male) (P=0.015; Fig. 3D), M0 stage (P=0.0099; Fig. 3H), N0 stage (P=0.028; Fig. 3I), age ≤55 (P=0.023; Fig. 3J), early pathological stage (G1/2)
(P=0.044; Fig. 3L) and race (Asian)
(P=0.0046; Fig. 3N).
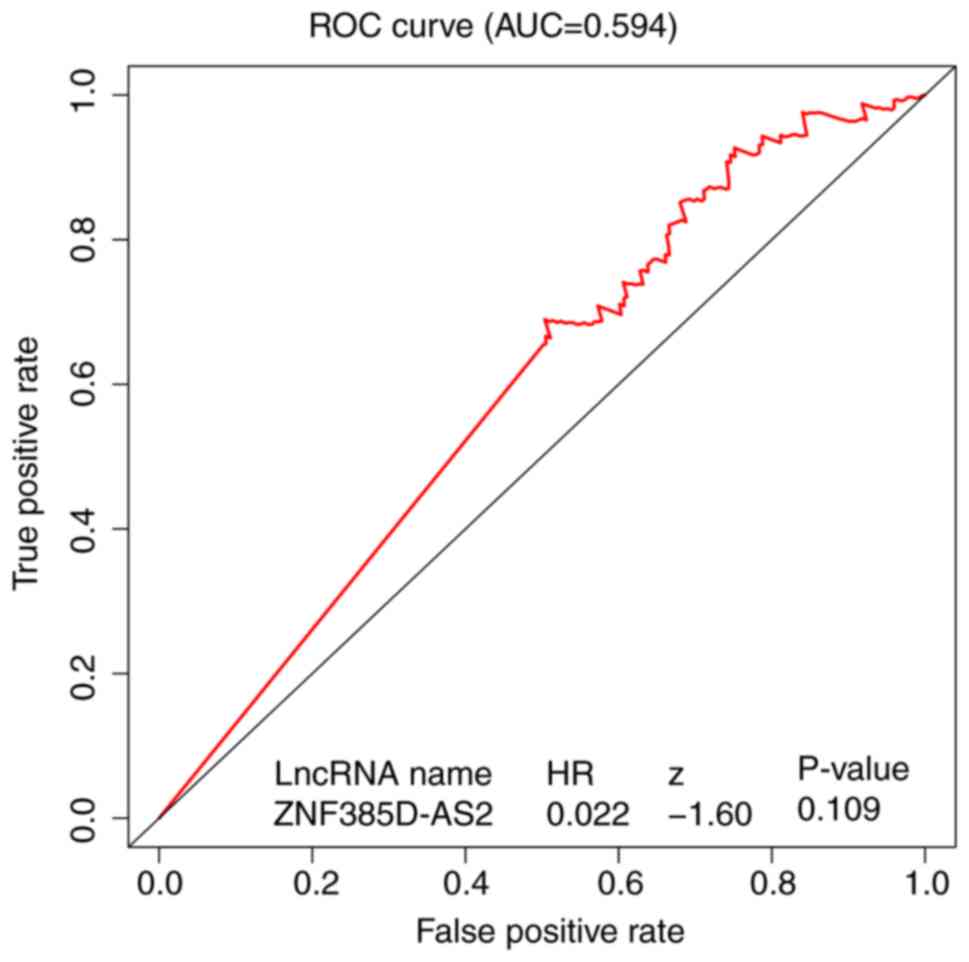
As shown in Fig. 4,
the ROC of ZNF385D-AS2 was executed, and the area under the curve
(AUC) was 0.594, which represented moderate diagnostic ability.
In ZNF385D-AS2 low-expression patients, we used
univariate analysis and selected the critical variables including
age, sex clinical stage, pathological grade and TMN classification.
Multivariate analysis with the Cox proportional hazards model
indicated that clinical stage (HR=1.418, P=0.011) and T
classification (HR=1.713, P<0.001) were independent prognostic
factors for patients with HCC (Table
III).
| Table III.Univariate and multivariate analyses
of OS in patients with liver cancer with low expression of lncRNA
ZNF385D-AS2. |
Table III.
Univariate and multivariate analyses
of OS in patients with liver cancer with low expression of lncRNA
ZNF385D-AS2.
|
| Univariate
analysis | Multivariate
analysis |
|---|
|
|
|
|
|---|
| Parameters | HR | 95% CI | P-value | HR | 95% CI | P-value |
|---|
| Age, years (≤55 vs.
>55) | 1.361 | 0.991–1.041 |
0.243 |
|
|
|
| Sex (female vs.
male) | 0.691 | 0.419–1.476 |
0.681 |
|
|
|
| Race (Asian vs.
Black and Caucasian) | 0.988 | 0.449–0.991 | 0.32 |
|
|
|
| Grade (G1 and G2
vs. G3 and G4) | 0.044 | 0.722–1.612 |
0.835 |
|
|
|
| Stage (Stage I and
II vs. III and IV) | 1.813 | 1.257–2.405 |
0.013 | 1.418 | 0.926–2.452 |
0.011 |
| T stage (T1 and T2
vs. T3 and T4) | 2.299 | 1.594–3.401 |
<0.001 | 1.713 | 1.269–3.120 |
<0.001 |
| M stage (M0 vs.
M1) | 2.282 | 1.994–2.407 |
0.059 |
|
|
|
| N stage (N0 vs.
N1) | 1.119 | 1.063–1.376 |
0.073 |
|
|
|
GSEA identifies the biological
functions and proteins associated with ZNF385D-AS2
To identify the biological functions activated in
liver cancer, we conducted GSEA between high and low ZNF385D-AS2
expression data sets. GSEA revealed significant differences (FDR
<0.25, P<0.05) in the enrichment of ‘MSigDB Collection’, and
the specific contents are shown in Table
IV. In the nucleus, ‘histone deubiquitination’, ‘V-D-J
recombination’ and ‘translation factor activity RNA binding’ were
found to be differentially enriched in the ZNF385D-AS2
low-expression phenotype. Meanwhile, Table IV shows that ‘cytoplasmic exosome
RNase complex’, ‘nuclear exosome RNase complex’, ‘retrograde
transport endosome to Golgi’ and ‘Golgi organization’ exhibited a
positive correlation with ZNF385D-AS2. In the cytoplasm, low
expression of ZNF385D-AS2 was also related to various cytological
behaviors such as ‘protein transport along microtubule’, ‘negative
regulation of defense response to virus’ and ‘oxidoreductase
activity acting on the CNH group of donors NAD+ or
NADP+ as acceptor’. Moreover, Table IV shows that as the expression of
ZNF385D-AS2 is decreased, various intracellular signaling pathways
are also affected. These signaling pathways encompass the metabolic
synthesis and degradation of substances, such as ‘one carbon pool
by folate’, ‘glyoxylate and dicarboxylate metabolism’, ‘fatty acid
metabolism’, ‘selenoamino acid metabolism’, ‘fructose and mannose
metabolism’ as well as ‘aminoacyl tRNA biosynthesis’,
‘glycosyl-phosphatidylinositol GPI anchor biosynthesis’, ‘RNA
degradation’ and ‘lysine degradation’. Moreover, it also affects
signal transfer and material transport within HCC cells, including
‘ABC transporters’, ‘Snare interactions in vesicular transport’ and
‘basal transcription factors’, in addition to the progression of
various diseases, including ‘acute myeloid leukemia’, ‘hepatitis’
and ‘endometrial cancer’.
| Table IV.lncRNA ZNF385D-AS2 low-expression
related GO terms and KEGG pathways in HCC. |
Table IV.
lncRNA ZNF385D-AS2 low-expression
related GO terms and KEGG pathways in HCC.
| GO Terms | Size | ES | NES | NOM P-value |
|---|
|
GO_DEOXYRIBONUCLEOSIDE_TRIPHOSPHATE_METABOLIC_PROCESS | 16 | 0.6713025 | 1.8666009 | <0.001 |
|
GO_HISTONE_MRNA_METABOLIC_PROCESS | 28 | 0.5867406 | 1.8163215 | 0.010204081 |
|
GO_TRANSLATION_FACTOR_ACTIVITY_RNA_BINDING | 83 | 0.3732794 | 1.7212093 | 0.030425964 |
|
GO_SOMATIC_CELL_DNA_RECOMBINATION | 33 | 0.6081087 | 1.7152647 | 0.0078125 |
|
GO_V_D_J_RECOMBINATION | 16 | 0.7184384 | 1.7132919 | <0.001 |
|
GO_OXIDOREDUCTASE_ACTIVITY_ACTING_ON_THE_CH | 18 | 0.6175537 | 1.7093326 | 0.010162601 |
|
_NH_GROUP_OF_DONORS_NAD_OR_NADP_AS_ACCEPTOR | 21 | 0.5698847 | 1.6803491 | 0.024340771 |
|
GO_EXOSOME_RNASE_COMPLEX_ | 19 | 0.5726633 | 1.6542872 | 0.017928287 |
|
GO_TELOMERASE_HOLOENZYME_COMPLEX | 18 | 0.5810587 | 1.6540635 | 0.035781544 |
|
GO_MICROTUBULE_NUCLEATION | 41 | 0.5348539 | 1.6465995 | 0.033663366 |
|
GO_SOMATIC_DIVERSIFICATION_OF_IMMUNE_RECEPTORS | 20 | 0.6116292 | 1.6374387 | 0.019880716 |
|
GO_NUCLEAR_LOCALIZATION_SEQUENCE_BINDING | 18 | 0.4993185 | 1.6094043 | 0.042307694 |
|
GO_NEGATIVE_REGULATION_OF_DEFENSE_RESPONSE_TO_VIRUS | 15 | 0.5706286 | 1.6084776 | 0.03206413 |
|
GO_CYTOPLASMIC_EXOSOME_RNASE_COMPLEX_ | 22 | 0.5604809 | 1.5993211 | 0.05668016 |
|
GO_SNRNA_PROCESSING | 71 | 0.3641102 | 1.5988086 | 0.05078125 |
|
GO_RETROGRADE_TRANSPORT_ENDOSOME_TO_GOLGI | 27 | 0.5950033 | 1.5972574 | 0.038910504 |
|
GO_PROTEIN_TRANSPORT_ALONG_MICROTUBULE | 16 | 0.5016319 | 1.5902865 | 0.060546875 |
|
GO_PRE_AUTOPHAGOSOMAL_STRUCTURE_MEMBRANE | 84 | 0.3968728 | 1.5886257 | 0.05668016 |
|
GO_GOLGI_ORGANIZATION | 15 | 0.5812139 | 1.5849311 | 0.037254903 |
|
GO_NUCLEAR_EXOSOME_RNASE_COMPLEX_GO_HISTONE_DEUBIQUITINATION | 21 | 0.5922844 | 1.5812734 | 0.035785288 |
|
| KEGG
Pathways | Size | ES | NES | NOM
P-value |
|
|
KEGG_ONE_CARBON_POOL_BY_FOLATE | 17 | 0.5607268 | 1.6354854 | 0.02028398 |
|
KEGG_RNA_DEGRADATION | 57 | 0.383115 | 1.6217419 | 0.04722793 |
|
KEGG_GLYOXYLATE_AND_DICARBOXYLATE_METABOLISM | 16 | 0.5347747 | 1.4103469 | 0.10763209 |
|
KEGG_ABC_TRANSPORTERS | 44 | 0.4471579 | 1.2647074 | 0.16201118 |
|
KEGG_LYSINE_DEGRADATION | 44 | 0.417074 | 1.318973 | 0.21428572 |
|
KEGG_SNARE_INTERACTIONS_IN_VESICULAR_TRANSPORT | 37 | 0.3300203 | 1.2587498 | 0.21875 |
|
KEGG_AMINOACYL_TRNA_BIOSYNTHESIS | 41 | 0.3709021 | 1.1858624 | 0.3238289 |
|
KEGG_GLYCOSYLPHOSPHATIDYLINOSITOL_GPI_ANCHOR_BIOSYNTHESIS | 25 | 0.3702377 | 1.155113 | 0.33463797 |
|
KEGG_GLYCOSAMINOGLYCAN_BIOSYNTHESIS_KERATAN_SULFATE | 15 | 0.4000842 | 1.1251451 | 0.33675563 |
|
KEGG_BASAL_TRANSCRIPTION_FACTORS | 32 | 0.3257739 | 1.1036584 | 0.35135135 |
|
KEGG_PROXIMAL_TUBULE_BICARBONATE_RECLAMATION | 23 | 0.4029235 | 1.0807126 | 0.35238096 |
|
KEGG_MISMATCH_REPAIR | 23 | 0.4058034 | 1.1521276 | 0.35966736 |
|
KEGG_NUCLEOTIDE_EXCISION_REPAIR | 43 | 0.3010005 | 1.1056284 | 0.3783231 |
|
KEGG_SPLICEOSOME | 125 | 0.2617425 | 1.0658554 | 0.39430895 |
|
KEGG_ACUTE_MYELOID_LEUKEMIA | 57 | 0.2873536 | 1.0399672 | 0.3966597 |
|
KEGG_FATTY_ACID_METABOLISM | 41 | 0.4589222 | 1.121886 | 0.41860464 |
|
KEGG_SELENOAMINO_ACID_METABOLISM | 26 | 0.2914508 | 1.023621 | 0.42376238 |
|
KEGG_PEROXISOME | 78 | 0.3360126 | 1.045031 | 0.4318182 |
|
KEGG_FRUCTOSE_AND_MANNOSE_METABOLISM | 34 | 0.2906978 | 0.9975369 | 0.45 |
|
KEGG_ENDOMETRIAL_CANCER | 52 | 0.2653771 | 0.9771847 | 0.45436105 |
During the progression of liver cancer, the
expression of ZNF385D-AS2 was found to gradually decrease. In this
process, expression levels of a certain number of mRNAs were found
to be altered as ZNF385D-AS2 decreased, and these results are
summarized in Table V. The expression
levels of MEK, EGFR, ERB2, mTOR initially increased and then
decreased. A positive regulation relationship was found between the
expression levels of ZNF385D-AS2 and GLI1, CAMP, cyclin D1, Wnt.
However, there still exists a negative regulatory relationship
between the expression level of JAK2, PDGF-ERK and BRCA1. It is
worth noting that P53, a gene that inhibits the development of
cancer, was found to first decrease and then increase as the amount
of ZNF385D-AS2 expression decreases.
| Table V.Enrichment of gene expression from
GSEA. |
Table V.
Enrichment of gene expression from
GSEA.
| Expression
change | Gene name |
|---|
| Decreased
expression | JAK2, SIRNA,
PDGF, BCAT, STK33, RB, TBK1, EIF4E, BRCA1 |
| Increased
expression | CSR, STK33,
STK33, GLI1, CAMP, PIGF, EGFR, STK33, KRAS, TBK1, Cyclin D1,
Wnt |
| First increased
then decreased | VEGF, CSR, ESC,
CRX, MTOR, MEK, EGFR, ERB2, LTE2, LEF1, GLI1, RAF, ATF2 |
| First decreased
then increased | HOXA9, RB,
P53 |
Prediction of related genes and
functional annotation analyses
We next used R's ‘edgr’ package to calculate the
difference (log fold-change >1, P<0.05) in expression between
mRNAs, miRNAs and lncRNAs in the TCGA-LIHC and GEO (GSE54236)
databases. Then we conducted comparative analysis of several lncRNA
databases, such as NONCODE, LncRBase, Co-LncRNA to identify miRNAs
that have regulatory relationships with ZNF385D-AS2 and mRNAs that
these miRNAs may regulate. After comparing the data from the TCGA
and GEO databases, the possible ceRNA patterns in HCC were
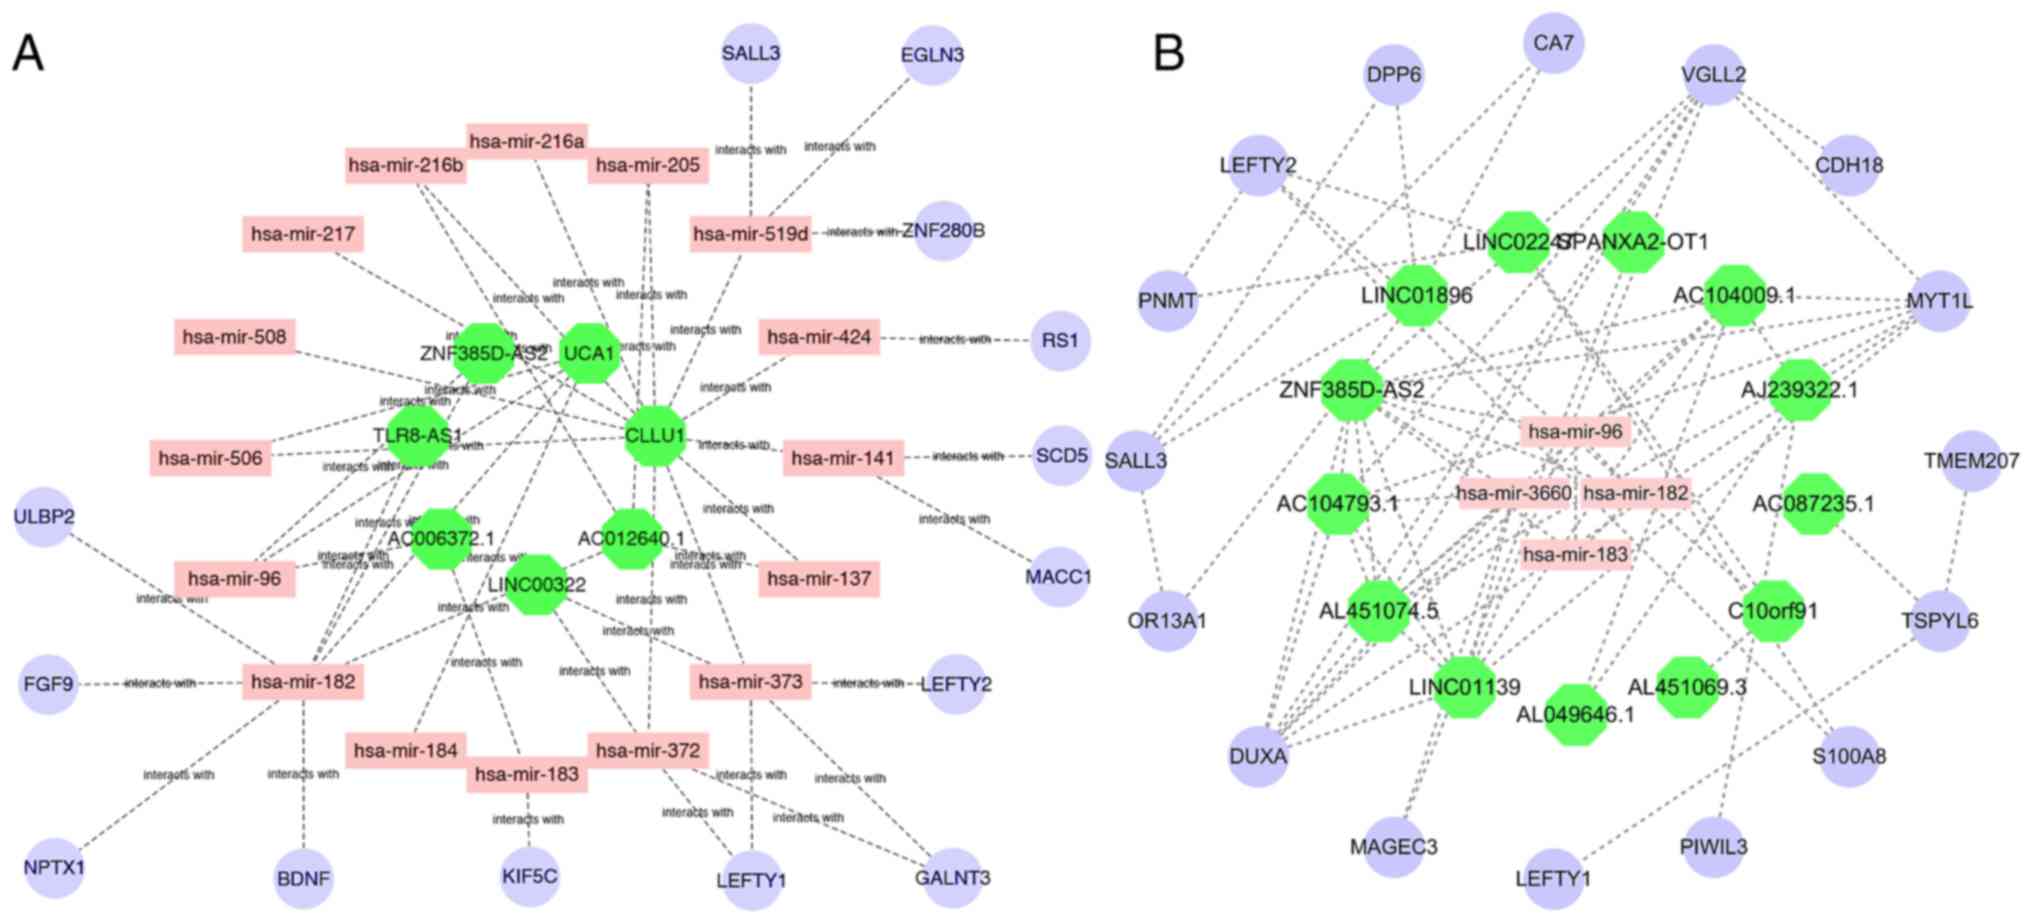
predicted and plotted in Cytoscape (Fig.
5A). At the same time, we used Pearson and Spearman correlation
analysis based on the Logistic function (‘WGCNA’ package in R), of
the co-expression relationship between ZNF385D-AS2. The mRNAs and
miRNAs were identified, and the co-expression network between
ZNF385D-AS2 and the mRNAs and miRNAs was also mapped (Fig. 5B). The result strongly suggested that
there is a regulatory signaling axis that exists between
ZNF385D-AS2 and miR-96 and miR-182.
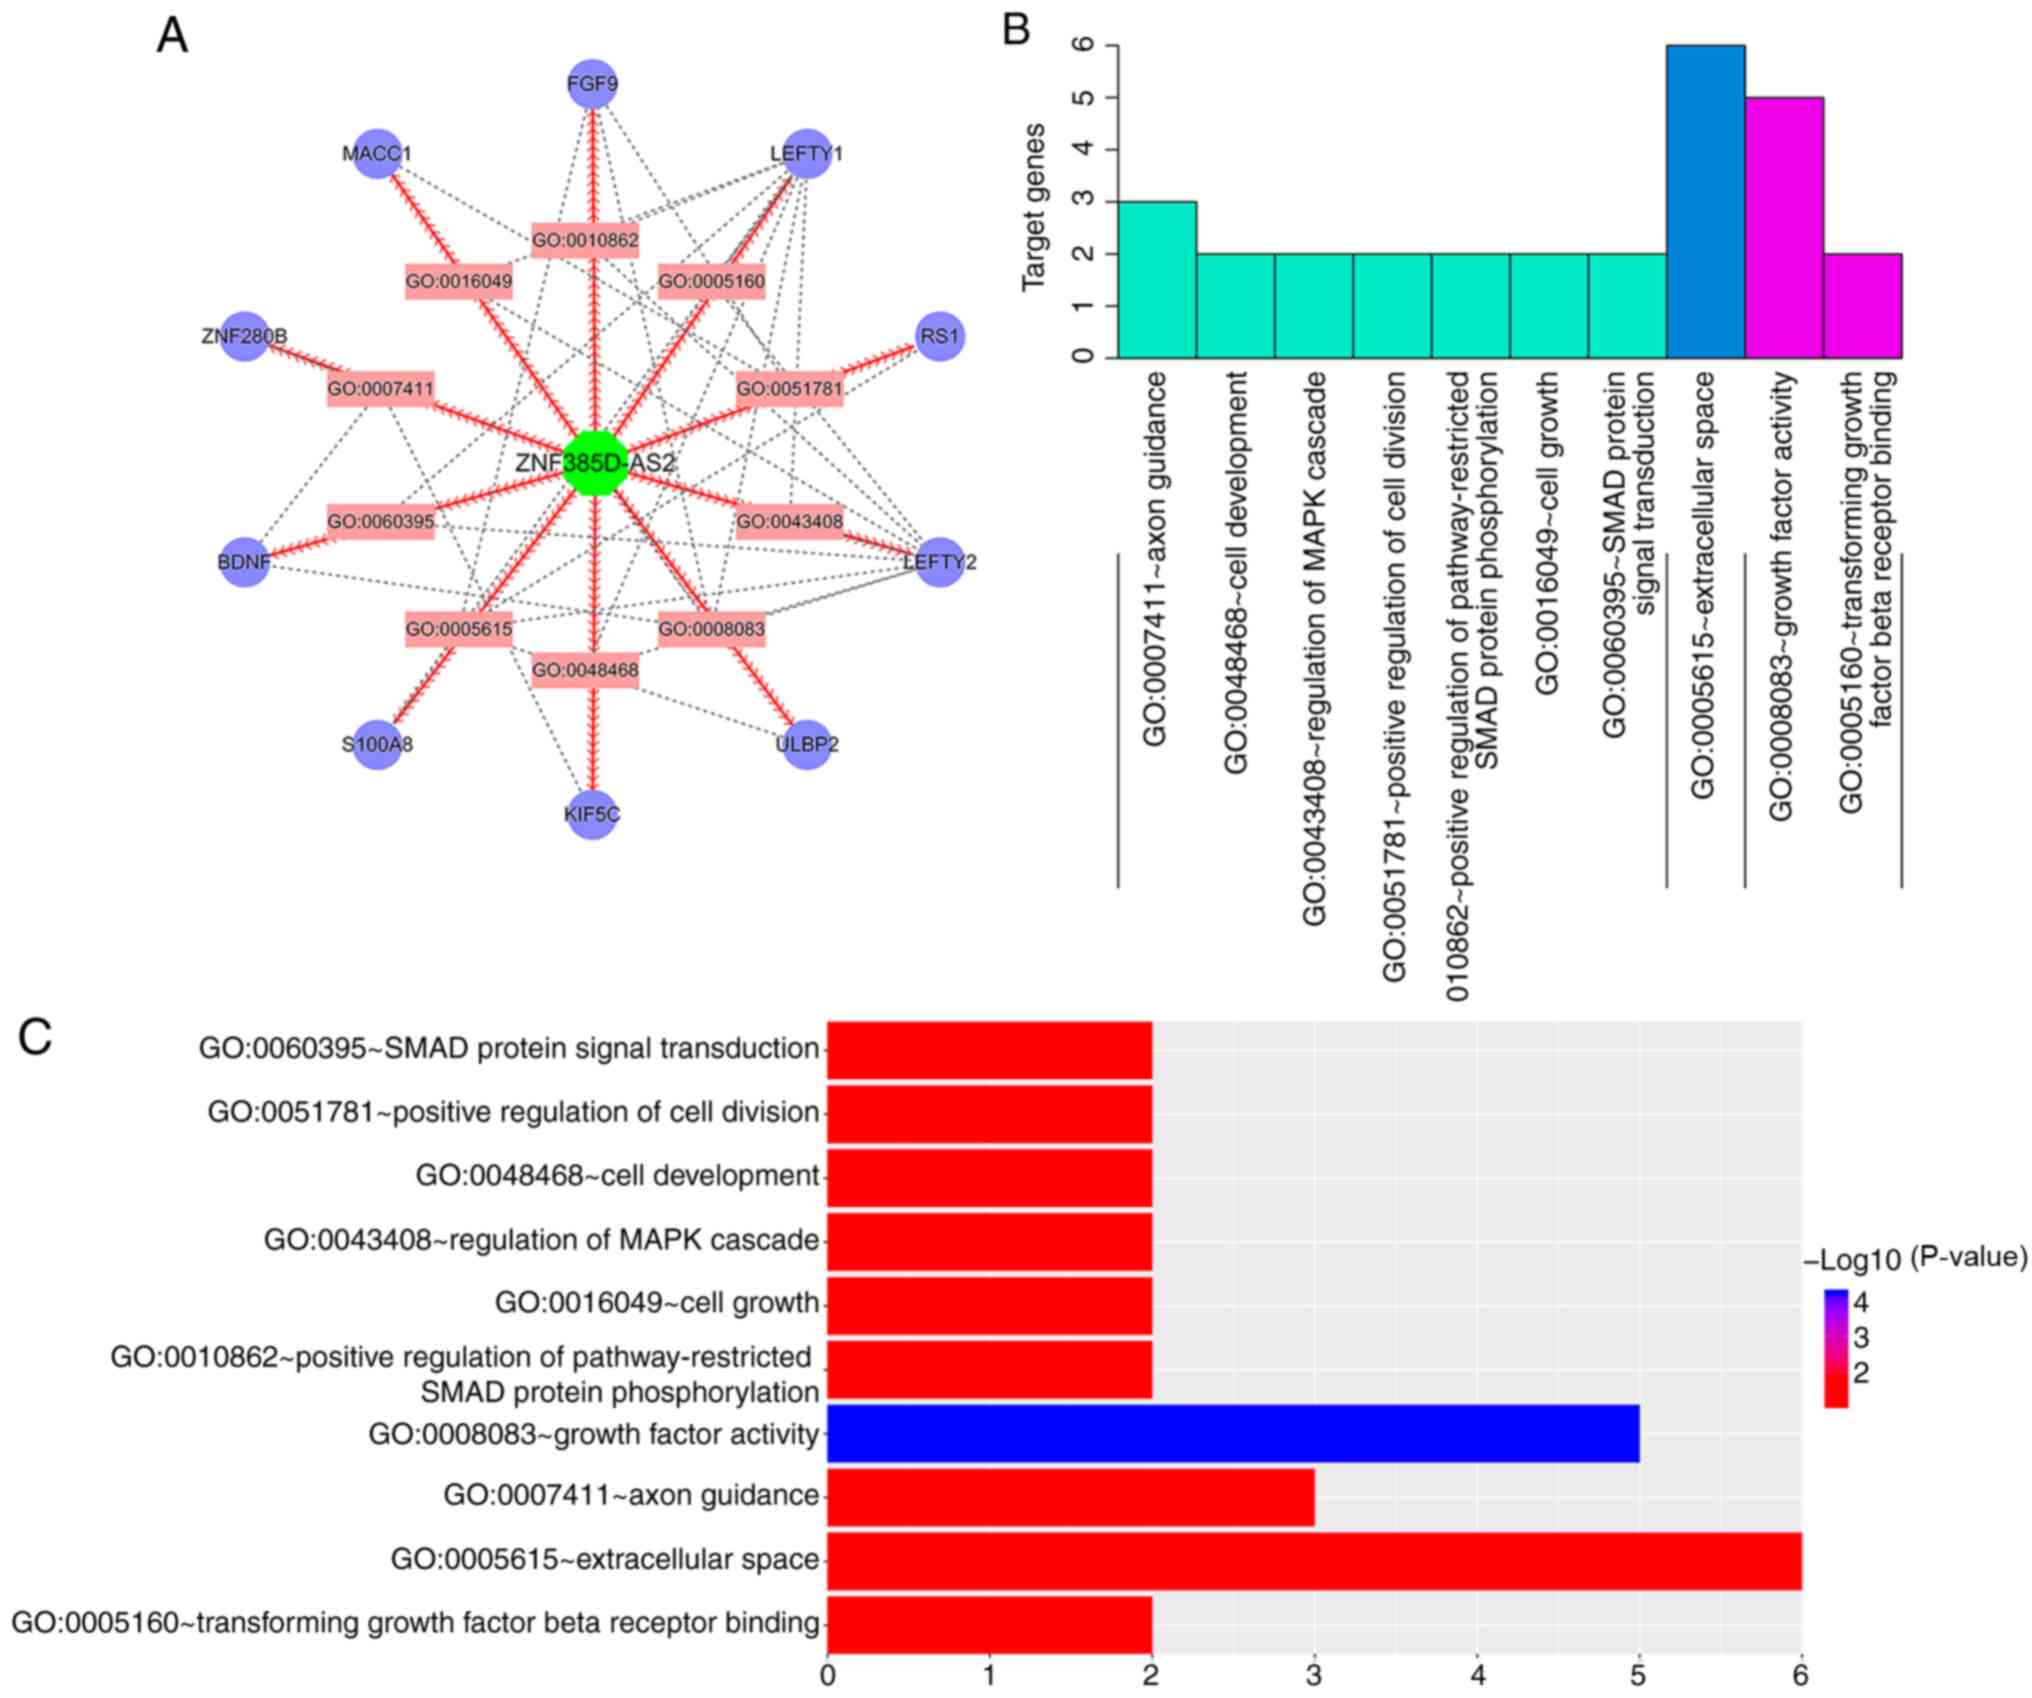
We then integrated the regulatory networks obtained
by these two different methods, and again performed GO terms and
KEGG pathway analyses for these mRNAs after removal of the
duplicates. Cytoscape was used to conduct an analysis map of genes
enriched in the GO terms and to construct an interaction network
for the related genes (Fig. 6A). As
shown in Fig. 6B and C, these
specific mRNAs were most highly enriched in the following GO terms:
Molecular function (MF) (growth factor activity, transforming
growth factor β receptor binding), biological process (BP) (axon
guidance, cell development, regulation of MAPK cascade, positive
regulation of cell division, positive regulation of
pathway-restricted SMAD protein phosphorylation, cell growth, SMAD
protein signal transduction) and cellular component (CC)
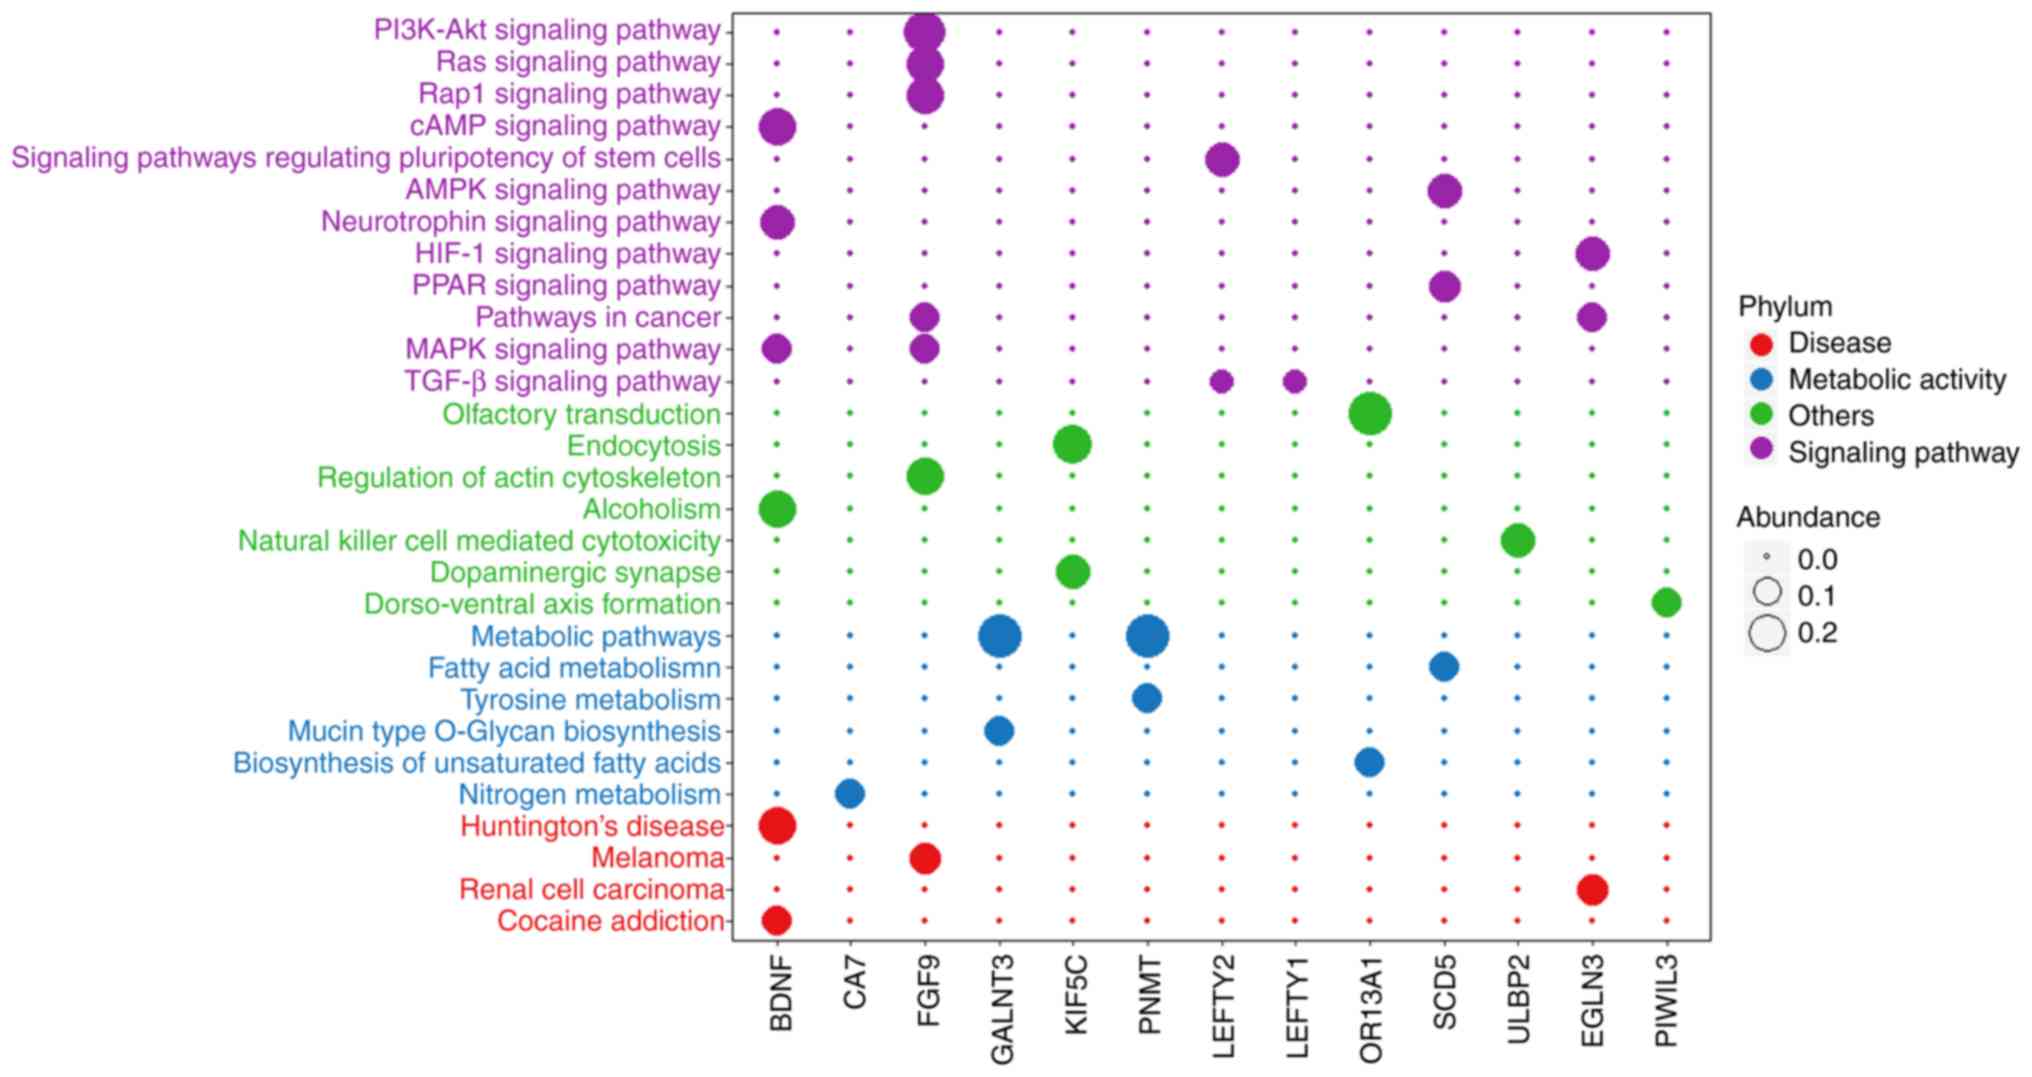
(extracellular space). Based on the results in Fig. 5, we used R to perform a dot-enrichment
of the KEGG pathway obtained from KOBAS. These signaling pathways
are able to affect material metabolism within HCC cells, signal
transduction, progression of various diseases, and other biological
behaviors (Fig. 7).
Co-expression and ceRNA pattern
regulated genome maps
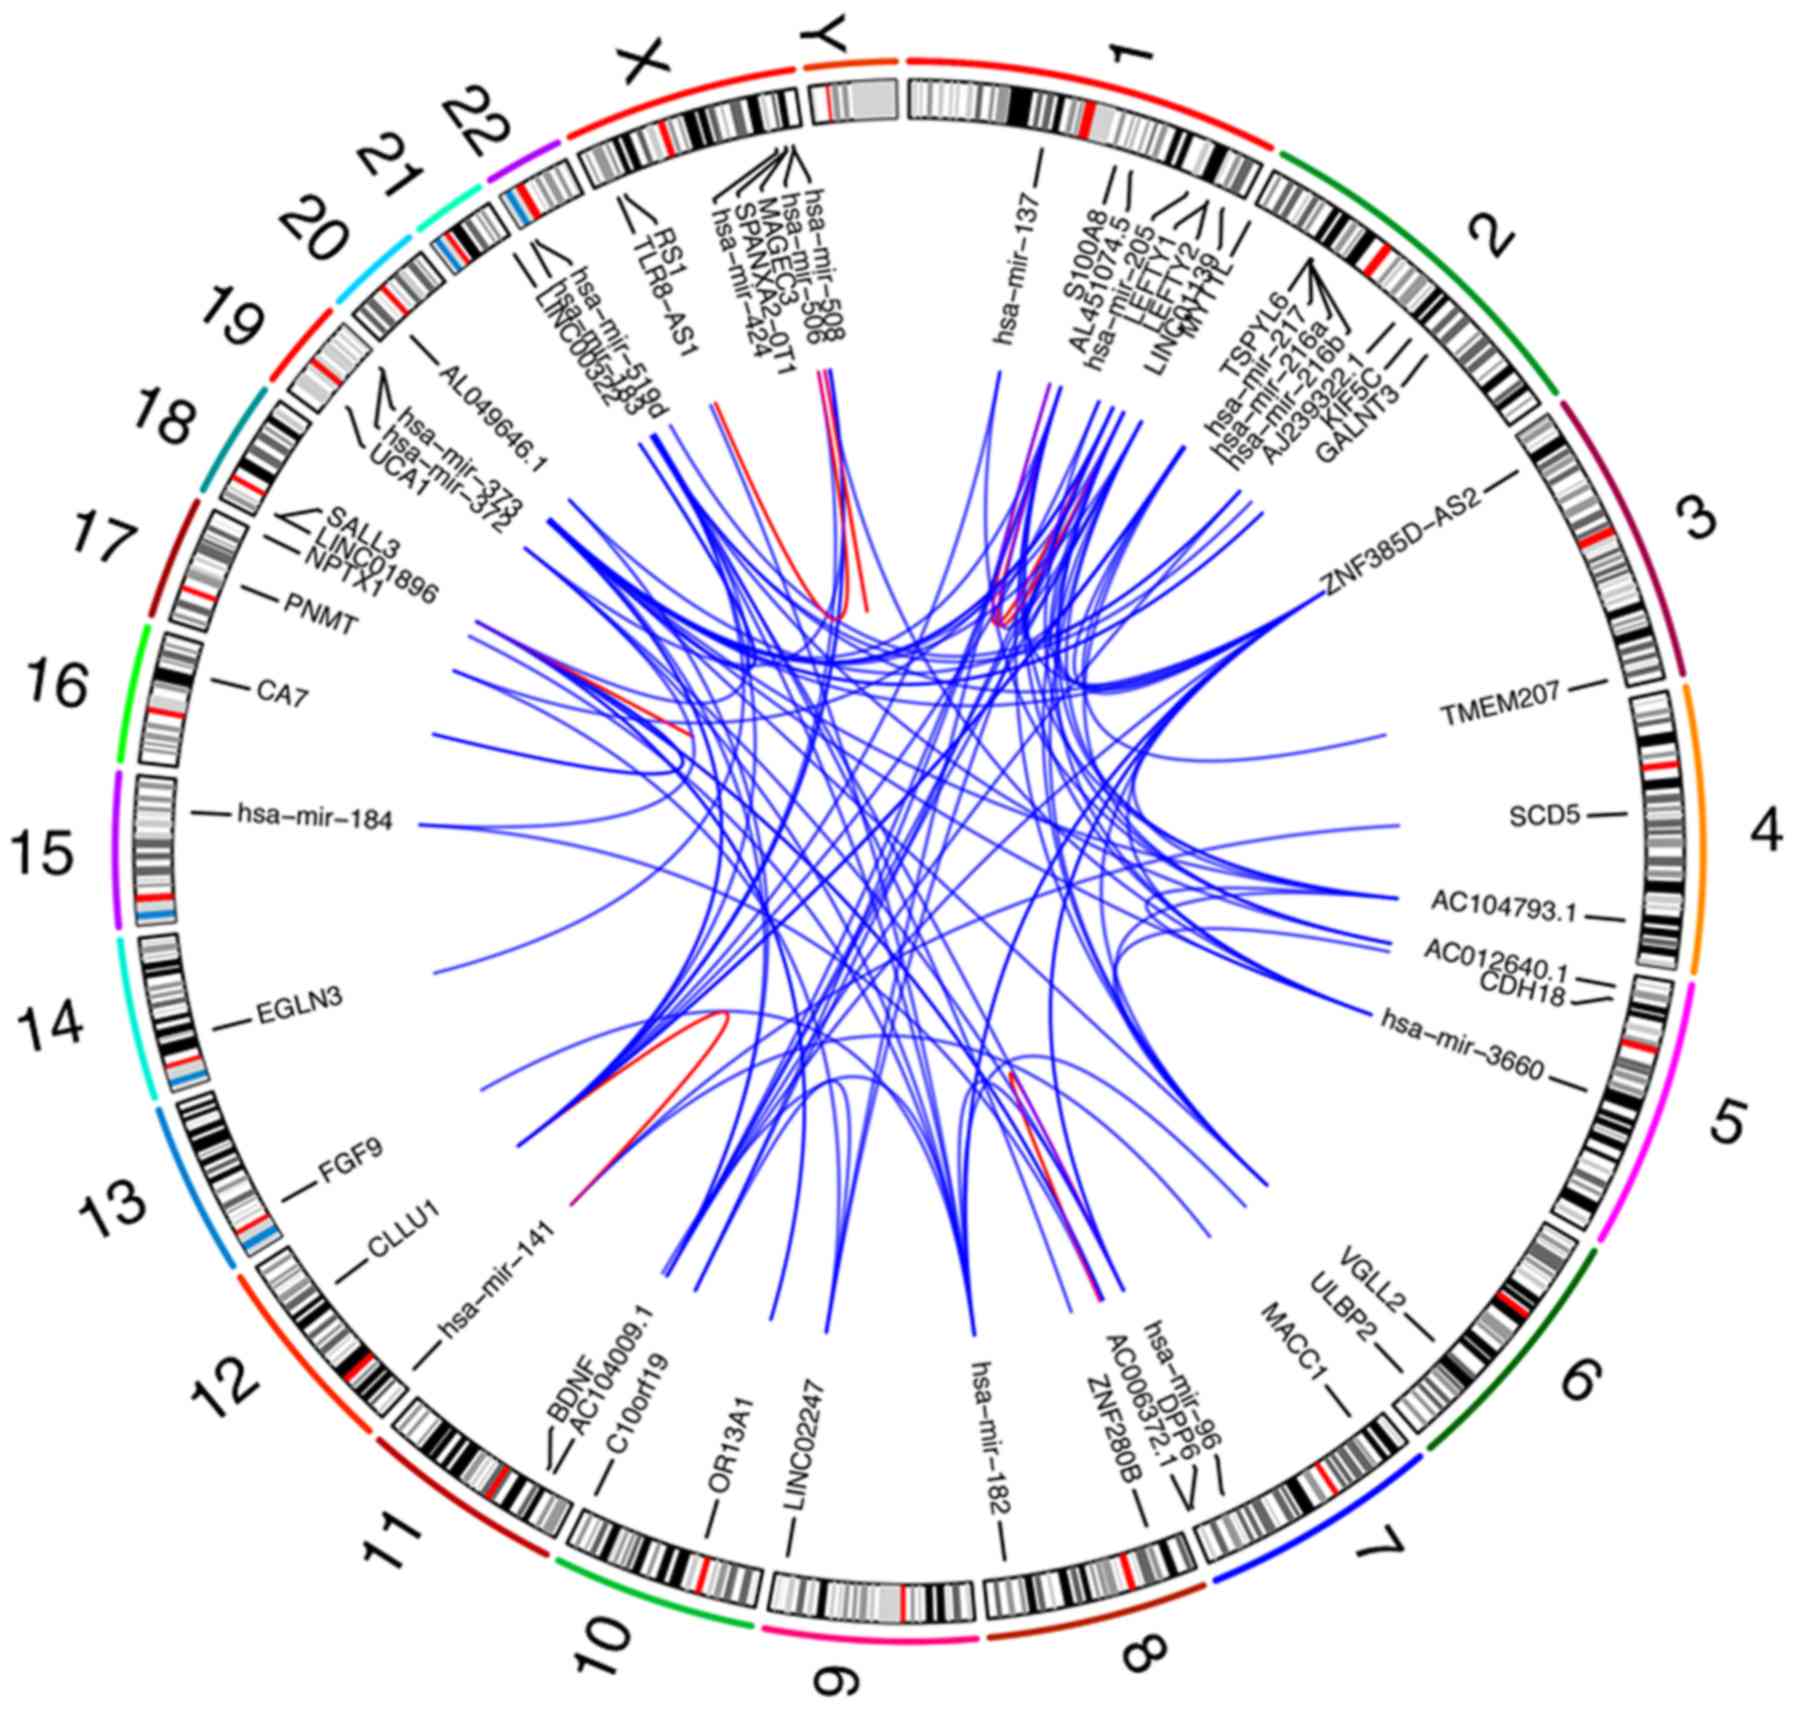
Alignments of gene co-expression maps to GRCh38.95
identified reference genomic regions contributing to the
composition of 59 genome sets. According to the co-expressing genes
and ceRNA regulatory network predictive analysis results, we
comprehensively analyzed the gene co-expression result and ceRNA
regulatory network in GEO (GSE54236) and TCGA-LICH with
ZNF385D-AS2. In order to find the most represented reference
fragments, all GRCh38.95 loci present in the gene co-expressed maps
were deduced and merged, resulting in 59 reference donor fragments,
which settled in the outermost track. The numbers of gene
co-expressed maps containing each of these fragment labels were
then marked in the second track, excluding duplicate counts. We
found 96 pairs of genes which existed in a co-expressed phenomenon.
In the inner sector, we linked these pairs of gene sets that had
co-expression relationships with lines. The sum of gene
co-expressed map alignments across the whole genome was used as the
links for the 59 gene co-expressed maps in the Circos plot
(Fig. 8).
Discussion
lncRNAs, as a group of genes, have been reported to
be highly or lowly expressed in cancers. Furthermore, lncRNAs may
serve as oncogenes, promoting the development of cancer by
interacting with miRNAs and mRNAs to regulate cytological behavior
(20). As demonstrated by this
research, lncRNA ZNF385D-AS2 plays an important role in HCC and can
be used as a biomarker to monitor liver cancer prognosis. After
analyzing the ZNF385D-AS2 expression in liver cancer patient
samples, we found factors that are correlated with ZNF385D-AS2
low-expression, namely, sex, vital status, clinical stage, T stage
and survival time.
Much research has been conducted in recent years
concerning the role played by ZNF385D-AS2 in common digestive
tumors where ZNF385D-AS2 was found to be downregulated (21). Recently, it has been suggested that
downregulation of ZNF385D-AS2 is involved in cancers including
gastric cancer and human non-small cell lung cancer (NSCLC)
although there is limited research to confirm this. Based on the
present study, ZNF385D-AS2 low-expression was observed in liver
cancer, consistent with the same ZNF385D-AS2 low-expression state
concerning other types of tumors in the TCGA database. It is
notable that ZNF385D-AS2 expression gradually decreased from T1 to
T4 and from clinical stage I to clinical stage IV, suggesting its
relevance in the progression of liver cancer. In addition,
ZNF385D-AS2 expression was higher in male patients than female
patients, suggesting its relevance to sex and the necessity to
perform subgroup analysis. Especially in patients with a survival
time of less than 3 years, this difference in expression was more
pronounced. Moreover, low expression of ZNF385D-AS2 was associated
with survival status, making it necessary to explore its link with
survival. After analyzing the M and N stages of liver cancer,
although the results did not achieve statistical significance, the
expression level of ZNF385D-AS2 in M1 and N1 phase was lower than
that in M0 and N0 phase.
Some previous studies also analyzed the way
ZNF385D-AS2 affects the occurrence and development of tumors
(22). By large-scale clinical
statistics, the obvious low-expression of ZNF385D-AS2 is found in
many liver cell lines (23). In this
study, ZNF385D-AS2 can affect the initiation and proliferation of
tumor, which explains that it is clinically related to the TNM
classification. ZNF385D-AS2 exhibits a strong association with
cancer prognosis. In the present study, it was found that low
expression of ZNF385D-AS2 indicated a poor overall survival (OS),
particularly in relation to age ≤55 years, sex (male), race
(Asian), M0 stage, N0 stage as well as early histologic grade
G1/G2. Cox analysis demonstrated the independent prognostic effect
of ZNF385D-AS2 on the OS of patients; therefore, it can be used to
monitor liver cancer as a biomarker. Some studies have also shown
that in addition to affecting some of the common biological
functions of tumor cells, lncRNA ZNF385D-AS2 can also affect some
specific cytological behaviors although research is sparse
confirming this. After functional enrichment analysis of
ZNF385D-AS2, we found that ZNF385D-AS2 has a close relationship
with the formation and efflux of exosomes. It is closely related to
histone deubiquitination, V-D-J recombination and translation
factor activity RNA binding, but also affects the regulation of
defense response to virus, pre-autophagosomal membrane formation
and as an acceptor acting on oxidoreductase activity. Not only
that, but some of the intracellular signaling pathways are also
affected. These signaling pathways encompass the metabolic
synthesis and degradation of substances, such as ‘one carbon pool
by folate’, ‘glyoxylate and dicarboxylate metabolism’, ‘fatty acid
metabolism’, ‘selenoamino acid metabolism’, ‘fructose and mannose
metabolism’ as well as ‘aminoacyl tRNA biosynthesis’,
‘glycosyl-phosphatidylinositol GPI anchor biosynthesis’, ‘RNA
degradation’ and ‘lysine degradation’. In the process, ZNF385D-AS2
also affects signal transfer, material transport within the cell
and the progression of various diseases, including pathways for
‘acute myeloid leukemia’, ‘hepatitis’ and ‘endometrial cancer’.
Moreover, simultaneously with the gradual decrease in the
expression of this special lncRNA, the expression of
tumor-suppressor genes and oncogenes are also altered.
To further explore the biological role of
ZNF385D-AS2 in HCC, we conducted a comparative analysis of the data
from the TCGA and GEO databases and found approximately 59 genes
that may be closely related to this special lncRNA. After
functional enrichment of these genes with GO, we found that these
genes play an important role in the following biological behaviors,
such as molecular function (MF) (growth factor activity,
transforming growth factor β receptor binding), biological process
(BP) (axon guidance, cell development, regulation of MAPK cascade,
positive regulation of cell division, positive regulation of
pathway-restricted SMAD protein phosphorylation, cell growth, SMAD
protein signal transduction) and cellular component (CC)
(extracellular space). The result of the KEGG pathway analysis
suggested that these genes can affect signaling pathways including
material metabolism within HCC cells, signal transduction,
progression of various diseases, and other biological behaviors.
After integrating the data in TCGA and GEO, we obtained a total of
96 pairs of co-expressed gene pairs, including 59 genes of
different types include mRNAs, miRNAs and lncRNAs. Finally, these
data were integrated with gene expression and predicted for
possible ceRNA regulatory network and the co-expression network.
Finally, we performed whole-genome mapping by GRCh38.95, covering
96 co-expressed gene pairs representing the highest expression
difference regions of the cancer genome. This allowed chained links
to be directly observed without the need for complex algorithmic
inferences reliant on intricate assumptions.
To the best of our knowledge, the present study, for
the first time, confirmed that ZNF385D-AS2 greatly affects liver
cancer prognosis. The present study, accompanied by other research
on liver cancer, elucidated the importance of ZNF385D-AS2.
Nevertheless, these findings should be verified in future studies
with clinical trials, so as to ensure that ZNF385D-AS2 can be
widely applied in the prognostic evaluation of liver cancer.
In conclusion, our study found that low expression
of ZNF385D-AS2 was significantly decreased in HCC patients and is
associated with several clinical features and a poor prognosis.
Thus, ZNF385D-AS2 may be a useful biomarker for the prognosis of
patients with liver cancer.
Acknowledgements
Not applicable.
Funding
This study was supported by the Fundamental Research
Funds for the Central Universities, JLU, the National Natural
Science Foundation of China (Grant No. 31771093), the Project of
International Collaboration of Jilin Province (No. 201180414085GH),
the Fundamental Research Funds for the Central Universities, JLU,
the Program for JLU Science and Technology Innovative Research Team
(2017TD-27, 2019TD-36). The funders had no role in study design,
data collection and analysis, decision to publish, or preparation
of the manuscript.
Availability of data and materials
The Cancer Genome Atlas-Liver Hepatocellular
Carcinoma (TCGA-LIHC) and Gene Expression Omnibus (GEO)
(GEO-GSE54236).
Authors' contributions
ZZ and SW conceived the presented the research
design of the study. YL developed the theory and performed the
computations. ZM and FC verified the analytical methods. YL
supported ZZ with conducting the experimental research, organized
the experimental data into the manuscript and supervised the
findings of this work. All authors commented on drafts and approved
the final version. All authors participated in the decision to
submit for publication. All authors read and approved the
manuscript and agree to be accountable for all aspects of the
research in ensuring that the accuracy or integrity of any part of
the work are appropriately investigated and resolved.
Ethics approval and consent to
participate
Not applicable.
Patient consent for publication
Not applicable.
Competing interests
The authors declare that they have no competing
interests.
References
|
1
|
Hartke J, Johnson M and Ghabril M: The
diagnosis and treatment of hepatocellular carcinoma. Semin Diagn
Pathol. 34:153–159. 2017. View Article : Google Scholar : PubMed/NCBI
|
|
2
|
Lee Y, Park H, Lee H, Cho JY, Yoon YS,
Choi YR, Han HS, Jang ES, Kim JW, Jeong SH, et al: The
clinicopathological and prognostic significance of the gross
classification of hepatocellular carcinoma. J Pathol Transl Med.
52:85–92. 2018. View Article : Google Scholar : PubMed/NCBI
|
|
3
|
Goossens N, Sun X and Hoshida Y: Molecular
classification of hepatocellular carcinoma: Potential therapeutic
implications. Hepat Oncol. 2:371–379. 2015. View Article : Google Scholar : PubMed/NCBI
|
|
4
|
Liz J and Esteller M: lncRNAs and
microRNAs with a role in cancer development. Biochim Biophys Acta
1859. 169–176. 2016.
|
|
5
|
Chandra Gupta S and Nandan Tripathi Y:
Potential of long non-coding RNAs in cancer patients: From
biomarkers to therapeutic targets. Int J Cancer. 140:1955–1967.
2017. View Article : Google Scholar : PubMed/NCBI
|
|
6
|
Zhang Z, Liu F, Yang F and Liu Y: Kockdown
of OIP5-AS1 expression inhibits proliferation, metastasis and EMT
progress in hepatoblastoma cells through up-regulating miR-186a-5p
and down-regulating ZEB1. Biomed Pharmacother. 101:14–23. 2018.
View Article : Google Scholar : PubMed/NCBI
|
|
7
|
Zhu X, Liu Y, Yu J, Du J, Guo R, Feng Y,
Zhong G, Jiang Y and Lin J: lncRNA HOXA-AS2 represses endothelium
inflammation by regulating the activity of NF-κB signaling.
Atherosclerosis. 281:38–46. 2019. View Article : Google Scholar : PubMed/NCBI
|
|
8
|
Samur MK: RTCGAToolbox: A new tool for
exporting TCGA firehose data. PLoS One. 9:e1063972014. View Article : Google Scholar : PubMed/NCBI
|
|
9
|
Villa E, Critelli R, Lei B, Marzocchi G,
Camma C, Giannelli G, Pontisso P, Cabibbo G, Enea M, Colopi S, et
al: Neoangiogenesis-related genes are hallmarks of fast-growing
hepatocellular carcinomas and worst survival. Results from a
prospective study. Gut. 65:861–869. 2016. View Article : Google Scholar : PubMed/NCBI
|
|
10
|
Zubiete-Franco I, Garcia-Rodriguez JL,
Lopitz-Otsoa F, Serrano-Macia M, Simon J, Fernandez-Tussy P,
Barbier-Torres L, Fernandez-Ramos D, Gutierrez-de-Juan V, Lopez de
Davalillo S, et al: SUMOylation regulates LKB1 localization and its
oncogenic activity in liver cancer. EBioMedicine. 40:406–421. 2019.
View Article : Google Scholar : PubMed/NCBI
|
|
11
|
Jiao Y, Fu Z, Li Y, Meng L and Liu Y: High
EIF2B5 mRNA expression and its prognostic significance in liver
cancer: A study based on the TCGA and GEO database. Cancer Manag
Res. 10:6003–6014. 2018. View Article : Google Scholar : PubMed/NCBI
|
|
12
|
Ginestet C: ggplot2: Elegant graphics for
data analysis. J R Statist Soc A. 174:245. 2011. View Article : Google Scholar
|
|
13
|
Lin H and Zelterman D: Modeling survival
data: Extending the cox model. Technometrics. 44:85–86. 2002.
View Article : Google Scholar
|
|
14
|
Robin X, Turck N, Hainard A, Tiberti N,
Lisacek F, Sanchez JC and Müller M: pROC: An open-source package
for R and S+ to analyze and compare ROC curves. BMC Bioinformatics.
12:772011. View Article : Google Scholar : PubMed/NCBI
|
|
15
|
Subramanian A, Tamayo P, Mootha VK,
Mukherjee S, Ebert BL, Gillette MA, Paulovich A, Pomeroy SL, Golub
TR, Lander ES and Mesirov JP: Gene set enrichment analysis: A
knowledge-based approach for interpreting genome-wide expression
profiles. Proc Natl Acad Sci USA. 201:15545–15550. 2005. View Article : Google Scholar
|
|
16
|
Huang da W, Sherman BT and Lempicki RA:
Systematic and integrative analysis of large gene lists using DAVID
bioinformatics resources. Nat Protoc. 4:44–57. 2009. View Article : Google Scholar : PubMed/NCBI
|
|
17
|
Zhang B and Horvath S: A general framework
for weighted gene co-expression network analysis. Stat Appl Genet
Mol Biol. 4:Article172005. View Article : Google Scholar : PubMed/NCBI
|
|
18
|
Deng Y, He R, Zhang R, Gan B, Zhang Y,
Chen G and Hu X: The expression of HOXA13 in lung adenocarcinoma
and its clinical significance: A study based on the cancer genome
atlas, oncomine and reverse transcription-quantitative polymerase
chain reaction. Oncol Lett. 15:8556–8572. 2018.PubMed/NCBI
|
|
19
|
Chan EKF, Cameron DL, Petersen DC, Lyons
RJ, Baldi BF, Papenfuss AT, Thomas DM and Hayes VM: Optical mapping
reveals a higher level of genomic architecture of chained fusions
in cancer. Genome Res. 28:726–738. 2018. View Article : Google Scholar : PubMed/NCBI
|
|
20
|
Choi S, Lee S, Kim Y, Hwang H and Park T:
HisCoM-GGI: Hierarchical structural component analysis of gene-gene
interactions. J Bioinform Comput Biol. 16:18400262018. View Article : Google Scholar : PubMed/NCBI
|
|
21
|
Maciukiewicz M, Marshe VS, Tiwari AK,
Fonseka TM, Freeman N, Kennedy JL, Rotzinger S, Foster JA, Kennedy
SH and Müller DJ: Genome-wide association studies of placebo and
duloxetine response in major depressive disorder. Pharmacogenomics
J. 18:406–412. 2018. View Article : Google Scholar : PubMed/NCBI
|
|
22
|
Xu C, Aragam N, Li X, Villla EC, Wang L,
Briones D, Petty L, Posada Y, Arana TB, Cruz G, et al: BCL9 and
C9orf5 are associated with negative symptoms in schizophrenia:
Meta-analysis of two genome-wide association studies. PLoS One.
8:e516742013. View Article : Google Scholar : PubMed/NCBI
|
|
23
|
Rose JE, Behm FM, Drgon T, Johnson C and
Uhl GR: Personalized smoking cessation: Interactions between
nicotine dose, dependence and quit-success genotype score. Mol Med.
16:247–253. 2010. View Article : Google Scholar : PubMed/NCBI
|