Introduction
Liver cancer is the sixth most common cancer
worldwide, accounting for 5.6% of the total cases diagnosed in 2012
(1–4).
Liver cancer accounted for 9.1% of cancer-associated deaths in
2012. In developed countries, liver cancer is the sixth leading
cause of cancer-associated mortality among men. In 2012, an
estimated 782,000 new liver cancer cases and 745,000 deaths
occurred globally, with >50% of the total cases and deaths
reported in China (2–5). In China, liver cancer is the fourth most
common cancer and the third leading cause of cancer-associated
mortality (5). Late diagnosis and low
efficacy of pharmacotherapeutics account for the high mortality
rate of liver cancer (1). Cisplatin
(cis-dichlorodiamine platinum, CDDP) is one of the most
effective and commonly used chemotherapeutic drugs for the
treatment of certain advanced carcinomas. CDDP has been used alone
or in combination with other agents to treat different types of
cancer (6). Previous studies have
reported that CDDP combination chemotherapy decreased the
development of drug resistance in laryngeal cancer, and improved
the survival rate of the patients (6–9). However,
the use of CDDP alone may result in the development of tolerance;
this would require the use of higher doses to achieve the desired
efficacy, leading to toxic side effects and poor patient outcome
(10–12). In order to overcome this limitation,
CDDP has been used in combination with other anticancer drugs for
the treatment of laryngeal cancer (6,7,9,13,14). Furthermore, CDDP is one of the most
commonly used chemotherapeutic agents for the treatment of HCC,
although its efficacy is limited by its toxic side effects.
Additionally, liver cancer is resistant to chemotherapy, which
complicates the treatment of the disease (15,16). There
is therefore a requirement for adjuvant drugs to limit the side
effects of CDDP.
Tannic acid (TA), a natural plant polyphenol, has
been widely used as a dietary supplement in the pharmaceutical
industry (17). TA inhibits cell
growth in various types of cancer, including breast, prostate,
skin, ovarian and gingival cancer, colorectal carcinoma,
cholangiocarcinoma, glioma and leukemia (17–32). TA
exhibits low toxicity to healthy cells and may be administered
orally (17). A previous study
revealed that a combination of TA and CDDP induced apoptosis in
ovarian cancer cells (17). The aim
of the present study was to investigate whether the combination of
TA and CDDP therapy successfully inhibits liver cancer cell growth
and whether the underlying mechanism involves mitochondria-mediated
apoptosis.
Materials and methods
Cell culture
The human liver cancer cell line HepG2 was purchased
from the American Type Culture Collection and maintained in
RPMI-1640 (Gibco; Thermo Fisher Scientific, Inc.) supplemented with
10% fetal bovine serum (FBS; Zhejiang Tian Hang Biological Science
and Technology Co., Ltd.), 2.0 g/l sodium hydrogen carbonate, 100
µg/ml streptomycin and 100 U/ml penicillin. The cells were
maintained in an incubator at 37°C (5% CO2), and
experiments were conducted during the exponential growth phase.
However, the cell line was not authenticated in our laboratory
since it was purchased in 2013.
Cell viability assay
HepG2 cells were cultured in RPMI-1640 supplemented
with 10% FBS for 24 h. The cells were then treated with TA (Cell
Signaling Technology, Inc.) at 0, 90, 180, 270, 360, 450 and 540
µM, and CDDP (Qilu Pharmaceutical Co., Ltd.) at 0, 0.6, 1.2, 1.8,
2.4, 3.0 and 3.6 µg/ml for 24 h. Subsequently, the cells were
subjected to MTT analysis according to the manufacturer's protocol
(Solar Biotechnology Co., Ltd.). The cell inhibition rate was
calculated as follows: 1-(drug A value-control A value)/inhibition
rate (%)=1-(drug A value-control A value)/(control A value-blank A
value).
Measurement of the combination index
(CI) and dose reduction index (DRI)
The effect of drug synergism on cancer cells may be
determined using CI and DRI. In the present study, the synergistic
effect of TA and CDDP was determined using the following
formula:
CI=(D)1/(Dx)1+(D)2/(Dx)2(DRI)1=(Dx)1/(D)1,(DRI)2=(Dx)2/(D)2,
where (Dx)1 = dose of drug 1 required to produce 50%
cell death; (D)1 = dose of drug 1 required to produce 50% cell
death in combination with (D)2; (Dx)2 = dose of drug 2 required to
produce 50% cell death; (D)2 = dose of drug 2 required to produce
50% cell death in combination with (D)1. CI <1 indicates a
synergistic effect of the two drugs, CI = 1 suggests an additive
effect and CI >1 indicates antagonism.
The DRI estimates to what extent the dose of one or
more drugs in a synergistic combination may be reduced to achieve
effects that are comparable with those achieved with each drug
alone. The inverted terms in the CI equation are the DRIs for the
corresponding individual drugs in combination. The reduced dose of
each drug reduces toxicity and the increased effect in combination
leads to beneficial clinical outcomes.
Changes in cell and nuclear
morphology
A total of 3×10⁵ HepG2 cells were plated
into each well of a 6-well plate and incubated for 24 h. A total of
four treatment groups were created: i) cells exposed to 180 µM TA +
0.9 µg/ml CDDP; ii) cells exposed to 180 µM TA; iii) cells exposed
to 0.9 µg/ml CDDP; and iv) cells exposed to a saline control. The
cells were incubated for a further 24 h prior to morphological
analysis. For nuclear morphological analysis, the cells were fixed
with acetone, stained with DAPI for 5 min, and examined using a
fluorescence microscope (cat. no. IX73; Olympus Corporation).
Annexin V-fluorescein isothiocyanate
(FITC)/propidium iodide (PI) apoptosis assay
HepG2 cells were collected in an Eppendorf tube,
washed twice with PBS, centrifuged at 800 × g for 5 min at 4°C, and
resuspended in calcium-enriched HEPES buffer. The cells were then
subjected to Annexin V-FITC/PI apoptosis analysis according to the
manufacturer's instructions (BBI Co., Ltd.). Briefly, the cells
were stained with Annexin V-FITC and PI for 15 min and analyzed
using a flow cytometer (Gallios; Beckman Coulter) with FlowJo
software (version 7.6.3; Tree Star, Inc.).
Mitochondrial transmembrane potential
(MTP)
Cells were washed twice with PBS and centrifuged at
800 × g for 5 min. The cells were then stained using JC-1 (cat. no.
C2006; Beyotime Institute of Biotechnology) and the MTP was
determined according to the manufacturer's protocol (Beyotime
Institute of Biotechnology). Cells were then analyzed using a flow
cytometer.
Reverse transcription-quantitative
polymerase chain reaction (RT-qPCR) analysis
Total RNA was extracted from HepG2 cells and
reverse-transcribed into cDNA. M-MLV reverse transcriptase and
RNase inhibitor were purchased from Promega Corporation, and dNTP
mix (10 mM) was purchased from Shanghai Bio-Tech Co., Ltd. RNAiso™
Plus was purchased from Takara Bio Inc. cDNA was used at a 1:10
dilution for qPCR. The primers for qPCR were as follows: β-actin
forward, 5′-CGGGAAATCGTGCGTGAC-3′ and reverse,
5′-CAGGAAGGAAGGCTGGAAG-3′; Bcl-2 forward, 5′-GGTGGGGTCATGTGTGTGG-3′
and reverse, 5′-CGGTTCAGGTACTCAGTCATCC-3′; Bcl-2-associated X
apoptosis (Bax) forward, 5′-CCCGAGAGGTCTTTTTCCGAG-3′ and reverse,
5′-CCAGCCCATGATGGTTCTGAT-3′; and cytochrome c (CytC)
forward, 5′-CTTTGGGCGGAAGACAGGTC-3′, and reverse,
5′-TTATTGGCGGCTGTGTAAGAG-3′. The qPCR reaction mixture consisted of
1 µl cDNA, 5 µl SsoFast™ EvaGreen® Supermix (Bio-Rad
Laboratories, Inc.), 0.5 µl of each primer and 3.5 µl distilled
water. The thermocycling conditions were as follows: Initial
denaturation at 94°C for 60 sec, followed by 40 cycles at 95°C for
20 sec and at 56°C (for β-actin and Bax), 60.3°C (for Bcl-2), or
57.6°C (for CytC) for 30 sec. The mRNA levels were quantified using
the 2−ΔΔCq method (33)
and normalized to the internal reference gene β-actin. qPCR
experiments were performed in triplicate.
Western blotting
HepG2 cells were collected and lysed using RIPA
lysis buffer. Total protein was quantified using the bicinchoninic
acid assay and 20 µg protein/lane was separated by SDS-PAGE
on a 10% gel. The separated proteins were subsequently transferred
to a polyvinylidene fluoride membrane (Merck KGaA). The membrane
was washed and blocked using TBS/0.1% Tween-20 (TBST) solution with
5% non-fat dry milk for 1 h at room temperature. Primary antibodies
against Bcl-2 (1:1,000; cat. no. 12789-1-AP; ProteinTech Group,
Inc.), Bax (1:2,000; cat. no. 50599-2-Ig, ProteinTech Group, Inc.),
CytC (1:10,000; Abcam) and β-actin (1:10,000; cat. no. 60008-1-Ig,
ProteinTech Group, Inc.) were diluted in TBST/3% bovine serum
albumin (cat. no. 9048-46-8, Sigma-Aldrich; Merck KGaA) and
incubated with the membrane at room temperature for 1 h. Following
primary antibody incubation, the membrane was washed and incubated
with a goat anti-mouse secondary antibody (dilution: 1:1,000; cat.
no. sc-2039; Santa Cruz Biotechnology, Inc.) for 1 h at room
temperature. Protein bands were visualized using a Gel Doc XR
imaging system (Bio-Rad Laboratories, Inc.) and analyzed using
Quantity One image analysis software (version 4.62; Bio-Rad
Laboratories, Inc.). IPP software was used for protein band grey
scale measurement.
Statistical analysis
The data were analyzed using SPSS software (version
22.0; IBM Corp.). One-way analysis of variance followed by the
Student-Newman-Keuls post hoc test was used to evaluate the
differences between the treatment groups. The synergistic effect of
TA and CDDP may be predicted using an isobologram, a graph
constructed on a coordinate system composed of the individual drug
doses. The graph commonly contains a straight line of additivity,
the isobol, that is constructed based on the maximum additive
efficacy of two drugs, and is employed to distinguish additive from
synergistic and antagonistic interactions (34). When the observed data points
predominantly fell on the left- or right-hand side of the isobol,
the combinations were considered to have a synergistic and
antagonistic effect, respectively. Combinations with P>0.05
indicated additive to synergistic (or additive to antagonistic)
effects. The results are presented as mean ± standard deviation,
and P<0.05 was considered to indicate statistically significant
differences.
Results
Combined TA and CDDP treatment
suppresses HepG2 cell viability and affects cell morphology
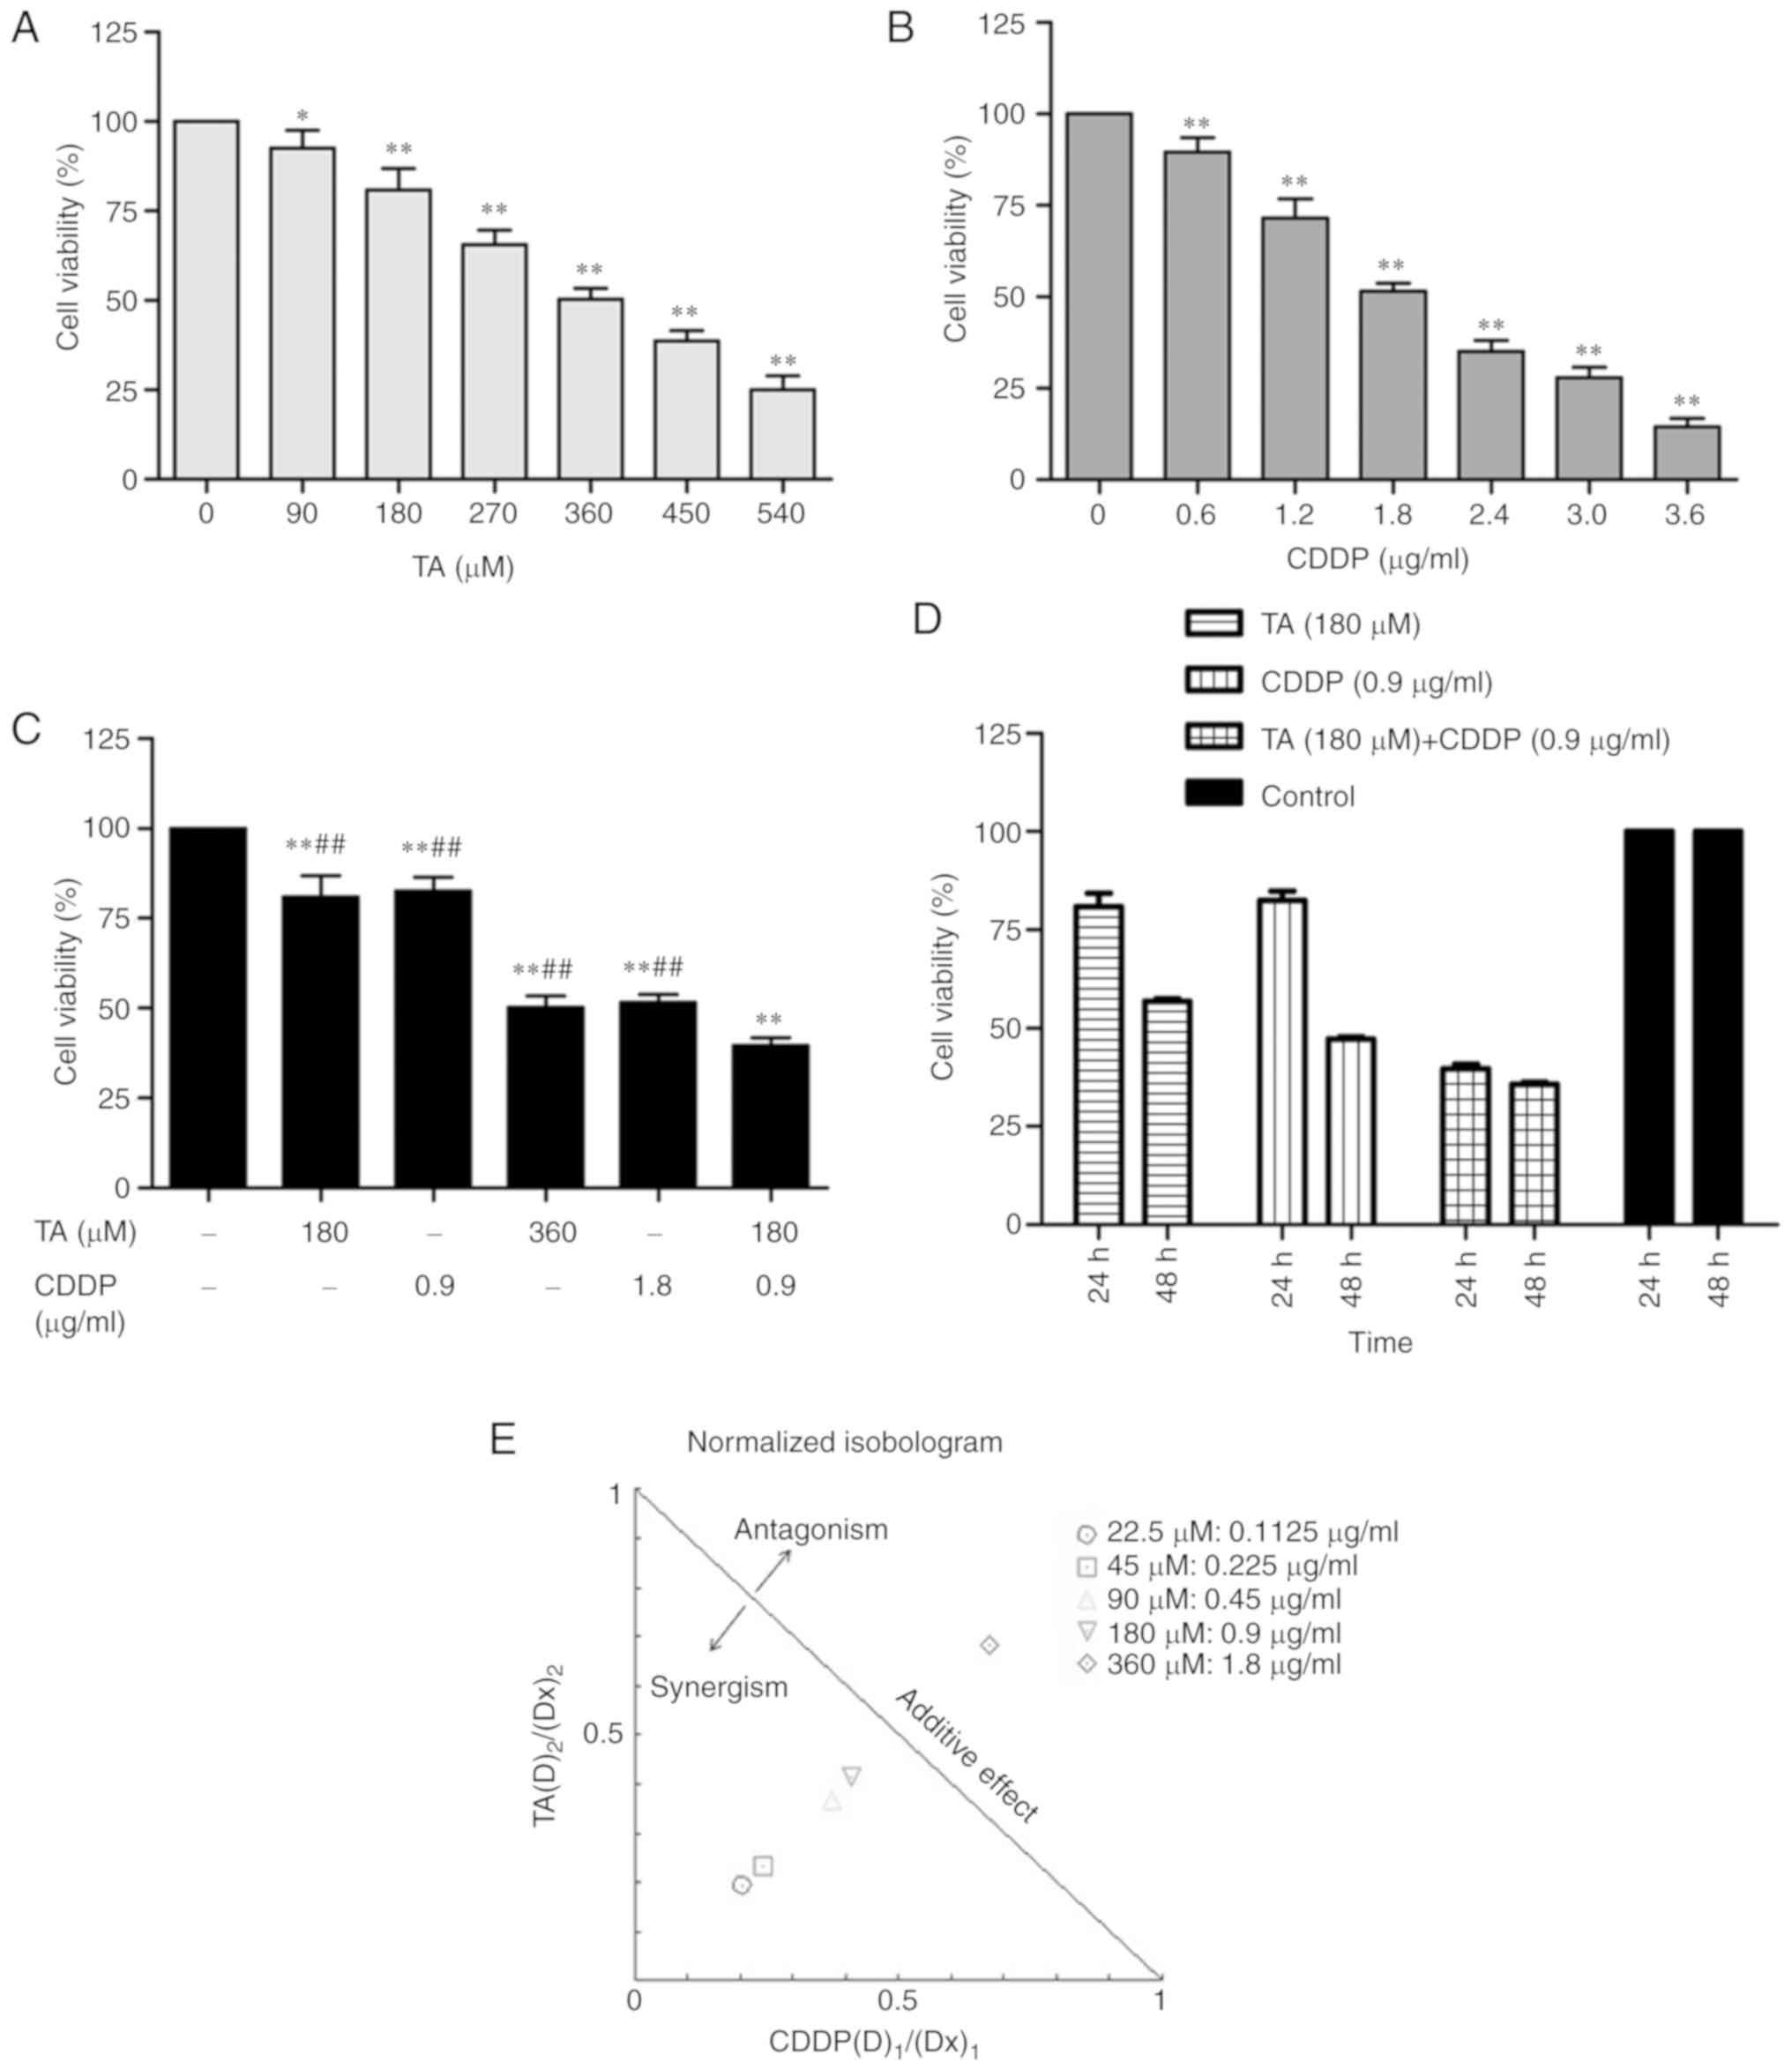
The MTT assay was performed to investigate the
effect of treatment with TA or CDDP on the viability of HepG2
cells. The results demonstrated that both TA and CDDP significantly
decreased cell viability (P<0.01). The inhibition was
dose-dependent and the half maximal inhibitory concentration
(IC50) values were 360 µM and 1.8 µg/ml, respectively
(Fig. 1A and B).
The synergistic effect of drugs may be determined
using CI and DRI. In the present study, the combined inhibition
rate of TA and CDDP dose-dependently increased from 9 to 70%, and
the corresponding CIs were 0.44, 0.48, 0.70, 0.75 and 1.35,
respectively. This suggests that the combined use of TA and CDDP
exerted a synergistic effect on HepG2 cells. The dose ratios of TA
and CDDP fell within a range of 1.4–4.0 and 1.6–5.3, respectively
(Table I). The required doses of TA
and CDDP were markedly decreased when the two drugs were used in
combination (Table I).
 | Table I.Combination index (CI) and dose
reduction index (DRI) for the drug combination of TA and CDDP. |
Table I.
Combination index (CI) and dose
reduction index (DRI) for the drug combination of TA and CDDP.
|
|
| TA (µM) |
| CDDP (µg/ml) |
|
|---|
|
|
|
|
|
|
|
|---|
| Growth inhibition
rate (%) | CI | Single | Combined | DRI | Single | Combined | DRI |
|---|
| 9 | 0.44 | 90 | 22.5 | 4.0 | 0.6 | 0.1125 | 5.3 |
| 22 | 0.48 | 180 | 45 | 4.0 | 1.0 | 0.225 | 4.4 |
| 32 | 0.70 | 240 | 90 | 2.7 | 1.4 | 0.45 | 3.1 |
| 61 | 0.75 | 450 | 180 | 2.5 | 2.6 | 0.9 | 2.9 |
| 70 | 1.35 | 510 | 360 | 1.4 | 2.8 | 1.8 | 1.6 |
HepG2 cells were exposed to a combination of TA and
CDDP at their respective half IC50 values (TA, 180 µM;
CDDP, 0.9 µg/ml). While the individual inhibition rate was
19.1±6.0% for TA and 17.5±4.0% for CDDP, the combined inhibition
rate increased up to 60.3±2.0%. Further statistical analysis
indicated that the combined inhibition rate was significantly
increased compared with that of TA or CDDP alone (P<0.01;
Fig. 1C and D).
In the present study, the majority of the dose ratio
points for TA and CDDP were on the left side of the isobol
(Fig. 1E), indicating that TA and
CDDP exerted synergistic effects on HepG2 cells.
TA and CDDP synergistically increase
apoptosis in HepG2 cells
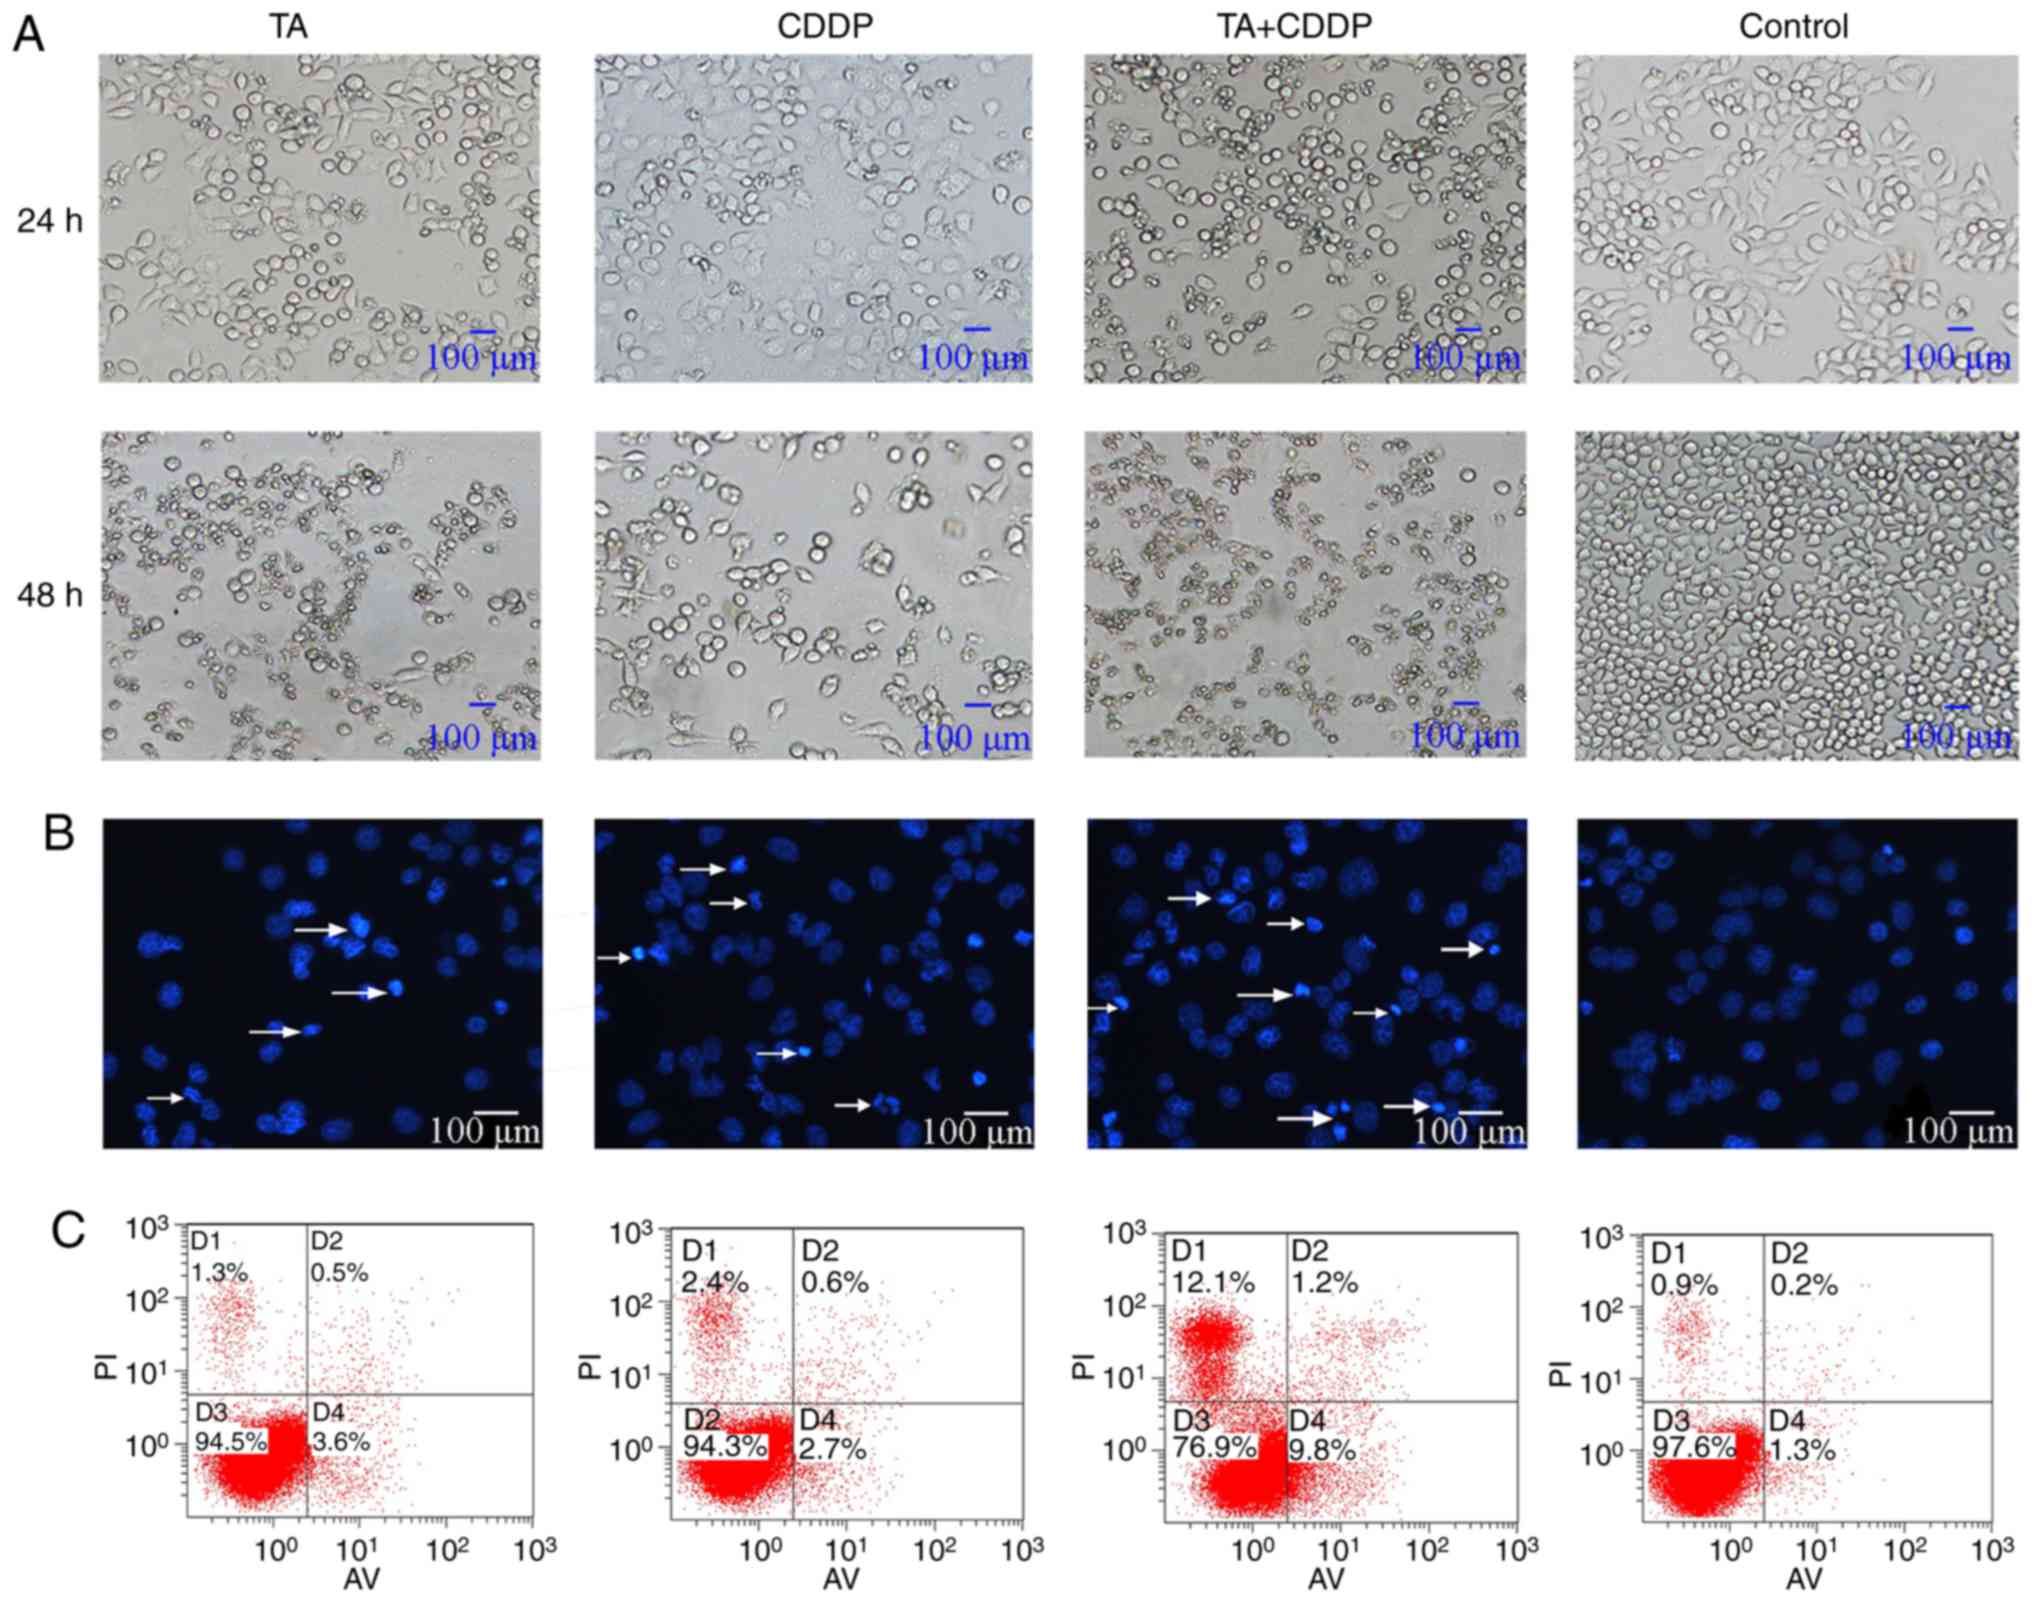
Control cells appeared morphologically normal. The
cells were spindle- or polygonal-shaped in nature, had clear
boundaries and had a homogenous cell refractive index.
Additionally, all cells were attached to the bottom of the dish. By
contrast, a large proportion of cells exposed to TA or CDDP for 24
h had detached, shrunk, become rounded and had a low refractive
index. Furthermore, cells exposed to a combination of TA and CDDP
for 24 h had detached and died, and the cell fragments had a very
low refractive index (Fig. 2A).
Additionally, DAPI staining revealed that the nuclei
of the control cells appeared light blue in color, were round or
oval-shaped, and had a homogenous distribution of chromatin. A
proportion of the nuclei of TA- or CDDP-treated cells appeared
condensed and dark blue. In HepG2 cells treated with a combination
of TA and CDDP, several nuclei were fragmented, and the cells had
split into apoptotic bodies of various sizes (Fig. 2B, arrows), which represent the typical
morphological characteristics of apoptosis.
To further verify that TA and CDDP synergistically
increase the apoptosis of HepG2 cells, Annexin V-FITC/PI analysis
was performed to detect cells in the early and late stages of
apoptosis. The results indicated that the cells exposed to a
combination of TA and CDDP for 24 h exhibited the highest
percentage of apoptosis (20.9±2%), while the control, TA and CDDP
groups exhibited apoptotic percentages of 2.6±0.2, 4.8±0.5 and
4.6±0.8%, respectively. The apoptotic rates in the three treatment
groups were significantly higher compared with the control group
(P<0.01). Furthermore, the apoptotic rate of the TA + CDDP group
was significantly higher compared with that of any of the other
groups (P<0.01; Fig. 2C).
Combination treatment with TA and CDDP
activates mitochondria-mediated apoptosis
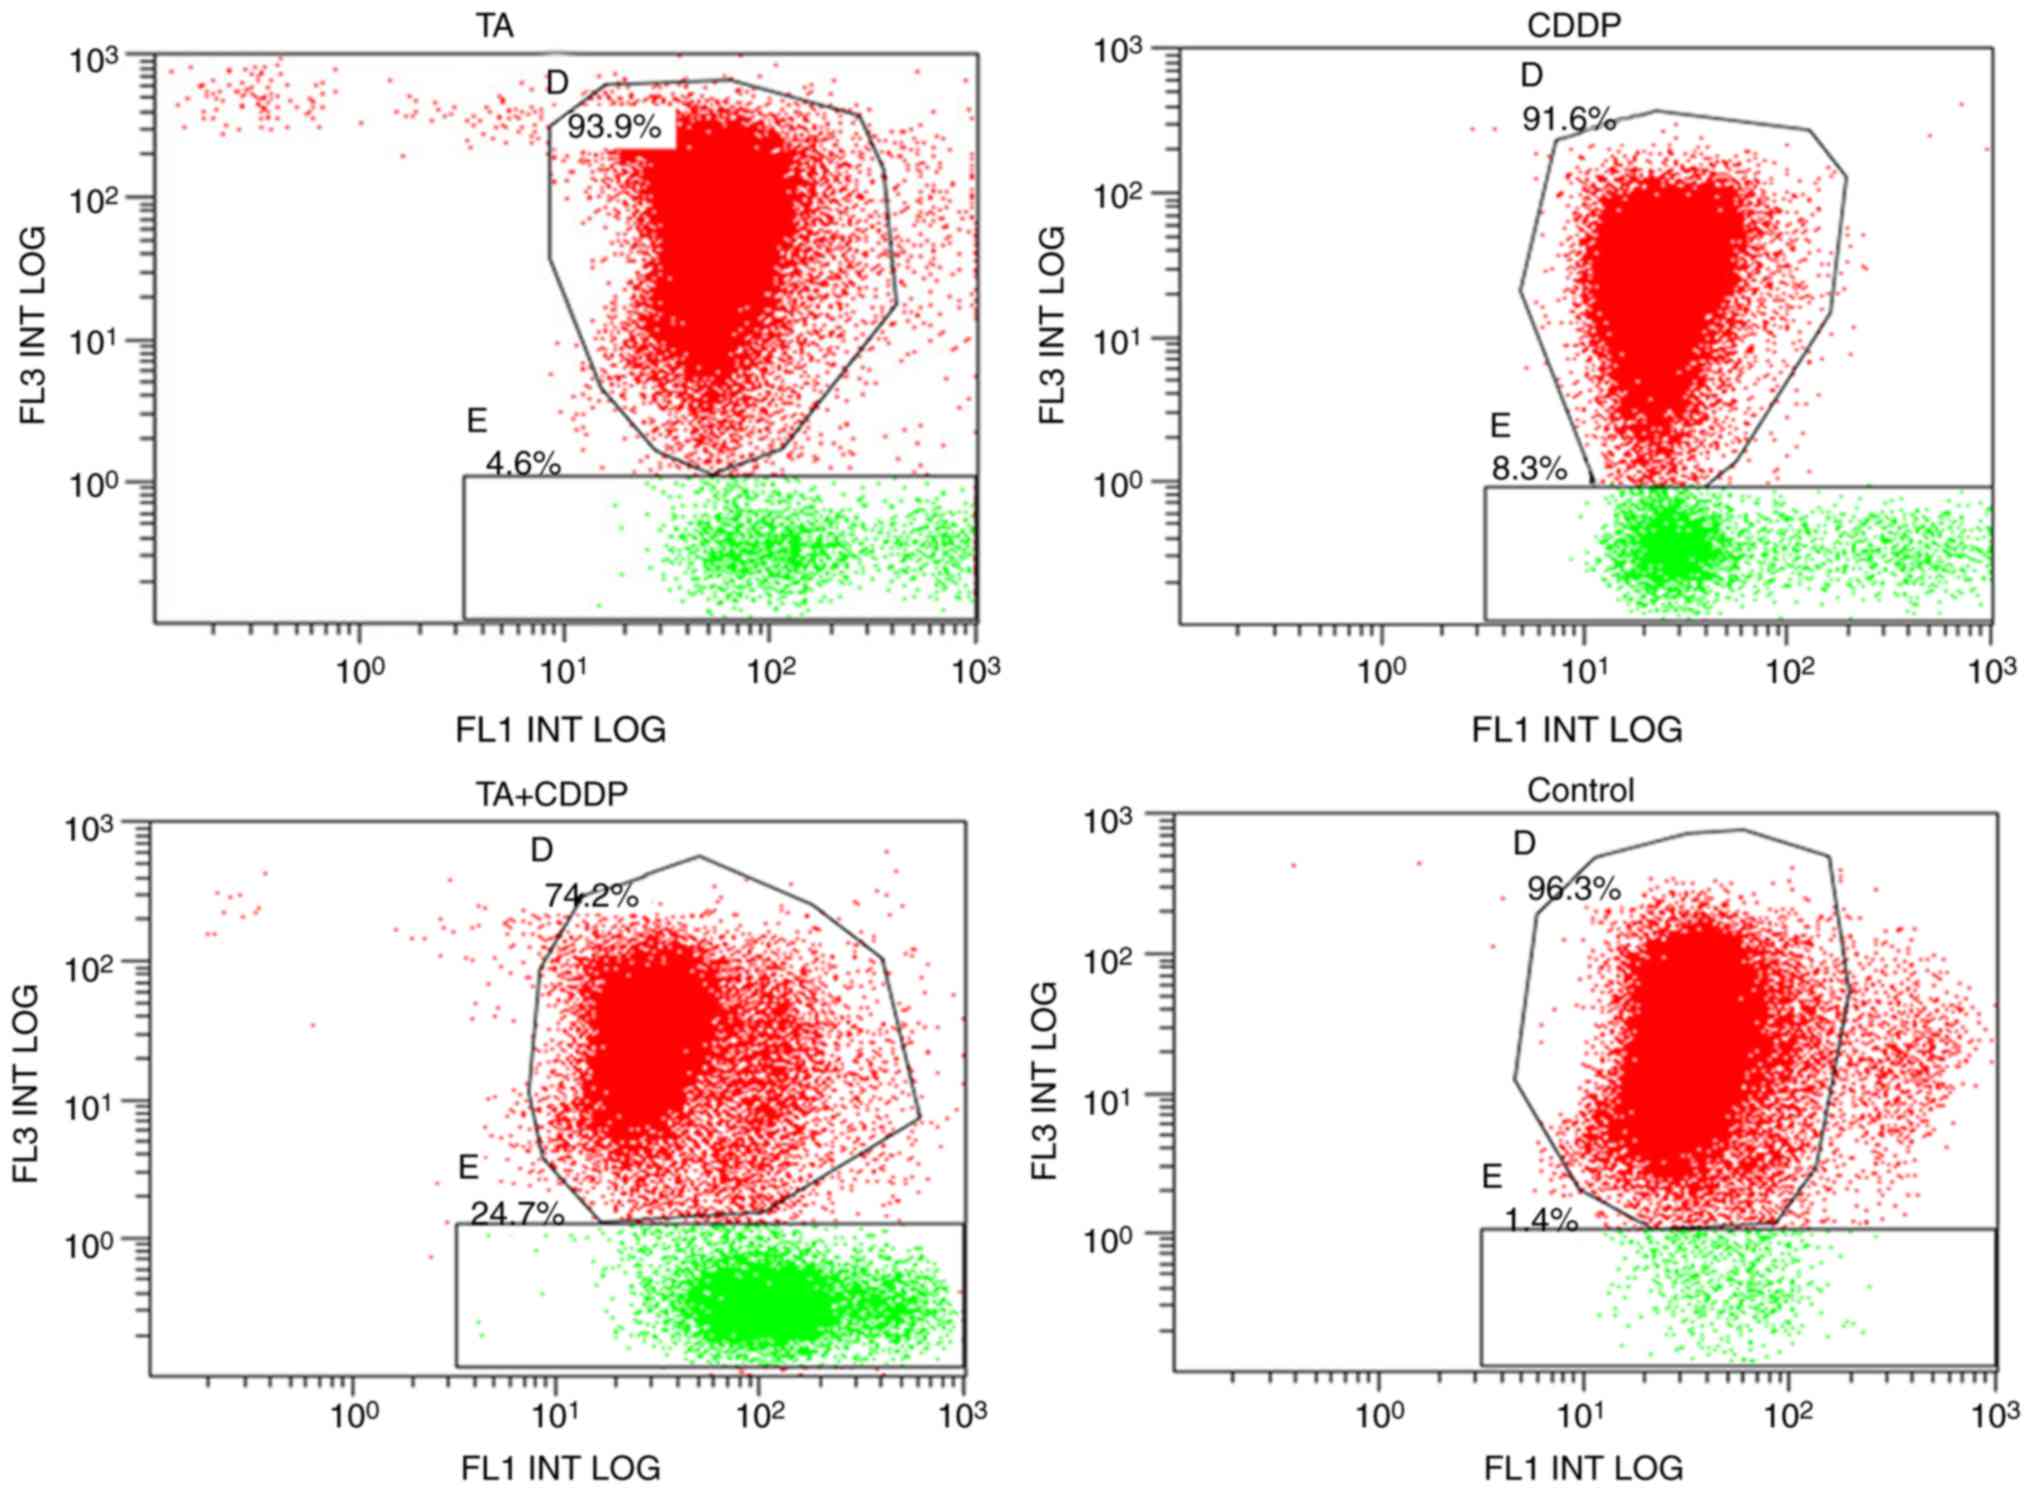
To determine whether TA and CDDP synergistically
promoted mitochondrial-induced apoptosis, an MTP assay was
performed using a JC-1 kit. JC-1 accumulates in mitochondria in a
membrane potential-dependent manner, which may be detected by a
fluorescence emission shift from green (~529 nm) to red (~590 nm).
Mitochondrial depolarization is determined based on the decrease in
the red/green fluorescence intensity ratio. Therefore, the JC-1
fluorescent dye may be used as an indicator of MTP in cells. The
shift of JC-1 fluorescence from red to green represents early
apoptosis. In the present study, the MTP declining rate for the
control group was 1.7±0.3%, and the declining rates for the TA,
CDDP and TA + CDDP groups following 24 h of treatment were 6.2±2.0,
4.3±0.3 and 24.2±0.5%, respectively. The MTP declining rate in the
three treatment groups was significantly higher compared with that
in the control group (P<0.01), and the MTP declining rate of the
TA + CDDP group was significantly higher compared with that in the
TA or CDDP alone groups (P<0.01). These results further
demonstrated that a combination of TA and CDDP synergistically
increased early apoptotic events in HepG2 cells (Fig. 3).
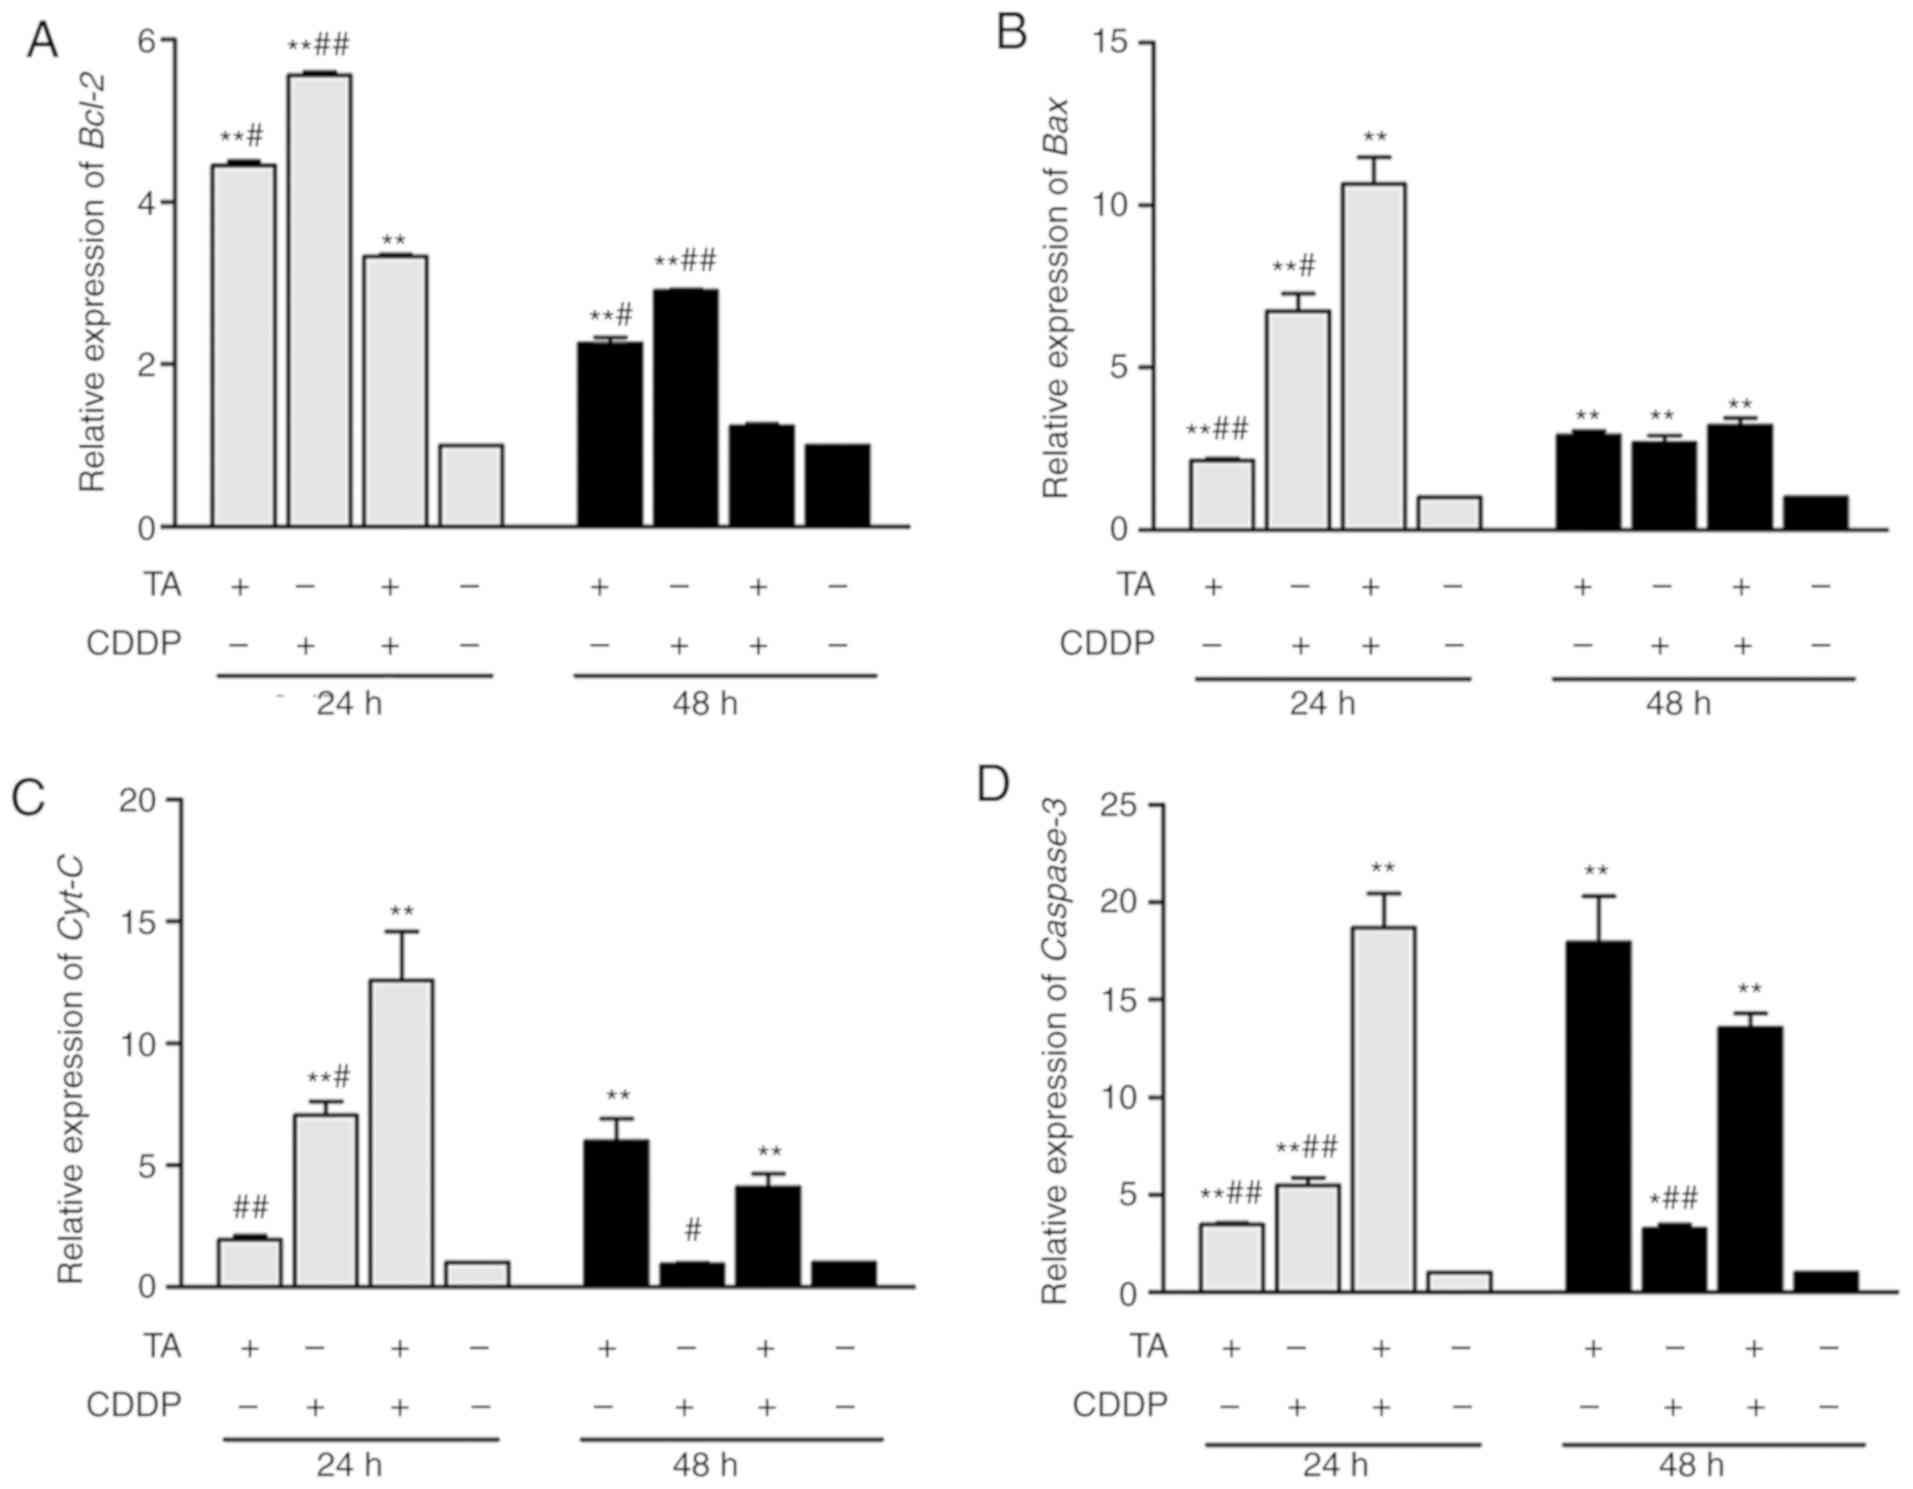
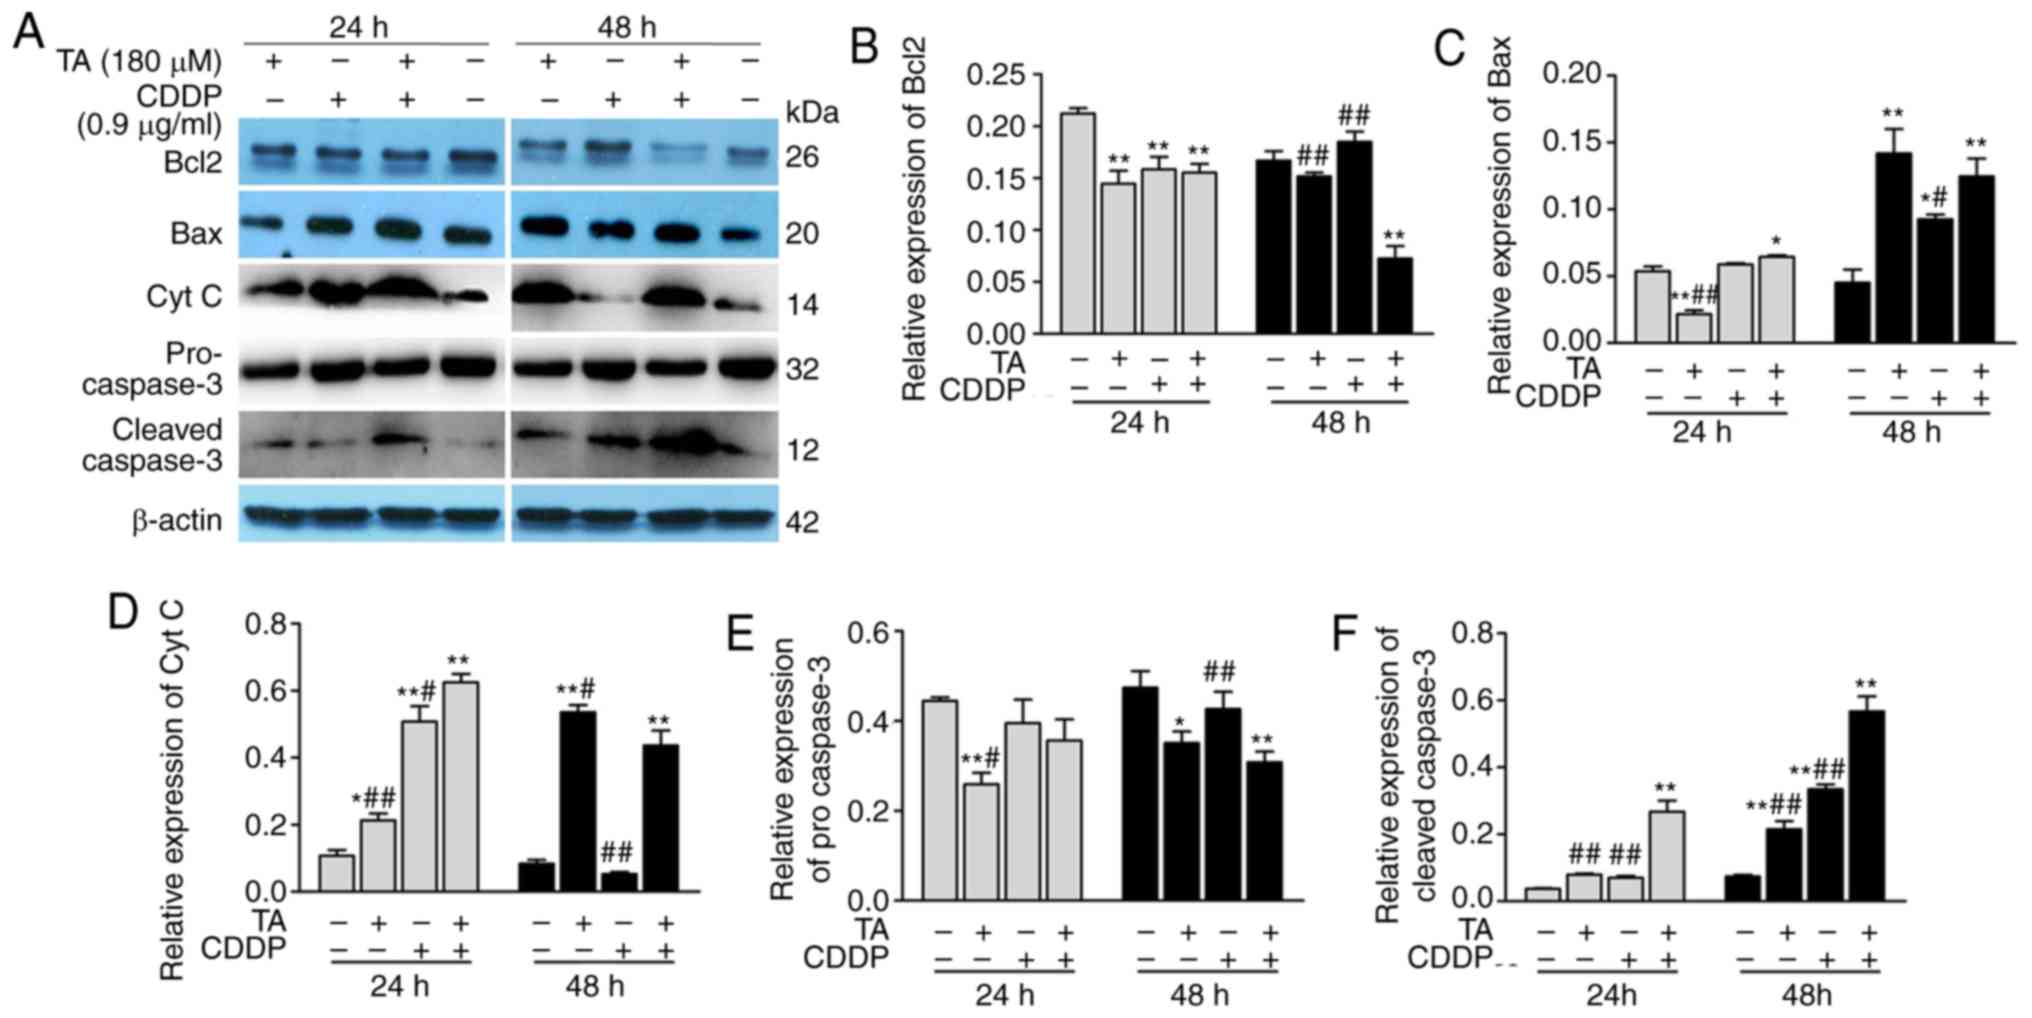
To determine whether the mitochondrial-induced
apoptotic pathway in HepG2 cells was activated by TA and CDDP, the
expression of apoptosis-associated genes was investigated by
RT-qPCR analysis and western blotting. The results revealed that
Bcl-2 expression was downregulated, while Bcl-2 expression was
upregulated following exposure to a combination of TA + CDDP for 48
h (Figs. 4A, 5A and B). Furthermore, Bax (Figs. 4B, 5A and
C), CytC (Figs. 4C, 5A and D), caspase-3 and cleaved caspase-3
were upregulated, while procaspase-3 was downregulated (Figs. 4D and 5A, E
and F).
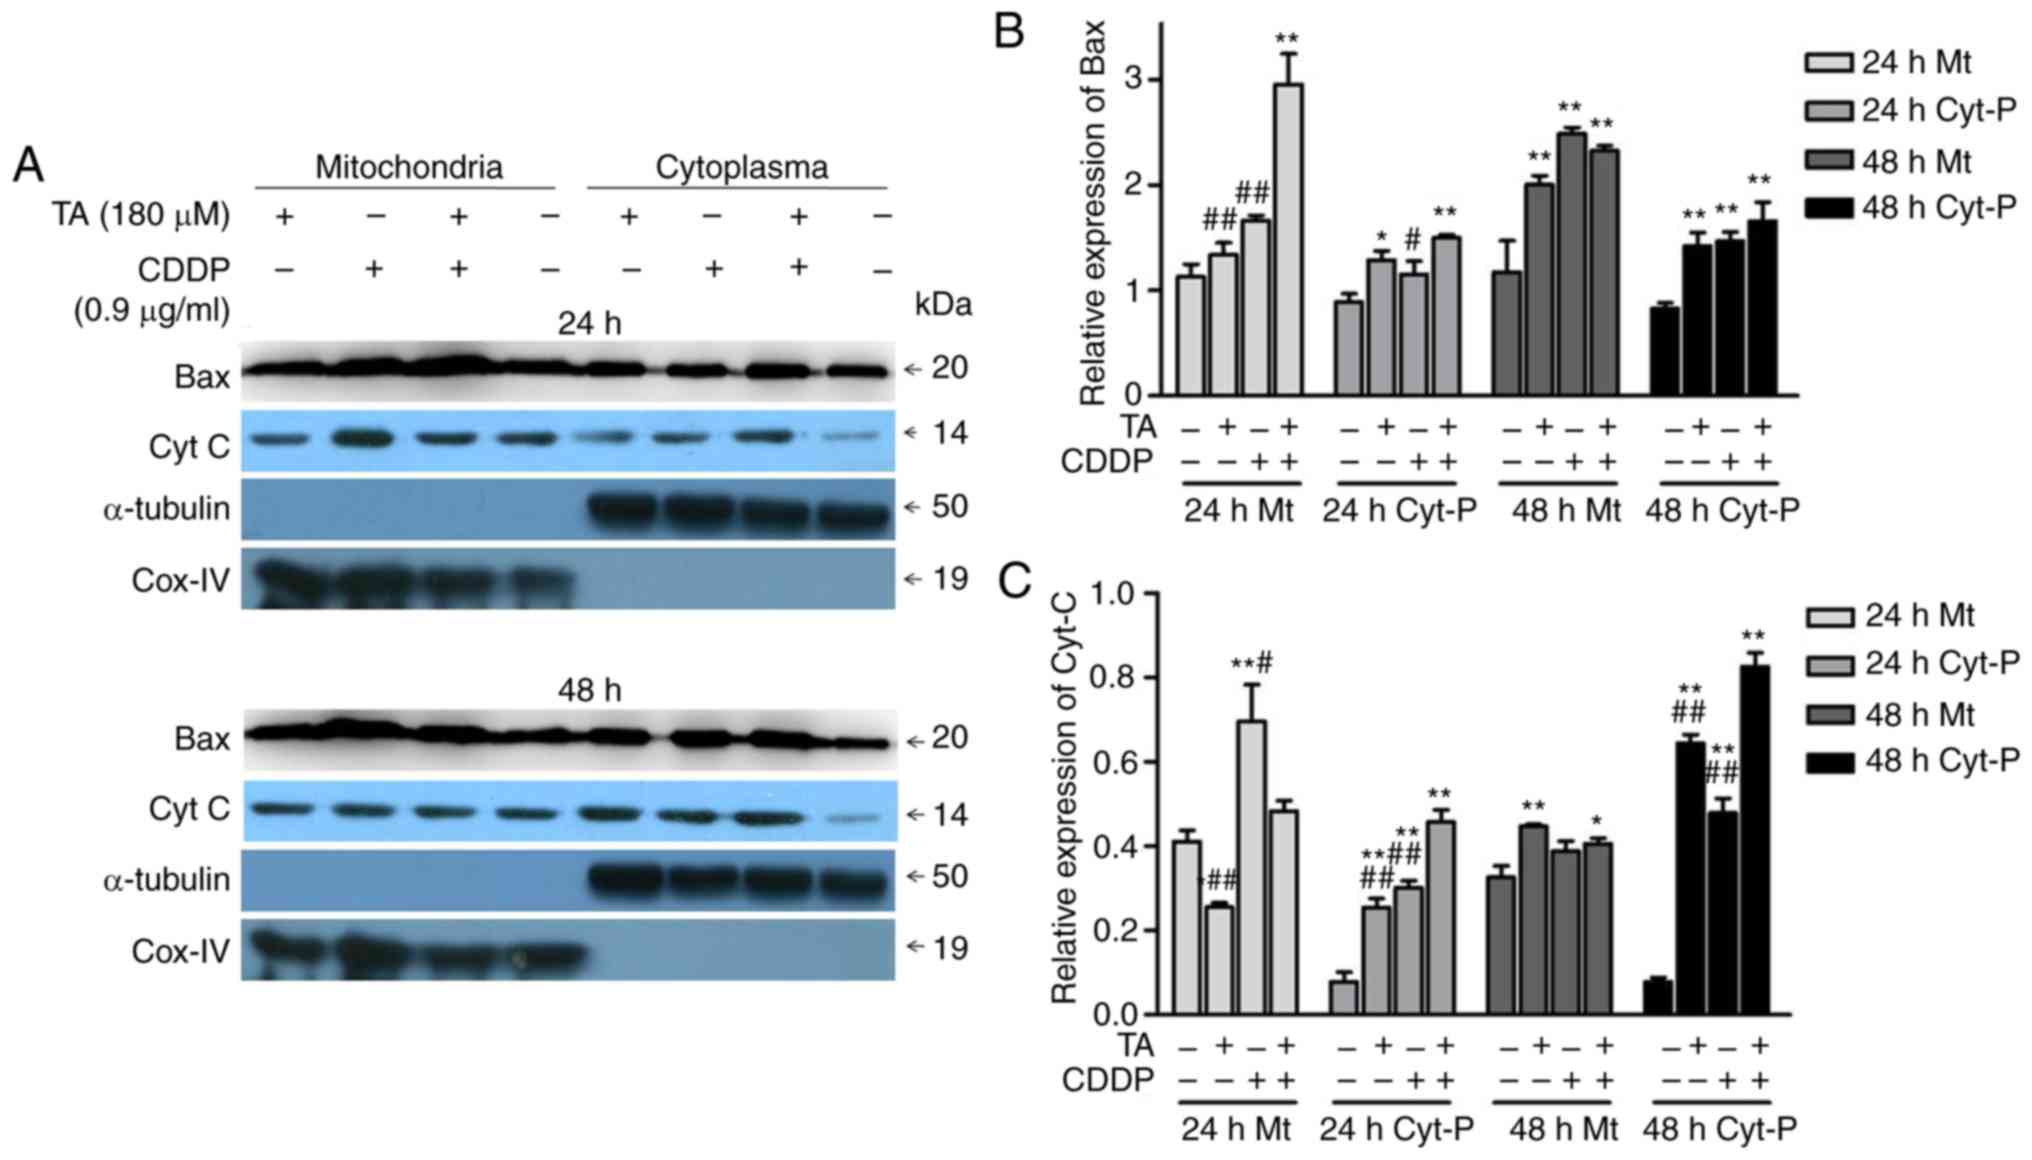
In addition, the combination of TA and CDDP promoted
the release of CytC from the mitochondria into the cytoplasm, while
a proportion of Bax translocated from the cytoplasm into the
mitochondria (Fig. 6A-C). These data
suggested that TA + CDDP treatment induced apoptosis through a
mitochondria-mediated signaling pathway.
Discussion
CDDP is a commonly used anticancer agent and TA has
previously been reported to suppress the growth of different types
of cancer cells. The present study provided novel and direct
evidence that the combination of TA and CDDP synergistically
inhibited the growth of the liver cancer cell line HepG2. When the
drugs were used alone, the IC50 of TA and CDDP was 360
µM and 1.8 µg/ml, respectively. For the combination treatment, half
the dose of the IC50 of each drug was used, and a
significantly more prominent inhibitory effect was observed in
HepG2 cells compared with the use of either drug alone.
Of note, although the HepG2 was originally
considered to be a hepatocellular carcinoma (HCC) cell line, it has
now been shown that it was likely derived from a hepatoblastoma
(http://web.expasy.org/cellosaurus/CVCL_0027). In the
present study, the growth of HepG2 cells was found to be
synergistically suppressed by the combination of TA and CDDP,
whereas this does not exclude the possibility that the combination
of these two drugs may also be able to inhibit other types of liver
cancer, such as HCC, which merits further investigation.
The results obtained in the present study indicated
that exposing HepG2 cells to a combination of TA and CDDP for 24 h
decreased the MTP and upregulated Bcl-2, Bax and CytC. Following
exposure for 48 h, Bcl-2 was significantly downregulated, while Bax
and CytC remained upregulated. These results indicate that HepG2
cells attempted to resist treatment by upregulating Bcl-2 at the
early stage of apoptosis. However, continued exposure to TA and
CDDP resulted in irreversible apoptosis, demonstrated by the
downregulation of Bcl-2, the upregulation of Bax, the release of
CytC and the activation of caspase-3. Isolation of mitochondria
from the cytoplasm and subsequent western blot analysis further
demonstrated that the combination of TA and CDDP promoted the
release of CytC into the cytoplasm, and the translocation of Bax
from the cytoplasm into the mitochondria. CytC plays an important
role in mitochondria-mediated apoptosis. Under normal conditions,
CytC is located in the inner membrane of the mitochondria and
cannot pass through the outer membrane. The release of CytC is a
marker of activation of mitochondria-mediated apoptosis (35). Therefore, a combination of TA and CDDP
may synergistically induce the opening of the transmembrane pores,
leading to enhanced permeability of the pores and decreasing the
MTP. These events ultimately result in mitochondria-mediated
apoptosis. Since CDDP inhibits tumor cell growth via autophagy, it
is likely that TA plays a key role in mitochondria-mediated
apoptosis in HepG2 liver cancer cells. Indeed, previous reports
have demonstrated that TA is able to induce mitochondria-mediated
apoptosis in certain types of cancer cell lines, such as the
gingival cancer cell line YD-38, breast cancer cells, and the
glioma cell line T98G (23,24,36). Our
findings in HepG2 liver cancer cells are consistent with those
reports.
In addition, previous studies have revealed that
CDDP in combination with other anticancer agents, such as
acetazolamide, cetuximab, 5-fluorouracil and metalloproteinase 3,
may enhance the chemosensitivity of cancer cells and improve
survival outcomes (6–9). However, those anticancer agents are
usually associated with considerable toxic side effects. The
findings of the present study demonstrated that TA was able to
synergistically enhance the anticancer effect of CDDP, even at
their respective half IC50 values (TA, 180 µM; CDDP, 0.9
µg/ml). The combined inhibition rate was 3-fold higher compared
with that by CDDP alone. Since TA is a natural plant polyphenol and
has been widely used as a dietary supplement, its favorable
toxicity profile makes it superior to other anticancer agents.
In conclusion, the present study revealed that a
combination of TA and CDDP significantly increased the anticancer
effect on HepG2 cells compared with either drug alone, which may
substantially decrease the toxicity to normal cells. These results
provide novel insights into targeted chemotherapy for liver
cancer.
Acknowledgements
The authors are grateful to Professor Zhimin Zhang
and Dr Youfu Pan at Zunyi Medical University for their advice.
Funding
The present study was supported by the National
Natural Science Foundation of China (grant no. 81760508), the
Natural Science Foundation of Guizhou Province [grant no. LH
(2014)7548], the Creative Team of Special Drug in Education Office
of Guizhou Province [grant no. (2013)15] and the Master's
Scientific Fund of Zunyi Medical University (grant nos. F-841 and
F-827).
Availability of data and materials
All the datasets generated and analyzed in the
present study are included in this published article.
Authors' contributions
XL, MW and JC designed the study, analyzed the data
and wrote the manuscript. NG and XZ performed most of the
experiments such as cell culture, cell viability assay cell
morphological analysis, apoptosis assay, RT-PCR and western blot
analysis. LY participated in some of the western blotting
experiments. All authors read and approved the final
manuscript.
Ethics approval and consent to
participate
Not applicable.
Patient consent for publication
Not applicable.
Competing interests
The authors declare that they have no competing
interests.
Glossary
Abbreviations
Abbreviations:
|
CDDP
|
cis-dichlorodiamine
platinum
|
|
TA
|
tannic acid
|
|
MTP
|
mitochondrial transmembrane
potential
|
|
CI
|
combination index
|
|
DRI
|
dose reduction index
|
|
CytC
|
cytochrome c
|
References
|
1
|
Ferrin G, Aguilar-Melero P,
Rodriguez-Peralvarez M, Montero-Alvarez JL and de la Mata M:
Biomarkers for hepatocellular carcinoma: Diagnostic and therapeutic
utility. Hepat Med. 7:1–10. 2015. View Article : Google Scholar : PubMed/NCBI
|
|
2
|
Proença de Moraes T, Massignan B,
Figueiredo AE, Barretti P, Olandoski M, Kirk A and Pecoits-Filho R:
Systemic lupus erythematous and clinical outcomes in peritoneal
dialysis. Lupus. 24:290–298. 2015. View Article : Google Scholar : PubMed/NCBI
|
|
3
|
Torre LA, Bray F, Siegel RL, Ferlay J,
Lortet-Tieulent J and Jemal A: Global cancer statistics, 2012. CA
Cancer J Clin. 65:87–108. 2015. View Article : Google Scholar : PubMed/NCBI
|
|
4
|
Ferlay J, Soerjomataram I, Dikshit R, Eser
S, Mathers C, Rebelo M, Parkin DM, Forman D and Bray F: Cancer
incidence and mortality worldwide: Sources, methods and major
patterns in GLOBOCAN 2012. Int J Cancer. 136:E359–E386. 2015.
View Article : Google Scholar : PubMed/NCBI
|
|
5
|
Chen W, Zheng R, Baade PD, Zhang S, Zeng
H, Bray F, Jemal A, Yu XQ and He J: Cancer statistics in China,
2015. CA Cancer J Clin. 66:115–132. 2016. View Article : Google Scholar : PubMed/NCBI
|
|
6
|
Gao H, Dong H, Li G and Jin H: Combined
treatment with acetazolamide and cisplatin enhances
chemosensitivity in laryngeal carcinoma Hep-2 cells. Oncol Lett.
15:9299–9306. 2018.PubMed/NCBI
|
|
7
|
Peng F, Zhang H, Du Y and Tan P: Cetuximab
enhances cisplatin-induced endoplasmic reticulum stress-associated
apoptosis in laryngeal squamous cell carcinoma cells by inhibiting
expression of TXNDC5. Mol Med Rep. 17:4767–4776. 2018.PubMed/NCBI
|
|
8
|
Hoch MA, Cousins K, Nartey R, Riley K and
Hartranft M: Two cases of combination therapy with cetuximab,
paclitaxel, and cisplatin for advanced head and neck cancer. J
Oncol Pharm Pract. 24:553–554. 2018. View Article : Google Scholar : PubMed/NCBI
|
|
9
|
Shen X, Gao X, Li H, Gu Y and Wang J:
TIMP-3 increases the chemosensitivity of laryngeal carcinoma to
cisplatin via facilitating mitochondria-dependent apoptosis. Oncol
Res. 27:73–80. 2018. View Article : Google Scholar : PubMed/NCBI
|
|
10
|
Manohar S and Leung N: Cisplatin
nephrotoxicity: A review of the literature. J Nephrol. 31:15–25.
2018. View Article : Google Scholar : PubMed/NCBI
|
|
11
|
Paken J, Govender CD, Pillay M and Sewram
V: Cisplatin-associated ototoxicity: A review for the health
professional. J Toxicol. 2016:18093942016. View Article : Google Scholar : PubMed/NCBI
|
|
12
|
Barabas K, Milner R, Lurie D and Adin C:
Cisplatin: A review of toxicities and therapeutic applications. Vet
Comp Oncol. 6:1–18. 2008. View Article : Google Scholar : PubMed/NCBI
|
|
13
|
Palmieri A, Iapichino A, Cura F, Scapoli
L, Carinci F, Mandrone M and Martinelli M: Pre-treatment with
berberine enhances effect of 5-fluorouracil and cisplatin in HEP2
laryngeal cancer cell line. J Biol Regul Homeost Agents. 32 (Suppl
1):S167–S177. 2018.
|
|
14
|
Matoba T, Ijichi K, Yanagi T, Kabaya K,
Kawakita D, Beppu S, Torii J and Murakami S: Chemo-selection with
docetaxel, cisplatin and 5-fluorouracil (TPF) regimen followed by
radiation therapy or surgery for pharyngeal and laryngeal
carcinoma. Jpn J Clin Oncol. 47:1031–1037. 2017. View Article : Google Scholar : PubMed/NCBI
|
|
15
|
Lohitesh K, Chowdhury R and Mukherjee S:
Resistance a major hindrance to chemotherapy in hepatocellular
carcinoma: An insight. Cancer Cell Int. 18:442018. View Article : Google Scholar : PubMed/NCBI
|
|
16
|
Ryu SH and Chung YH: How to overcome
multidrug resistance in chemotherapy for advanced hepatocellular
carcinoma. Liver Int. 30:496–498. 2010. View Article : Google Scholar : PubMed/NCBI
|
|
17
|
Sun Y, Zhang T, Wang B, Li H and Li P:
Tannic acid, an inhibitor of poly(ADP-ribose) glycohydrolase,
sensitizes ovarian carcinoma cells to cisplatin. Anticancer Drugs.
23:979–990. 2012.PubMed/NCBI
|
|
18
|
Booth BW, Inskeep BD, Shah H, Park JP, Hay
EJ and Burg KJ: Tannic Acid preferentially targets estrogen
receptor-positive breast cancer. Int J Breast Cancer.
2013:3696092013. View Article : Google Scholar : PubMed/NCBI
|
|
19
|
Tikoo K, Sane MS and Gupta C: Tannic acid
ameliorates doxorubicin-induced cardiotoxicity and potentiates its
anticancer activity: Potential role of tannins in cancer
chemotherapy. Toxicol Appl Pharmacol. 251:191–200. 2011. View Article : Google Scholar : PubMed/NCBI
|
|
20
|
Cass CA and Burg KJ: Tannic acid
cross-linked collagen scaffolds and their anticancer potential in a
tissue engineered breast implant. J Biomater Sci Polym Ed.
23:281–298. 2012. View Article : Google Scholar : PubMed/NCBI
|
|
21
|
Chen KS, Hsiao YC, Kuo DY, Chou MC, Chu
SC, Hsieh YS and Lin TH: Tannic acid-induced apoptosis and
-enhanced sensitivity to arsenic trioxide in human leukemia HL-60
cells. Leuk Res. 33:297–307. 2009. View Article : Google Scholar : PubMed/NCBI
|
|
22
|
Cosan D, Soyocak A, Basaran A, Degirmenci
I and Gunes HV: The effects of resveratrol and tannic acid on
apoptosis in colon adenocarcinoma cell line. Saudi Med J.
30:191–195. 2009.PubMed/NCBI
|
|
23
|
Darvin P, Baeg SJ, Joung YH, Sp N, Kang
DY, Byun HJ, Park JU and Yang YM: Tannic acid inhibits the
Jak2/STAT3 pathway and induces G1/S arrest and mitochondrial
apoptosis in YD-38 gingival cancer cells. Int J Oncol.
47:1111–1120. 2015. View Article : Google Scholar : PubMed/NCBI
|
|
24
|
Darvin P, Joung YH, Kang DY, Sp N, Byun
HJ, Hwang TS, Sasidharakurup H, Lee CH, Cho KH, Park KD, et al:
Tannic acid inhibits EGFR/STAT1/3 and enhances p38/STAT1 signalling
axis in breast cancer cells. J Cell Mol Med. 21:720–734. 2017.
View Article : Google Scholar : PubMed/NCBI
|
|
25
|
Kamei H, Koide T, Hashimoto Y, Kojima T
and Hasegawa M: Tumor cell growth suppression by tannic acid.
Cancer Biother Radiopharm. 14:135–138. 1999. View Article : Google Scholar : PubMed/NCBI
|
|
26
|
Karakurt S and Adali O: Tannic acid
inhibits proliferation, migration, invasion of prostate cancer and
modulates drug metabolizing and antioxidant enzymes. Anticancer
Agents Med Chem. 16:781–789. 2016. View Article : Google Scholar : PubMed/NCBI
|
|
27
|
Majed F, Rashid S, Khan AQ, Nafees S, Ali
N, Ali R, Khan R, Hasan SK, Mehdi SJ and Sultana S: Tannic acid
mitigates the DMBA/croton oil-induced skin cancer progression in
mice. Mol Cell Biochem. 399:217–228. 2015. View Article : Google Scholar : PubMed/NCBI
|
|
28
|
Nagesh PKB, Hatami E, Chowdhury P, Kashyap
VK, Khan S, Hafeez BB, Chauhan SC, Jaggi M and Yallapu MM: Tannic
acid induces endoplasmic reticulum stress-mediated apoptosis in
prostate cancer. Cancers (Basel). 10:E682018. View Article : Google Scholar : PubMed/NCBI
|
|
29
|
Naus PJ, Henson R, Bleeker G, Wehbe H,
Meng F and Patel T: Tannic acid synergizes the cytotoxicity of
chemotherapeutic drugs in human cholangiocarcinoma by modulating
drug efflux pathways. J Hepatol. 46:222–229. 2007. View Article : Google Scholar : PubMed/NCBI
|
|
30
|
Ngobili TA, Shah H, Park JP, Kwist KW,
Inskeep B, Burg KJ and Booth BW: Remodeling of tannic acid
crosslinked collagen type I induces apoptosis in ER+
breast cancer cells. Anticancer Res. 35:1285–1290. 2015.PubMed/NCBI
|
|
31
|
Nie F, Liang Y, Jiang B, Li X, Xun H, He
W, Lau HT and Ma X: Apoptotic effect of tannic acid on fatty acid
synthase over-expressed human breast cancer cells. Tumour Biol.
37:2137–2143. 2016. View Article : Google Scholar : PubMed/NCBI
|
|
32
|
Zhang J, Chen D, Han DM, Cheng YH, Dai C,
Wu XJ, Che FY and Heng XY: Tannic acid mediated induction of
apoptosis in human glioma Hs 683 cells. Oncol Lett. 15:6845–6850.
2018.PubMed/NCBI
|
|
33
|
Livak KJ and Schmittgen TD: Analysis of
relative gene expression data using real-time quantitative PCR and
the 2(-Delta Delta C(T)) method. Methods. 25:402–408. 2001.
View Article : Google Scholar : PubMed/NCBI
|
|
34
|
Loewe S: The problem of synergism and
antagonism of combined drugs. Arzneimittelforschung. 3:285–290.
1953.PubMed/NCBI
|
|
35
|
Estaquier J, Vallette F, Vayssiere JL and
Mignotte B: The mitochondrial pathways of apoptosis. Adv Exp Med
Biol. 942:157–183. 2012. View Article : Google Scholar : PubMed/NCBI
|
|
36
|
Zielińska-Przyjemska M, Kaczmarek M,
Krajka-Kuźniak V, Łuczak M and Baer-Dubowska W: The effect of
resveratrol, its naturally occurring derivatives and tannic acid on
the induction of cell cycle arrest and apoptosis in rat C6 and
human T98G glioma cell lines. Toxicol In Vitro. 43:69–75. 2017.
View Article : Google Scholar : PubMed/NCBI
|