Introduction
Although a wide array of genes has been studied as
potential prognostic markers in leukemia, a clear mechanistic
understanding has not yet been established. A previous study
seeking markers of minimal residual disease (MRD) in acute myeloid
leukemia (AML) demonstrated that the combined expression of 3 genes
[Wilms tumor 1 (WT1), cyclin A1 (CCNA1) and hemoglobin gamma 2
(HBG2)] could predict MRD in pre- and post-stem cell
transplantation setting (1). In
normal tissues, the expression levels of WT1 and CCNA1 are limited
(2,3);
however, they are found elevated in bone marrow (BM) samples of
adult and pediatric AML cases (4) and
their increased expression is associated with poor clinical
outcomes (5,6). Both genes are, therefore, excellent
candidates for leukemia/MRD therapy and are leading antigen
candidates investigated for AML immunotherapy (7,8).
WT1 is a well-established prognostic and MRD marker
in leukemia, as elevated WT1 levels return to normal when patients
achieve continuous complete remission (9). However, WT1 may not be overexpressed in
all leukemias, and the inclusion of additional gene markers, such
as CCNA1 in PCR-based assays could improve predicted relapse risk
stratification in patients (10), as
an increased CCNA1 expression has been shown to be associated with
a poor prognosis of AML (6) and
pediatric acute lymphocytic leukemia (ALL) patients (11).
WT1 encodes a zinc finger (ZF) transcription factor
that regulates genes, such as vascular endothelial growth factor
(VEGF) and E-cadherin, that play important roles in normal
development, as well as in cancer (12–14).
Common deletions of the WT1 gene identified in patients with Wilms'
tumor involve the loss of all or part of the ZF domain that is
required for DNA and RNA binding (15). Although WT1 has been shown to
transcriptionally regulate the expression of cyclin D1 in non-small
cell lung cancer cells (16) and that
of cyclin E in murine 32D cells (17), the regulation of CCNA1 by WT1 has not
yet been investigated, at least to the best of our knowledge. By
contrast, there has been a report that WT1 isoform ratios were
altered in U937 cells overexpressing CCNA1 (particularly enhancing
the exon 5 retaining isoforms) (18).
CCNA1 is an unusual cyclin in that it is typically
expressed in spermatocytes and hematopoietic progenitor cells
(3). In spermatocytes, CCNA1
regulates the M phase of the meiotic cell cycle and CCNA1 null male
mice are infertile (19). In the BM,
CCNA1 has been shown to regulate pathways that enhance the
interaction of hematopoietic stem and progenitor cells (HSPCs) with
the BM microenvironment. Indeed, both CCNA1 and VEGFR1 are required
for the normal homing of HSPCs in their BM niches (20).
In addition to a potential role in homing, CCNA1 has
also been described as a regulator of cell cycle control (21,22). The
upregulation of CCNA1 has been shown to promote the proliferation
of K562 cells in vitro (23)
and to promote breast tumorigenesis in vivo (24). WT1 has also been shown to be involved
in the cell cycle and proliferation. The upregulation of WT1
expression has been shown to promote the proliferation of non-small
cell lung cancer cell lines (16)
and, conversely, the suppression of WT1 expression has been shown
to inhibit the growth of leukemia cell lines (25,26). These
findings link WT1 and CCNA1 expression to the proliferation of
leukemia cells. Additionally, CCNA1 expression has been linked to
VEGF expression in hormone-dependent prostate and breast cancer
cells (27–29). Tissue microarray analysis has revealed
the elevated expression of CCNA1 and VEGF in prostate cancer
tissues, compared to adjacent benign tissues or benign prostatic
hyperplasia (27,30). Similarly, WT1 expression has been
shown to be elevated in prostate cancer epithelium compared to
adjacent ‘normal’ stromal tissues (31).
In this study, we wished to determine whether the
expression of WT1, CCNA1 and VEGF is elevated in pediatric ALL and
pediatric acute promyelocytic leukemia (APL or AML-M3) BM samples.
Additionally, we wished to determine whether WT1 transcriptionally
regulates CCNA1 and VEGF expression in K562 leukemia cells. Our
findings suggest a possible role for WT1 as a DNA binding
transcription factor which upregulates CCNA1 expression in leukemia
and thereby potentially affects HSPC interactions within their BM
niche.
Materials and methods
Patient samples
Diagnostic BM aspirates from 20 pediatric ALL
patients were obtained in accordance with Akron Children's Hospital
Institutional Review Board (IRB) (Akron, OH, USA) guidelines. Ten
morphologically normal non-leukemic BM (NBM) samples obtained from
patients with non-leukemic disorders (e.g., solid tumor staging
evaluation) were used as controls. NBM controls were bone
marrow-derived mononuclear cells (isolated from non-neoplastic bone
marrow by Ficoll Hypaque gradient centrifugation). The samples that
exhibited high Cq values for GAPDH or 18s RNA, indicative of poor
RNA quality, were omitted from the analysis; thus, 1 ALL and 2
control samples were excluded. The subtypes are listed in Table I, although the majority (16 samples)
were classified as early-B ALL. RNA samples from 10 pediatric APL
(or AML-M3) patients were obtained from the Children's Oncology
Group (COG). COG is the pediatric cancer network component of the
NCI National Clinical Trials Network (www.childrensoncologygroup.org). No data of the
patient characteristics were available for this cohort.
 | Table I.Clinical characteristics of the
pediatric ALL patients (n=19). |
Table I.
Clinical characteristics of the
pediatric ALL patients (n=19).
| Characteristic | No. |
|---|
| Male | 9 |
| Female | 10 |
| Median age,
years | 9 |
| Age range,
years | 1–16 |
| Subtypes |
|
| Early B
cell | 16 |
| T-Cell
ALL | 1 |
| T/NK
ALL | 1 |
|
ALL-L3 | 1 |
Reverse transcription-quantitative
polymerase chain reaction (RT-qPCR)
Total RNA was isolated from the BM samples using the
5 PRIME PerfectPure RNA Blood kit (Thermo Fisher Scientific,
Waltham, MA, USA) and from K562 leukemia cell line using the Gen
Elute Mammalian Total RNA miniprep kit (Sigma-Aldrich, St. Louis,
MO, USA). The high Capacity cDNA Reverse Transcription kit (Applied
Biosystems, Foster City, CA, USA) was used to prepare cDNA from 1
µg of RNA. For qPCR, cDNA was amplified in a Stratagene 3000MxPro
thermocycler (Agilent Technologies La Jolla, CA, USA) in triplicate
with WT1, CCNA1, VEGF and the endogenous control 18s rRNA and GAPDH
primer/probes (Table IIA and B)
using one of 2 methods: i) Brilliant III Ultra-Fast QPCR master mix
(Agilent Technologies, La Jolla, CA, USA) with Taqman Gene
Expression assays (Applied Biosystems) for AML patient samples and
the K562 leukemia cell line; or ii) SYBR-Green Master Mix (Agilent
Technologies) with primers obtained from Integrated DNA
Technologies (IDT) for the ALL patient samples. The relative
quantification of WT1, CCNA1 and VEGF gene expression in the
leukemia BM vs. NBM, and in the WT1-transfected vs. empty vector
control-transfected K562 cells was calculated using the
2(−ΔΔCq) method (32).
| Table II.Primer sequences. |
Table II.
Primer sequences.
| A, Primers used for
qPCR (SYBR-Green)a |
|---|
|
|---|
| Functional
class | Gene | Forward primer | Reverse primer |
|---|
| Housekeeping | GAPDH |
5′-CCATCACCATCTTCCAGGAG-3′ |
5′-GGATGATGTTCTGGAGAGCC-3′ |
| Transcription
factor | WT1 |
5′-GAGAGCCAGCCCGCTATTC-3′ |
5′-CATGGGATCCTCATGCTTG-3′ |
| Growth control | CCNA1 |
5′-AAGAAGCAGCCAGACATCAC-3′ |
5′-GCAGTTTCCCTCTCAGAACA-3′ |
| Growth control | VEGF |
5′-CGAAACCATGAACTTTCTGC-3′ |
5′-CCTCAGTGGGCACACACTCC-3′ |
|
| B, Primers used
for qPCR (TaqMan)b |
|
| Housekeeping | 18s | Hs99999901_S1 |
| Transcription
factor | WT1 | Hs00240913_m1 |
| Growth control | CCNA1 | Hs00171105_ m1 |
| Growth control | VEGF | Hs00900057_m1 |
|
| C, Primers used
for ChIP |
|
|
| Forward
primer | Reverse
primer |
|
| CCNA1 (site 1) |
5′-GGAAACAGTCCCTTCCAAA-3′ |
5′-TGAATCGGCCAATCAGC-3′ |
| CCNA1 (site 2) |
5′-ACCTGGCTTGTCAGTCACCTAT-3′ |
5′-GTCCCCACGAGAGGTCTTC-3′ |
| CCNA1 (site 3) |
5′-ACAGGTTCCACGAACAAACACTGC-3′ |
5′-AGGAGCATTTCTGTCCTCTTGCCT-3′ |
| Negative control
ChIPc |
5′-TCAGGAGATCGAGACCATCCTGTGTA-3′ |
5′-CAACCTGGCAGTGAATGCTCAACT-3′ |
Oncomine data analysis
The cDNA microarray data submitted by Haferlach
et al (33) in the public
database (www.oncomine.org) was analyzed for WT1,
CCNA1 and VEGF mRNA expression in leukemia samples relative to
control samples. In the Haferlach study, diagnostic samples
(n=2,096) were obtained from 750 ALL, 542 AML, 448 chronic
lymphoblastic leukemia (CLL), 76 chronic myelogenous leukemia
(CML), 206 leukemia precursors (LP) and 74 mononuclear cells (MNC),
investigated across 11 laboratories. The following reporters were
used: WT1 (206067_s_at), CCNA1 (205899_at) and VEGF (210512_s_at),
and the data were grouped by leukemia types, selecting all samples
in the database.
Site-directed mutagenesis
The human WT1 expression construct, pcb6+WT1,
isoform A, was obtained from Dr Frank Rauscher (34). Site-directed mutagenesis was employed
to reproduce a common frameshift/truncation mutation identified
clinically in WT1 gene, the exon 7 frameshift (5,35,36). The ‘mutant’ WT1 expression plasmid was
created with the QuikChange II site-directed mutagenesis kit
(Agilent Technologies) using specific primers (forward,
5′TGTGCGACGTGTGCCCTGGAGTAGCCC-3′; and reverse,
5′-GGGCTACTCCAGGGCACACGTCGCACA-3′) designed using the Agilent
QuikChange Primer Design Program that introduced a single base ‘C’
at position 1303–1304 (NM_024426) at exon 7. The PCR conditions
were as follows: 95°C for 30 sec followed by 18 cycles of 95°C for
30 sec, 68°C for 1 min and 68°C for 18 min. The restriction enzyme,
Dpn1, was added to digest and degrade the parental strands,
and XL-1 Blue Supercompetent cells (Agilent Technologies) were then
transformed with the mutant DNA. Plasmids were purified using the
Qiagen plasmid kit (Qiagen, Valencia, CA, USA) and sequenced to
verify correct base changes. Plasmids were used for transfection as
described below.
Transfection and luciferase
assays
The leukemia cell line, K562 (CCL-243; ATCC,
Manassas, VA, USA), was cultured in RPMI medium with 10% fetal calf
serum and antibiotics (100 IU/ml penicillin and streptomycin) in a
5% CO2 incubator at 37°C. The K562 cells were
transfected with either the wild-type or ZF mutant human WT1
expression plasmids, or the empty vector control using
Lipofectamine LTX and the LTX plus reagent (Thermo Fisher
Scientific). For luciferase assays, the cells were co-transfected
with the CCNA1 luciferase reporter constructs either containing the
distal promoter region (−1,180/+145) or lacking it, referred to as
proximal promoter (−454/+145). Where stated, the murine GFP-tagged
Wt1 expression plasmids were also transfected along with the
proximal or distal CCNA1 luciferase reporter. To examine the
effects of mithramycin A (Sigma-Aldrich) on promoter activity, the
cells were treated with 30 nM mithramycin A for 48 h following
transfection. The luciferase activity of the lysates was measured
on a Turner 20/20n luminometer (Turner Biosystems, Sunnyvale, CA,
USA) and relative light units (RLU) normalized to protein
concentrations were reported.
WT1 binding site prediction and
chromatin immunoprecipitation (ChIP)
A total of 3 kb of the CCNA1 promoter gene sequence
was downloaded from the public database, Ensembl (http://useast.ensembl.org/) and potential WT1 binding
sites (GnGGGnG; Matrix Family Library Version 9.3) were queried
using MatInspector Software (https://www.genomatix.de/). The binding function of
these predicted sites was tested in WT1-transfected K562 cells
using ChIP assays (Millipore EZ-Magna ChIP, Temecula, CA, USA),
following manufacturer's instructions. WT1-bound fragments were
immunoprecipitated using a mix of the WT1 antibodies (2.5 µg each
of N18 and C19; Santa Cruz Biotechnology, Santa Cruz, CA, USA) or 1
µg mouse IgG fraction provided with the kit as a negative control.
WT1 bound chromatin was amplified by end-point PCR using primers
specific for each of the three predicted sites (Table IIC) and analyzed by electrophoresis
in ethidium bromide-containing agarose gels. The specificity of WT1
binding was tested by the amplification of immunoprecipitated
chromatin using negative control primers located approximately 1.5
kb 5′ of the third WT1 site and lacking any potential WT1 binding
sites.
Western blot analysis and
immunofluorescence (IF)
Cell lysates were harvested using RIPA lysis buffer
(Millipore, CA, USA) containing protease inhibitors and EDTA
(Thermo Fisher) from the K562 cells treated with 25 µM curcumin
(Sigma-Aldrich) or 70 nM mithramycin A (Sigma-Aldrich). Protein
concentrations were measured using Bicinchoninic acid protein assay
and twenty-five micrograms of proteins were separated on a 10%
separating gel by gel electrophoresis, and transferred to PVDF
membrane for western blot analysis. The membranes were blocked in
Phosphate Buffer Saline-Tween with 5% non-fat milk and probed
overnight with anti-WT1 at a 1:1,000 dilution (#5G11A5; ab201948;
Abcam, Cambridge, MA, USA), anti-CCNA1 at a 1:1,000 dilution
(#B882; 556600; BD Pharmingen, San Diego, CA, USA) or anti-actin at
a 1:3,000 dilution (#A00702; Genscript, Piscataway, NJ, USA)
primary antibodies and antimouse IgG-HRP at a 1:10,000 dilution
(#HAF007; R&D Biosystems, Minneapolis, MN, USA) as secondary
antibodies. Proteins were visualized by chemiluminescence detection
with Fuji LAS 3000 (GE Healthcare, Piscataway, NJ, USA). The
quantification of the bands was performed using ImageJ Version
1.51p.
The K562 cells treated with 25 µM curcumin or 70 nM
mithramycin A for 48 h were fixed onto poly-lysine coated
coverslips to stain for IF analysis. The coverslips were incubated
with anti-CCNA1 (B882; BD Pharmingen) primary at 1:50 dilution and
Cy3-fluorophore tagged antibodies at 1:1,000 (#115-165-003; Jackson
ImmunoResearch Laboratories, West Grove, PA, USA) and stained with
DAPI (Vector Laboratories, Burlingame, CA, USA). Images were
acquired with a 60X objective lens in bright field and fluorescence
at emission maximum of 461 nm (blue) for DAPI-stained nuclei and
569 nm (red) for Cy3-tagged antibodies and visualized on an Olympus
IX81 microscope (Olympus, Tokyo, Japan). The average staining
intensity was quantified using ImageJ software and the intensity in
the treated cells was plotted relative to the control cells.
MTT and trypan blue dye exclusion
assays
The effects of mithramycin A on K562 cell viability
and proliferation were examined using
3,(4,5-dimethylthiazol-2-yl)-2,5-diphenyl-tetrazolium bromide (MTT)
(Trevigen, Gaithersburg, MD, USA) and trypan blue dye
(Sigma-Aldrich) exclusion assays. Briefly 2.5×10⁴ K562
cells were seeded into 96-well plates in triplicate and treated
with either the diluent control (DMSO), or 50, 70 and 100 nM
mithramycin A for 48 h. The cells were then incubated with MTT
reagent as per the manufacturer's recommendations and the
absorbance was measured with BioTekCytation5 (BioTek Instruments,
Winooski, VT, USA) plate reader at 630 nm for substrate and 570 nm
for background normalization. Average normalized substrate
absorbance values were plotted as percentage of metabolically
active mithramycin A-treated cells relative to the DMSO-treated
control cells. The cells were also stained with trypan blue
(Sigma-Aldrich) and counted on a hemocytometer (Sigma-Aldrich), and
the average numbers of viable cells remaining after 48 h of
treatment were reported.
Statistical analysis
Statistical significance was determined by the
non-parametric Mann-Whitney U test for patient samples using
GraphPad Prism software version 8.0.0. Statistical significance for
experiments using the K562 cells was determined by ordinary one-way
ANOVA, followed by Dunnett's multiple comparison test in
experiments involving >2 groups and the Student's t-test in
experiments involving only 2 groups. Significance was determined at
P<0.05.
Results
WT1 and CCNA1 mRNA levels are elevated
in pediatric AML-M3 BM samples
The expression of WT1, CCNA1 and VEGF was evaluated
by RT-qPCR analysis of 19 pediatric ALL and 10 pediatric AML-M3 BM
samples (Fig. 1A). The low expression
of WT1, CCNA1 and VEGF was observed in the pediatric ALL samples,
with the median WT1 and CCNA1 expression being similar to that in
NBM, while the median VEGF expression was significantly lower
(Fig. 1A, left panel). In the ALL
samples, 6 had elevated (>2-fold above NBM) WT1 levels and 5 had
elevated CCNA1 levels (data not shown), but all had VEGF levels
lower than NBM. In the AML-M3 samples, the median WT1 and CCNA1
expression was higher than that in NBM, while the VEGF levels were
lower (Fig. 1A, right panel). Thus,
across both the ALL and AML-M3 sample sets examined, the VEGF
levels were consistently lower than those in NBM, while the WT1 and
CCNA1 expression levels varied (in ALL samples they were close to
those in NBM, while in the AML-M3 samples, WT1 and CCNA1 expression
was elevated above than that in NBM).
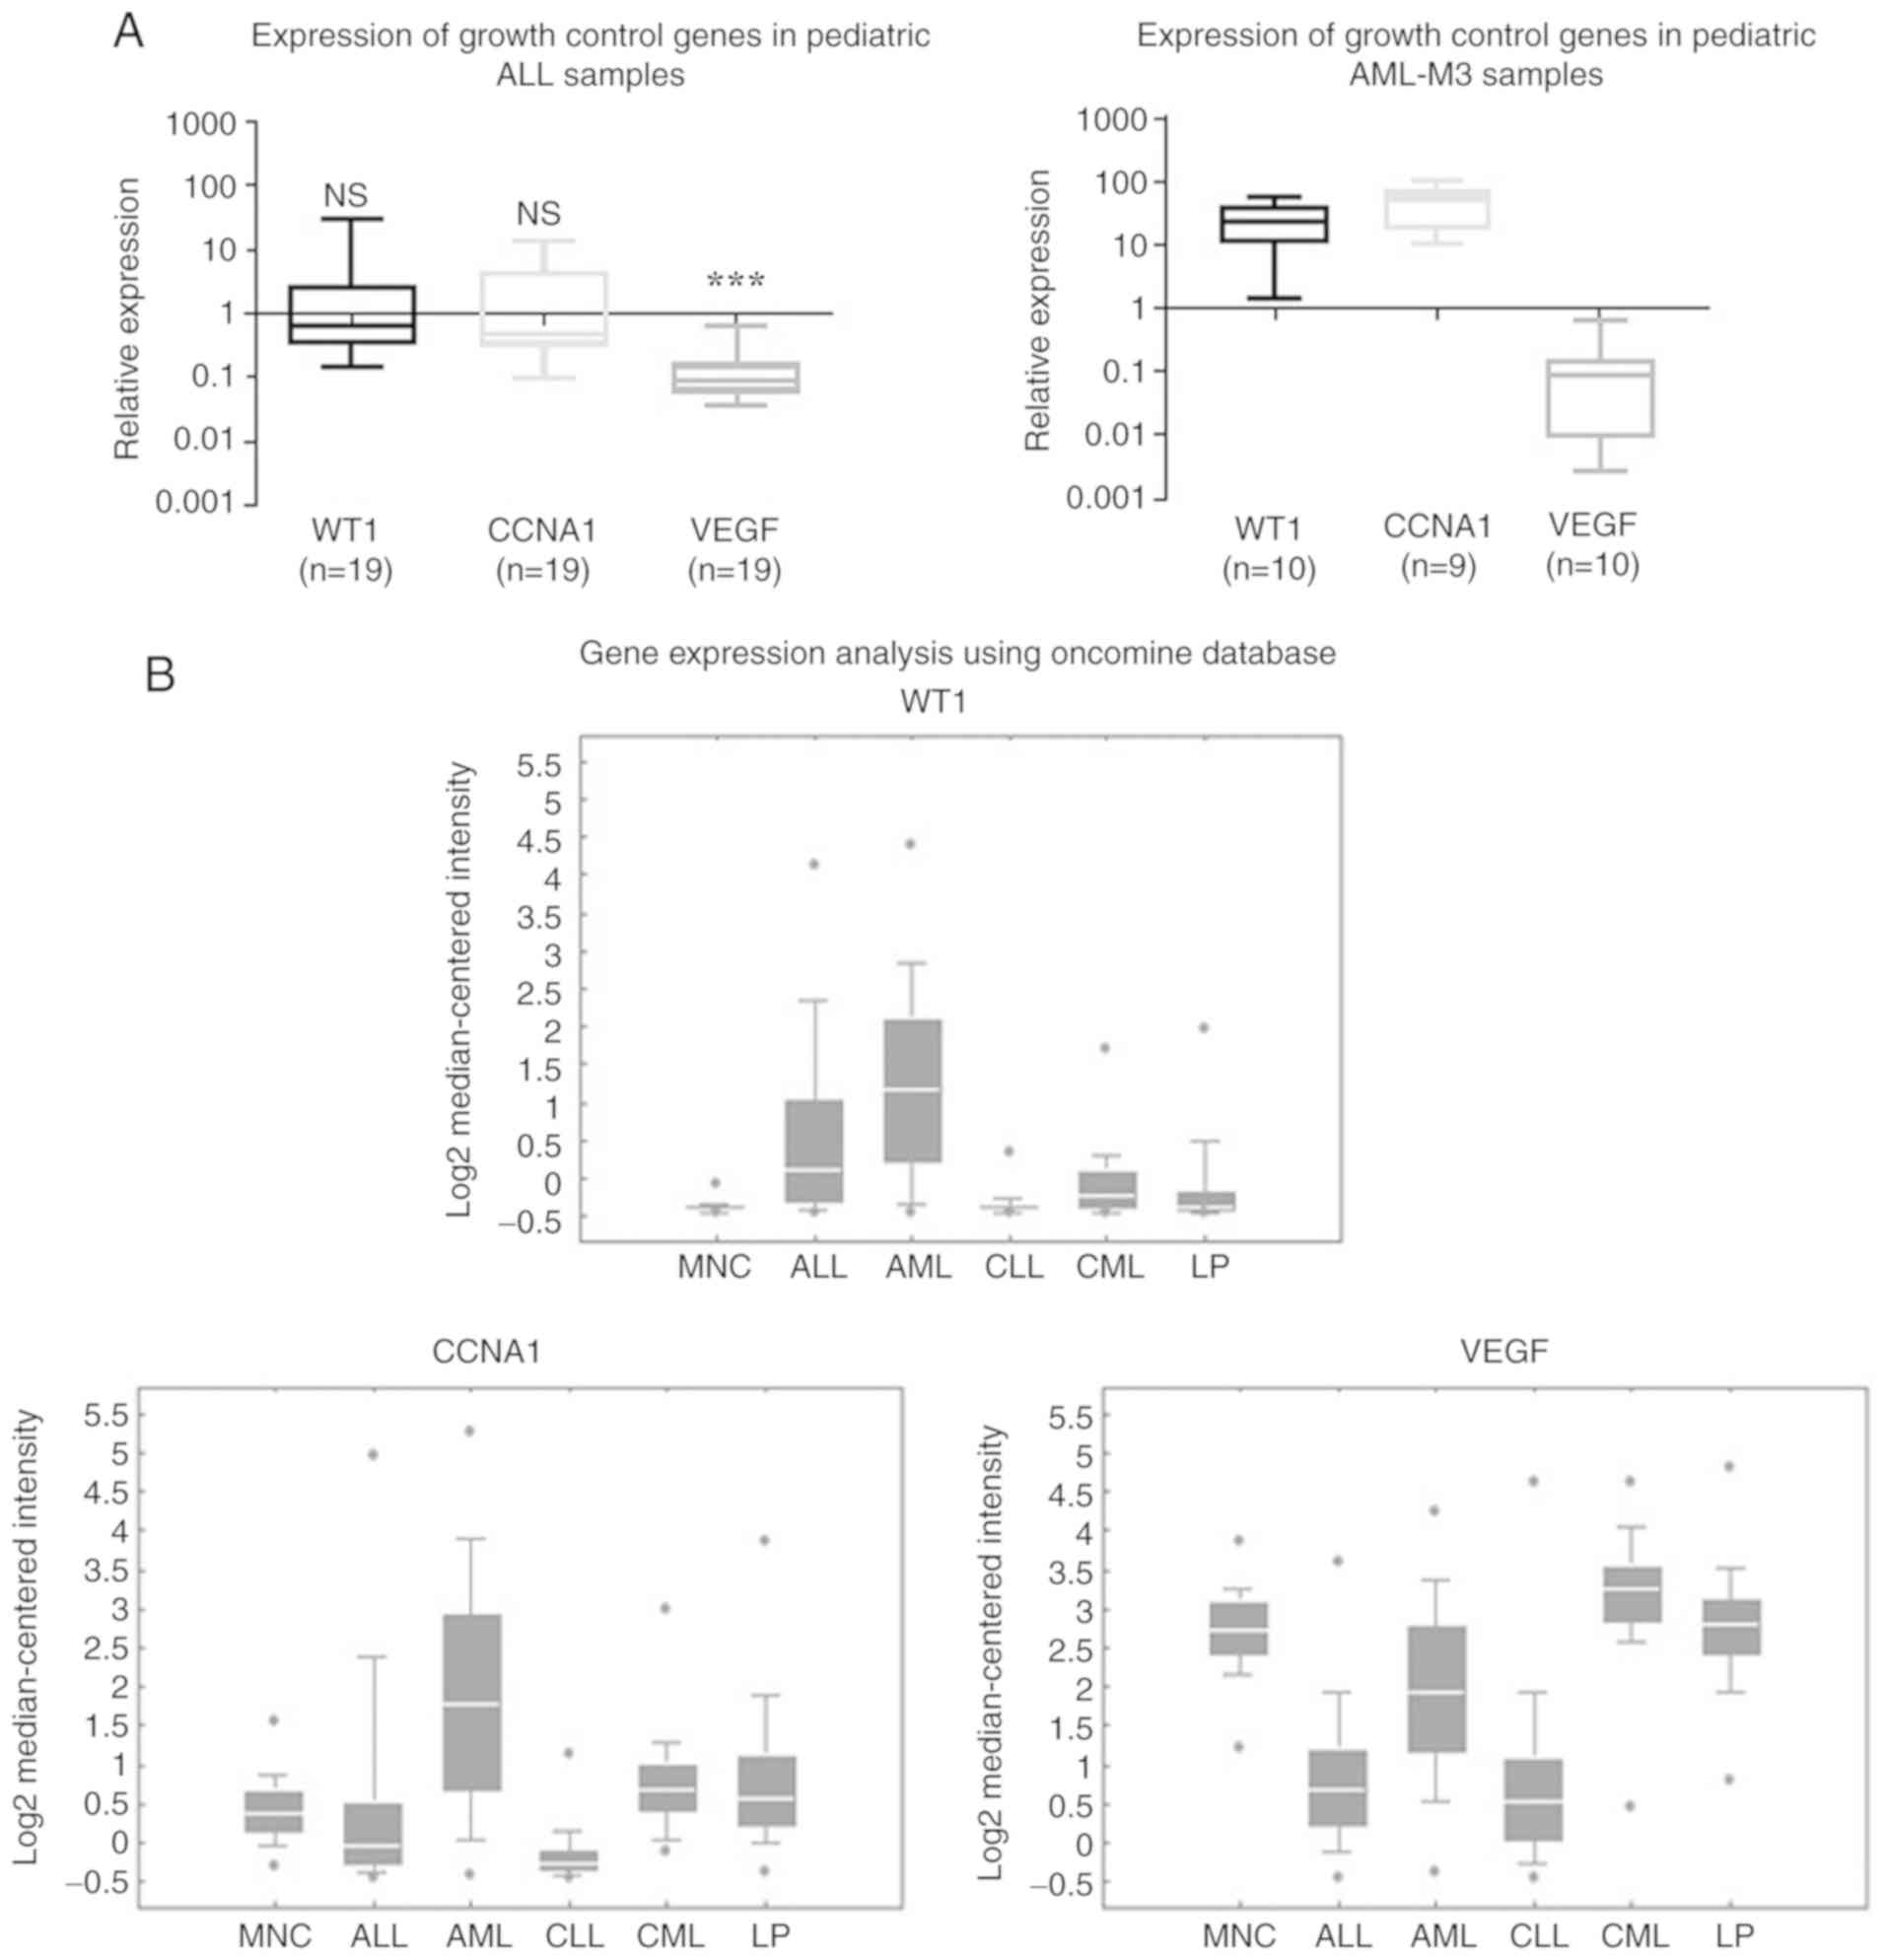 | Figure 1.WT1 and CCNA1 expression was higher
in acute leukemia than in normal BM samples. (A) RT-qPCR analysis
of WT1, CCNA1 and VEGF expression shown as box plots in
log10 scale demonstrating the fold change of expression
in leukemia BM relative to NBM (represented by the solid line at
1.0). The median WT1 and CCNA1 expression in ALL did not vary
significantly between the NBM and leukemia samples (NS; P=0.4425
and P=0.8149), while median VEGF expression was significantly lower
in the leukemia group than in NBM (***P<0.001), as determined by
the Mann-Whitney U test. Median WT1 and CCNA1 expression was higher
in AML-M3 BM samples than in NBM, while VEGF levels were lower. (B)
Oncomine analysis from microarray gene expression data collected by
Haferlach et al (33) showing
that WT1 and CCNA1 expression was higher in AML than in ALL or
controls, while VEGF was lower in ALL and AML compared to the
controls. WT1, Wilms tumor 1; CCNA1, cyclin A1; MNC, mononuclear
cells; ALL, acute lymphocytic leukemia; AML, acute myeloid
leukemia; CLL, chronic lymphocytic leukemia; CML, chronic myeloid
leukemia; LP, leukemia precursor; NBM, non-leukemic bone
marrow. |
Diverse expression patterns were also observed in an
analysis of an independent microarray dataset of leukemia samples
from Haferlach et al (33)
from the Oncomine database (Fig. 1B).
The expression patterns observed in the various leukemia types were
in general agreement with our RT-qPCR data for ALL and AML samples.
The median WT1 and CCNA1 expression in the AML samples was greater
than that in the MNC controls and was generally higher than that in
the ALL samples. The expression of CCNA1 was lower in the ALL
samples compared to the controls, while the VEGF levels were lower
than those in the controls in both the ALL and AML samples.
Overall, these analyses demonstrated that WT1 and CCNA1 expression
varied between the types of leukemia, with a higher expression
being more common in AML than ALL, consistent with our analysis of
pediatric leukemia samples.
Overexpression of wild-type, but not
ZF mutated WT1 increases CCNA1 expression in K562 cells
Exon 7 is a hotspot area for WT1 mutations in
leukemia, and the predominant type of mutation identified in this
region is a frameshift caused by either insertion or deletion of
one or more base pairs (5,35,36).
Sequence analysis of our expression constructs comparing wild-type
and mutant WT1 confirmed the insertion of a single base ‘C’ at exon
7 resulting in a premature stop codon and the truncation of exon
7–10 (ZF domain) at the C-terminus of WT1 protein (Fig. 2A). The transfection of WT1 plasmids
into the K562 cells resulted in the expression of either the
full-length wild-type (52 kDa) or the truncated mutant WT1 protein
(35 kDa). A comparison of the effects of the transfection of
wild-type or mutant WT1 constructs on the CCNA1 and VEGF mRNA
levels in K562 cells was evaluated by RT-qPCR analysis (Fig. 2B). The transfection of wild-type WT1
increased the mRNA levels of CCNA1 (relative to the empty vector),
but not those of VEGF, and the ZF mutant WT1 did not upregulate the
expression of any gene targets tested. These results suggest that
CCNA1 is a potential WT1 target gene. In addition, since the mutant
plasmid lacking the ZF domain failed to enhance expression, an
intact DNA binding domain is required for the WT1 mediated
upregulation of CCNA1.
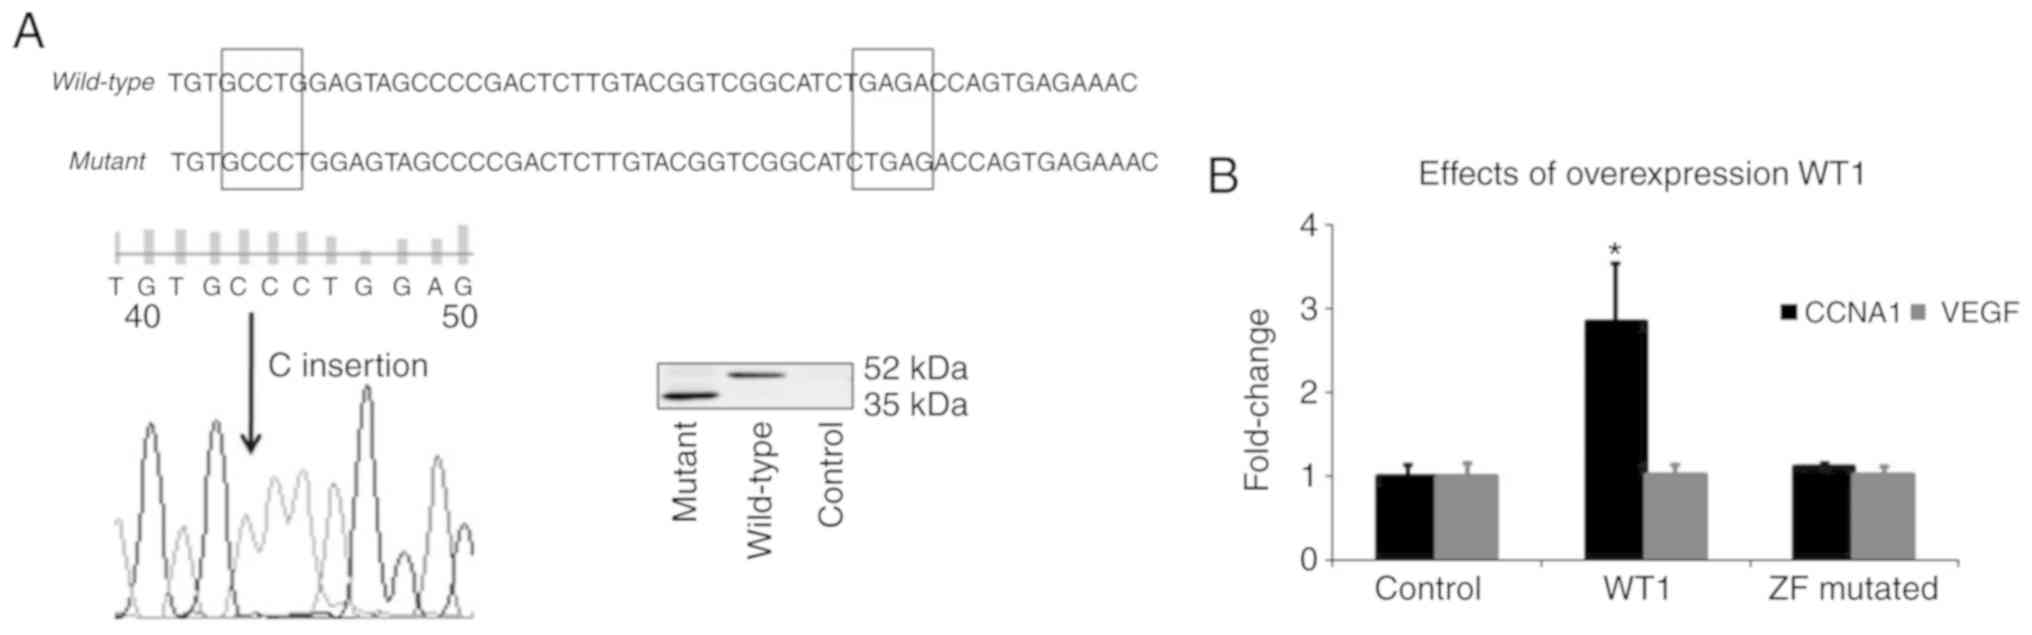 | Figure 2.Wild-type WT1, but not a ZF-mutated
WT1, upregulates CCNA1 mRNA in K562 cells. (A) A naturally
occurring mutation in exon 7 (encoding ZF-1) of WT1 gene truncates
ZF domain of WT1 protein. Construction of ZF truncation mutant,
confirmation of frameshift mutation at 1,340 bp within the zinc
finger 1 domain (exon 7), and production of the resultant ZF mutant
truncated WT1 protein are described in methods. Sequence analysis
comparing wild-type and mutant WT1 confirmed the insertion of a
single base ‘C’ at exon 7 by site-directed mutagenesis (the region
of insertion shown in box on the left) which resulted in a
premature stop codon (box on the right), and truncation of exon
7–10 at the C-terminal end of WT1 protein. Following the
transfection of WT1 plasmids into K562 cells, western blot analysis
(right panel) revealed the expression of both wild type (52 kDa)
and mutant (35 kDa) WT1 protein. (B) CCNA1 expression was
upregulated approximately 2.5-fold in K562 cells transfected with
wild-type WT1 construct relative to the cb6+ empty vector control,
but no enhancement in CCNA1 mRNA expression was observed in ZF
mutant WT1-transfected K562 cells. VEGF levels remained unaltered
by WT1 transfection. Statistical significance was determined by
one-way ANOVA (*P<0.05). WT1, Wilms tumor 1; CCNA1, cyclin A1;
VEGF, vascular endothelial growth factor. |
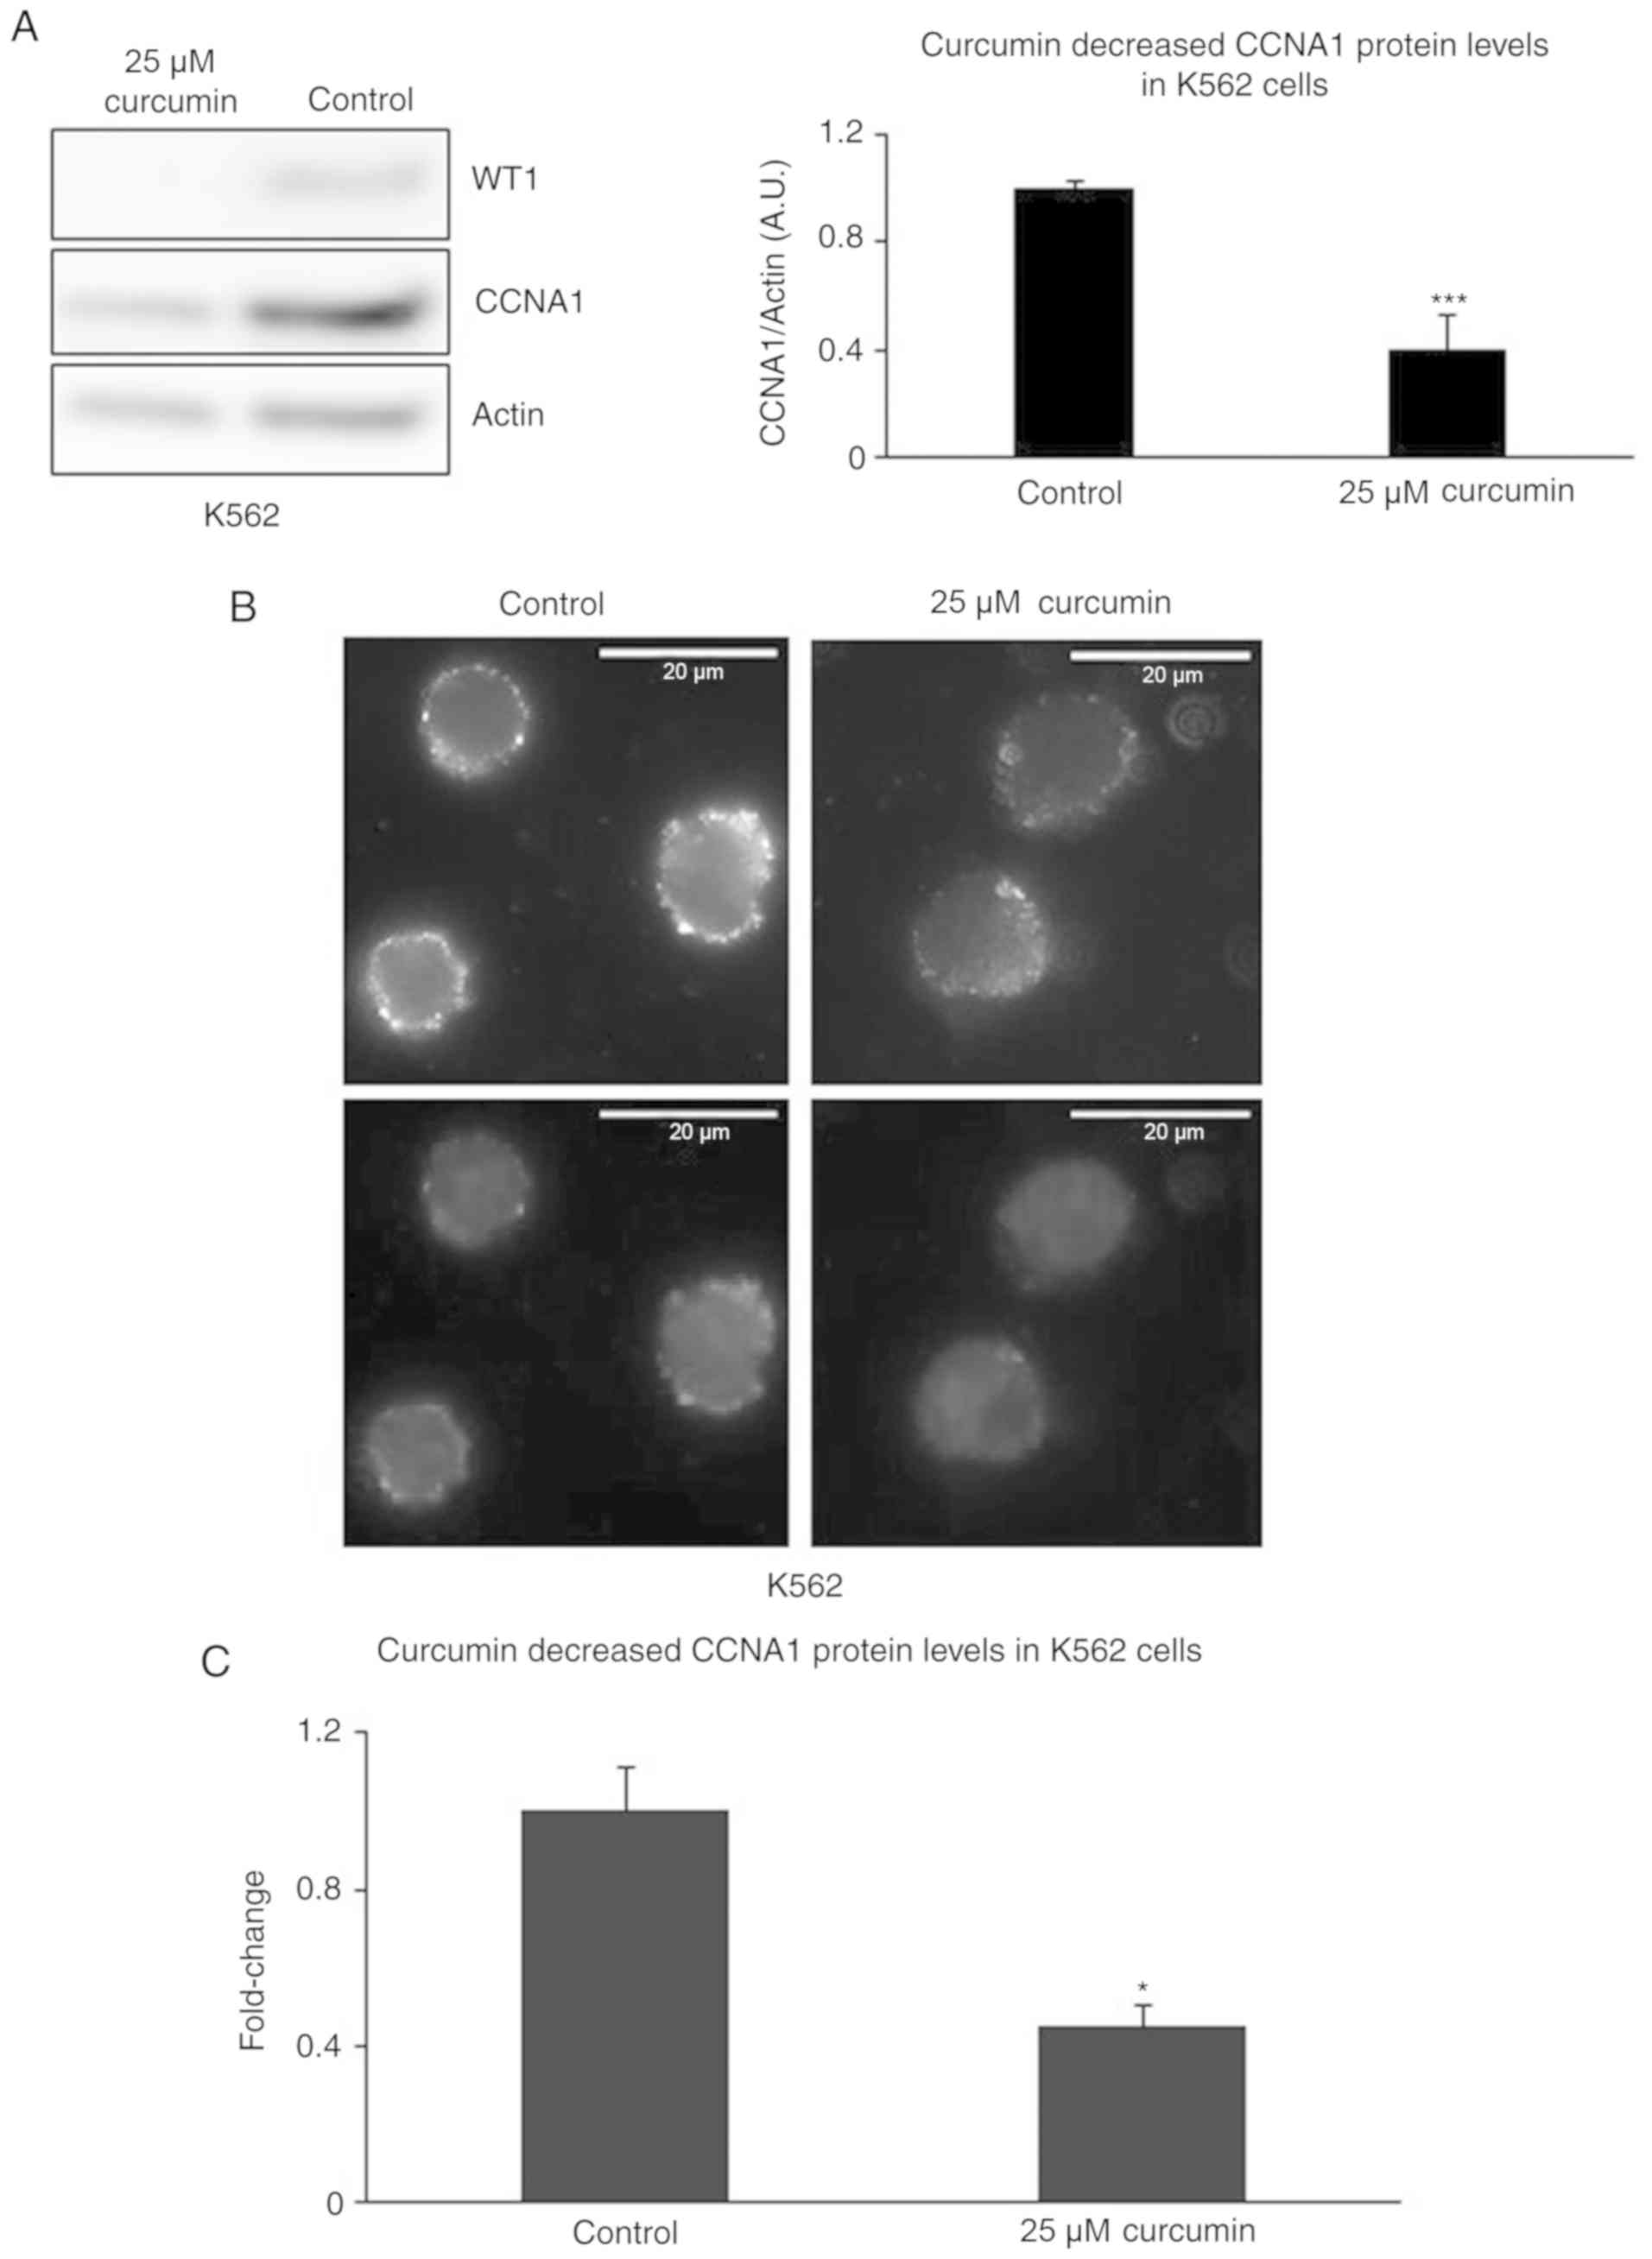
Treatment of K562 cells with curcumin
decreases the WT1 and CCNA1 protein levels
Curcumin has been shown to suppress the WT1 mRNA and
protein levels in K562 cells (37).
In addition to the curcumin-induced decrease in the WT1 protein
levels, we observed a reduction in the CCNA1 protein levels in the
K562 cells. Curcumin at the concentration of 25 µM decreased WT1
and CCNA1 protein expression in the K562 cells, as demonstrated by
western blot analysis (Fig. 3A). The
suppression of CCNA1 protein expression was also confirmed by IF,
showing that treatment with 25 µM curcumin decreased the intensity
of CCNA1 staining (Fig. 3B and C).
While these results provide evidence of the coordinate
downregulation of both CCNA1 and WT1 expression by curcumin
treatment, they are also consistent with the lack of CCNA1 mRNA
expression observed in the absence of WT1 expression (or when WT1
mutant constructs are expressed in K562 cells) shown in Fig. 2B.
CCNA1 promoter region contains
functional WT1 binding sites
Potential WT1 binding sites were queried using
MatInspector Software to analyze 3 kb of the CCNA1 promoter gene
sequence obtained from the public database, Ensembl, and 3
potential WT1 binding sites were identified at −1,779, −1,057 and
−499 bp upstream of the transcription start site (Fig. 4A). To examine WT1 binding at these
sites in vivo, ChIP assays were carried out and WT1 bound
chromatin was amplified by end-point and qPCR using primers
(Table IIC) specific for the 3
predicted sites. WT1 binding to the CCNA1 promoter at sites 3 and 2
was revealed by the modest enrichment of DNA precipitated by WT1
antibody, compared to IgG, as shown by gel electrophoresis
(Fig. 4B) and confirmed by qPCR
(shown as bar chart in Fig. 4B bottom
panel). By contrast, no WT1 binding was observed at site 1, as
evidenced by the absence of amplification of that region. The
specificity of WT1 binding was also indicated by the absence of
amplification of a negative control region located approximately
1.5 kb upstream of the third WT1 site. Taken together, these
results suggest that the specific in vivo binding of WT1 to
the CCNA1 promoter in chromatin of the K562 cells mediates the
transcriptional regulation of CCNA1 through binding to its
promoter.
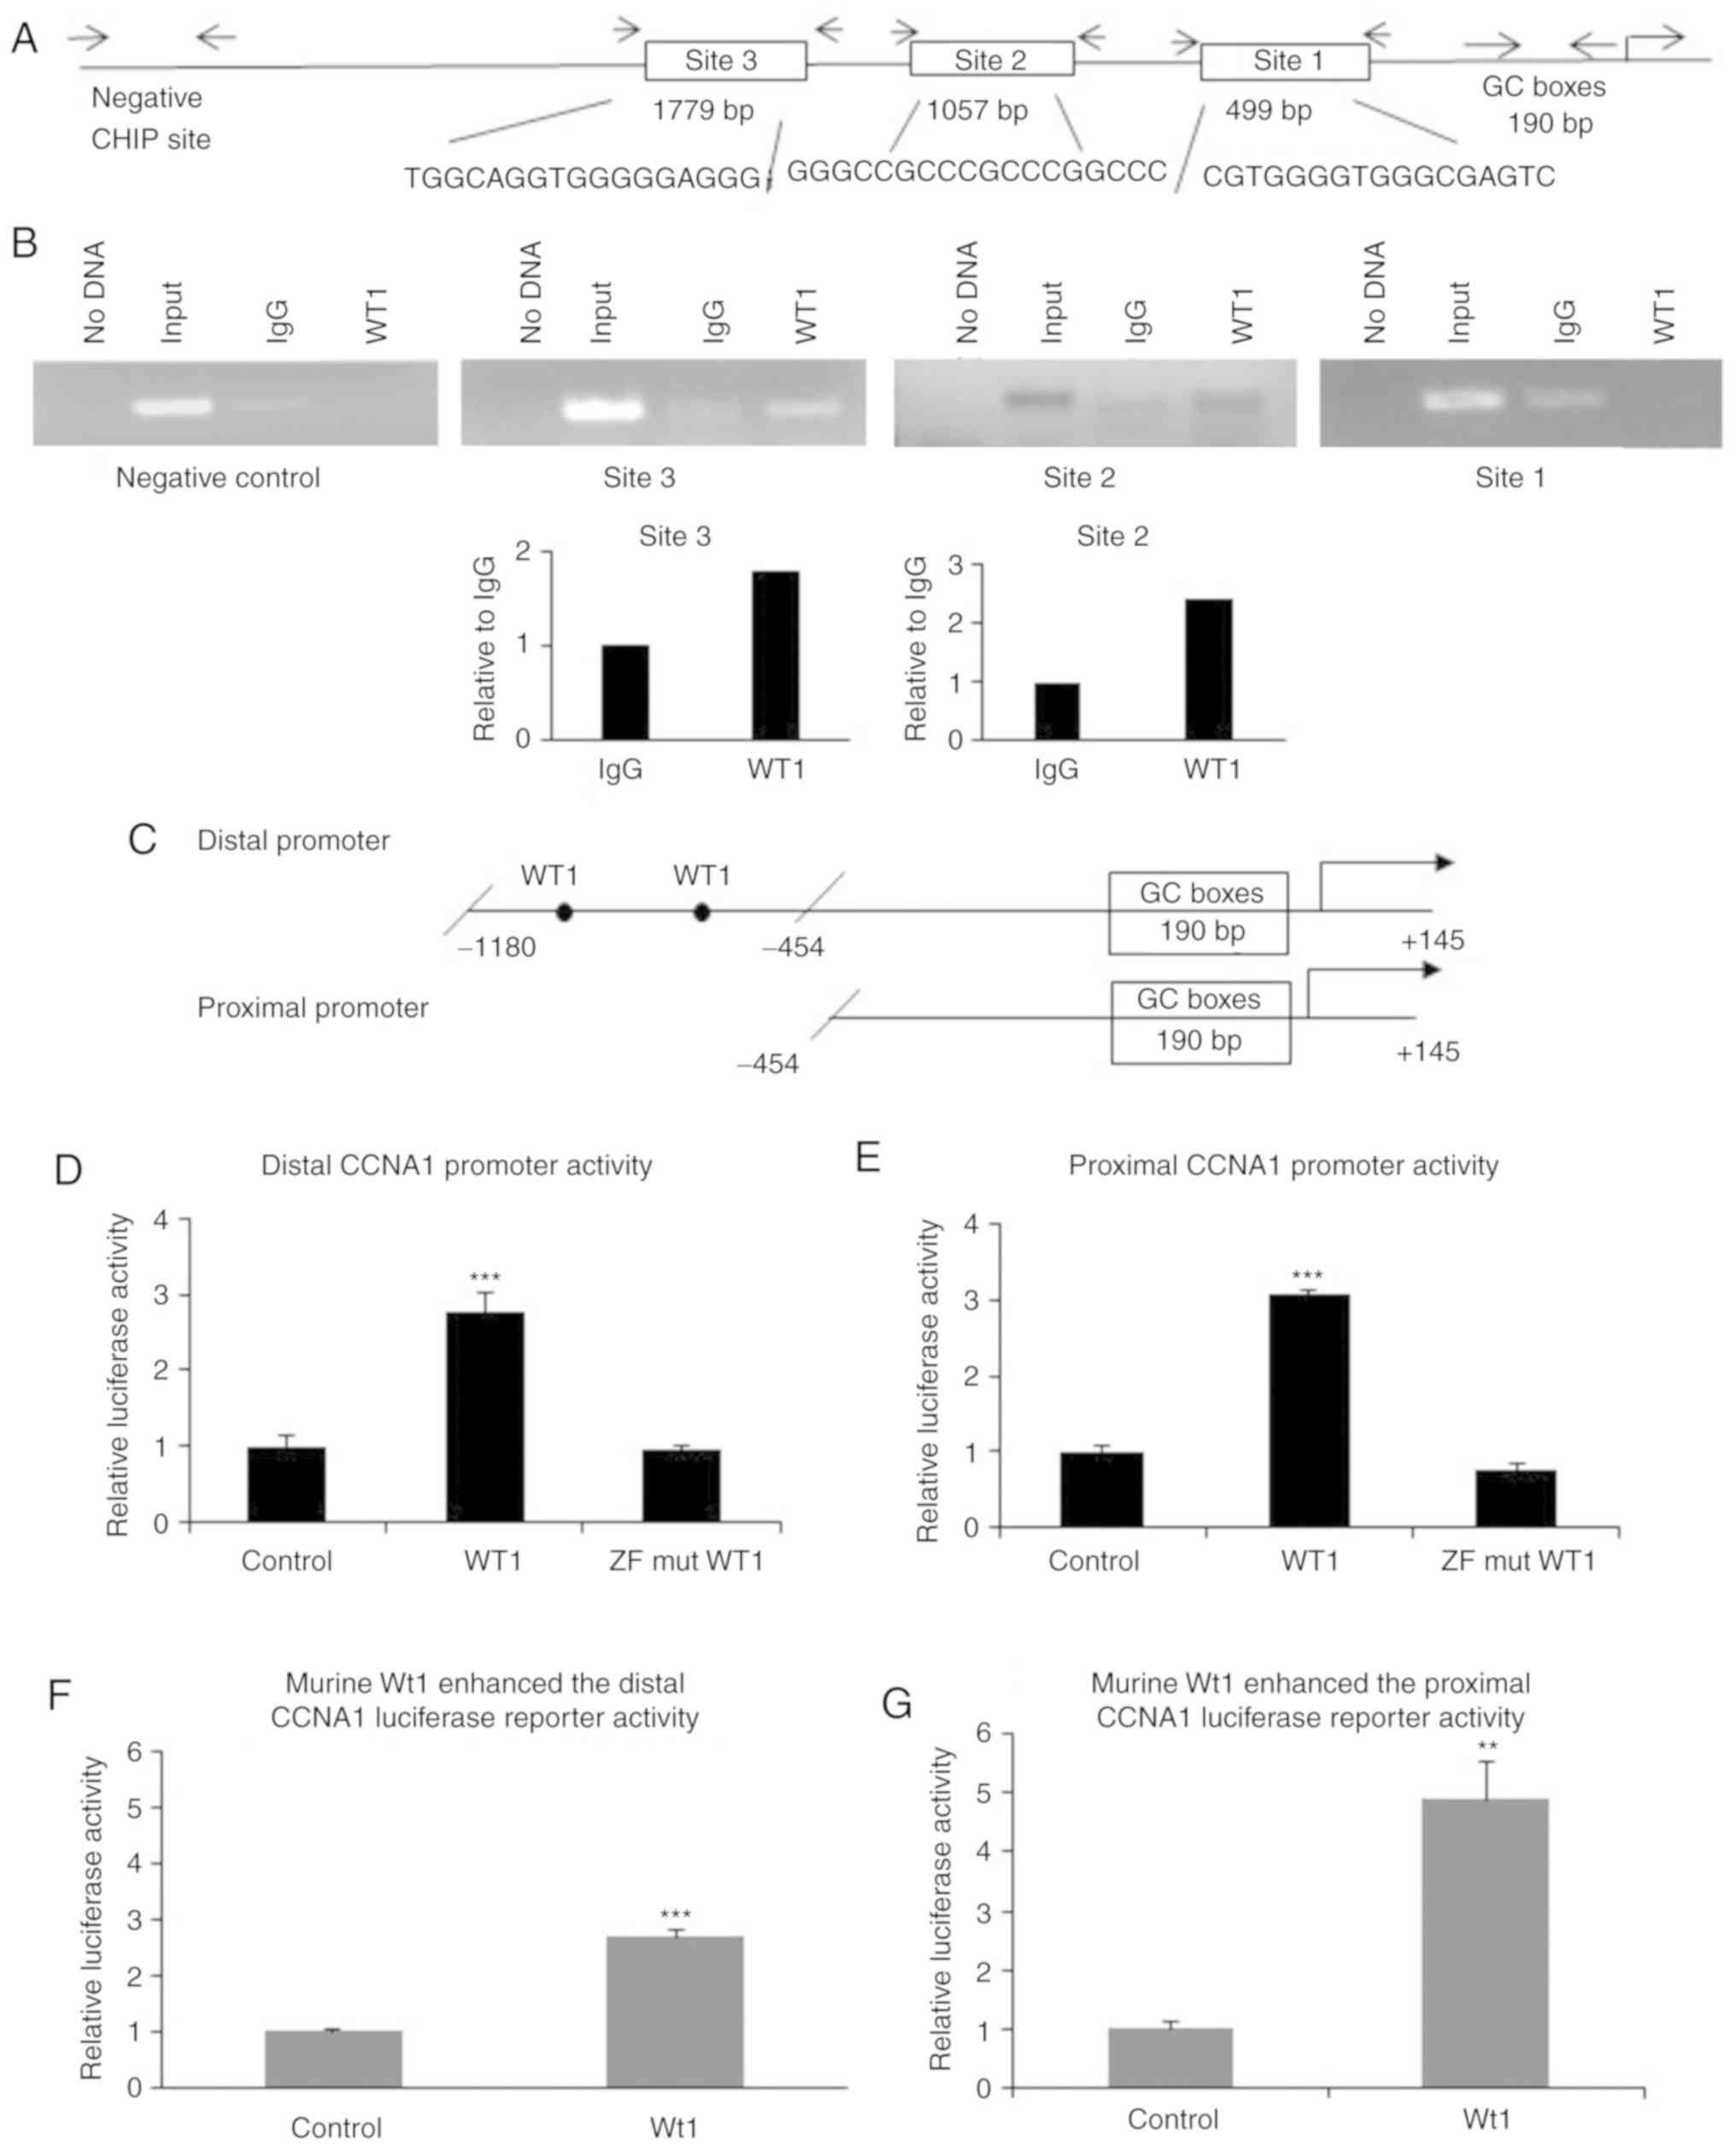 | Figure 4.WT1 binding is observed at the CCNA1
promoter, and WT1 overexpression upregulates CCNA1 promoter
activity. (A) Three potential WT1 binding sites in the CCNA1
promoter were identified using MatInspector software. Arrowheads
indicate primer locations used to PCR-amplify each individual
binding site (primer sequences shown in Table IIC). (B) ChIP assay demonstrated
chromatin binding by WT1. Purified DNA was PCR amplified at sites
1, 2 and 3, and a negative control site in the CCNA1 promoter, then
analyzed by gel electrophoresis. WT1 bound in vivo to
chromatin at the sites −1,779 (site 3) and −1,057 (site 2), but not
to the site −499 (site 1) or to the negative control site lacking
WT1 sites (specificity control). The lanes from left to right are
as follows: lane 1, PCR control (no DNA); lane 2, input DNA
control; lane 3, IgG (antibody control); lane 4, WT1 antibody
precipitated chromatin. Binding at sites 2 and 3 was also verified
by qPCR amplification and shown as fold enrichment relative to IgG
(bottom panel). (C) Schematic diagram of the distal (−1,180/+145)
and proximal (−454/+145) CCNA1 promoter with filled circles
indicating WT1 binding sites. (D) Distal and (E) proximal CCNA1
promoter constructs were co-transfected with the human WT1
expression plasmids (wild-type and ZF mutant) in K562 cells. Shown
is the normalized luciferase activity of CCNA1 promoters in
WT1-transfected cells relative to the empty vector control.
Wild-type WT1 upregulated the distal (−1,180/+145) and the proximal
(−454/+145) CCNA1 promoters, while the ZF mutated construct did not
increase promoter activity. Significance was determined at
***P<0.001 using one-way ANOVA. Results of transfection of human
WT1 expression plasmids were confirmed with murine Wt1 plasmids.
Luciferase activity in (F) distal and (G) proximal CCNA1 promoter
co-transfected with the murine Wt1 expressing plasmid demonstrated
upregulated activity compared to empty vector control. Significance
was determined at **P<0.01 and ***P<0.001 using Students
t-test. WT1, Wilms tumor 1; CCNA1, cyclin A1. |
Activation of the CCNA1 promoter by
WT1 requires ZF domain, but not canonical WT1 binding sites
The co-transfection of distal CCNA1 promoter plasmid
(Fig. 4C) into K562 cells with one of
the expression constructs described in Fig. 2A revealed that the wild-type WT1
increased the distal CCNA1 promoter activity by >2.5-fold
relative to the empty vector control, but the mutant lacking the ZF
domain did not enhance CCNA1 promoter activity (Fig. 4D). Surprisingly, although no WT1
binding sites were identified in the GC-rich proximal region of the
CCNA1 promoter (Fig. 4C), WT1
significantly elevated proximal promoter (−454/+145) activity
(Fig. 4E). The upregulated distal and
proximal promoter activity was confirmed by transfection of the
K562 cells with the murine GFP-tagged Wt1 construct (Fig. 4F and G). These results suggest that
the WT1 ZF domain is important for the transcriptional upregulation
of the CCNA1 promoter, and that WT1 activates the promoter through
both canonical and non-canonical sites.
Mithramycin A decreases CCNA1
expression and the viability of K562 cells
To confirm the importance of the GC-rich region for
CCNA1 promoter activity, the K562 cells were treated with
mithramycin A to block GC binding. Mithramycin A at even low
concentrations (30 nM) decreased distal promoter (containing WT1
binding site #2) activity by 70% and proximal promoter (containing
no WT1 binding site) by 23% in the treated K562 cells compared to
the DMSO-treated cells (Fig. 5A).
This dampening of CCNA1 expression resulted in a 2-fold reduction
in the CCNA1 protein levels in the 70 nM mithramycin A-treated
cells examined by western blot analysis (Fig. 5B) and confirmed by IF (Fig. 5C). The intensity of CCNA1 staining was
decreased >2-fold in the mithramycin A-treated K562 cells
(Fig. 5C, right panel), compared to
that of the DMSO-treated cells (Fig.
5C, left panel).
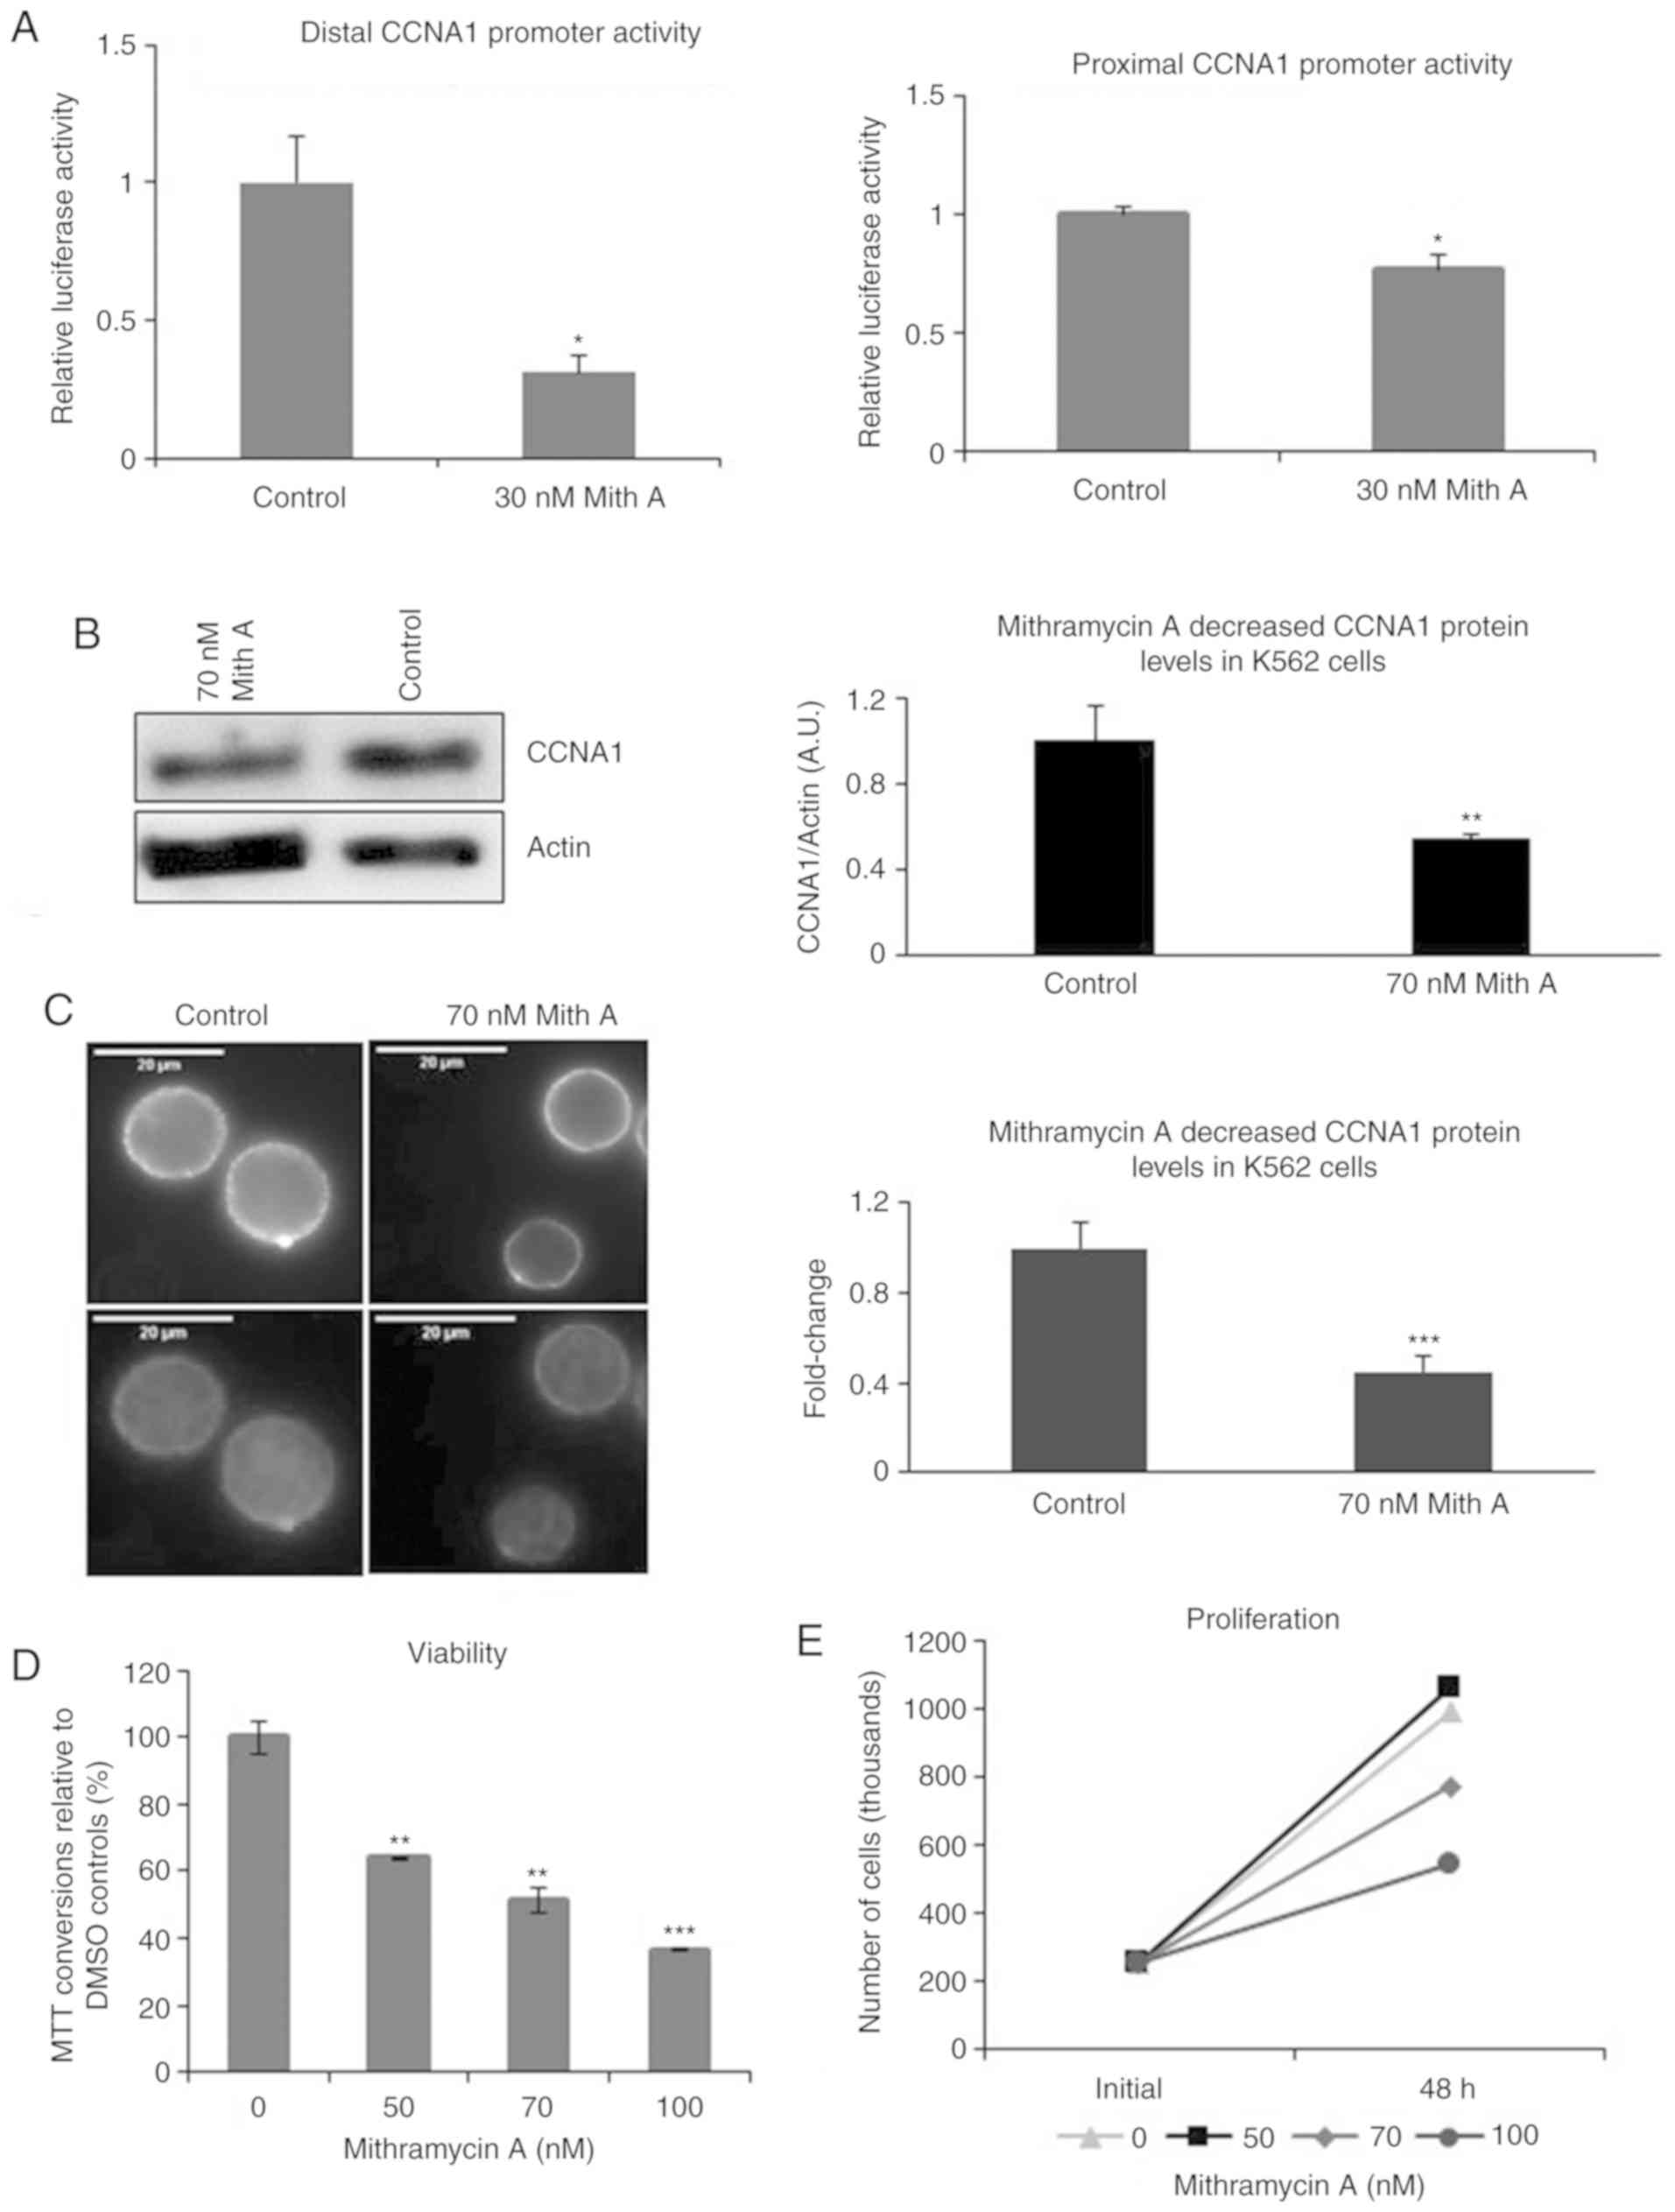 | Figure 5.Mithramycin A treatment decreases
CCNA1 promoter activity, protein expression, and the proliferation
of K562 cells. (A) K562 cells were transfected with either the
distal or proximal CCNA1 promoter constructs and luciferase
activity measured following 48 h of treatment with 30 nM
mithramycin A or DMSO as the diluent control. Mithramycin A reduced
the activity of the distal CCNA1 promoter (−1,180/+145) containing
the WT1 binding site #2 and had a modest but reproducible effect on
the proximal promoter (−454/+145) relative to DMSO controls.
Significance was determined using a Student's t-test (*P<0.05).
(B) Cytoplasmic protein lysates from K562 cells treated for 48 h
with either 70 nM mithramycin A or DMSO were analyzed by western
blot analysis, and the mithramycin A-treated cells exhibited a
decrease in CCNA1 protein expression as compared to the DMSO
controls. Actin was used as the loading control and protein was
quantified using ImageJ (means ± SD). Significance was determined
using a Student's t-test (**P<0.01). (C) Mithramycin A treatment
decreased the intensity of CCNA1 staining measured by
immunofluorescence (as described in Fig.
3) when compared to the DMSO-treated control cells. The top
panel shows CCNA1 expression and the lower panel shows composite
images with stained nuclei. Scale bars, 20 µm. Images were
quantified using ImageJ and shown as the fold change in integrated
density relative to the DMSO-treated control. Error bars represent
standard deviation. Significance was determined using a Student's
t-test at ***P<0.001. (D and E) Treatment of the K562 cells with
0, 50, 70 and 100 nM mithramycin A decreased their metabolic
activity and viability as measured by MTT and Trypan blue exclusion
assays, respectively. (D) Shown are average normalized substrate
absorbance values plotted as percentage of metabolically active
mithramycin A-treated cells relative to the DMSO-treated control
cells, as determined by MTT assay. Significance was determined by
one-way ANOVA and significance was determined at **P<0.01 and
***P<0.001. (E) Viable cells were identified by trypan blue
exclusion assay and counted on a hemocytometer. Numbers of viable
cells remaining after 48 h of treatment are reported. Mith A,
mithramycin A; WT1, Wilms tumor 1; CCNA1, cyclin A1. |
The effects of the mithramycin A-induced decrease in
the CCNA1 protein levels on the proliferation of K562 cells were
examined by MTT and trypan blue exclusion assays. The K562 cells
treated with increasing concentrations of mithramycin A exhibited a
decrease in viability after 48 h (Fig.
5D), but not at 24 h (data not shown), as assessed by MTT
assay. To determine whether mithramycin A causes cell death or only
decreases the proliferative potential, viable cells were identified
by trypan blue dye exclusion and counted on a hemocytometer. The
number of viable cells after 48 h of mithramycin A treatment was
lower compared to that observed with DMSO treatment, but was
nevertheless still above the initial numbers seeded, even at the
highest concentrations (Fig. 5E),
suggesting mithramycin A was not cytotoxic, but rather
anti-proliferative.
Discussion
Clinical studies on leukemia patient samples have
linked an increased WT1 expression to an increased risk of relapse
(38) and an increased CCNA1
expression to poor clinical responses (6,11). The
importance of CCNA1 expression is still under study; however,
recently, CCNA1 was described to regulate pathways important for
the homing of HSPCs in their BM niche, with clear implications for
the development of both normal hematopoietic and leukemia stem
cells (20).
In this study, the comparison of WT1 and CCNA1 mRNA
in pediatric ALL and AML-M3 exhibited the consistent, elevated
expression of WT1 and CCNA1 in the AML-M3 relative to the
non-leukemia BM samples. By contrast, their expression in the
pediatric ALL samples varied widely and was generally lower than
that in the AML-M3 samples. Concordant with the RT-qPCR results,
Oncomine analysis of the microarray data submitted by Haferlach
et al (33) revealed a higher
WT1 and CCNA1 expression in AMLs compared to ALLs. The significance
of the wide range of WT1 expression in pediatric ALL, which is the
predominant pediatric leukemia type (39), is unclear, but has also been reported
by others (40). Previously, other
studies have also reported WT1 and CCNA1 levels to be elevated in
myeloid leukemia, particularly in the AML-M3 subtype (41,42), more
than in lymphocytic leukemia (42–44).
The relevance of elevated WT1 in acute leukemia is
most likely linked to its role as a transcription factor (reviewed
in ref. 45). In this study, since
WT1 and CCNA1 were coordinately expressed in our pediatric AML-M3
populations, we examined the effects of WT1 on CCNA1 mRNA
expression. WT1 overexpression in the myelogenous leukemia cell
line, K562, increased CCNA1 mRNA expression. This is the first
report demonstrating the WT1 regulation of CCNA1 in cancer cells.
While our results indicate that WT1 transcriptionally enhances
CCNA1, there may also be a negative feedback loop whereby elevated
CCNA1 somehow leads to suppression of WT1 expression and a
redistribution of the normal isoform ratios (18). Herein we demonstrated that WT1
activated the distal CCNA1 promoter containing 2 potential WT1
binding sites. This activation required DNA binding by WT1, as the
mutant WT1 (lacking the ZF DNA binding domain) failed to activate.
Conversely, treatment of the K562 cells with curcumin, known to
suppress WT1 mRNA and protein levels in various cancer cell lines
(37,46,47), was
found to be associated with reduced CCNA1 protein levels. Since
curcumin is a multi-targeted drug [reviewed in (48)], this novel discovery of the effects of
curcumin on CCNA1 expression and the association with decreased WT1
protein levels in K562 cells suggests a plausible link between WT1
and CCNA1. However, evidence of a direct link indicating the
necessity of WT1 for CCNA1 regulation awaits the gene-specific
silencing of WT1 expression.
WT1 was observed to bind to chromatin in the distal
CCNA1 promoter region and WT1 expression upregulated the distal
CCNA1 (−1,180/+145) promoter activity. Surprisingly, WT1 also
activated the proximal CCNA1 (−454/+145) promoter containing no
canonical WT1 binding sites but including the GC-rich core. The
core CCNA1 promoter region (−190/+145) contained 4 major GC boxes
that others have shown to be critical for promoter activity, as the
mutation of these GC-boxes decreases promoter activity (49). The ZF transcription factor, SP1
(50), binds at these GC-boxes and
plays a pivotal role in regulating this promoter region and CCNA1
expression (49). Other ZF
transcription factors, such as EGR1 and WT1, also bind at GC-rich
regions, such as those located in the promoter of PDGF A-chain gene
(51). In fact, binding sites for WT1
(-GNGNGGGNG-), SP1 (-GGGCGG-) and EGR1 (GCG(T/G)GGGCG) often
overlap (52) and these ZF factors
can displace one another, competing for binding at the same sites
(53). Hence, we hypothesized that
WT1 binds at these GC-rich sites and activates the CCNA1 core
promoter region. However, PCR amplification of chromatin in this
core region failed, due to the high GC content, and thus direct
evidence of WT1 binding at the core promoter awaits ChIP analysis.
Nevertheless, our observation that WT1 transfection upregulated
activity of the proximal CCNA1 promoter lacking canonical WT1
binding sites, but enriched for GC boxes, suggests either direct
binding by WT1 at the GC sites, or indirect binding by a complex
containing WT1 and a GC-box binding factor, such as SP1.
To confirm the importance of the GC-rich core region
of the CCNA1 promoter, K562 cells were treated with mithramycin A,
which binds to the minor groove of DNA at GC-rich regions and
competitively inhibits binding of ZF motifs (54). Mithramycin A treatment decreased both
the distal and proximal CCNA1 promoter activity and endogenous
CCNA1 protein expression in the K562 cells. Importantly, this
reduction was associated with a decreased cell viability and the
decreased proliferation of K562 cells.
In addition to WT1 and CCNA1, VEGF gene expression
was also quantified in our analysis of pediatric leukemias.
However, unlike WT1 and CCNA1, the VEGF levels were lower in the
AML-M3 than in the NBM control samples. In agreement with our
findings on mRNA expression, others have shown that the median VEGF
protein levels in serum samples from diagnostic pediatric ALLs were
also lower compared to normal controls (55,56).
Indeed, VEGF mRNA levels at initial diagnosis in pediatric ALLs
have been shown to be lower than those at relapse, and in serial
samples, VEGF levels have been shown to increase at relapse
(57). This is consistent with our
study population of pediatric patients with low VEGF levels in BM
samples collected at first diagnosis. Our RT-qPCR results were
further supported by the analysis of an independent microarray data
set of leukemia samples from the Oncomine database that showed VEGF
levels in ALL and AML samples were significantly lower than in
normal controls (33).
Overall, the generally low expression of CCNA1 and
WT1 in pediatric ALL would suggest that they are not common in
pediatric ALL. However, in those patients with elevated CCNA1 and
WT1 levels, they may indicate a cause for concern, as elevated
levels have been associated with poor outcomes (11). This study provides evidence of the
ability of WT1 protein to bind and regulate expression of the CCNA1
gene promoter, supporting a mechanistic relationship. Given the
potential for WT1 to alter the homing of HSPCs by modulating CCNA1
levels, this would suggest the utility of monitoring both WT1 and
CCNA1 levels in patients at risk of relapse. If WT1 and CCNA1
expression were used to monitor for evidence of MRD in pediatric
population, they could provide early evidence of stem cell
transplantation success. Additional studies are required; the
identification of genes that drive relapse would lead to an
improved prognosis and ultimately, to the development of novel
effective therapies.
Acknowledgements
The CCNA1 promoter luciferase constructs were
generously provided by Dr Carsten Müller-Tidow (Heidelberg
University Hospital, Germany). The authors would like to thank Dr
A. Ward (University of Bath, UK) for the GFP tagged murine
Wt1 and Dr Frank Rauscher (Wistar Institute, USA) for the
cb6+ human WT1 gene expression constructs. The authors would
also like to thank Mr. Douglas Snyder (Kent State University) for
his assistance with compiling patient data and the Akron Children's
Hospital and Children's Oncology Group for providing the patient
samples.
Funding
Funding was provided by ICRT-SUMMA (to GCF), Kent
State Graduate Student Senate (to SP), and the CHMCA Foundation (to
MM).
Availability of data and materials
All data generated or analyzed during this study are
included in this published article or are available from the
corresponding author on reasonable request. Constructs and data are
available upon request.
Authors' contributions
SJK, SP and GCF conceived and designed the study.
SP, MM and NG performed the experiments and collected the data. SP
and GCF analyzed the data. SP, SJK and GCF wrote the preliminary
draft of the manuscript. All authors have proofread and edited the
manuscript and all authors have read and approved the final
manuscript.
Ethics approval and consent to
participate
Diagnostic BM aspirates from 20 pediatric ALL
patients were obtained in accordance with Akron Children's Hospital
IRB guidelines (including patient consent to participate, and
evaluation of ethical considerations). Samples in excess of that
needed for diagnosis were provided for research purposes. Informed
consent was obtained from all parents/legal guardians of minor
children for use of diagnostic leukemic bone marrow specimens for
the research. Non-leukemia specimens were obtained as discarded
sample from bone marrow aspirations performed on patients for
various clinical indications (e.g., staging of solid tumors,
evaluation of non-leukemic hematologic conditions such as ITP,
etc.). An additional 10 RNA samples were obtained from the
Children's Oncology Group, also obtained through IRB approval. No
data about patient characteristics were available for this
cohort.
Patient consent for publication
Not applicable.
Competing interests
The authors declare that they have no competing
interests.
Glossary
Abbreviations
Abbreviations:
|
ALL
|
acute lymphocytic leukemia
|
|
AML
|
acute myelocytic leukemia
|
|
MRD
|
minimal residual disease
|
|
IRB
|
Institutional Review Board
|
|
RT-qPCR
|
reverse transcription-quantitative
polymerase chain reaction
|
|
VEGF
|
vascular endothelial growth factor
|
|
ZF
|
zinc finger
|
|
BM
|
bone marrow
|
|
HSPCs
|
hematopoietic stem and progenitor
cells
|
|
NBM
|
non-leukemic bone marrow
|
|
GFP
|
green fluorescent protein
|
|
RLU
|
relative light units
|
|
ChIP
|
chromatin immunoprecipitation
|
|
PVDF
|
polyvinylidene fluoride
|
|
DMSO
|
dimethyl sulfoxide
|
|
IF
|
immunofluorescence
|
|
DAPI
|
4′,6-diamidino-2-phenylindole
|
|
MTT
|
3,(4,5-dimethylthiazol-2-yl)-2,5-diphenyl-tetrazolium bromide
|
|
SP1
|
specificity protein 1
|
|
EGR1
|
early growth response protein 1
|
|
GAPDH
|
glyceraldehyde 3-phosphate
dehydrogenase
|
References
|
1
|
Goswami M, McGowan KS, Lu K, Panch SR,
Hensel NF, Battiwalla M, Barrett AJ and Hourigan CS: A novel
multi-gene expression array allows highly sensitive detection of
minimal residual disease and predicts relapse outcomes in acute
myeloid leukemia. Blood. 122:33182013.
|
|
2
|
Rauscher FJ III: The WT1 Wilms tumor gene
product: A developmentally regulated transcription factor in the
kidney that functions as a tumor suppressor. FASEB J. 7:896–903.
1993. View Article : Google Scholar : PubMed/NCBI
|
|
3
|
Yang R, Morosetti R and Koeffler HP:
Characterization of a second human cyclin A that is highly
expressed in testis and in several leukemic cell lines. Cancer Res.
57:913–920. 1997.PubMed/NCBI
|
|
4
|
Stirewalt DL, Meshinchi S, Kopecky KJ, Fan
W, Pogosova-Agadjanyan EL, Engel JH, Cronk MR, Dorcy KS, McQuary
AR, Hockenbery D, et al: Identification of genes with abnormal
expression changes in acute myeloid leukemia. Genes Chromosomes
Cancer. 47:8–20. 2008. View Article : Google Scholar : PubMed/NCBI
|
|
5
|
Hollink IH, van den Heuvel-Eibrink MM,
Zimmermann M, Balgobind BV, Arentsen-Peters ST, Alders M, Willasch
A, Kaspers GJ, Trka J, Baruchel A, et al: Clinical relevance of
Wilms tumor 1 gene mutations in childhood acute myeloid leukemia.
Blood. 113:5951–5960. 2009. View Article : Google Scholar : PubMed/NCBI
|
|
6
|
Ekberg J, Holm C, Jalili S, Richter J,
Anagnostaki L, Landberg G and Persson JL: Expression of cyclin A1
and cell cycle proteins in hematopoietic cells and acute myeloid
leukemia and links to patient outcome. Eur J Haematol. 75:106–115.
2005. View Article : Google Scholar : PubMed/NCBI
|
|
7
|
Anguille S, Van Tendeloo VF and Berneman
ZN: Leukemia-associated antigens and their relevance to the
immunotherapy of acute myeloid leukemia. Leukemia. 26:2186–2196.
2012. View Article : Google Scholar : PubMed/NCBI
|
|
8
|
Goswami M, Hensel N, Smith BD, Prince GT,
Qin L, Levitsky HI, Strickland SA, Jagasia M, Savani BN, Fraser JW,
et al: Expression of putative targets of immunotherapy in acute
myeloid leukemia and healthy tissues. Leukemia. 28:1167–1170. 2014.
View Article : Google Scholar : PubMed/NCBI
|
|
9
|
Steinbach D, Schramm A, Eggert A, Onda M,
Dawczynski K, Rump A, Pastan I, Wittig S, Pfaffendorf N, Voigt A,
et al: Identification of a set of seven genes for the monitoring of
minimal residual disease in pediatric acute myeloid leukemia. Clin
Cancer Res. 12:2434–2441. 2006. View Article : Google Scholar : PubMed/NCBI
|
|
10
|
Goswami M, McGowan KS, Lu K, Jain NA,
Candia J, Hensel NF, Tang J, Calvo KR, Battiwalla M, Barrett AJ and
Hourigan CS: A novel multi-gene array allows relapse risk
stratification in acute myeloid leukemia patients undergoing stem
cell transplantation. Blood. 124:6672014.
|
|
11
|
Holm C, Ora I, Brunhoff C, Anagnostaki L,
Landberg G and Persson JL: Cyclin A1 expression and associations
with disease characteristics in childhood acute lymphoblastic
leukemia. Leuk Res. 30:254–261. 2006. View Article : Google Scholar : PubMed/NCBI
|
|
12
|
Brett A, Pandey S and Fraizer G: The
Wilms' tumor gene (WT1) regulates E-cadherin expression and
migration of prostate cancer cells. Mol Cancer. 12:32013.
View Article : Google Scholar : PubMed/NCBI
|
|
13
|
Hanson J, Gorman J, Reese J and Fraizer G:
Regulation of vascular endothelial growth factor, VEGF, gene
promoter by the tumor suppressor, WT1. Front Biosci. 12:2279–2290.
2007. View Article : Google Scholar : PubMed/NCBI
|
|
14
|
McCarty G, Awad O and Loeb DM: WT1 protein
directly regulates expression of vascular endothelial growth factor
and is a mediator of tumor response to hypoxia. J Biol Chem.
286:43634–43643. 2011. View Article : Google Scholar : PubMed/NCBI
|
|
15
|
Morrison AA, Viney RL and Ladomery MR: The
post-transcriptional roles of WT1, a multifunctional zinc-finger
protein. Biochim Biophys Acta. 1785:55–62. 2008.PubMed/NCBI
|
|
16
|
Xu C, Wu C, Xia Y, Zhong Z, Liu X, Xu J,
Cui F, Chen B, Røe OD, Li A and Chen Y: WT1 promotes cell
proliferation in non-small cell lung cancer cell lines through
up-regulating cyclin D1 and p-pRb in vitro and in vivo. PLoS One.
8:e688372013. View Article : Google Scholar : PubMed/NCBI
|
|
17
|
Loeb DM, Korz D, Katsnelson M, Burwell EA,
Friedman AD and Sukumar S: Cyclin E is a target of WT1
transcriptional repression. J Biol Chem. 277:19627–19632. 2002.
View Article : Google Scholar : PubMed/NCBI
|
|
18
|
Krug U, Yasmeen A, Beger C, Baumer N,
Dugas M, Berdel WE and Müller-Tidow C: Cyclin A1 regulates WT1
expression in acute myeloid leukemia cells. Int J Oncol.
34:129–136. 2009.PubMed/NCBI
|
|
19
|
Liu D, Matzuk MM, Sung WK, Guo Q, Wang P
and Wolgemuth DJ: Cyclin A1 is required for meiosis in the male
mouse. Nat Genet. 20:377–380. 1998. View
Article : Google Scholar : PubMed/NCBI
|
|
20
|
Miftakhova R, Hedblom A, Batkiewicz L,
Anagnosaki L, Zhang Y, Sjölander A, Wingren AG, Wolgemuth DJ and
Persson JL: Cyclin A1 regulates the interactions between mouse
haematopoietic stem and progenitor cells and their niches. Cell
Cycle. 14:1948–1960. 2015. View Article : Google Scholar : PubMed/NCBI
|
|
21
|
Ji P, Agrawal S, Diederichs S, Bäumer N,
Becker A, Cauvet T, Kowski S, Beger C, Welte K, Berdel WE, et al:
Cyclin A1, the alternative A-type cyclin, contributes to G1/S cell
cycle progression in somatic cells. Oncogene. 24:2739–2744. 2005.
View Article : Google Scholar : PubMed/NCBI
|
|
22
|
Yang R, Müller C, Huynh V, Fung YK, Yee AS
and Koeffler HP: Functions of cyclin A1 in the cell cycle and its
interactions with transcription factor E2F-1 and the Rb family of
proteins. Mol Cell Biol. 19:2400–2407. 1999. View Article : Google Scholar : PubMed/NCBI
|
|
23
|
Jang SW, Yang S, Ehlén A, Dong S, Khoury
H, Chen J, Persson JL and Ye K: Serine/arginine protein-specific
kinase 2 promotes leukemia cell proliferation by phosphorylating
acinus and regulating cyclin A1. Cancer Res. 68:4559–4570. 2008.
View Article : Google Scholar : PubMed/NCBI
|
|
24
|
Coletta RD, Christensen K, Reichenberger
KJ, Lamb J, Micomonaco D, Huang L, Wolf DM, Müller-Tidow C, Golub
TR, Kawakami K and Ford HL: The Six1 homeoprotein stimulates
tumorigenesis by reactivation of cyclin A1. Proc Natl Acad Sci USA.
101:6478–6483. 2004. View Article : Google Scholar : PubMed/NCBI
|
|
25
|
Yamagami T, Sugiyama H, Inoue K, Ogawa H,
Tatekawa T, Hirata M, Kudoh T, Akiyama T, Murakami A and Maekawa T:
Growth inhibition of human leukemic cells by WT1 (Wilms tumor gene)
antisense oligodeoxynucleotides: Implications for the involvement
of WT1 in leukemogenesis. Blood. 87:2878–2884. 1996.PubMed/NCBI
|
|
26
|
Glienke W, Maute L, Koehl U, Esser R, Milz
E and Bergmann L: Effective treatment of leukemic cell lines with
wt1 siRNA. Leukemia. 21:2164–2170. 2007. View Article : Google Scholar : PubMed/NCBI
|
|
27
|
Wegiel B, Bjartell A, Ekberg J, Gadaleanu
V, Brunhoff C and Persson JL: A role for cyclin A1 in mediating the
autocrine expression of vascular endothelial growth factor in
prostate cancer. Oncogene. 24:6385–6393. 2005. View Article : Google Scholar : PubMed/NCBI
|
|
28
|
Wegiel B, Bjartell A, Culig Z and Persson
JL: Interleukin-6 activates PI3K/Akt pathway and regulates cyclin
A1 to promote prostate cancer cell survival. Int J Cancer.
122:1521–1529. 2008. View Article : Google Scholar : PubMed/NCBI
|
|
29
|
Syed Khaja AS, Dizeyi N, Kopparapu PK,
Anagnostaki L, Härkönen P and Persson JL: Cyclin A1 modulates the
expression of vascular endothelial growth factor and promotes
hormone-dependent growth and angiogenesis of breast cancer. PLoS
One. 8:e722102013. View Article : Google Scholar : PubMed/NCBI
|
|
30
|
Wegiel B, Bjartell A, Tuomela J, Dizeyi N,
Tinzl M, Helczynski L, Nilsson E, Otterbein LE, Härkönen P and
Persson JL: Multiple cellular mechanisms related to cyclin A1 in
prostate cancer invasion and metastasis. J Natl Cancer Inst.
100:1022–1036. 2008. View Article : Google Scholar : PubMed/NCBI
|
|
31
|
Gregg J, Brown K, Mintz E, Piontkivska H
and Fraizer G: Analysis of gene expression in prostate cancer
epithelial and interstitial stromal cells using laser capture
microdissection. BMC Cancer. 10:1652010. View Article : Google Scholar : PubMed/NCBI
|
|
32
|
Livak KJ and Schmittgen TD: Analysis of
relative gene expression data using real-time quantitative PCR and
the 2(-Delta Delta C(T)) method. Methods. 25:402–408. 2001.
View Article : Google Scholar : PubMed/NCBI
|
|
33
|
Haferlach T, Kohlmann A, Wieczorek L,
Basso G, Kronnie GT, Béné MC, De Vos J, Hernández JM, Hofmann WK,
Mills KI, et al: Clinical utility of microarray-based gene
expression profiling in the diagnosis and subclassification of
leukemia: Report from the International Microarray Innovations In
Leukemia Study Group. J Clin Oncol. 28:2529–2537. 2010. View Article : Google Scholar : PubMed/NCBI
|
|
34
|
Madden SL, Cook DM, Morris JF, Gashler A,
Sukhatme VP and Rauscher FJ III: Transcriptional repression
mediated by the WT1 Wilms tumor gene product. Science.
253:1550–1553. 1991. View Article : Google Scholar : PubMed/NCBI
|
|
35
|
King-Underwood L, Renshaw J and
Pritchard-Jones K: Mutations in the Wilms' tumor gene WT1 in
leukemias. Blood. 87:2171–2179. 1996.PubMed/NCBI
|
|
36
|
Ho PA, Zeng R, Alonzo TA, Gerbing RB,
Miller KL, Pollard JA, Stirewalt DL, Heerema NA, Raimondi SC,
Hirsch B, et al: Prevalence and prognostic implications of WT1
mutations in pediatric acute myeloid leukemia (AML): A report from
the Children's Oncology Group. Blood. 116:702–710. 2010. View Article : Google Scholar : PubMed/NCBI
|
|
37
|
Anuchapreeda S, Thanarattanakorn P,
Sittipreechacharn S, Chanarat P and Limtrakul P: Curcumin inhibits
WT1 gene expression in human leukemic K562 cells. Acta Pharmacol
Sin. 27:360–366. 2006. View Article : Google Scholar : PubMed/NCBI
|
|
38
|
Cilloni D, Renneville A, Hermitte F, Hills
RK, Daly S, Jovanovic JV, Gottardi E, Fava M, Schnittger S, Weiss
T, et al: Real-time quantitative polymerase chain reaction
detection of minimal residual disease by standardized WT1 assay to
enhance risk stratification in acute myeloid leukemia: A European
LeukemiaNet study. J Clin Oncol. 27:5195–5201. 2009. View Article : Google Scholar : PubMed/NCBI
|
|
39
|
Dores GM, Devesa SS, Curtis RE, Linet MS
and Morton LM: Acute leukemia incidence and patient survival among
children and adults in the United States, 2001–2007. Blood.
119:34–43. 2012. View Article : Google Scholar : PubMed/NCBI
|
|
40
|
Boublikova L, Kalinova M, Ryan J, Quinn F,
O'Marcaigh A, Smith O, Browne P, Stary J, McCann SR, Trka J and
Lawler M: Wilms' tumor gene 1 (WT1) expression in childhood acute
lymphoblastic leukemia: A wide range of WT1 expression levels, its
impact on prognosis and minimal residual disease monitoring.
Leukemia. 20:254–263. 2006. View Article : Google Scholar : PubMed/NCBI
|
|
41
|
Cilloni D, Gottardi E, De Micheli D, Serra
A, Volpe G, Messa F, Rege-Cambrin G, Guerrasio A, Divona M, Lo Coco
F and Saglio G: Quantitative assessment of WT1 expression by real
time quantitative PCR may be a useful tool for monitoring minimal
residual disease in acute leukemia patients. Leukemia.
16:2115–2121. 2002. View Article : Google Scholar : PubMed/NCBI
|
|
42
|
Yang R, Nakamaki T, Lübbert M, Said J,
Sakashita A, Freyaldenhoven BS, Spira S, Huynh V, Müller C and
Koeffler HP: Cyclin A1 expression in leukemia and normal
hematopoietic cells. Blood. 93:2067–2074. 1999.PubMed/NCBI
|
|
43
|
Kramer A, Hochhaus A, Saussele S, Reichert
A, Willer A and Hehlmann R: Cyclin A1 is predominantly expressed in
hematological malignancies with myeloid differentiation. Leukemia.
12:893–898. 1998. View Article : Google Scholar : PubMed/NCBI
|
|
44
|
Busse A, Gökbuget N, Siehl JM, Hoelzer D,
Schwartz S, Rietz A, Thiel E and Keilholz U: Wilms' tumor gene 1
(WT1) expression in subtypes of acute lymphoblastic leukemia (ALL)
of adults and impact on clinical outcome. Ann Hematol.
88:1199–1205. 2009. View Article : Google Scholar : PubMed/NCBI
|
|
45
|
Loeb DM and Sukumar S: The role of WT1 in
oncogenesis: Tumor suppressor or oncogene? Int J Hematol.
76:117–126. 2002. View Article : Google Scholar : PubMed/NCBI
|
|
46
|
Anuchapreeda S, Limtrakul P,
Thanarattanakorn P, Sittipreechacharn S and Chanarat P: Inhibitory
effect of curcumin on WT1 gene expression in patient leukemic
cells. Arch Pharm Res. 29:80–87. 2006. View Article : Google Scholar : PubMed/NCBI
|
|
47
|
Glienke W, Maute L, Wicht J and Bergmann
L: Wilms' tumour gene 1 (WT1) as a target in curcumin treatment of
pancreatic cancer cells. Eur J Cancer. 45:874–880. 2009. View Article : Google Scholar : PubMed/NCBI
|
|
48
|
Kunnumakkara AB, Anand P and Aggarwal BB:
Curcumin inhibits proliferation, invasion, angiogenesis and
metastasis of different cancers through interaction with multiple
cell signaling proteins. Cancer Lett. 269:199–225. 2008. View Article : Google Scholar : PubMed/NCBI
|
|
49
|
Müller C, Yang R, Beck-von-Peccoz L, Idos
G, Verbeek W and Koeffler HP: Cloning of the cyclin A1 genomic
structure and characterization of the promoter region. GC boxes are
essential for cell cycle-regulated transcription of the cyclin A1
gene. J Biol Chem. 274:11220–11228. 1999. View Article : Google Scholar : PubMed/NCBI
|
|
50
|
Kadonaga JT, Carner KR, Masiarz FR and
Tjian R: Isolation of cDNA encoding transcription factor Sp1 and
functional analysis of the DNA binding domain. Cell. 51:1079–1090.
1987. View Article : Google Scholar : PubMed/NCBI
|
|
51
|
Wang ZY, Madden SL, Deuel TF and Rauscher
FJ III: The Wilms' tumor gene product, WT1, represses transcription
of the platelet-derived growth factor A-chain gene. J Biol Chem.
267:21999–22002. 1992.PubMed/NCBI
|
|
52
|
Eisermann K, Tandon S, Bazarov A, Brett A,
Fraizer G and Piontkivska H: Evolutionary conservation of zinc
finger transcription factor binding sites in promoters of genes
co-expressed with WT1 in prostate cancer. BMC Genomics. 9:3372008.
View Article : Google Scholar : PubMed/NCBI
|
|
53
|
Rauscher FJ III, Morris JF, Tournay OE,
Cook DM and Curran T: Binding of the Wilms' tumor locus zinc finger
protein to the EGR-1 consensus sequence. Science. 250:1259–1262.
1990. View Article : Google Scholar : PubMed/NCBI
|
|
54
|
Miller DM, Polansky DA, Thomas SD, Ray R,
Campbell VW, Sanchez J and Koller CA: Mithramycin selectively
inhibits transcription of G-C containing DNA. Am J Med Sci.
294:388–394. 1987. View Article : Google Scholar : PubMed/NCBI
|
|
55
|
Lyu CJ, Rha SY and Won SC: Clinical role
of bone marrow angiogenesis in childhood acute lymphocytic
leukemia. Yonsei Med J. 48:171–175. 2007. View Article : Google Scholar : PubMed/NCBI
|
|
56
|
Yetgin S, Yenicesu I, Icletin M and Tuncer
M: Clinical importance of serum vascular endothelial and basic
fibroblast growth factors in children with acute lymphoblastic
leukemia. Leuk Lymphoma. 42:83–88. 2001. View Article : Google Scholar : PubMed/NCBI
|
|
57
|
Koomagi R, Zintl F, Sauerbrey A and Volm
M: Vascular endothelial growth factor in newly diagnosed and
recurrent childhood acute lymphoblastic leukemia as measured by
real-time quantitative polymerase chain reaction. Clin Cancer Res.
7:3381–3384. 2001.PubMed/NCBI
|