Introduction
Renal cell carcinoma (RCC) is a common type of
kidney cancer in adults (1,2). The incidence of RCC is increasing and
~270,000 cases are diagnosed on an annual basis worldwide (3). Important risk factors for RCC include
obesity, hypertension, smoking and advanced kidney disease
(4,5).
In particular, a body mass index (BMI) >25 kg/m2 has
been found to be significantly correlated with an increased risk of
RCC (6,7).
Apart from insulin signaling and insulin-like growth
factor, adipocytokines released from adipose tissue may represent a
link between obesity and RCC (8–10). The
inflammatory marker tumor necrosis factor (TNF)-α is upregulated in
RCC patients and may promote RCC (11,12). Human
perirenal adipose tissue (PAT) is located in the retroperitoneum
and protects the kidneys and renal arteries from external
mechanical forces. Lamacchia et al (13) found that the thickness of PAT may
predict chronic kidney disease and hyperuricemia in patients with
diabetes. Furthermore, tumor invasion in the PAT is an indicator of
poor prognosis (14,15). However, the role of PAT in RCC remains
unclear.
Adipose tissue includes brown adipose tissue (BAT)
and white adipose tissue (WAT). While WAT serves as energy storage,
BAT dissipates the energy as heat. Uncoupling protein 1 (UCP1) is a
protein specifically expressed in BAT to promote the uncoupling of
the respiratory chain and the conversion of energy to heat
(16). BAT has been reported to be
involved in several human diseases, such as cancer-associated
cachexia (17–21). A previous study reported that PAT is a
brown fat-like deposit, and UCP1 expression in the PAT of
hypertensive patients is lower compared with that in controls
(22). However, to the best of our
knowledge, the association between UCP1 expression in PAT and RCC
has not been reported to date. The aim of the present study was to
determine UCP1 expression in different parts of the PAT, and to
analyze the association between UCP1 expression in the PAT and
RCC.
Patients and methods
Patients
A total of 50 RCC patients and 54 patients with
renal cyst undergoing retroperitoneal laparoscopic surgery were
recruited in the present study. Patients with chronic kidney
disease, musculoskeletal diseases, inflammatory or autoimmune
diseases and adrenal or other tumors were excluded from the study.
All RCC cases were confirmed as clear cell carcinoma by
postoperative pathological diagnosis. All renal cyst cases were
simple cysts, without infection or hemorrhage. Moreover, renal
cysts, unlike tumors, do not secrete any cytokines that may affect
PAT and bSAT. Therefore, renal cyst cases were used as the control
group. The patients in both the RCC and control groups were matched
for age and BMI. PAT samples were collected between February 2013
and October 2013, in order to avoid the effect of winter on UCP1
expression in adipose tissue. All the subjects stayed in the
patients' ward, under a controlled temperature at ~20-25°C for 3–4
days prior to surgery. When undergoing elective surgery, the
temperature of the operating theater was also controlled at
20–25°C. PAT was analyzed by dividing it into two different parts:
Upper and lower renal pole PAT. The different sources of PAT were
removed using a standard endoscopic retroperitoneal approach and
bSAT was removed using a scalpel; both were kept at −80°C. The
Ethical Board of Nanjing Medical University approved the study
protocols and all subjects provided written informed consent.
Clinical data, including age, gender, history of
hypertension and diabetes, smoking status, body mass index (BMI),
waist circumference (WC), basal body temperature (BBT), systolic
and diastolic blood pressure (SBP and DBP, respectively) and
resting heart rate (RHR), were collected from medical records.
Fasting blood samples were collected, and then the plasma levels of
glucose, creatinine (Cr), triglyceride (TG), low-density
lipoprotein cholesterol (LDL-C), high-density lipoprotein
cholesterol (HDL-C), total cholesterol (TC), as well as the
creatinine clearance rate (CCr), were measured on a Hitachi 7600
automatic analyzer (Boehringer Mannheim).
Reverse transcription-quantitative
polymerase chain reaction (RT-qPCR) analysis
Total RNA was isolated from tissues using TRIzol
(Life Technologies; Thermo Fisher Scientific, Inc.). Total RNA (2
µg) was reverse-transcribed with 200 U M-MLV RT (Promega
Corporation), in the presence of 0.5 mmol/l deoxynucleotide
triphosphate, 25 U RNase inhibitor and 0.5 mg N15 random primers,
in a total volume of 25 µl. The primers were designed by Primer 5
software (Premier, Inc.) and are listed in supplementary Table SI. PCR was performed in triplicate
using a SYBR Green PCR Master kit (Toyobo Life Sciences) in a 25-µl
volume. The PCR program was designed as follows: 60 sec at 95°C,
followed by 40 cycles of 15 sec at 95°C, 15 sec at 60°C, 45 sec at
72°C, and 5 sec at 80°C on a plate reader (Rotor Gene-3000; Corbett
Research). Expression levels were calculated based on the
2−ΔΔCq method (23).
Western blot analysis
Tissues were incubated in RIPA buffer, and equal
amounts of lysates were separated by 10% SDS-PAGE and transferred
to a polyvinylidene difluoride membrane (EMD Millipore). The
membranes were incubated with primary antibodies against UCP1
(rabbit polyclonal, 1:1,000; Abcam; ab10983) or tubulin (rabbit
polyclonal, 1:5,000; Abcam; ab59680) at 4°C for 12 h, and
sequentially incubated with secondary antibodies (sheep anti-rabbit
polyclonal IgG labeled with horseradish peroxidase, 1:20,000;
Abcam; ab6795) at room temperature for 2 h. Protein levels were
quantified using Quantity One software (Bio-Rad Laboratories,
Inc.).
Immunohistochemical analysis
Tissues were fixed in 10% formalin, embedded in
paraffin, cut into 5-µm sections and stained with hematoxylin and
eosin for morphological observation. The sections were then
incubated with UCP1 antibody (rabbit polyclonal, 1:500; Abcam;
ab10983) for 30 min, and then with secondary antibody for UCP1
staining (sheep anti-rabbit polyclonal IgG labeled with horseradish
peroxidase, 1:800; Abcam; ab6795). The staining results were
analyzed using CellSense Dimension software (Olympus
Corporation).
Statistical analysis
Data were analyzed using SPSS v20.0 software (IBM
Corp.). Continuous variables were analyzed by t-test, and
categorical variables were analyzed by χ2 test.
Spearman's correlation analyzed the association between the
variables and linear regression analysis assessed the strength of
the association. P<0.05 (two-tailed) was considered to indicate
a statistically significant difference.
Results
Expression levels of UCP1 in different
parts of PAT
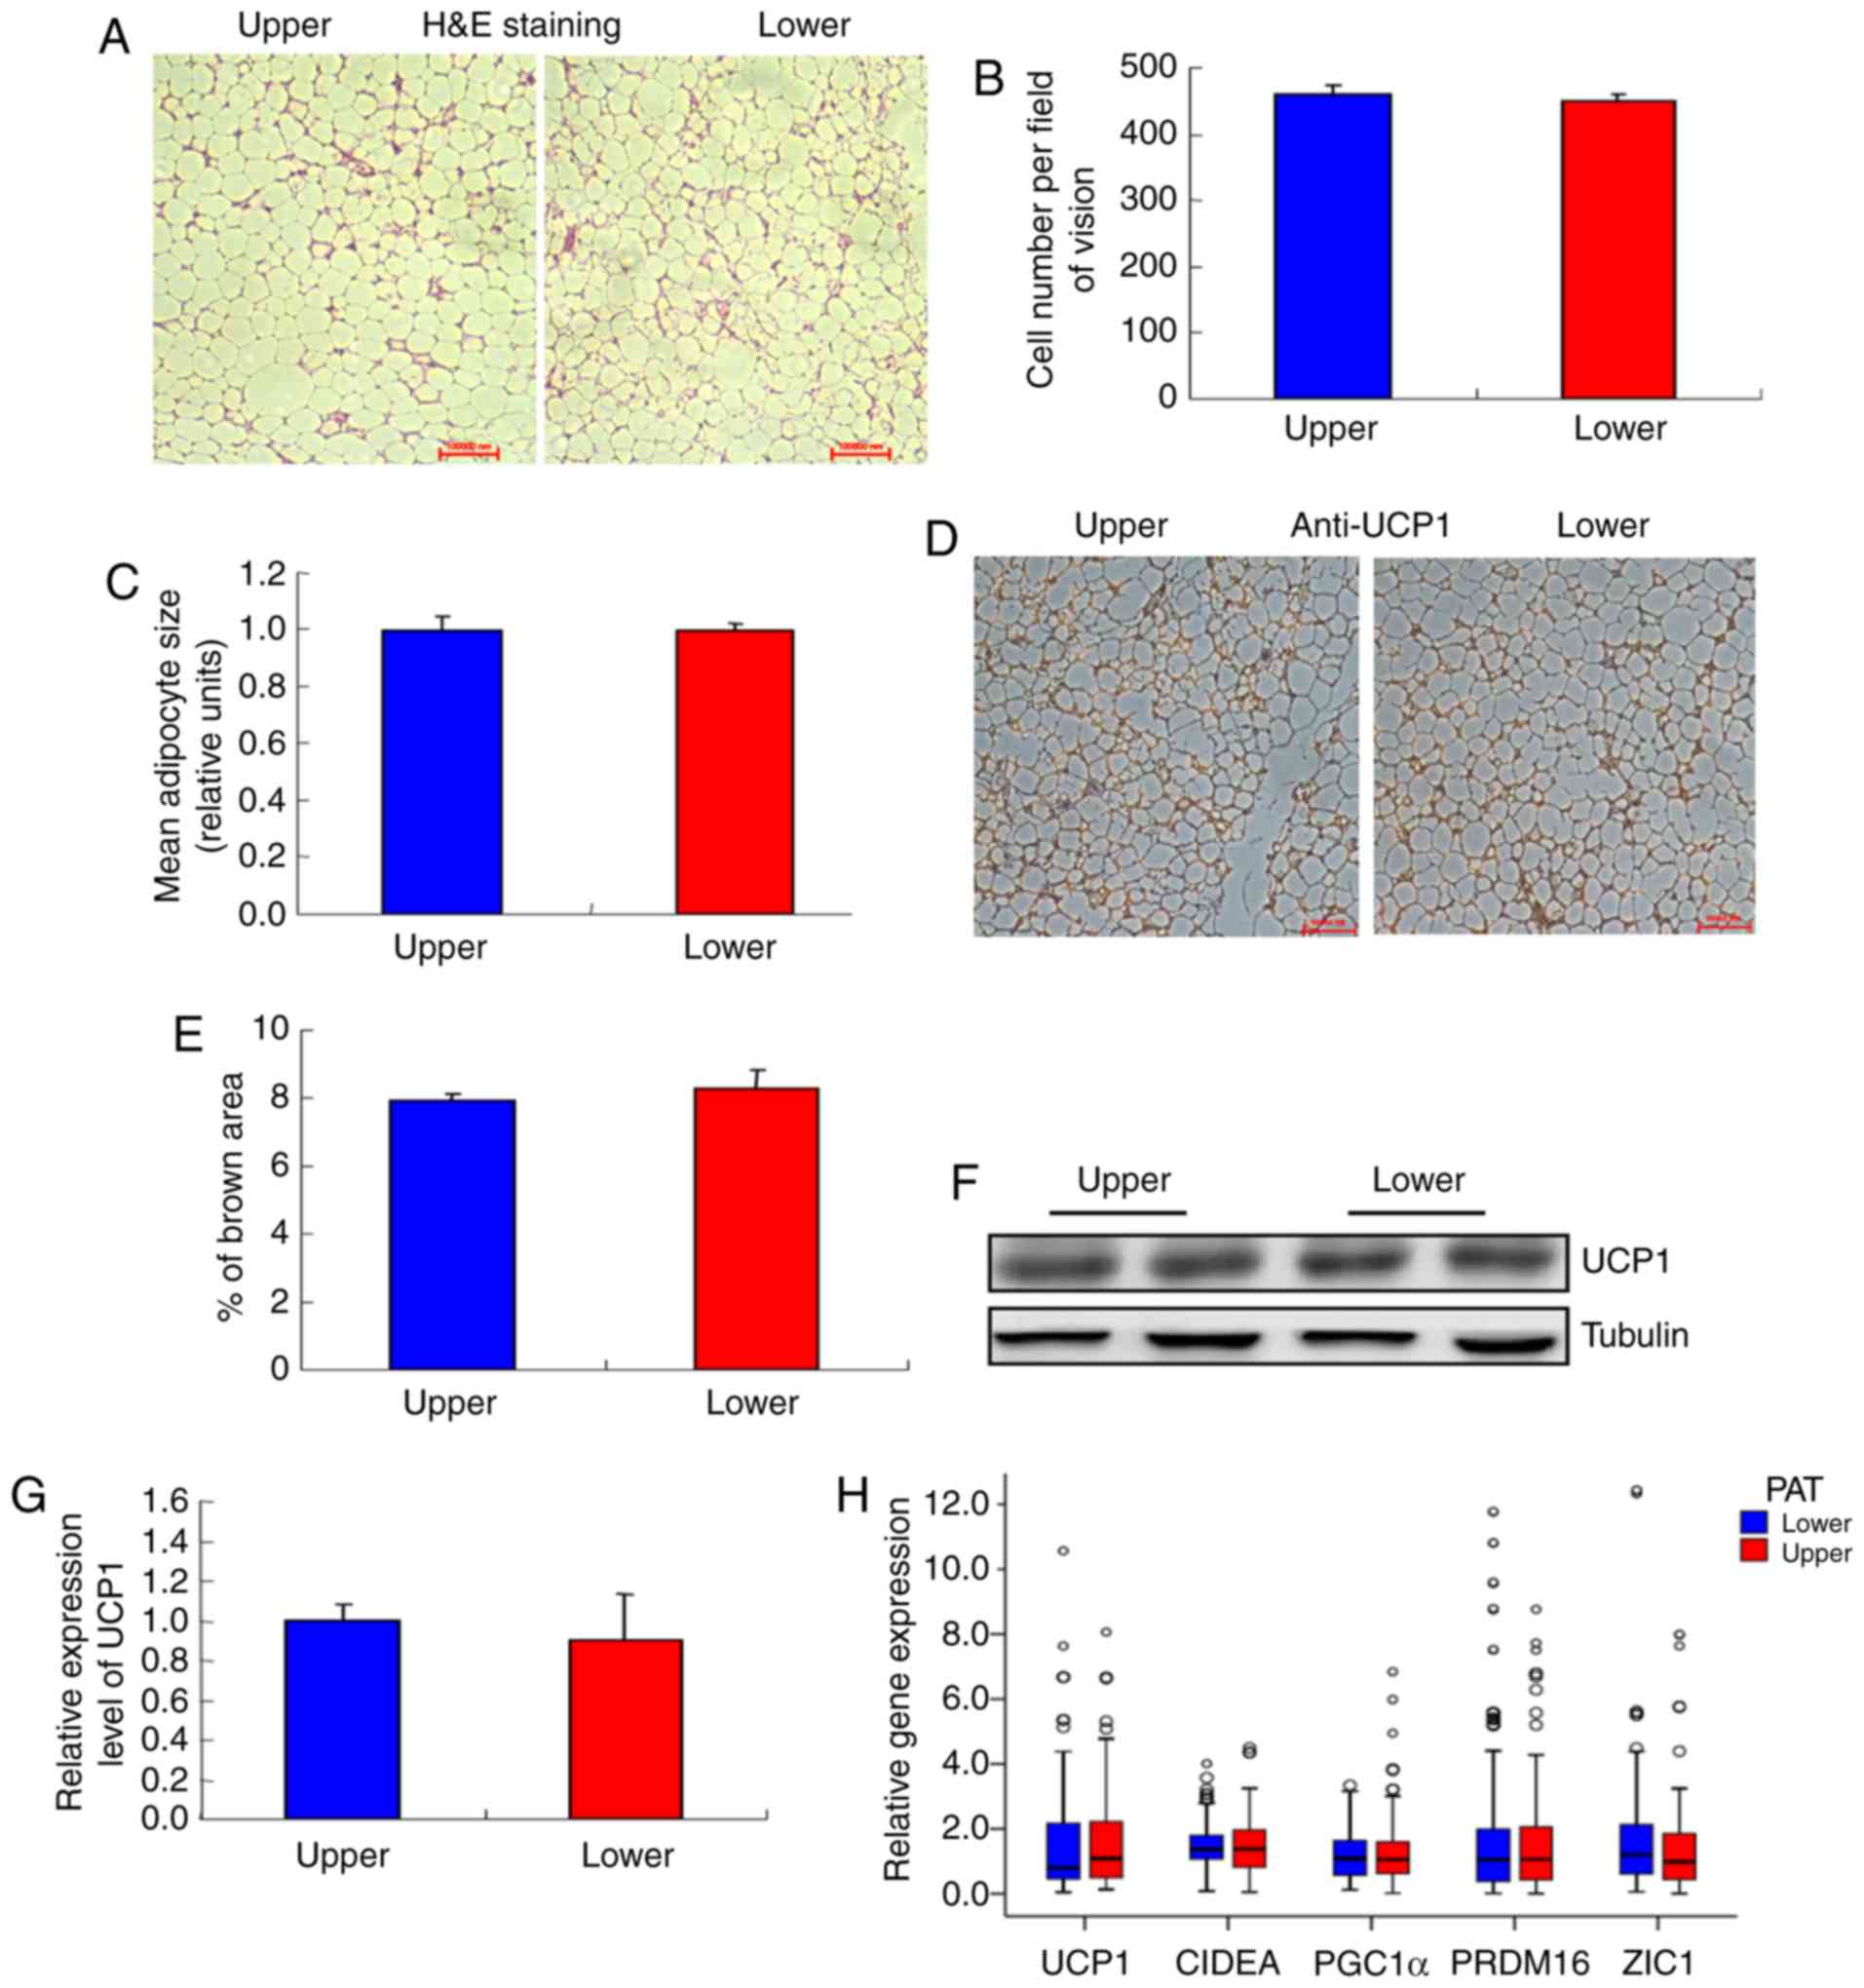
PAT was divided into two parts, namely upper and
lower renal pole PAT, and it was observed that the adipocytes in
the two different sources of PAT were similar (Fig. 1A and B), as were the cell numbers
(Fig. 1C). Moreover, there was no
difference in UCP1 staining between the two sources (Fig. 1D and E). Furthermore, there were no
differences in UCP1 mRNA and protein levels between the two sources
(Fig. 1F-H). In addition, the
expression of BAT genes, WAT genes, proinflammatory cytokines,
adipocytokines and mitochondrial genes were compared between the
two different sources of PAT, and no significant differences were
observed (Fig. 1H-M).
The expression levels of UCP1 are
higher in PAT from RCC
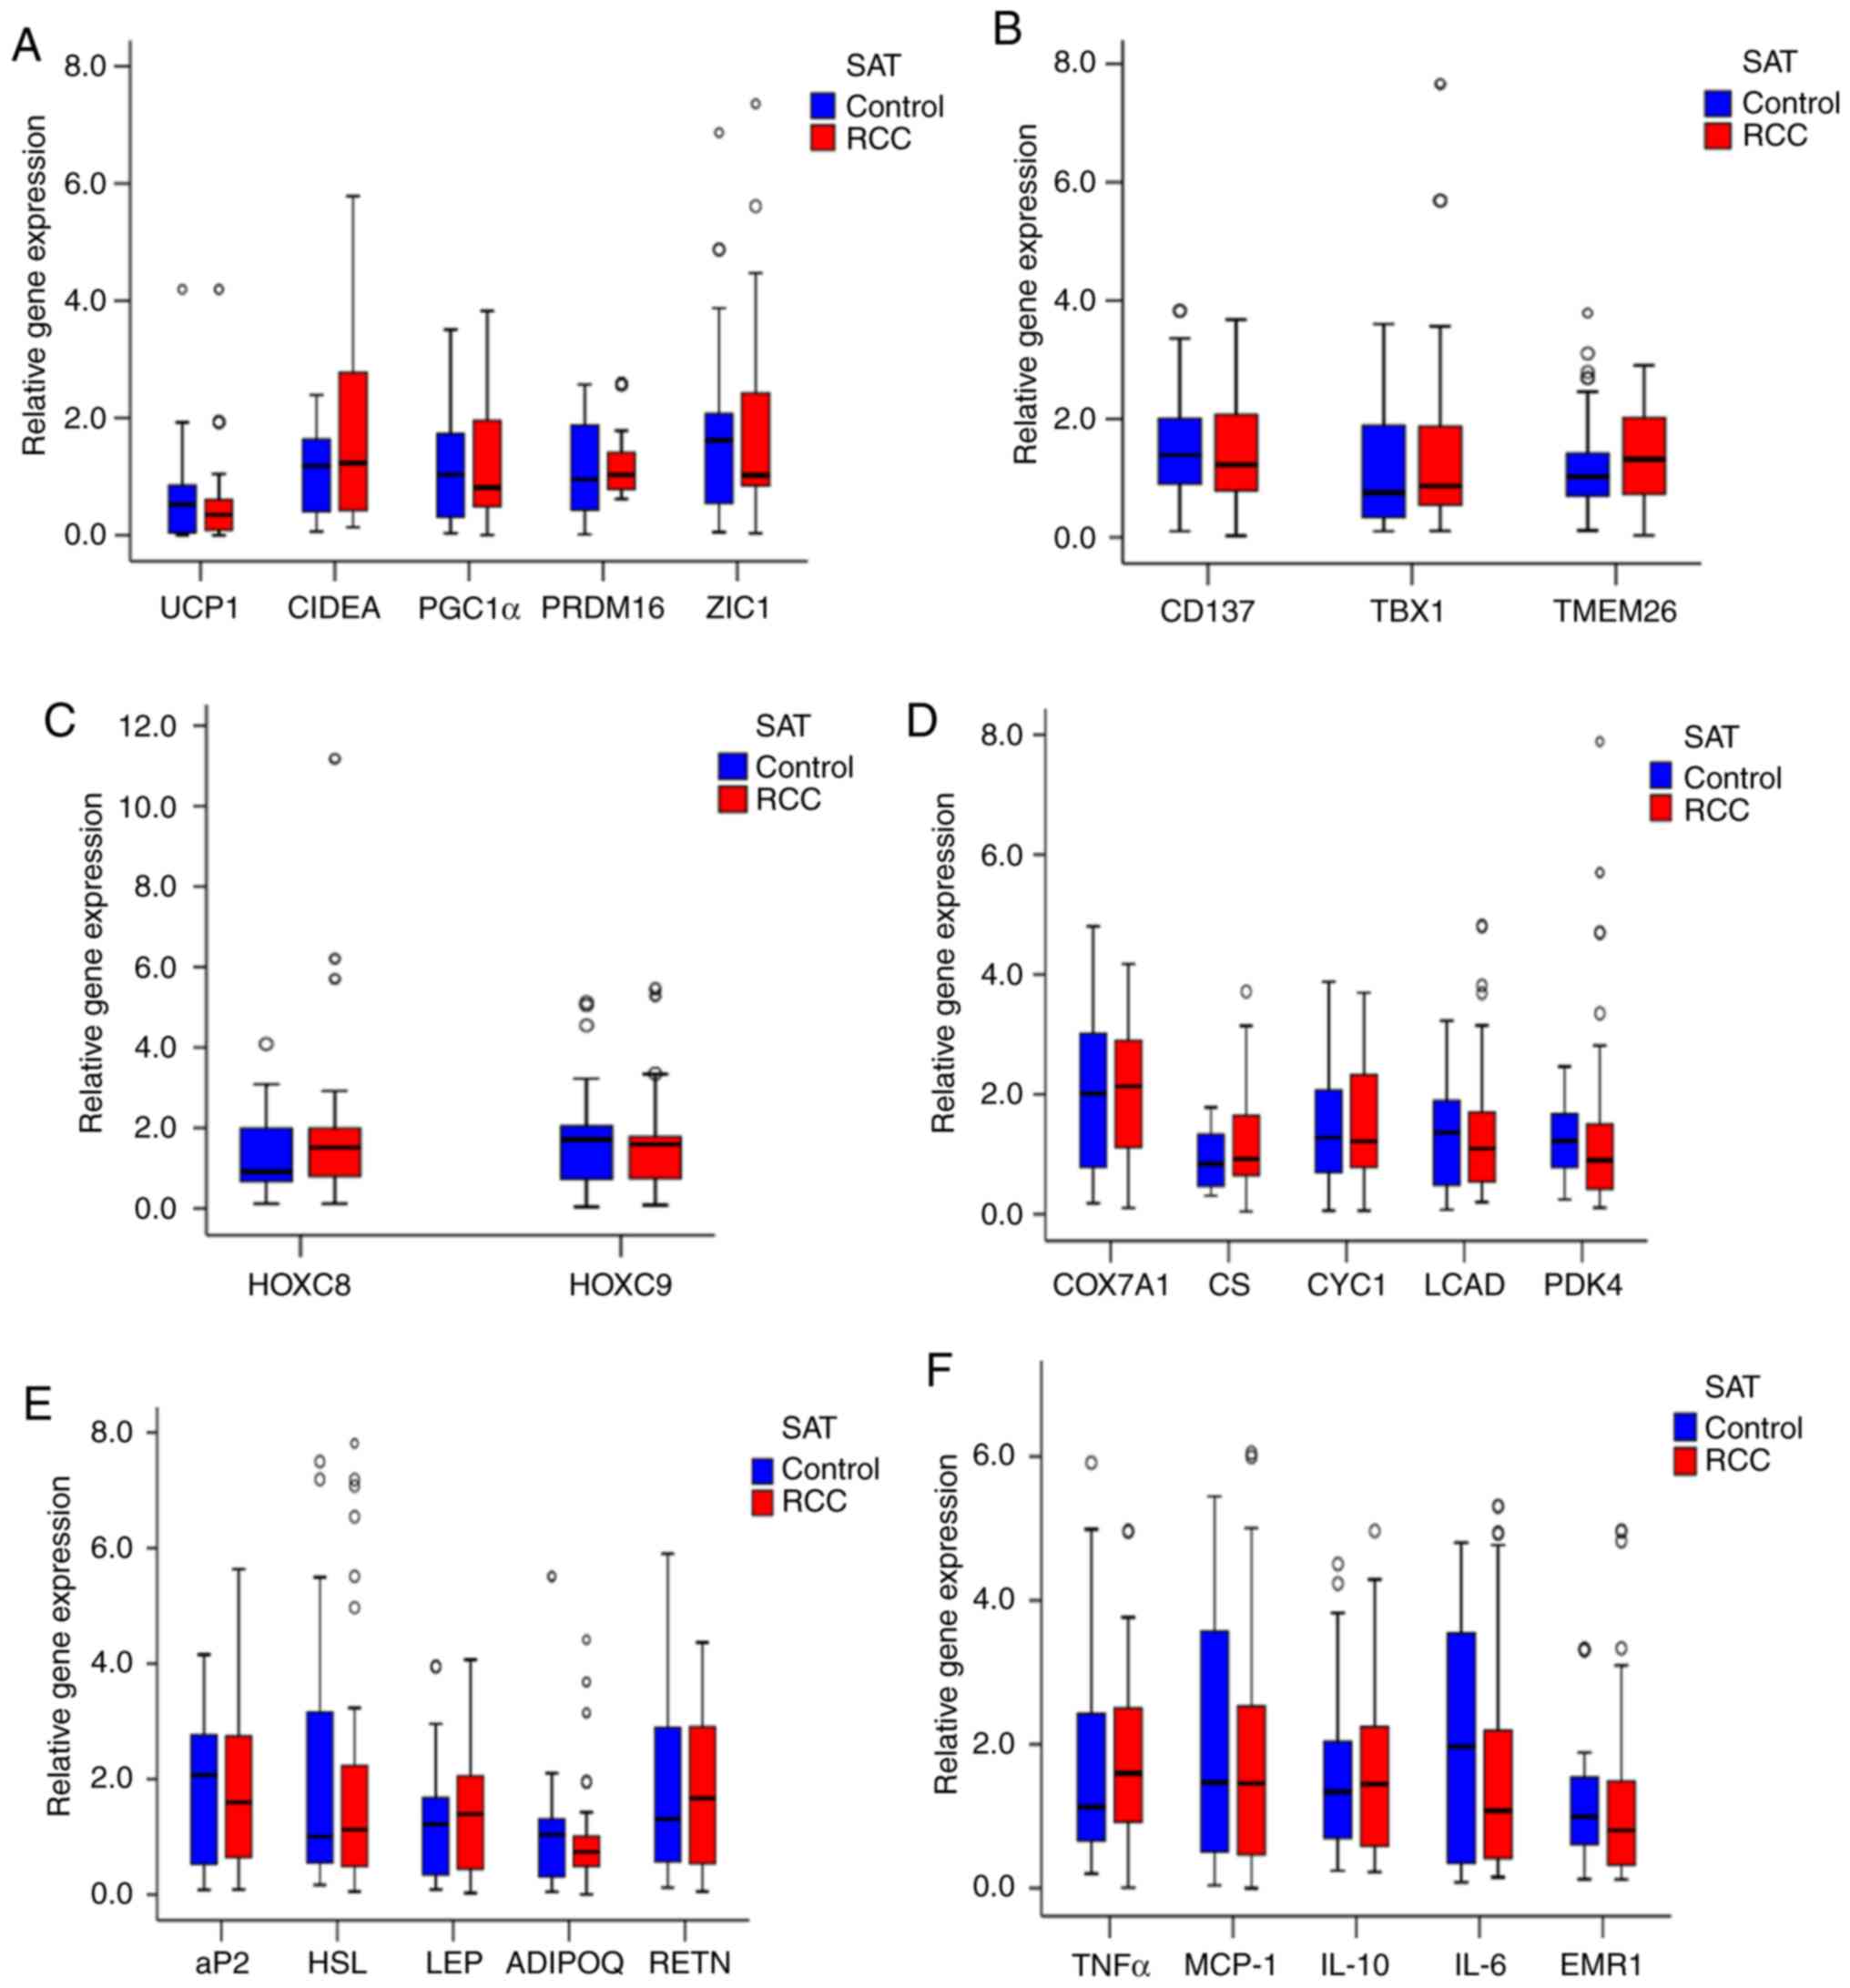
Next, the expression of UCP1 in bSAT samples from
the RCC and control groups was examined, and no significant
differences in UCP1 mRNA expression (Fig.
2A) and other mRNA expression (Fig.
2A-F) were observed. In addition, the adipocytes were smaller
in the PAT of the RCC group compared with that of the control group
(Fig. 3A and B) and their number was
significantly higher compared with the control group (Fig. 3C). Furthermore, multilocular
adipocytes were significantly smaller and UCP1 staining was
stronger in the PAT from the RCC group (Fig. 3D and E), whereas both the mRNA and
protein levels of UCP1 were higher in the RCC group compared with
those in the control group (Fig.
3F-H).
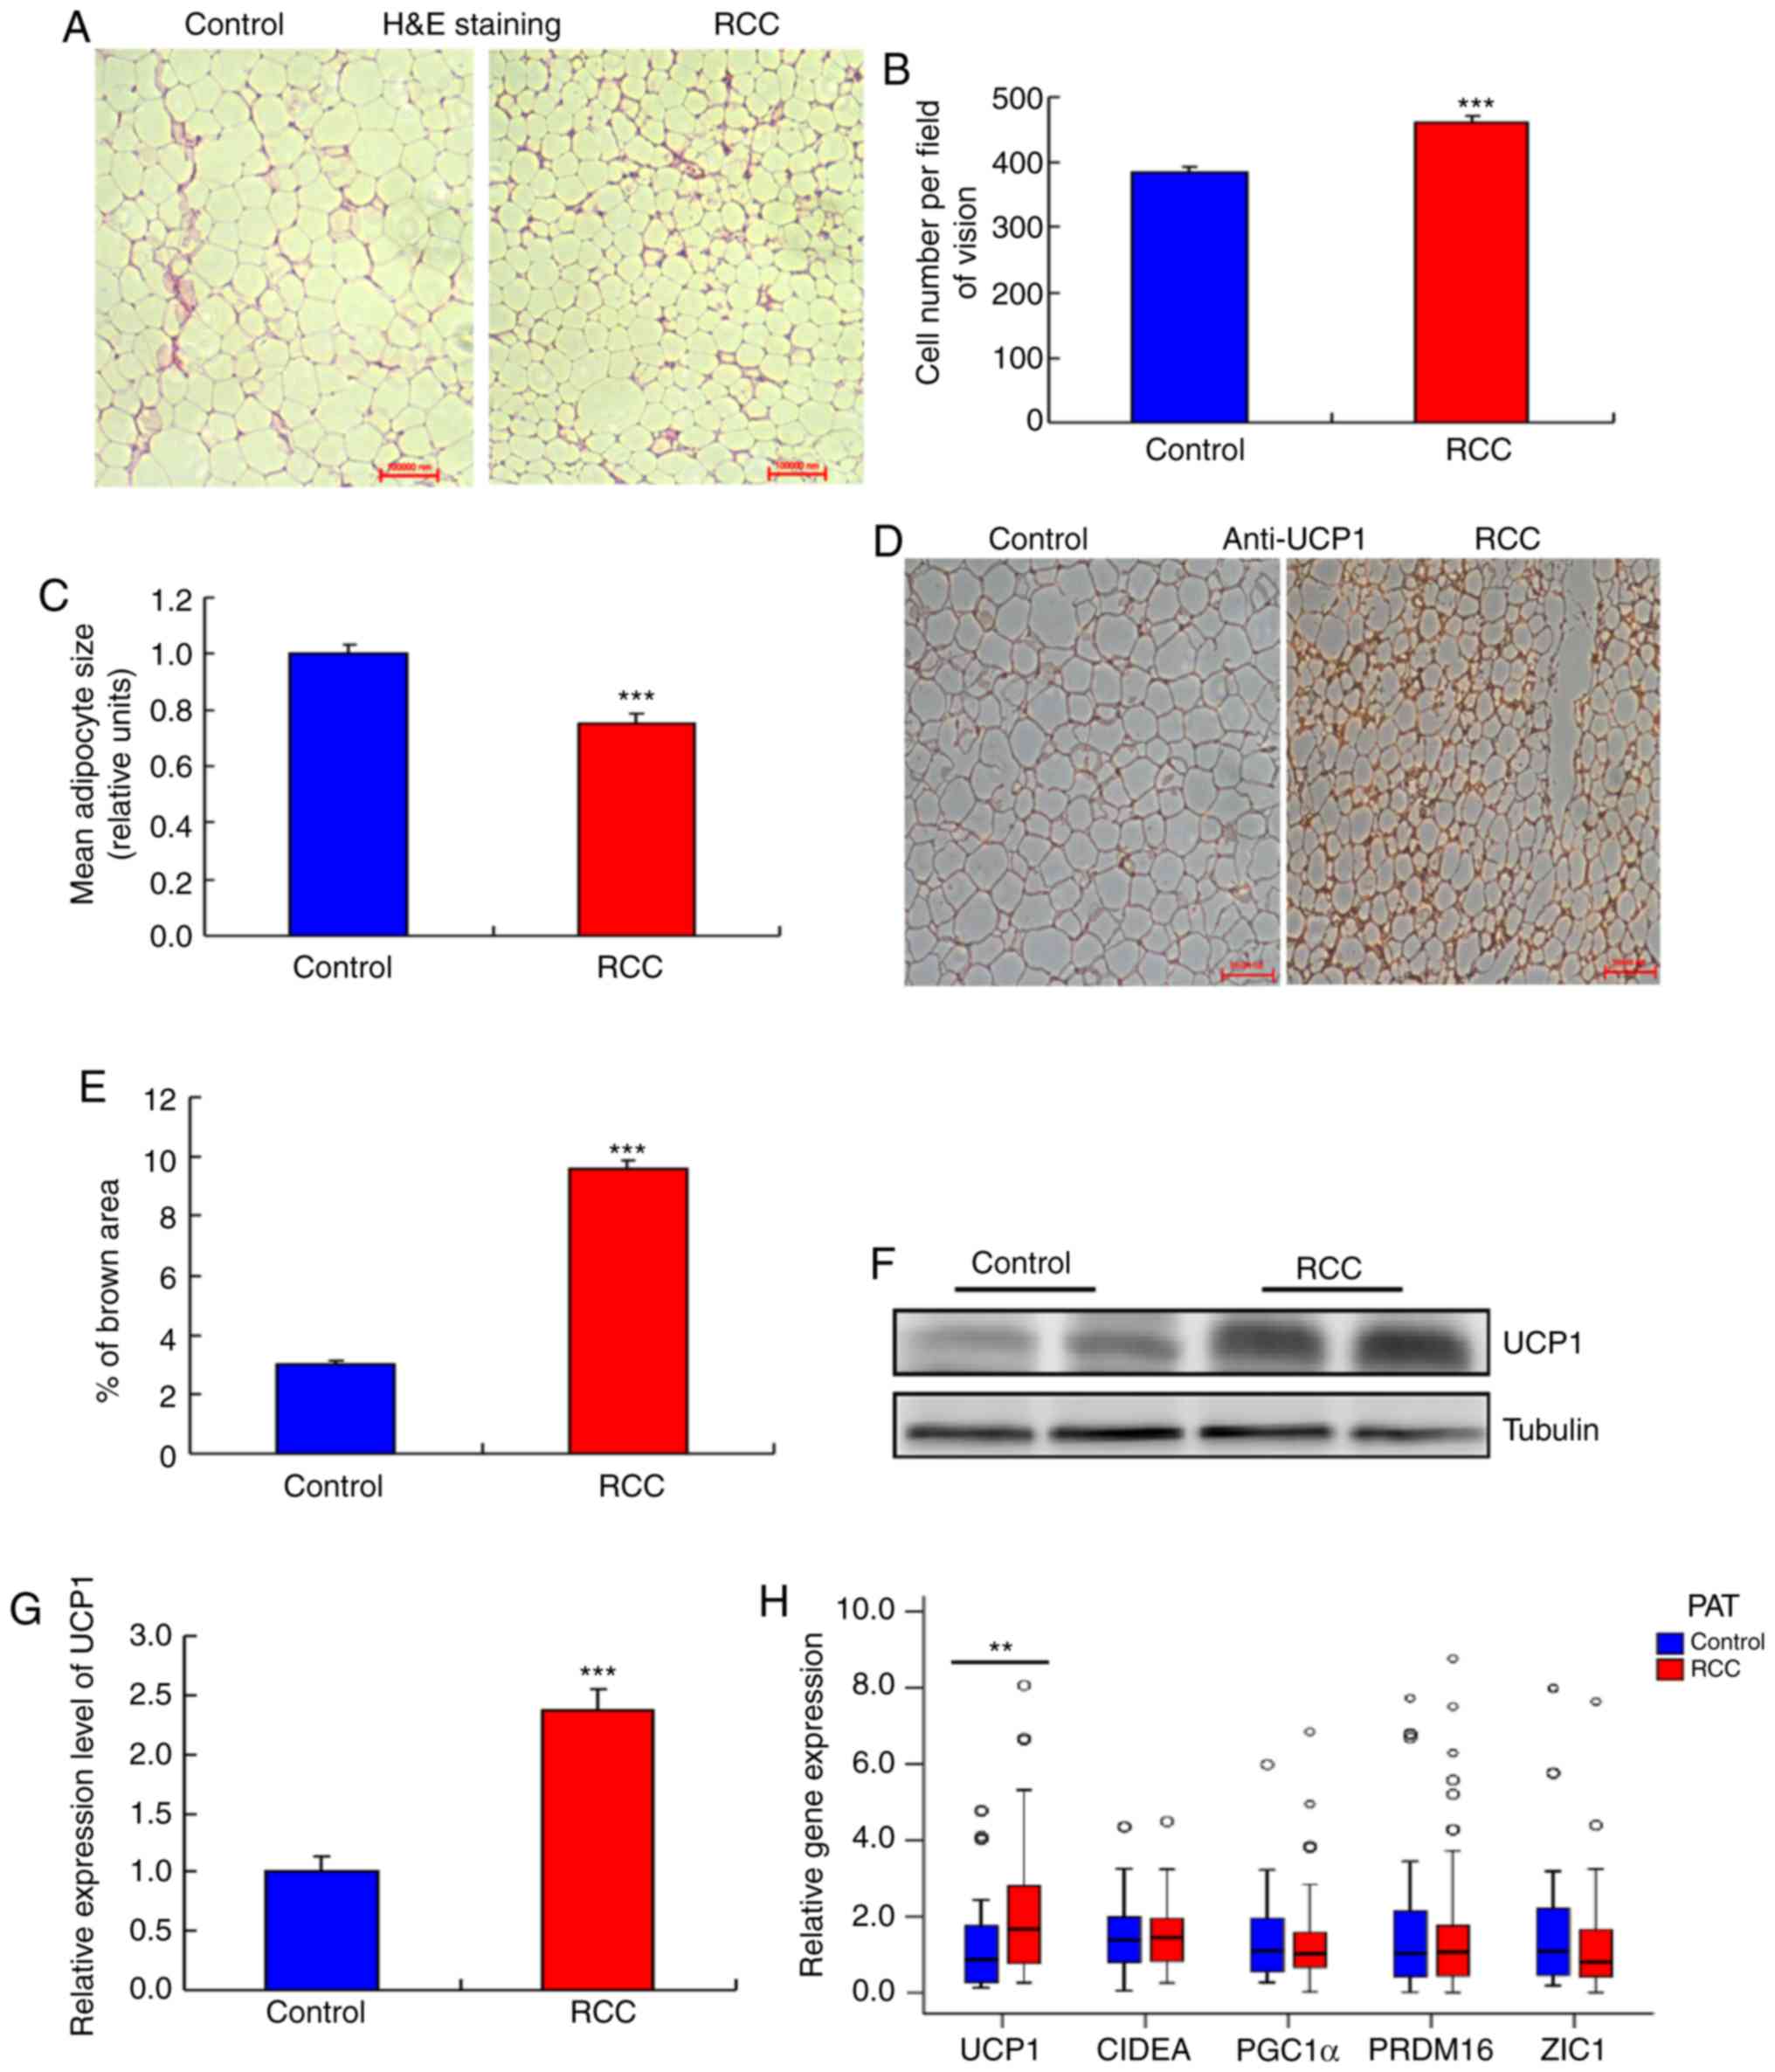 | Figure 3.Higher UCP1 expression in the PAT of
the RCC group. (A) Morphology of the PAT. Representative
hematoxylin and eosin (H&E) staining images are shown (n=20).
(B) Size of adipocytes in the RCC and control groups
(magnification, ×200). Data are presented as the mean ± standard
deviation (SD), n=20 (***P<0.001). (C) Number of adipocytes in
the RCC and control groups (magnification, ×200). Data are
presented as the mean ± SD, n=20. (***P<0.001). (D) UCP1
staining in the PAT of the RCC and control groups. Representative
images are shown (n=20). (E) Quantification of UCP1 staining in the
RCC and control groups. Data are presented as the mean ± SD, n=10
(***P<0.001). (F and G) Western blot analysis of the UCP1 level
in the PAT of the RCC and control groups (n=8) (***P<0.001). (H)
RT-qPCR analysis of the mRNA levels of UCP1 and other BAT genes in
the RCC and control groups (**P<0.01) (n=104). (I and J) RT-qPCR
analysis of the mRNA levels of white adipocyte and brown adipocyte
genes in the PAT of the RCC and control groups (n=104) (*P<0.05,
***P<0.001). (K-M) RT-qPCR analysis of the mRNA levels of
adipocyte metabolism-related genes and mitochondrial function genes
in the PAT of the RCC and control groups (n=104). PAT, perirenal
adipose tissue; RCC, renal cell carcinoma; RT-qPCR, reverse
transcription-quantitative PCR; UCP1, uncoupling protein 1. |
Comparison of PAT gene expression
between the control and RCC groups
To analyze the associations between increased
expression of UCP1 and that of other BAT genes in PAT from the RCC
group compared with the control group, other BAT genes were
examined and no significant differences were identified between the
two groups (Fig. 3H).
In addition, no significant difference was found in
TBX1, TMEM26 or CD137 expression in PAT samples between the two
groups (Fig. 3I). However, the mRNA
levels of HOXC8 and HOXC9 were lower in the RCC group compared with
those in the control group (Fig.
3J).
Furthermore, the expression of cytochrome c
oxidase subunit VIIa polypeptide 1, cytochrome c−1, citrate
synthase, long-chain acyl-CoA dehydrogenase caldesmon and pyruvate
dehydrogenase kinase isozyme 4 in PAT samples did not differ
significantly between the two groups (Fig. 3K). The expression of the
adipocytokines ADIPQ and LEP also exhibited no significant
difference between the two groups (Fig.
3L). Moreover, the expression of the inflammatory factors
monocyte chemotactic protein-1 and TNF-α was not significantly
different between the two groups (Fig.
3M).
Comparison of baseline characteristics
between the control and RCC groups
The activation of BAT is affected by several
factors, such as sex, age, BMI and fasting blood glucose (24–26). To
validate whether the increased UCP1 expression in the PAT of the
RCC group was associated with clinical factors, clinical data from
the two groups were analyzed; no significant differences were
identified (Table I).
 | Table I.Description and comparison of clinical
and biochemical characteristics of the study patients. |
Table I.
Description and comparison of clinical
and biochemical characteristics of the study patients.
| Characteristics | Control group
(n=54) | RCC group
(n=50) | P-value |
|---|
| Age (years) | 50.35±10.48 | 52.18±8.31 | 0.329 |
| Male sex, n
(%) | 27 (50.00) | 25 (50.00) | 1.000 |
| BMI
(kg/m2) | 24.49±3.29 | 24.30±2.93 | 0.766 |
| WC (cm) | 88.94±9.15 | 90.08±11.08 | 0.569 |
| Smoking, n (%) | 10 (18.52) | 12 (24.00) | 0.494 |
| Hypertension, n
(%) | 13 (24.07) | 15 (30.00) | 0.496 |
| Diabetes, n
(%) | 3 (5.56) | 4 (8.00) | 0.916 |
| BBT (°C) | 36.44±0.31 | 36.48±0.27 | 0.538 |
| SBP (mmHg) | 121.59±13.18 | 123.90±17.32 | 0.449 |
| DBP (mmHg) | 76.56±7.56 | 75.68±11.11 | 0.642 |
| RHR (bpm) | 72.98±7.34 | 74.26±6.86 | 0.362 |
| FBG (mmol/l) | 5.62±1.06 | 5.32±0.98 | 0.147 |
| TG (mmol/l) | 1.34±0.43 | 1.34±0.50 | 0.946 |
| TC (mmol/l) | 4.44±0.80 | 4.53±0.83 | 0.591 |
| LDL-C (mmol/l) | 2.91±0.47 | 2.89±0.47 | 0.796 |
| HDL-C (mmol/l) | 1.24±0.24 | 1.31±0.28 | 0.194 |
| Cr (µmol/l) | 71.15±14.03 | 73.68±23.46 | 0.510 |
| CCr | 90.93±17.09 | 84.98±20.17 | 0.106 |
| β-blockers, n
(%) | 1 (1.85) | 2 (4.00) | 0.946 |
Comparison of baseline characteristics
of RCC between the high and low UCP1 expression groups
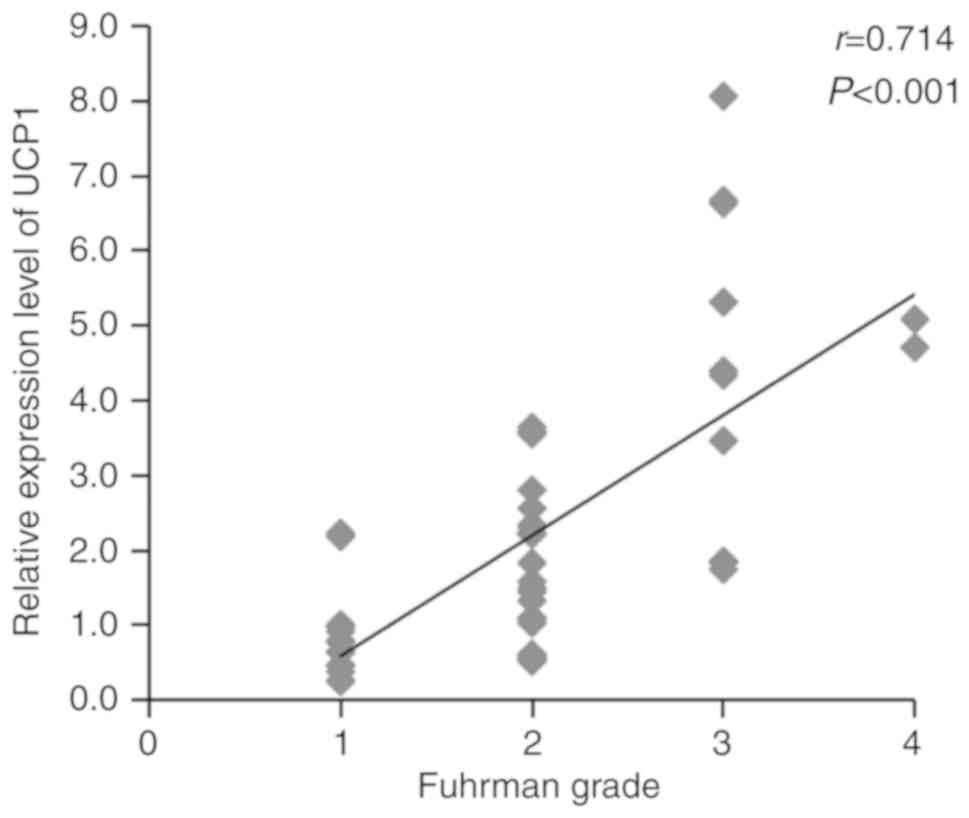
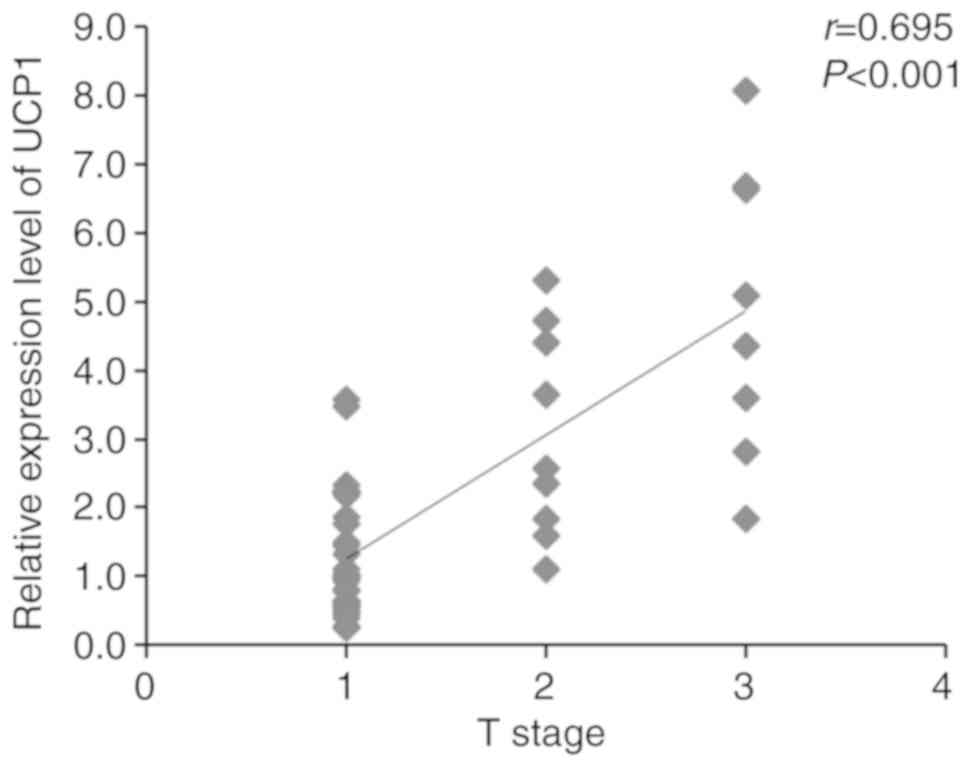
Several aspects of RCC, such as Fuhrman grade, T
stage, histopathology and necrosis, are involved in RCC
tumorigenesis. The higher the Fuhrman grade and T stage, the worse
the tumor progression and patient prognosis. To determine the
association between UCP1 expression in the PAT and progression of
RCC, Spearman's correlation coefficients of UCP1 mRNA expression
with Fuhrman grade and T stage of RCC were assessed using SPSS
v20.0 software. The expression of UCP1 mRNA was found to be
significantly positively correlated with Fuhrman grade and T stage
in RCC (Figs. 4 and 5). The clinical characteristics of RCC
patients with high UCP1 expression were compared with those in
patients with low UCP1 expression, as defined using the median
method. The median cut-off point of UCP1 mRNA expression was 1.663;
according to this, the 50 RCC patients were divided into two
groups. No significant differences in sex, age, WC, BMI, BBT, RHR,
histopathology, necrosis and metastasis were observed between the
two groups (Table II). However,
Fuhrman grade and T stage were higher in the high UCP1 expression
group compared with those in the low UCP1 expression group.
| Table II.Comparison of baseline
characteristics of RCC between the high and low expression UCP1
groups. |
Table II.
Comparison of baseline
characteristics of RCC between the high and low expression UCP1
groups.
|
Characteristics | Low UCP1 group
(n=29) | High UCP1 group
(n=21) | P-value |
|---|
| Age (years) | 51.03±8.85 | 53.76±7.42 | 0.256 |
| Male sex, n
(%) | 14 (48.28) | 11 (52.38) | 0.774 |
| BMI
(kg/m2) | 24.12±3.13 | 24.56±2.67 | 0.605 |
| WC (cm) | 89.41±11.87 | 91.00±10.10 | 0.622 |
| BBT (°C) | 36.53±0.26 | 36.40±0.28 | 0.084 |
| RHR (bpm) | 74.21±7.45 | 74.33±6.13 | 0.949 |
| Fuhrman grade, n
(%) |
|
| 0.020 |
|
I–II | 26 (89.66) | 12 (57.14) |
|
|
III–IV | 3 (10.34) | 9 (42.86) |
|
| Histopathology, n
(%) clear cell RCC | 29 (100.00) | 21 (100.00) | 1.000 |
| Necrosis, n
(%) | 10 (34.48) | 6 (28.57) | 0.658 |
| T stage, n (%) |
|
| 0.014 |
|
≤T2 | 28 (96.55) | 14 (66.67) |
|
|
>T2 | 1 (3.45) | 7 (33.33) |
|
| Metastasis, n
(%) |
|
| 1.000 |
| N0 and
M0 | 29 (100.00) | 21 (100.00) |
|
| N1-2 or
M1 | 0 (0.00) | 0 (0.00) |
|
Discussion
In the present study, PAT samples were divided into
upper and lower renal pole samples. The results revealed no
significant difference in UCP1 expression and adipocyte morphology,
or the expression of other genes, between the two parts of the PAT.
Letizia et al (27) reported
that leptin expression in adrenal fat was significantly higher,
while adiponectin expression in adrenal neoplasia was significantly
lower compared with that in subcutaneous tissues and PAT in
patients with Cushing's syndrome. In the present study, patients
with adrenal tumors were excluded, so it may be hypothesized that
normal adrenal glands would not affect the properties of PAT.
Süer et al (14) reported that PAT invasion may predict
the prognosis of RCC patients. Bedke et al (15) found that perinephric and renal sinus
fat infiltration may indicate an unfavorable prognosis of RCC.
However, the role of PAT in RCC remains unclear. The present
results demonstrated that increased UCP1 expression in PAT was
correlated with RCC. Furthermore, it was found that the Fuhrman
grade and T stage were higher in the high UCP1 expression group
compared with the low UCP1 expression group, while age, sex, BMI,
WC, BBT, RHR, histopathology, necrosis and metastasis were not
significantly different between the two groups. These results
suggested that high UCP1 expression in PAT may serve as an
indicator of poor prognosis.
Thermogenesis is a key property and function that
leads to the browning of adipose tissue. There have been a number
of studies demonstrating that an increase in UCP1 expression may be
involved in cancer-associated cachexia (CAC) (21,28,29). In
the present study, when the subjects were divided into two groups
by the median UCP1 expression in PAT, it was found that the number
of patients with Fuhrman grade III–IV and T stage >T2 was
markedly increased in the high UCP1 expression group, while BMI
exhibited no significant difference between the two groups.
Furthermore, a correlation test of UCP1 levels in patients with RCC
was performed. The data demonstrated that the expression of UCP1
mRNA was significantly positively correlated with Fuhrman grade and
T stage in RCC, whereas BMI exhibited no such correlations
(Figs. S1 and S2). Following a literature search, Kir
et al (30) reported that the
browning effect of WAT could be observed during the early stages of
CAC, prior to the total weight loss. Petruzzelli et al
(31) also reported similar findings,
and named the mice at this stage as ‘precachectic’. It is known
that RCC is a type of low-grade malignancy. The majority of RCC
patients in the present study were within or even above the normal
BMI range (BMI 19.37–28.98 kg/m2), similar to
precachetic animals. Only in 1 female patient the BMI was 16.48
kg/m2, and her UCP1 mRNA expression in PAT was 1.745.
Therefore, it was considered that, as a type of low-grade
malignancy, RCC patients seldom reach a cachectic stage, but a
marked browning of PAT may be observed from the very early
stages.
Accumulating evidence has indicated that adipocytes
stimulate cancer cell growth (32,33).
Adipocytes secrete adipocytokines to promote the homing of ovarian
cancer cells and provide fuel for cancer cell growth (34). The induction of mitochondrial
dysfunction via UCP expression in cancer-associated fibroblasts
also promotes cancer growth, but the induction of mitochondrial
dysfunction in epithelial cancer cells inhibits cancer growth by
inducing catabolism (35). In the
present study, no differences in the expression of adipocytokines
and proinflammatory cytokines between the control and RCC groups
were identified. However, it was observed that increased UCP1
expression was associated with low HOXC8 and HOXC9 expression in
the PAT, which indicates that, with the diminished properties of
WAT, the browning of the PAT in patients with RCC is increased.
Whether increased UCP1 expression in the PAT could regulate the
metabolism and growth of RCC cells by supporting energy production
remains to be investigated.
In conclusion, UCP1 expression is similar between
different parts of the PAT, and increased UCP1 expression in the
PAT is correlated with the development of RCC and may be associated
with a poor prognosis of patients with RCC.
Supplementary Material
Supporting Data
Acknowledgements
Not applicable.
Funding
The present study was supported by the National
Natural Science Foundation of China (grant nos. 81570773 and
81871106), and the Huai'an 2016 Annual Promotion Project for
Science and Technology International Cooperation (grant nos.
HAC201622 and HAC201620).
Availability of materials and data
All the datasets generated and analyzed in the
present study are available from the corresponding author on
reasonable request.
Authors' contributions
XL, GW, JL and GD designed this study. XL and GW
collected and analyzed the data. XL and JL contributed materials.
XL, JL and GW wrote the manuscript. All the authors have read and
approved the final version of this manuscript for publication.
Ethics approval and consent to
participate
All procedures involving human subjects followed the
standards of and were approved by the Ethics Committee of Nanjing
Medical University (no. 2013-SRFA-132). All subjects signed
informed consent.
Patient consent for publication
Not applicable.
Competing interests
The authors declare that they have no competing
interests.
References
|
1
|
Rini BI, Campbell SC and Escudier B: Renal
cell carcinoma. Lancet. 373:1119–1132. 2009. View Article : Google Scholar : PubMed/NCBI
|
|
2
|
Motzer RJ, Bander NH and Nanus DM:
Renal-cell carcinoma. N Engl J Med. 335:865–875. 1996. View Article : Google Scholar : PubMed/NCBI
|
|
3
|
Ferlay J, Shin HR, Bray F, Forman D,
Mathers C and Parkin DM: Estimates of worldwide burden of cancer in
2008: GLOBOCAN 2008. Int J Cancer. 127:2893–2917. 2010. View Article : Google Scholar : PubMed/NCBI
|
|
4
|
Ljungberg B, Campbell SC, Choi HY, Jacqmin
D, Lee JE, Weikert S and Kiemeney LA: The epidemiology of renal
cell carcinoma. Eur Urol. 60:615–621. 2011. View Article : Google Scholar : PubMed/NCBI
|
|
5
|
Drabkin HA and Gemmill RM: Obesity,
cholesterol, and clear-cell renal cell carcinoma (RCC). Adv Cancer
Res. 107:39–56. 2010. View Article : Google Scholar : PubMed/NCBI
|
|
6
|
Samanic C, Chow WH, Gridley G, Jarvholm B
and Fraumeni JF Jr: Relation of body mass index to cancer risk in
362,552 Swedish men. Cancer Causes Control. 17:901–909. 2006.
View Article : Google Scholar : PubMed/NCBI
|
|
7
|
Adams KF, Leitzmann MF, Albanes D, Kipnis
V, Moore SC, Schatzkin A and Chow WH: Body size and renal cell
cancer incidence in a large US cohort study. Am J Epidemiol.
168:268–277. 2008. View Article : Google Scholar : PubMed/NCBI
|
|
8
|
Liao LM, Weinstein SJ, Pollak M, Li Z,
Virtamo J, Albanes D, Chow WH and Purdue MP: Prediagnostic
circulating adipokine concentrations and risk of renal cell
carcinoma in male smokers. Carcinogenesis. 34:109–112. 2013.
View Article : Google Scholar : PubMed/NCBI
|
|
9
|
Spyridopoulos TN, Petridou ET, Dessypris
N, Terzidis A, Skalkidou A, Deliveliotis C, Chrousos GP, Obesit y
and Cancer Oncology Group: Inverse association of leptin levels
with renal cell carcinoma: Results from a case-control study.
Hormones (Athens). 8:39–46. 2009. View Article : Google Scholar : PubMed/NCBI
|
|
10
|
Pinthus JH, Kleinmann N, Tisdale B,
Chatterjee S, Lu JP, Gillis A, Hamlet T, Singh G, Farrokhyar F and
Kapoor A: Lower plasma adiponectin levels are associated with
larger tumor size and metastasis in clear-cell carcinoma of the
kidney. Eur Urol. 54:866–873. 2008. View Article : Google Scholar : PubMed/NCBI
|
|
11
|
Yoshida N, Ikemoto S, Narita K, Sugimura
K, Wada S, Yasumoto R, Kishimoto T and Nakatani T: Interleukin-6,
tumor necrosis factor alpha and interleukin-1beta in patients with
renal cell carcinoma. Br J Cancer. 86:1396–1400. 2002. View Article : Google Scholar : PubMed/NCBI
|
|
12
|
Ho MY, Tang SJ, Chuang MJ, Cha TL, Li JY,
Sun GH and Sun KH: TNF-α induces epithelial-mesenchymal transition
of renal cell carcinoma cells via a GSK3β-dependent mechanism. Mol
Cancer Res. 10:1109–1119. 2012. View Article : Google Scholar : PubMed/NCBI
|
|
13
|
Lamacchia O, Nicastro V, Camarchio D,
Valente U, Grisorio R, Gesualdo L and Cignarelli M: Para- and
perirenal fat thickness is an independent predictor of chronic
kidney disease, increased renal resistance index and hyperuricaemia
in type-2 diabetic patients. Nephrol Dial Transplant. 26:892–898.
2011. View Article : Google Scholar : PubMed/NCBI
|
|
14
|
Süer E, Baltaci S, Burgu B, Aydoğdu Ö and
Göğüş Ç: Significance of tumor size in renal cell cancer with
perinephric fat infiltration: Is TNM staging system adequate for
predicting prognosis? Urol J. 10:774–779. 2013.PubMed/NCBI
|
|
15
|
Bedke J, Buse S, Pritsch M,
Macher-Goeppinger S, Schirmacher P, Haferkamp A and Hohenfellner M:
Perinephric and renal sinus fat infiltration in pT3a renal cell
carcinoma: Possible prognostic differences. BJU Int. 103:1349–1354.
2009. View Article : Google Scholar : PubMed/NCBI
|
|
16
|
Ricquier D: Respiration uncoupling and
metabolism in the control of energy expenditure. Proc Nutr Soc.
64:47–52. 2005. View Article : Google Scholar : PubMed/NCBI
|
|
17
|
Cannon B and Nedergaard J: Brown adipose
tissue: Function and physiological significance. Physiol Rev.
84:277–359. 2004. View Article : Google Scholar : PubMed/NCBI
|
|
18
|
Tam CS, Lecoultre V and Ravussin E: Brown
adipose tissue mechanisms and potential therapeutic targets.
Circulation. 125:2782–2791. 2012. View Article : Google Scholar : PubMed/NCBI
|
|
19
|
Kozak LP and Anunciado-Koza R: UCP1: Its
involvement and utility in obesity. Int J Obes. 32 (Suppl):S32–S38.
2008. View Article : Google Scholar
|
|
20
|
Rousseau C, Bourbouloux E, Campion L,
Fleury N, Bridji B, Chatal JF, Resche I and Campone M: Brown fat in
breast cancer patients: Analysis of serial (18)F-FDG PET/CT scans.
Eur J Nucl Med Mol Imaging. 33:785–791. 2006. View Article : Google Scholar : PubMed/NCBI
|
|
21
|
Bianchi A, Bruce J, Cooper AL, Childs C,
Kohli M, Morris ID, Morris-Jones P and Rothwell NJ: Increased brown
adipose tissue activity in children with malignant disease. Horm
Metab Res. 21:640–641. 1989. View Article : Google Scholar : PubMed/NCBI
|
|
22
|
Li X, Liu J, Wang G, Yu J, Sheng Y, Wang
C, Lv Y, Lv S, Qi H, Di W, et al: Determination of UCP1 expression
in subcutaneous and perirenal adipose tissues of patients with
hypertension. Endocrine. 50:413–423. 2015. View Article : Google Scholar : PubMed/NCBI
|
|
23
|
Yeatts K: Quantitative polymerase chain
reaction using the comparative C q method. Methods Mol Biol.
700:171–184. 2011. View Article : Google Scholar : PubMed/NCBI
|
|
24
|
Cypess AM, Lehman S, Williams G, Tal I,
Rodman D, Goldfine AB, Kuo FC, Palmer EL, Tseng YH, Doria A, et al:
Identification and importance of brown adipose tissue in adult
humans. N Engl J Med. 360:1509–1517. 2009. View Article : Google Scholar : PubMed/NCBI
|
|
25
|
Ouellet V, Routhier-Labadie A, Bellemare
W, Lakhal-Chaieb L, Turcotte E, Carpentier AC and Richard D:
Outdoor temperature, age, sex, body mass index, and diabetic status
determine the prevalence, mass, and glucose-uptake activity of
18F-FDG-detected BAT in humans. J Clin Endocrinol Metab.
96:192–199. 2011. View Article : Google Scholar : PubMed/NCBI
|
|
26
|
Pfannenberg C, Werner MK, Ripkens S, Stef
I, Deckert A, Schmadl M, Reimold M, Häring HU, Claussen CD and
Stefan N: Impact of age on the relationship of brown adipose tissue
with sex and adiposity in humans. Diabetes. 59:1789–1793. 2010.
View Article : Google Scholar : PubMed/NCBI
|
|
27
|
Letizia C, Petramala L, Di Gioia CR,
Chiappetta C, Zinnamosca L, Marinelli C, Iannucci G, Ciardi A, De
Toma G and Iacobellis G: Leptin and adiponectin mRNA expression
from the adipose tissue surrounding the adrenal neoplasia. J Clin
Endocrinol Metab. 100:E101–E104. 2015. View Article : Google Scholar : PubMed/NCBI
|
|
28
|
Tsoli M, Moore M, Burg D, Painter A,
Taylor R, Lockie SH, Turner N, Warren A, Cooney G, Oldfield B, et
al: Activation of thermogenesis in brown adipose tissue and
dysregulated lipid metabolism associated with cancer cachexia in
mice. Cancer Res. 72:4372–4382. 2012. View Article : Google Scholar : PubMed/NCBI
|
|
29
|
Kir S, Komaba H, Garcia AP, Economopoulos
KP, Liu W, Lanske B, Hodin RA and Spiegelman BM: PTH/PTHrP receptor
mediates cachexia in model of kidney failure and cancer. Cell
Metab. 23:315–323. 2016. View Article : Google Scholar : PubMed/NCBI
|
|
30
|
Kir S, White JP, Kleiner S, Kazak L, Cohen
P, Baracos VE and Spiegelman BM: Tumor derived PTH-related protein
triggers adipose tissue browning and cancer cachexia. Nature.
523:100–104. 2014. View Article : Google Scholar
|
|
31
|
Petruzzelli M, Schweiger M, Schreiber R,
Campos-Olivas R, Tsoli M, Allen J, Swarbrick M, Rose-John S, Rincon
M, Robertson G, et al: A switch from white to brown fat increases
energyexpenditure in cancer-associated cachexia. Cell Metab.
20:433–447. 2014. View Article : Google Scholar : PubMed/NCBI
|
|
32
|
Manabe Y, Toda S, Miyazaki K and Sugihara
H: Mature adipocytes, but not preadipocytes, promote the growth of
breast carcinoma cells in collagen gel matrix culture through
cancer-stromal cell interactions. J Pathol. 201:221–228. 2003.
View Article : Google Scholar : PubMed/NCBI
|
|
33
|
Dirat B, Bochet L, Dabek M, Daviaud D,
Dauvillier S, Majed B, Wang YY, Meulle A, Salles B, Le Gonidec S,
et al: Cancer- associated adipocytes exhibit an activated phenotype
and contribute to breast cancer invasion. Cancer Res. 71:2455–2456.
2011. View Article : Google Scholar : PubMed/NCBI
|
|
34
|
Nieman KM, Kenny HA, Penicka CV, Ladanyi
A, Buell-Gutbrod R, Zillhardt MR, Romero IL, Carey MS, Mills GB,
Hotamisligil GS, et al: Adipocytes promote ovarian cancer
metastasis and provide energy for rapid tumor growth. Nat Med.
17:1498–1503. 2011. View
Article : Google Scholar : PubMed/NCBI
|
|
35
|
Sanchez-Alvarez R, Martinez-Outschoorn UE,
Lamb R, Hulit J, Howell A, Gandara R, Sartini M, Rubin E, Lisanti
MP and Sotgia F: Mitochondrial dysfunction in breast cancer cells
prevents tumor growth: Understanding chemoprevention with
metformin. Cell Cycle. 12:172–182. 2013. View Article : Google Scholar : PubMed/NCBI
|