Introduction
Colorectal cancer (CRC), which accounted for
approximately 1.8 million new cases and more than 860,000 deaths in
2018, ranks as the fourth most commonly diagnosed malignancy and
the second leading cause of cancer-related deaths worldwide
(1). The incidence and mortality
rates of CRC are still increasing rapidly in many developing
countries around the world, causing a considerable public health
issue (2).
Nearly three decades ago, J.A. Bufill proposed
sub-classifying CRC depending on the anatomical site, either
proximal (right) or distal (left) to the splenic flexure (3). Subsequent research has observed distinct
differences in epidemiology and pathological features according to
primary tumor location in CRC. In 2000, H. Elsaleh found that the
tumor site is associated with survival benefit from adjuvant
chemotherapy in CRC (4). This
researcher discovered that patients with right-sided tumors have
better survival benefits from adjuvant chemotherapy than patients
with left-sided tumors. In addition, the frequency of MSI was much
higher in right-sided tumors than in left-sided tumors (5,6). It is now
well established by a variety of studies that primary tumor
location affects the outcome of the chemotherapy and immunotherapy
of CRC patients in a large-scale population, and tumor location is
a high-risk parameter for prognosis in specific stages. There is a
general consensus that primary tumor location plays an important
role in CRC development. We could even define right-sided and
left-sided tumors as two different diseases that need different
treatments (7). This influence of
tumor location may be due to differences in embryological
development. Specifically, the right side of the colon has
historically been understood to be derived from the embryological
midgut, and the left colon arises from the embryological hindgut.
The transverse colon is composed of parts of both structures. These
different origins could result in various clinical traits.
However, the underlying molecular mechanism
governing those different behaviors and outcomes has not been fully
elucidated to date. With the popularization of next-generation
sequencing technology, we currently have abundant published
research describing the use of the Chip-seq or RNA-seq method to
investigate problems related to cancer. In the last decade, a
considerable number of studies have been published on the distinct
gene expression between left- and right-sided CRC (8,9). The
generalizability of much of the published research on this issue
has been restricted to the analysis of differential gene
expression, while few previous studies have investigated this
problem from the perspective of expression patterns. Weighted gene
coexpression analysis (WGCNA) is a powerful tool to describe the
correlation patterns among genes across microarray or RNA-seq
samples (10). This method has been
widely used to identify modules of tightly correlated genes and
summarize such modules using the module eigengene or intramodular
hub genes. After the modules are identified, we can easily evaluate
the association between the modules and external clinical traits
using eigengene network methodology. This approach has been
generally acknowledged and successfully applied to various cancer
studies.
In this study, we aimed to utilize the gene
expression data from the public genomic database to explore the
inner connections and genetic difference between proximal and
distal CRC and to use weighted gene coexpression analysis (WGCNA)
to search for the responsible genes.
Materials and methods
Data collection
The raw expression data of GSE39582 (11) and GSE14333 (12) were retrieved from the Gene Expression
Omnibus database (http://www.ncbi.nlm.nih.gov/geo/), both based on the
platform of GPL570 Affymetrix Human Genome U133 Plus 2.0 Array. We
used the Affy package in R to transform the CEL files of the tumor
samples into an expression matrix (13). To improve the data quality, we used
the k-nearest neighbors algorithm (k-NN) from the impute package in
R to impute the missing expression data (14). Meanwhile, the robust multiarray
average algorithm (RMA) was utilized to adjust the data for
potential batch effects and for background correcting (15). Prior to WGCNA analysis, we filtered
out the probes that were absent in all samples. The probe
information was then transformed into the official gene symbols
using Bioconductor in R. If multiple probes were applied to detect
the same mRNA, the average value of the probes was used. The genes
that were not differentially expressed between samples had to be
excluded from WGCNA, as two genes without notable variance in
expression between patients will be highly correlated. We chose the
75% most varying genes to construct the weighted gene coexpression
networks. Specifically, the median absolute deviation (MAD) was
used as a robust measure of variability.
In addition, the level three RNA-sequencing data of
both colon adenocarcinoma (COAD) and rectum adenocarcinoma (READ)
patients were downloaded from The Cancer Genome Atlas data portal
(TCGA; http://cancergenome.nih.gov/). In
contrast to ChIP-sequencing data, we used the voom function in
package limma to normalize the TCGA data and create an expression
matrix for samples for which the detailed clinical data are
available (16,17). The voom method estimates the mean
variance of the log counts and generates a precision weight for
each observation. Thus, the WGCNA workflows originally developed
for microarray analysis can be used on the RNA-seq data. Further
preprocessing steps included the removal of control samples and the
genes with zero counts in more than 80% of samples. As mentioned
before, genes that are not differentially expressed between samples
must be excluded; thus, we chose the top 12,000 genes with the
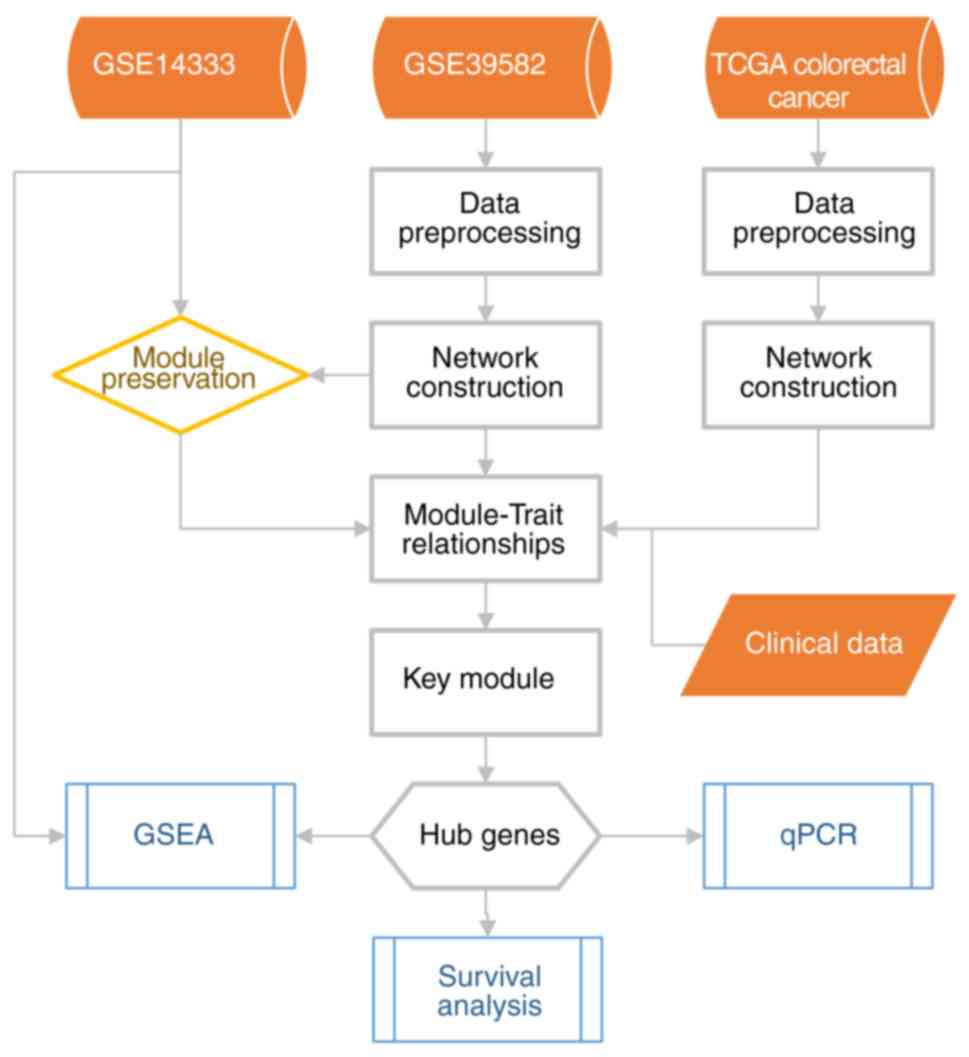
highest MAD for the network building. Fig. 1 depicts a flow chart for the
bioinformatic analysis.
Construction of weighted gene
coexpression networks
The R package ‘WGCNA’ was used in our study to
construct a gene coexpression network (10). After data collection and
normalization, it is crucial that outliers be excluded. However, it
was difficult to distinguish outlying samples in a dendrogram when
the number of samples was large. To solve this problem, we used the
standardized connectivity (Z. K) method recommended by WGCNA
authors with the default threshold, Z. K score £2. After filtering
out the outlying samples, expression data were tested to determine
whether the samples and genes were good using the integrated
function in the WGCNA package.
After filtering out the outliers and bad samples in
the dataset, the next step of WGCNA is to build a scale-free
network. In a scale-free network, several nodes, which are called
hub nodes, are highly connected to other nodes in the network
(18). In our study, we use the
unsigned coexpression measure, which means that the positive
correlation and negative correlation are equal. We constructed the
gene coexpression network using the following steps.
First, we need a soft thresholding power β to which
coexpression similarity is raised to calculate adjacency. By
raising the absolute value of the correlation to a power β≥1 (soft
thresholding), the weighted gene coexpression network construction
emphasizes high correlations at the expense of low correlations. To
determine the best soft threshold power, scale independence and
average connectivity degree of modules with different power values
were calculated by the gradient method. We selected the power β to
ensure that the coexpression network was a ‘scale-free’ network,
which was biologically close to reality. Moreover, to minimize the
effects of noise and spurious associations, we subsequently
constructed the Topology Overlap Matrix (TOM) from the adjacency
matrix and calculated the corresponding dissimilarity (1-TOM), as
well (19).
In the same way, the second coexpression network was
built from TCGA data.
Identification of coexpression
modules
The traditional static tree cut method exhibits
suboptimal performance on complicated dendrograms. In WGCNA, we
tend to use the dynamic tree cut method by hierarchically
clustering genes using the dissimilarity matrix (1-TOM) (20). The minimal size of a module was set as
30, and modules with high similarity were identified by clustering
and then merged together with a height cut-off of 0.25. To
determine whether the modules are reproducible, we tested the
preservation of all modules with an independent gene expression
dataset, GSE14333. We used the module preservation function (number
of permutations set to 100) integrated in the WGCNA package to
calculate the Z summary score of each module (21). In this method, a Z summary
<2 indicates that the modules have no preservation, a Z
summary of 2–10 indicates low to moderate preservation, and a
Z summary >10 means that the module is strongly
preserved.
Finding the key module and its hub
gene
The module eigengenes (MEs), which were measured by
principal component analysis (PCA), were generated for each
coexpressed module along with the module identification
procedure.
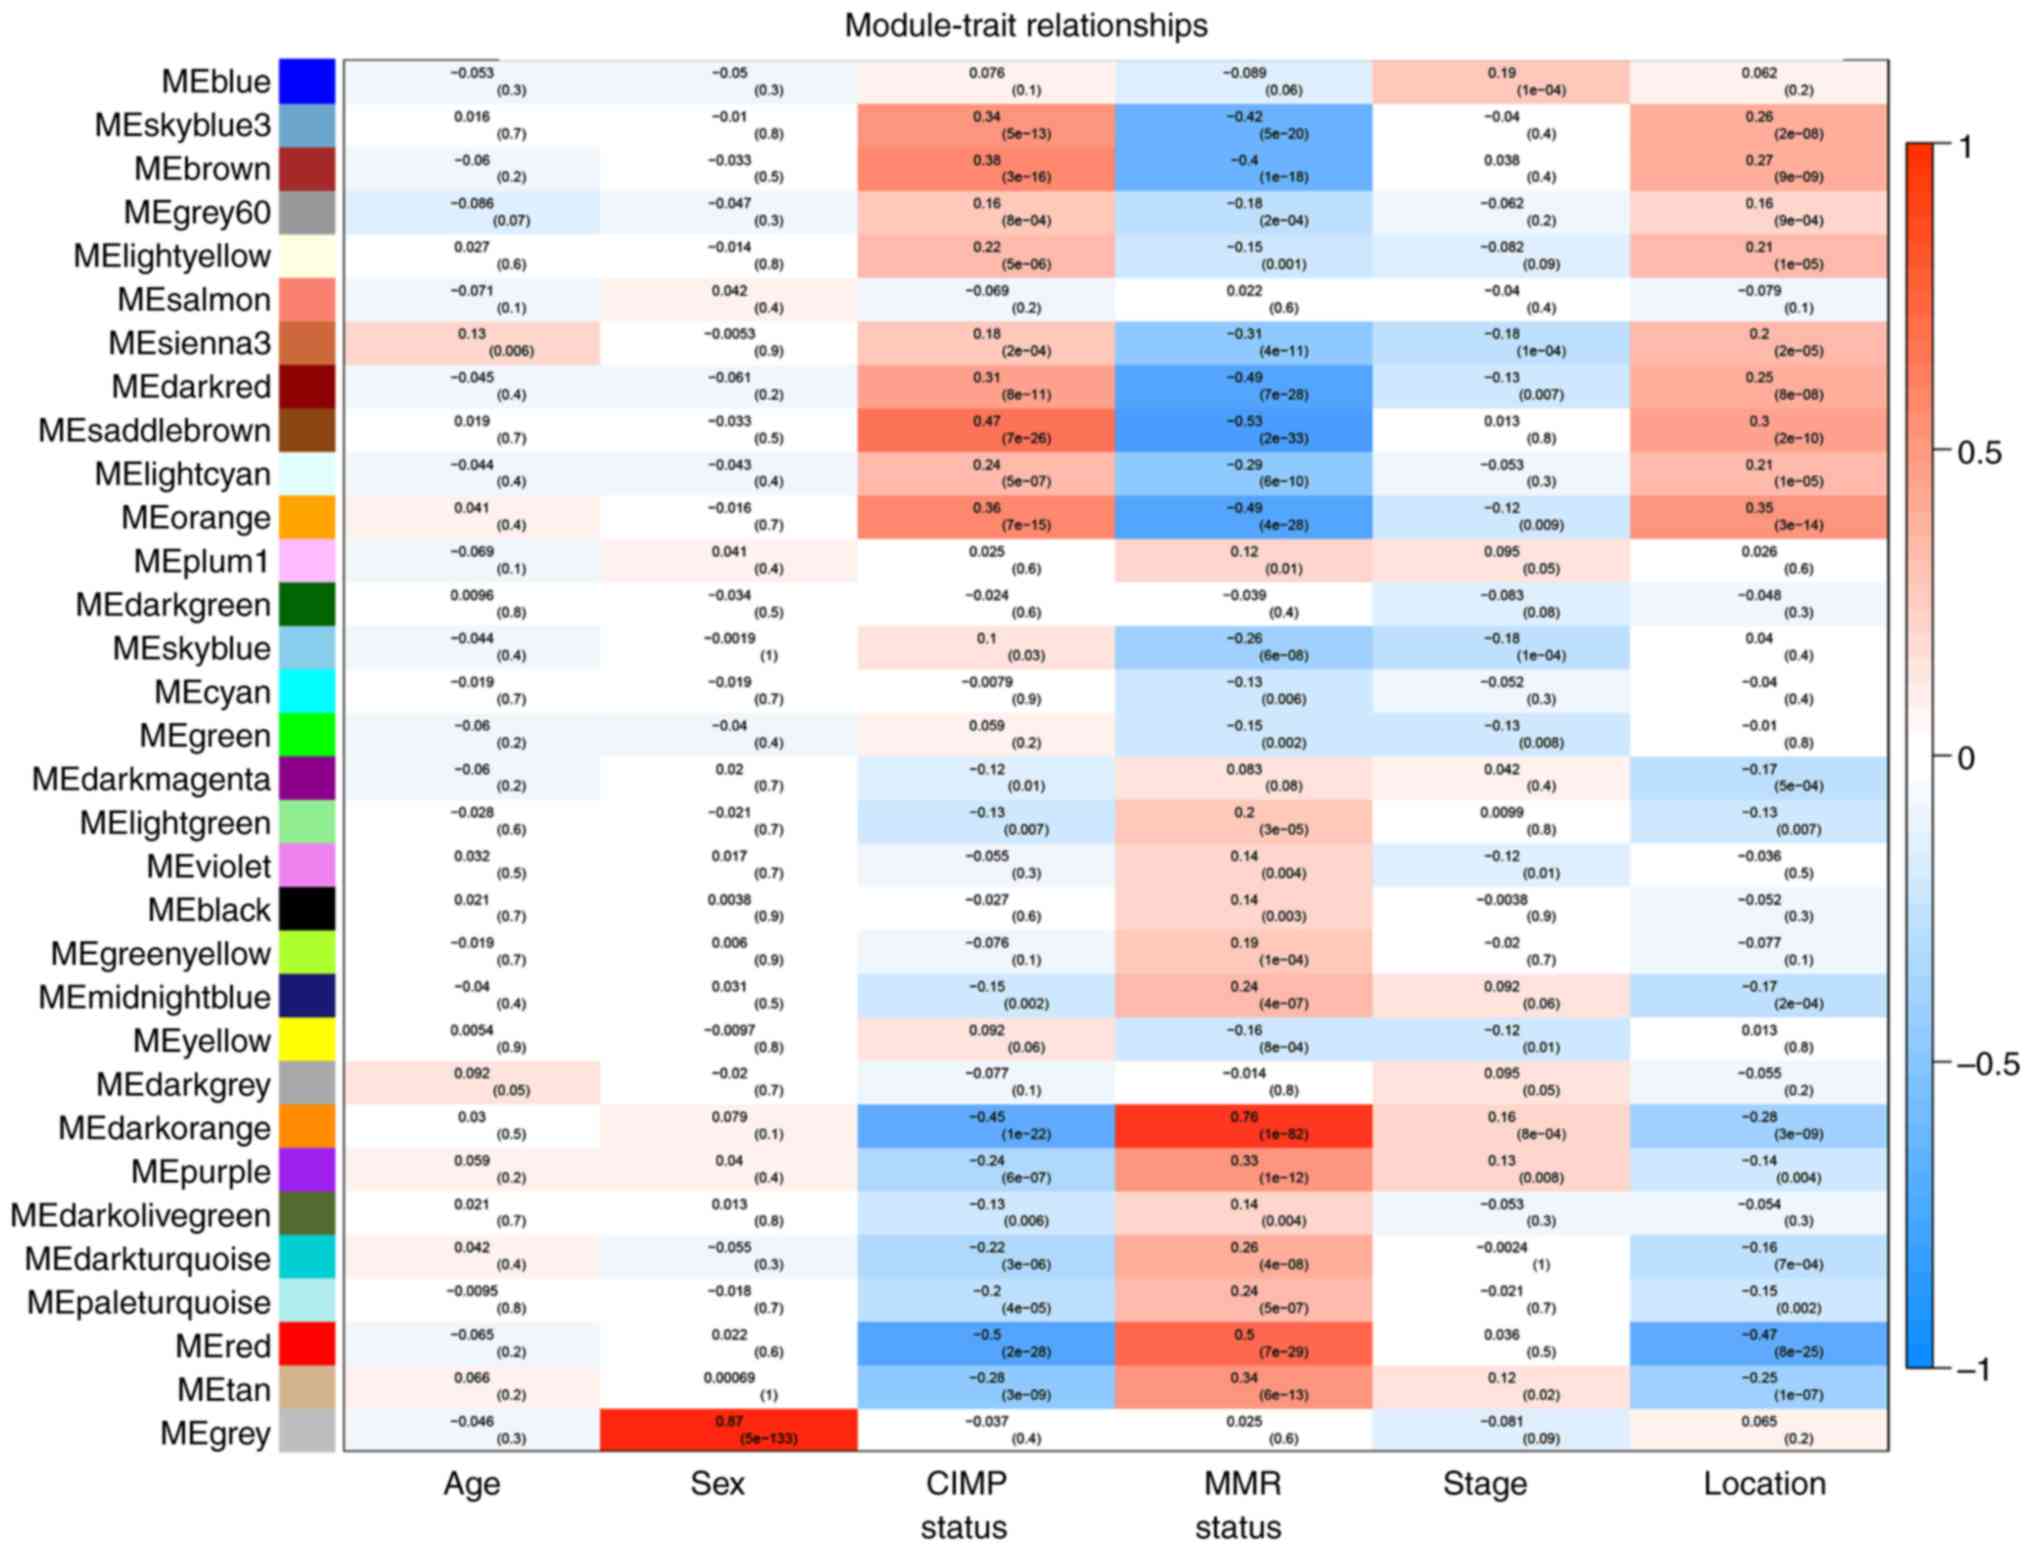
We used two methods to identify the module of
interest. First, we performed a module-trait relationship (MTR)
analysis by calculating the correlation between module eigengenes
and external clinical parameters, especially the anatomical site of
the tumor. Having the module-trait relationships heatmap drawn, it
was easy for us to identify which module related to the tumor
location most.
Second, we measured gene significance based on the
correlation of a gene expression profile with a sample trait and
following module significance as an average absolute gene
significance measure for all genes in a given module. Then, we
plotted the barplot of the module significance for all modules
detected. The highest module means it had the strongest correlation
with the clinical trait.
In the key module, the hub genes were those that
showed the most connections in the network. We called this property
module membership, also known as eigengene-based connectivity kME,
and in this instance, we used the default threshold value of 0.8.
In addition to the module membership, the hub genes we need should
also have a relatively higher gene significance; in this instance,
we used the cut-off value as 0.4 (TGCA data set to 0.3). Combing
both characteristics, we easily filtered out our hub gene in the
module.
Validation of the hub genes
We applied Gene Expression Profiling Interactive
Analysis (GEPIA) (http://gepia.cancer-pku.cn/) to detect the difference
in expression levels of each hub gene between tumor and normal
tissues in both the COAD and READ datasets from TCGA (22). To further validate our method,
correlation plots between hub genes were generated by GEPIA, as
well.
Coexpression validation with qPCR
Twenty non-selected CRC samples were applied to
perform qPCR to validate coexpression of PLAG1 like zinc finger 2
(PLAGL2) and protein O-fucosyltransferase 1 (POFUT1).
These experimental samples were collected at the Sir Run Run Shaw
Hospital of Zhejiang University between January 2004 and December
2006. After total RNA was isolated from tumor specimens using
Trizol reagent (Invitrogen; Thermo Fisher Scientific, Inc.,
Waltham, MA, USA), RNA was quantified by NanoDrop 2000c
spectrophotometer (Thermo Fisher Scientific, Inc.) and reverse
transcribed using RNeasy Mini Kit (Takara, Kyoto, Japan) according
to the manufacturer's protocols. Quantitative real-time PCR was
executed with SYBR Green Master Mix (Takara). Relative expression
levels were calculated with 2−ΔΔCq formula (23). Expression of mRNA was standardized
according to β-actin. The primers used were as follows:
β-actin_fwd, ACTCTTCCAGCCTTCCTTCC and β-actin_rev,
CGTCATACTCCTGCTTGCTG; PLAGL2_fwd, GAGTCAAGTGAAGTGCCAATGT and
PLAGL2_rev, TGAGGGCAGCTATATGGTCTC; POFU-T1_fwd,
AACCAGGCCGATCACTTCTTG and POFUT1_rev, GTTGGTGAAAGGAGGCTTGTG. The
primers were designed on online tools (https://www.genscript.com/tools/real-time-pcr-tagman-primer-design-tool)
and these were synthesized by Shanghai Generay Biotech Co. Ltd.
(Shanghai, China).
Survival analysis
We performed survival analysis for hub genes using
the GSE39582 dataset because of its complete overall survival
information. Kaplan-Meier analysis and log-rank test were performed
to evaluate the association between hub gene expression and patient
survival in left- and right-sided CRC, respectively. This procedure
utilized the survival package in R (24), and the Kaplan-Meier survival curves
with the at-risk table were drawn using the survminer package
(25).
Gene set enrichment analysis
To identify the possible pathway through which hub
genes may play a part in the development of CRC, the expression
data from GSE14333 was also used to perform Gene Set Enrichment
Analysis (GSEA). The expression data of 290 cases were uniformly
divided into two groups according to each hub gene's expression
value.
We used the GSEA-p 2.0 software to conduct the
enrichment analysis (26). For
configuration, ‘c2.cp.kegg.v6.2.symbols.gmt’ from the Molecular
signatures database (MSigDB) 3.0 (27) was used as the gene set, and the
permutation number was set to 1,000 as the default. Finally,
P-values <0.05 and FDR <25% were considered to be
statistically significant (28).
Statistical analysis
In this study, we used Pearson correlation
coefficient to measure the strength of the relationship between the
variables. The coexpression of mRNA expression level of
PLAGL2 and POFUT1 was presented by linear regression
model. Coefficient of determination was calculated and presented.
The independent samples t-test was performed for data comparison in
GEPIA validation part. All statistical analyses were performed
using R program. P-values <0.05 was considered to indicate a
statistically significant result.
Results
Data preprocessing
A workflow of the study is shown in Fig. 1. The dataset GSE39582 contained 585
samples from CRC patients, including 19 normal tissue samples and
566 tumor samples, while GSE14333 had 290 primary CRC tissues. We
used the GSE39582 data to build our network and GSE14333 for
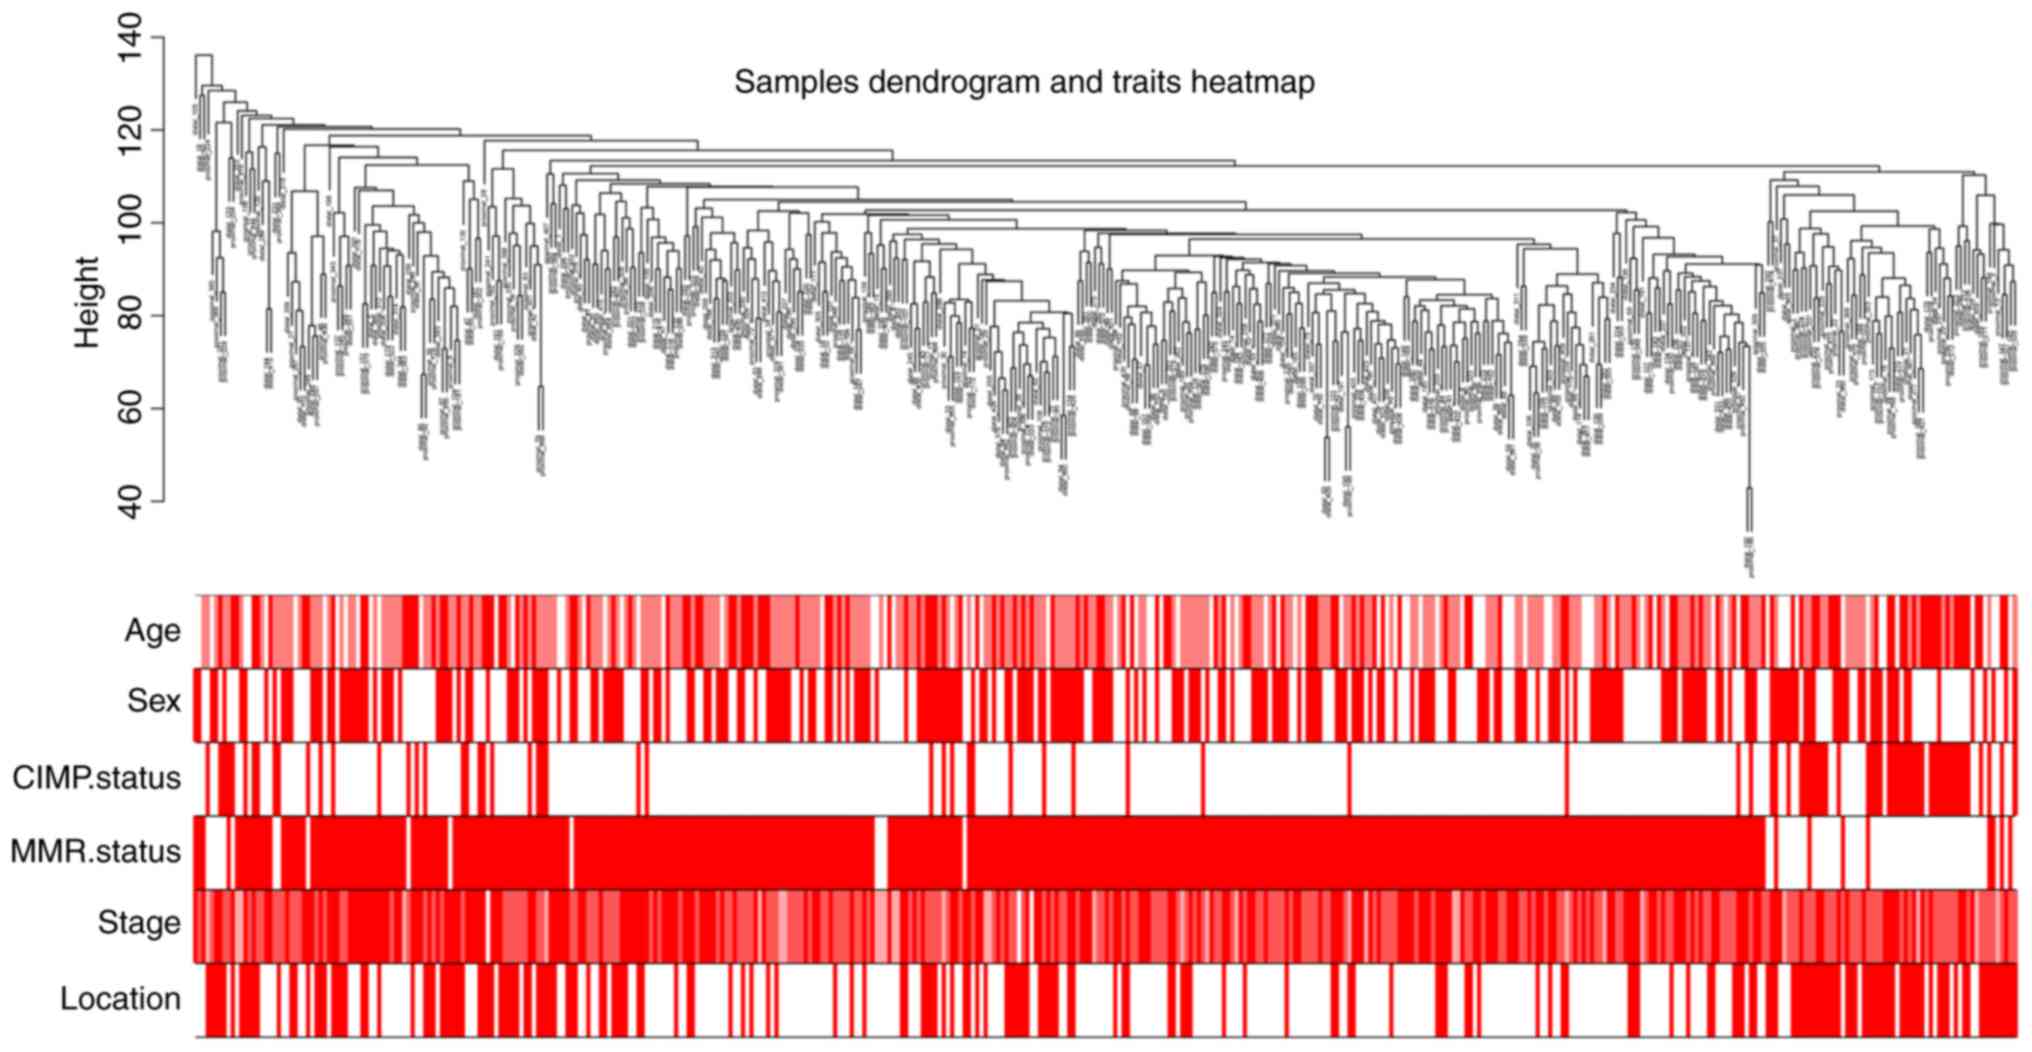
validation purposes. After data collection, a total of 436 tumor
samples with complete clinical information from GSE38582 were
obtained. The clinical information of GSE39582 is shown in the
clustering dendrogram with the trait heatmap (Fig. 2).
For genes, we transformed the 50,362 probe ids into
22,880 official gene symbols and calculated the median absolute
deviation (MAD) of each gene in all samples mentioned above. The
three-quarters genes, which equals 17,160, that have the highest
MAD were used to construct the final expression network. This step
also ensured that the median absolute deviation was not 0, thereby
avoiding further errors when constructing the gene coexpression
network.
In the meantime, the preprocess of TCGA RNA-seq data
was different. We combined the COAD and READ data into one matrix,
which has a total of 19,754 genes and 644 samples. Then, we deleted
22 repeat samples and filtered out the genes with zero expression
in more than 80% of samples. After voom normalization, we chose the
top 12,000 genes with the highest MAD for further analysis.
Network construction and module
identification
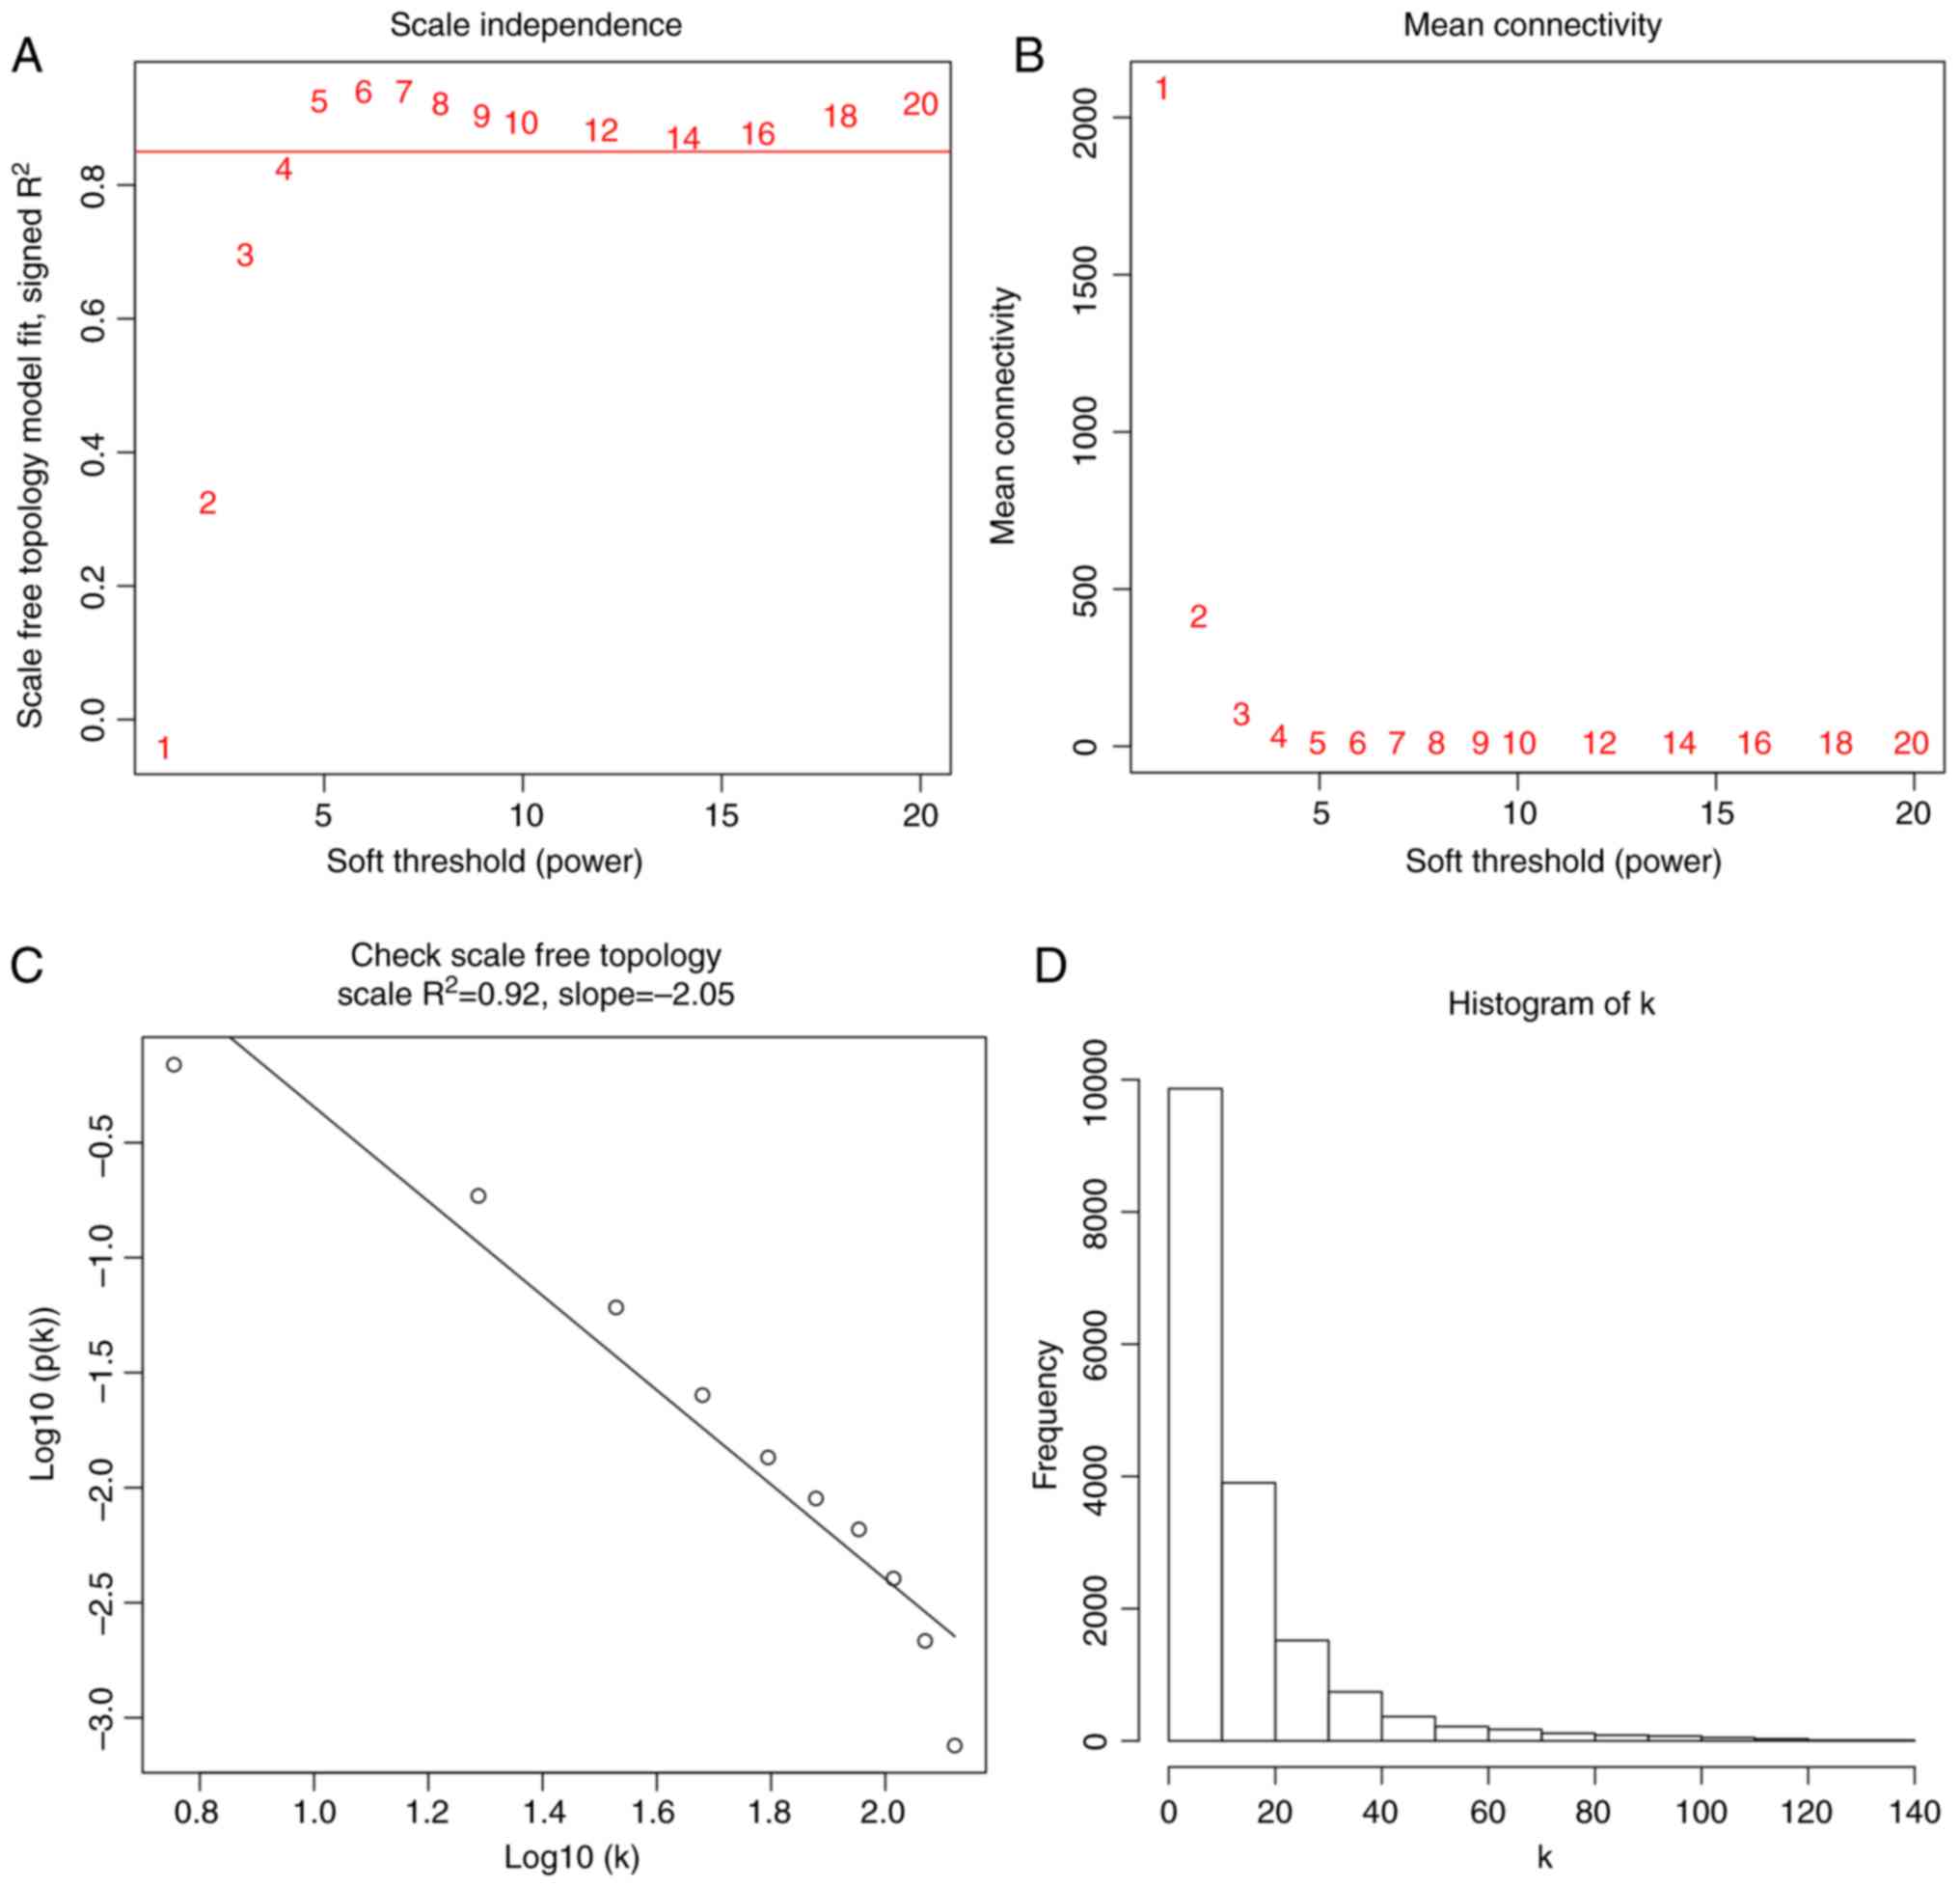
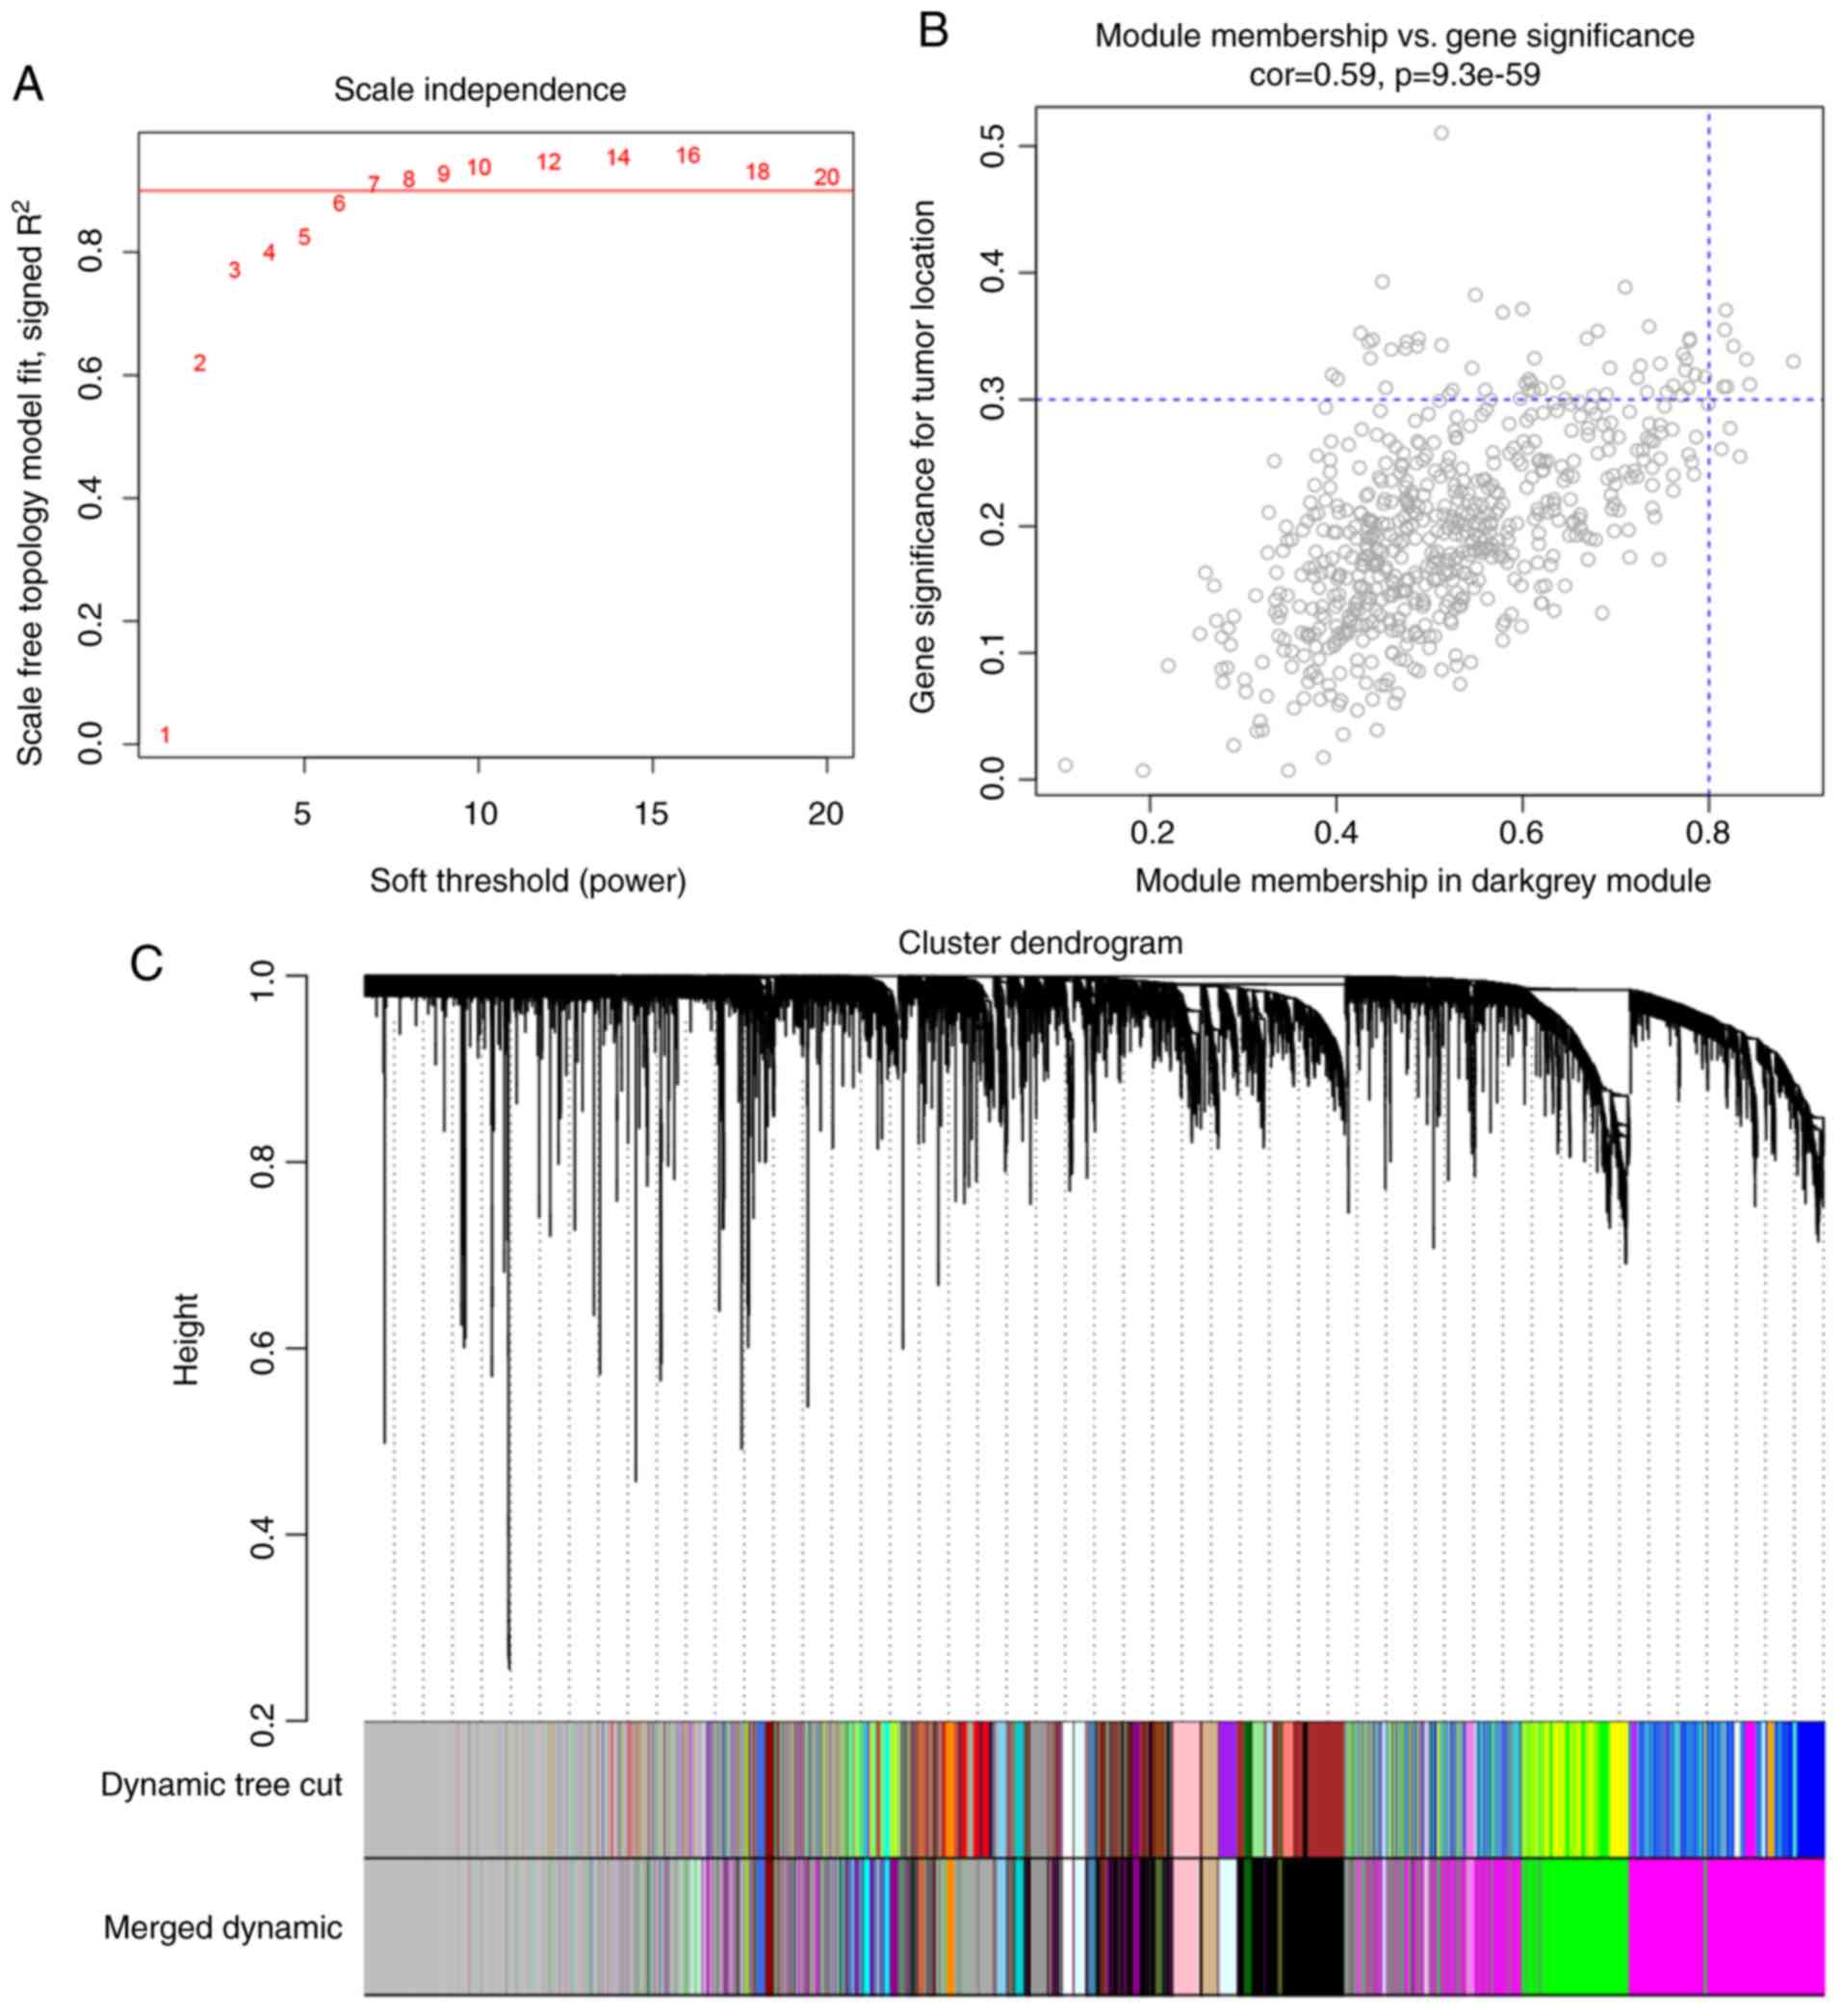
In choosing the best threshold, we calculated the
network topology for soft-thresholding powers from 1 to 20. As
shown in Fig. 3A, power value 5,
which was the lowest power for the scale-free topology fit index on
0.9, was selected. Afterward, we checked the mean connectivity
(Fig. 3B) and double-checked the
scale-free topology R2 with a linear regression plot
(Fig. 3C). Fig. 3D contains a histogram of the frequency
of connections. A highly skewed histogram is said to approximate a
scale-free network.
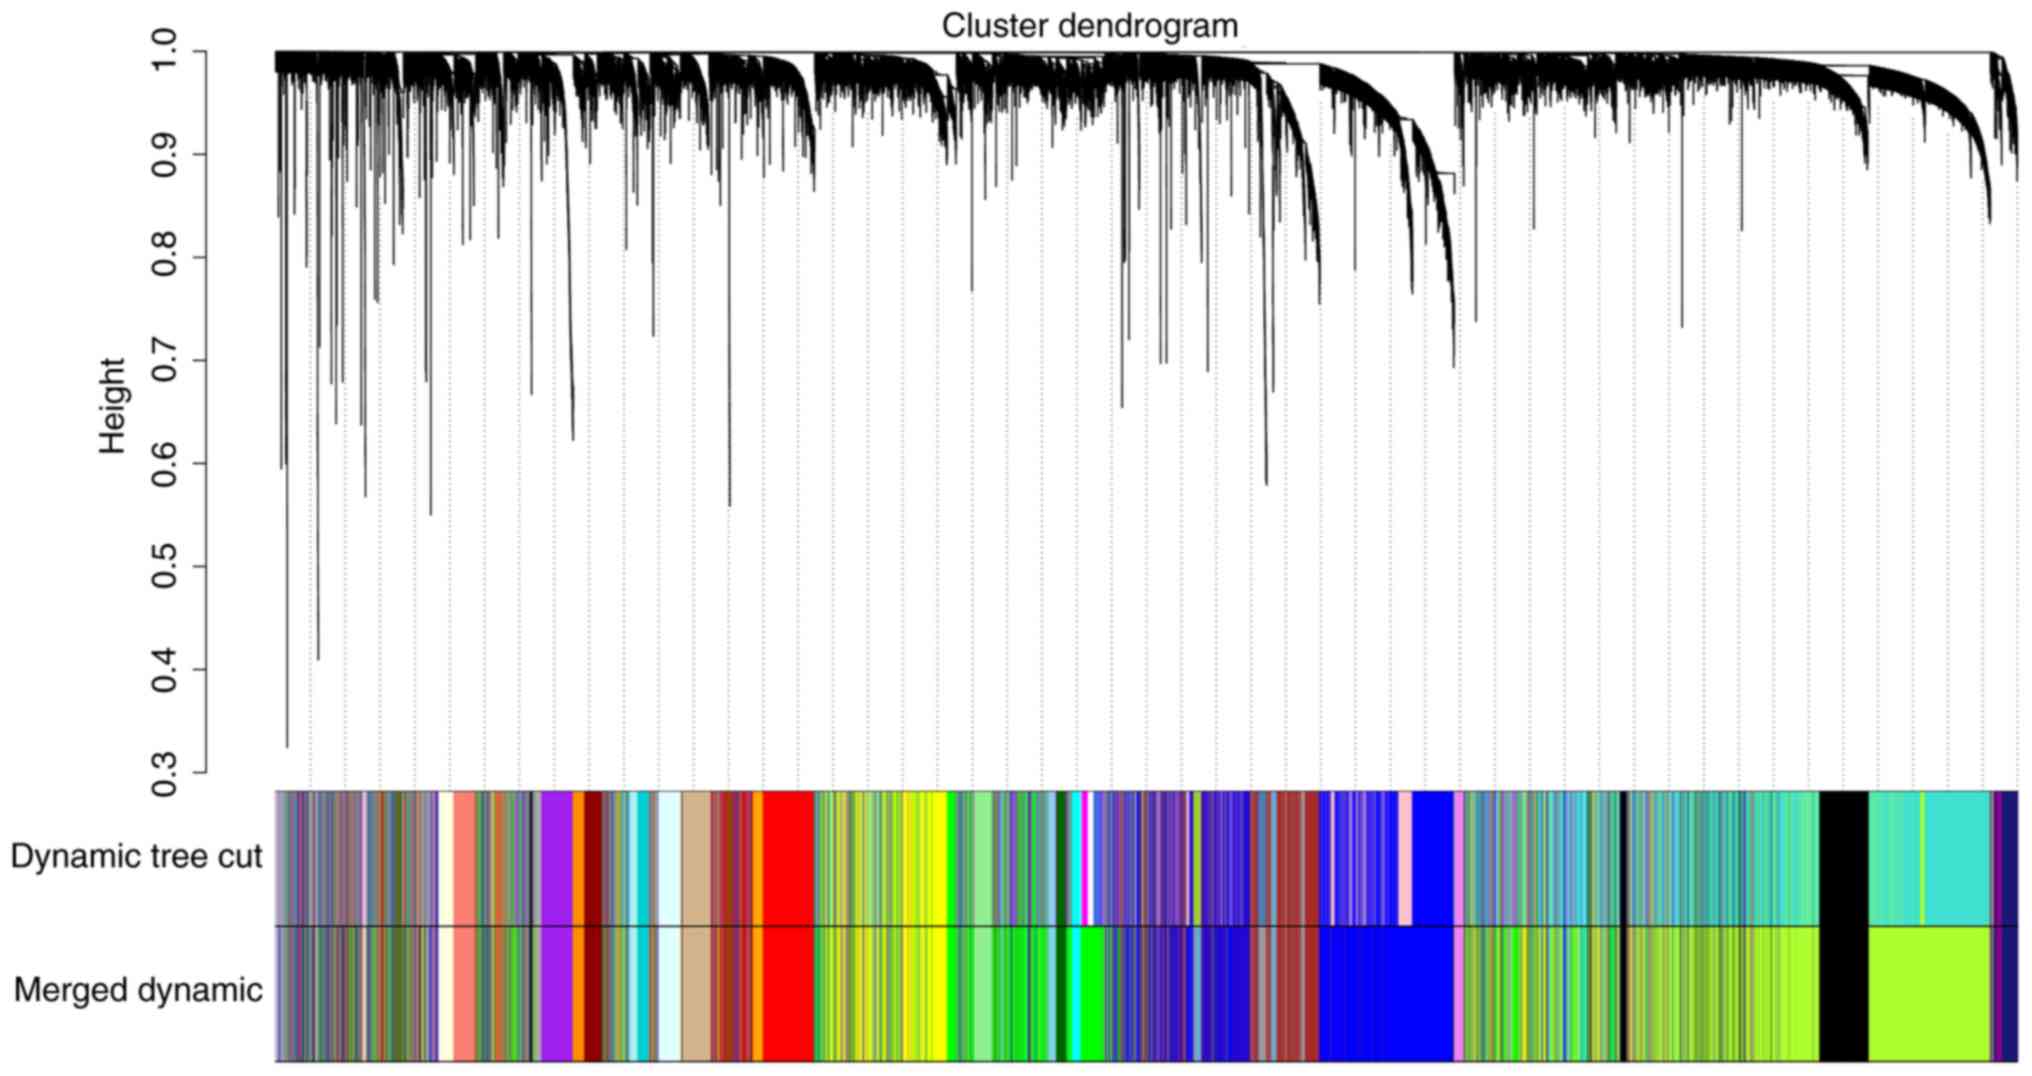
The coexpression similarity matrix was then
transformed into the adjacency matrix by choosing 5 as a soft
threshold, and a topological overlap matrix (TOM) was subsequently
computed. Using the dynamic tree cut method, a total of 38 modules
were identified. The modules with higher correlation than 0.75 were
subsequently merged, resulting in 31 modules at last (Fig. 4). The gray module includes genes that
were not assigned to any gene modules.
In the network built by the TCGA dataset, the soft
threshold was 7 by the calculation (Fig.
5A). Ultimately, 26 gene modules were recognized (Fig. 5C).
Identification of key modules
To analyze the relationship between gene modules and
sample clinical information, we employed module eigengene (ME) as
the average gene expression level of the corresponding modules. It
can be considered a representative of the gene expression profiles
in a module. The correlations between module eigengene and clinical
phenotypes in GSE39582 were calculated and plotted as a labeled
heatmap (Fig. 6). The red module and
orange module were significantly associated with tumor
location.
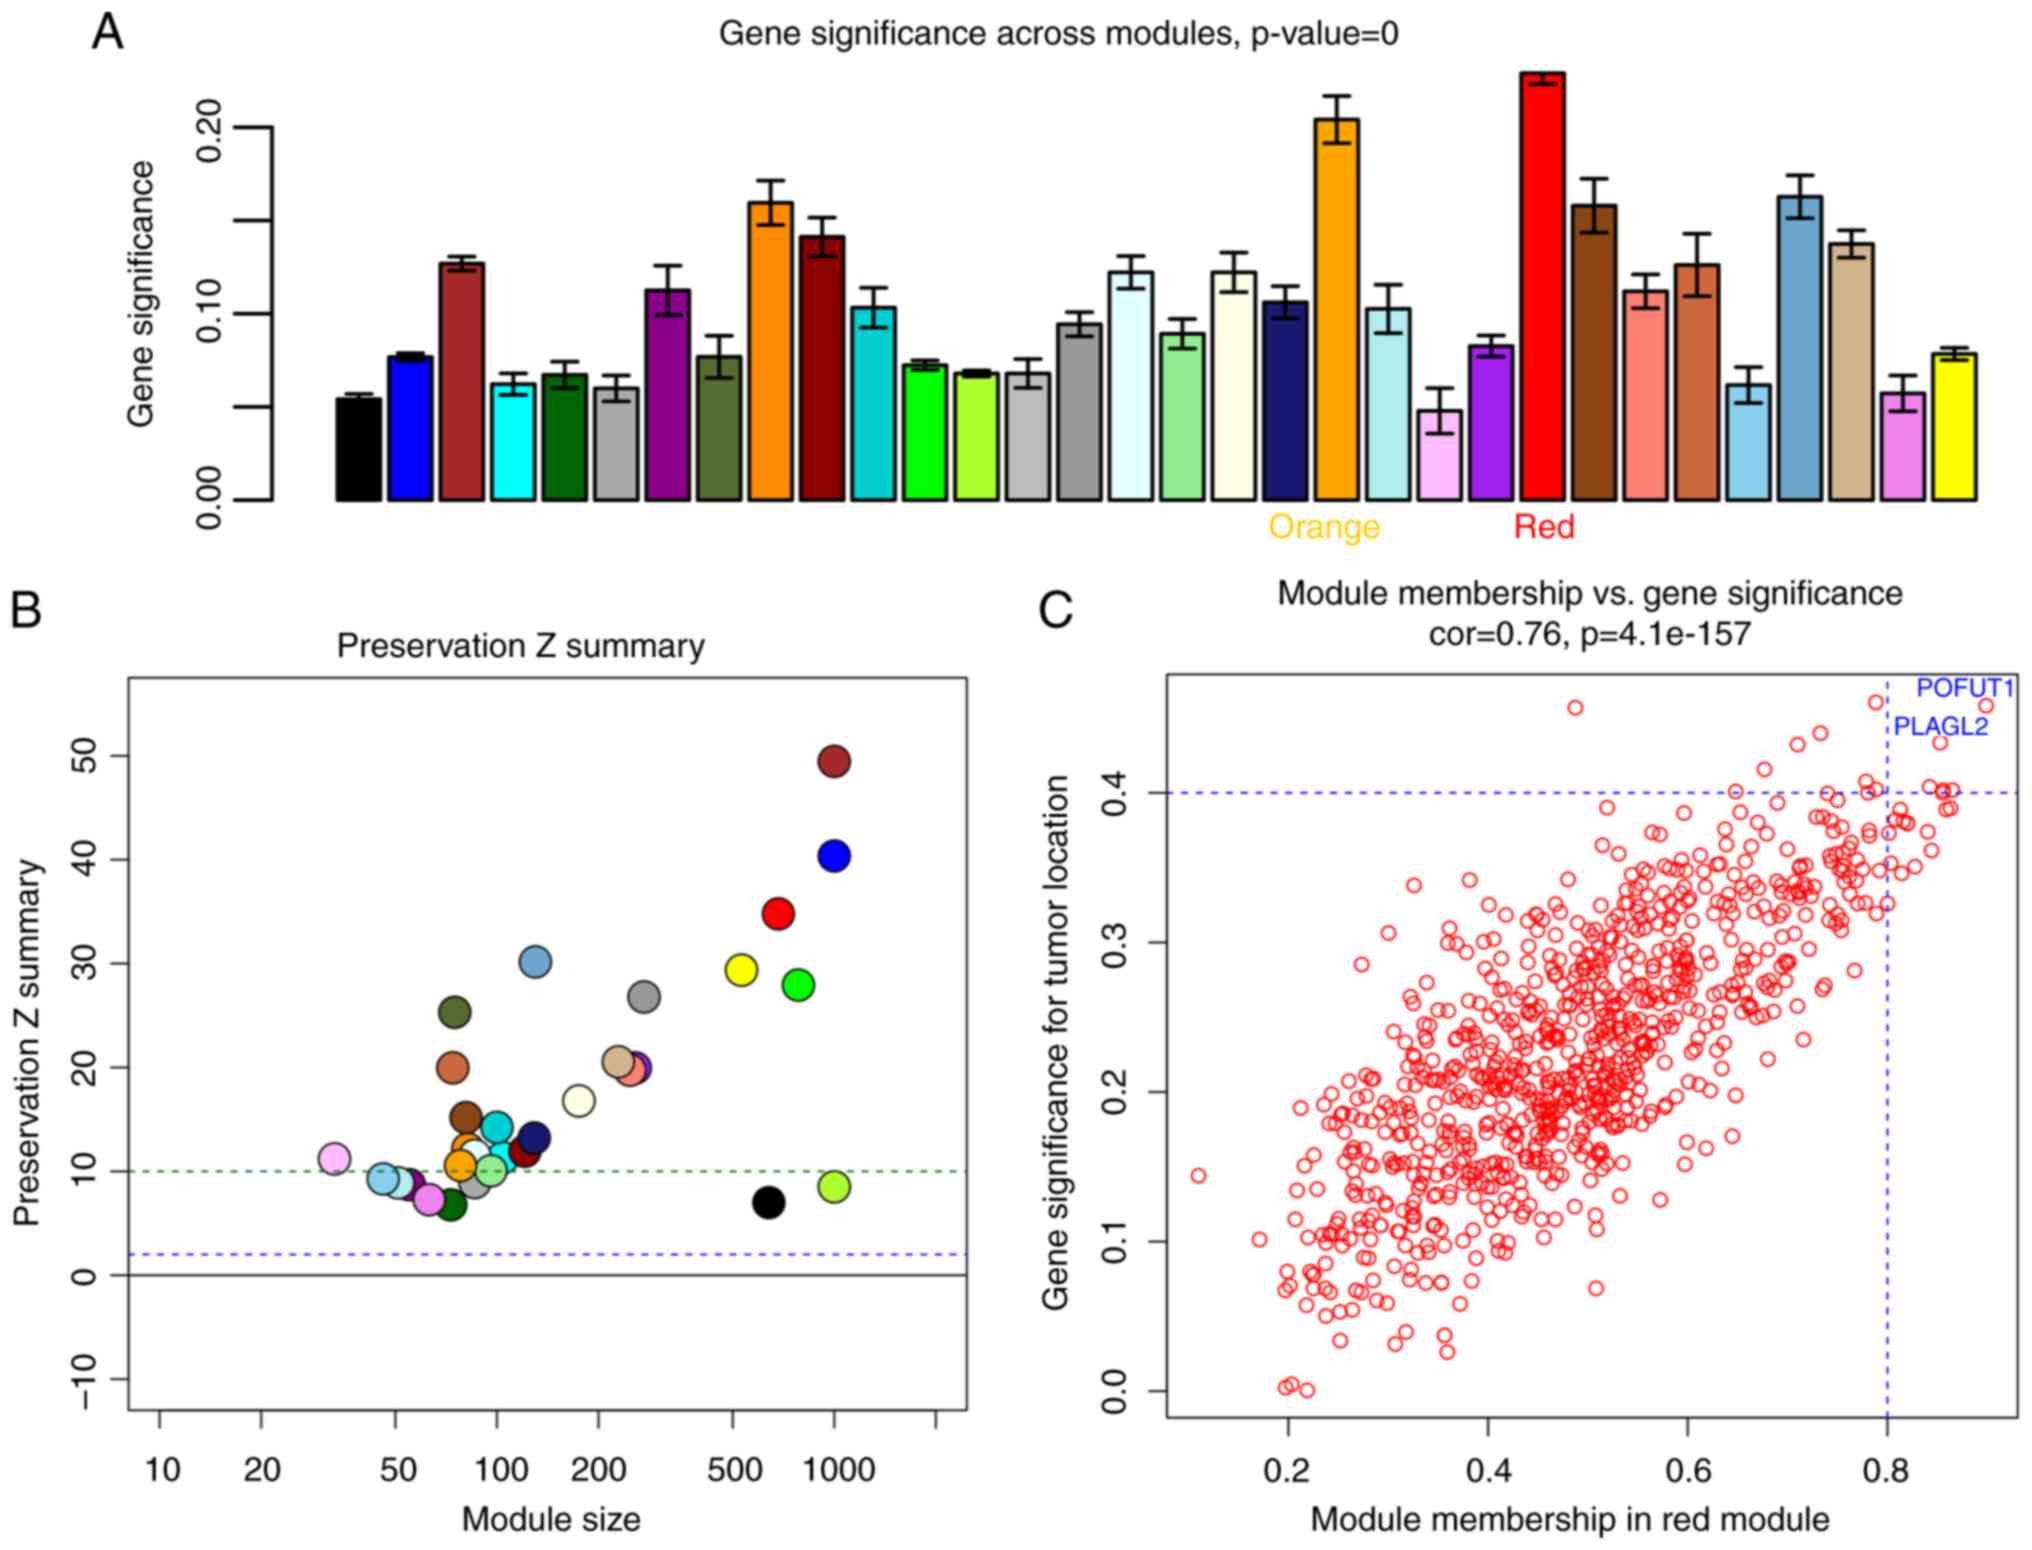
We calculated gene significance based on the
correlation of a gene expression profile with the samples' location
traits. Then, the module significance was defined as the average
absolute value of the gene significance of all genes in one module.
As shown in Fig. 7A, the red and
orange modules had considerably stronger correlations with tumor
location than did the rest of the modules.
To determine the module's reproducibility, module
preservation analysis was performed using an independent dataset
GSE14333. As we can see in Fig. 7B,
modules below the green dashed line (Z summary <10) are poorly
preserved, while the modules above the line are well-preserved in
the CRC tissues. The red module, according to the preservation
test, is highly preserved in CRC; however, the orange module showed
moderate preservation. Thus, we chose the red module for further
analysis.
Again, the same method was applied to TCGA data,
locating a similar dark-gray module (Fig.
5D).
Identification of hub genes in the key
module
There were 865 genes in the GSE39582 red module.
After plotting the gene significance against module membership, we
observed that genes with higher module memberships tended to have
higher gene significance in this module (Fig. 7C). We used a relatively high criterion
to select hub genes: The absolute value of gene significance
>0.4 and module membership >0.8. Six hub genes were
successfully identified. The genes with the highest gene
significance were found to be POFUT1 and PLAGL2,
which are labeled in blue print in Fig.
7C.
Meanwhile, in the TCGA dark-gray module, we used the
absolute value of gene significance >0.3 to filter out 8 hub
genes (Fig. 5B). After combining two
datasets, we determined that there were 12 possible hub genes, 2 of
which are in common (Table I).
 | Table I.Twelve hub genes are found in the
GSE39582 and TCGA dataset. |
Table I.
Twelve hub genes are found in the
GSE39582 and TCGA dataset.
| Hub gene | Ensemble ID | Name | Cytogenetic
location |
|---|
|
PLAGL2 | 5326 | PLAG1-like zinc
finger 2 | 20q11 |
|
POFUT1 | 23509 | Protein
O-fucosyltransferase 1 | 20q11 |
| TTI1 | 9675 | TELO2 interacting
protein 1 | 20q11 |
| ASXL1 | 171023 | Additional sex
combs-like 1 | 20q11 |
| AAR2 | 25980 | AAR2 splicing
factor homolog | 20q11 |
| PIGU | 128869 |
Phosphatidylinositol glycan anchor
biosynthesis class U | 20q11 |
| STAU1 | 6780 | Staufen
double-stranded RNA binding protein 1 | 20q11 |
| DYNLRB1 | 83658 | Dynein light chain
roadblock-type 1 | 20q11 |
| NELFCD | 51497 | Negative elongation
factor complex member C/D | 20q11 |
| ZSWIM3 | 140831 | Zinc finger
SWIM-type containing 3 | 20q11 |
| MOCS3 | 27304 | Molybdenum cofactor
synthesis 3 | 20q11 |
| TM9SF4 | 9777 | Transmembrane 9
superfamily member 4 | 20q11 |
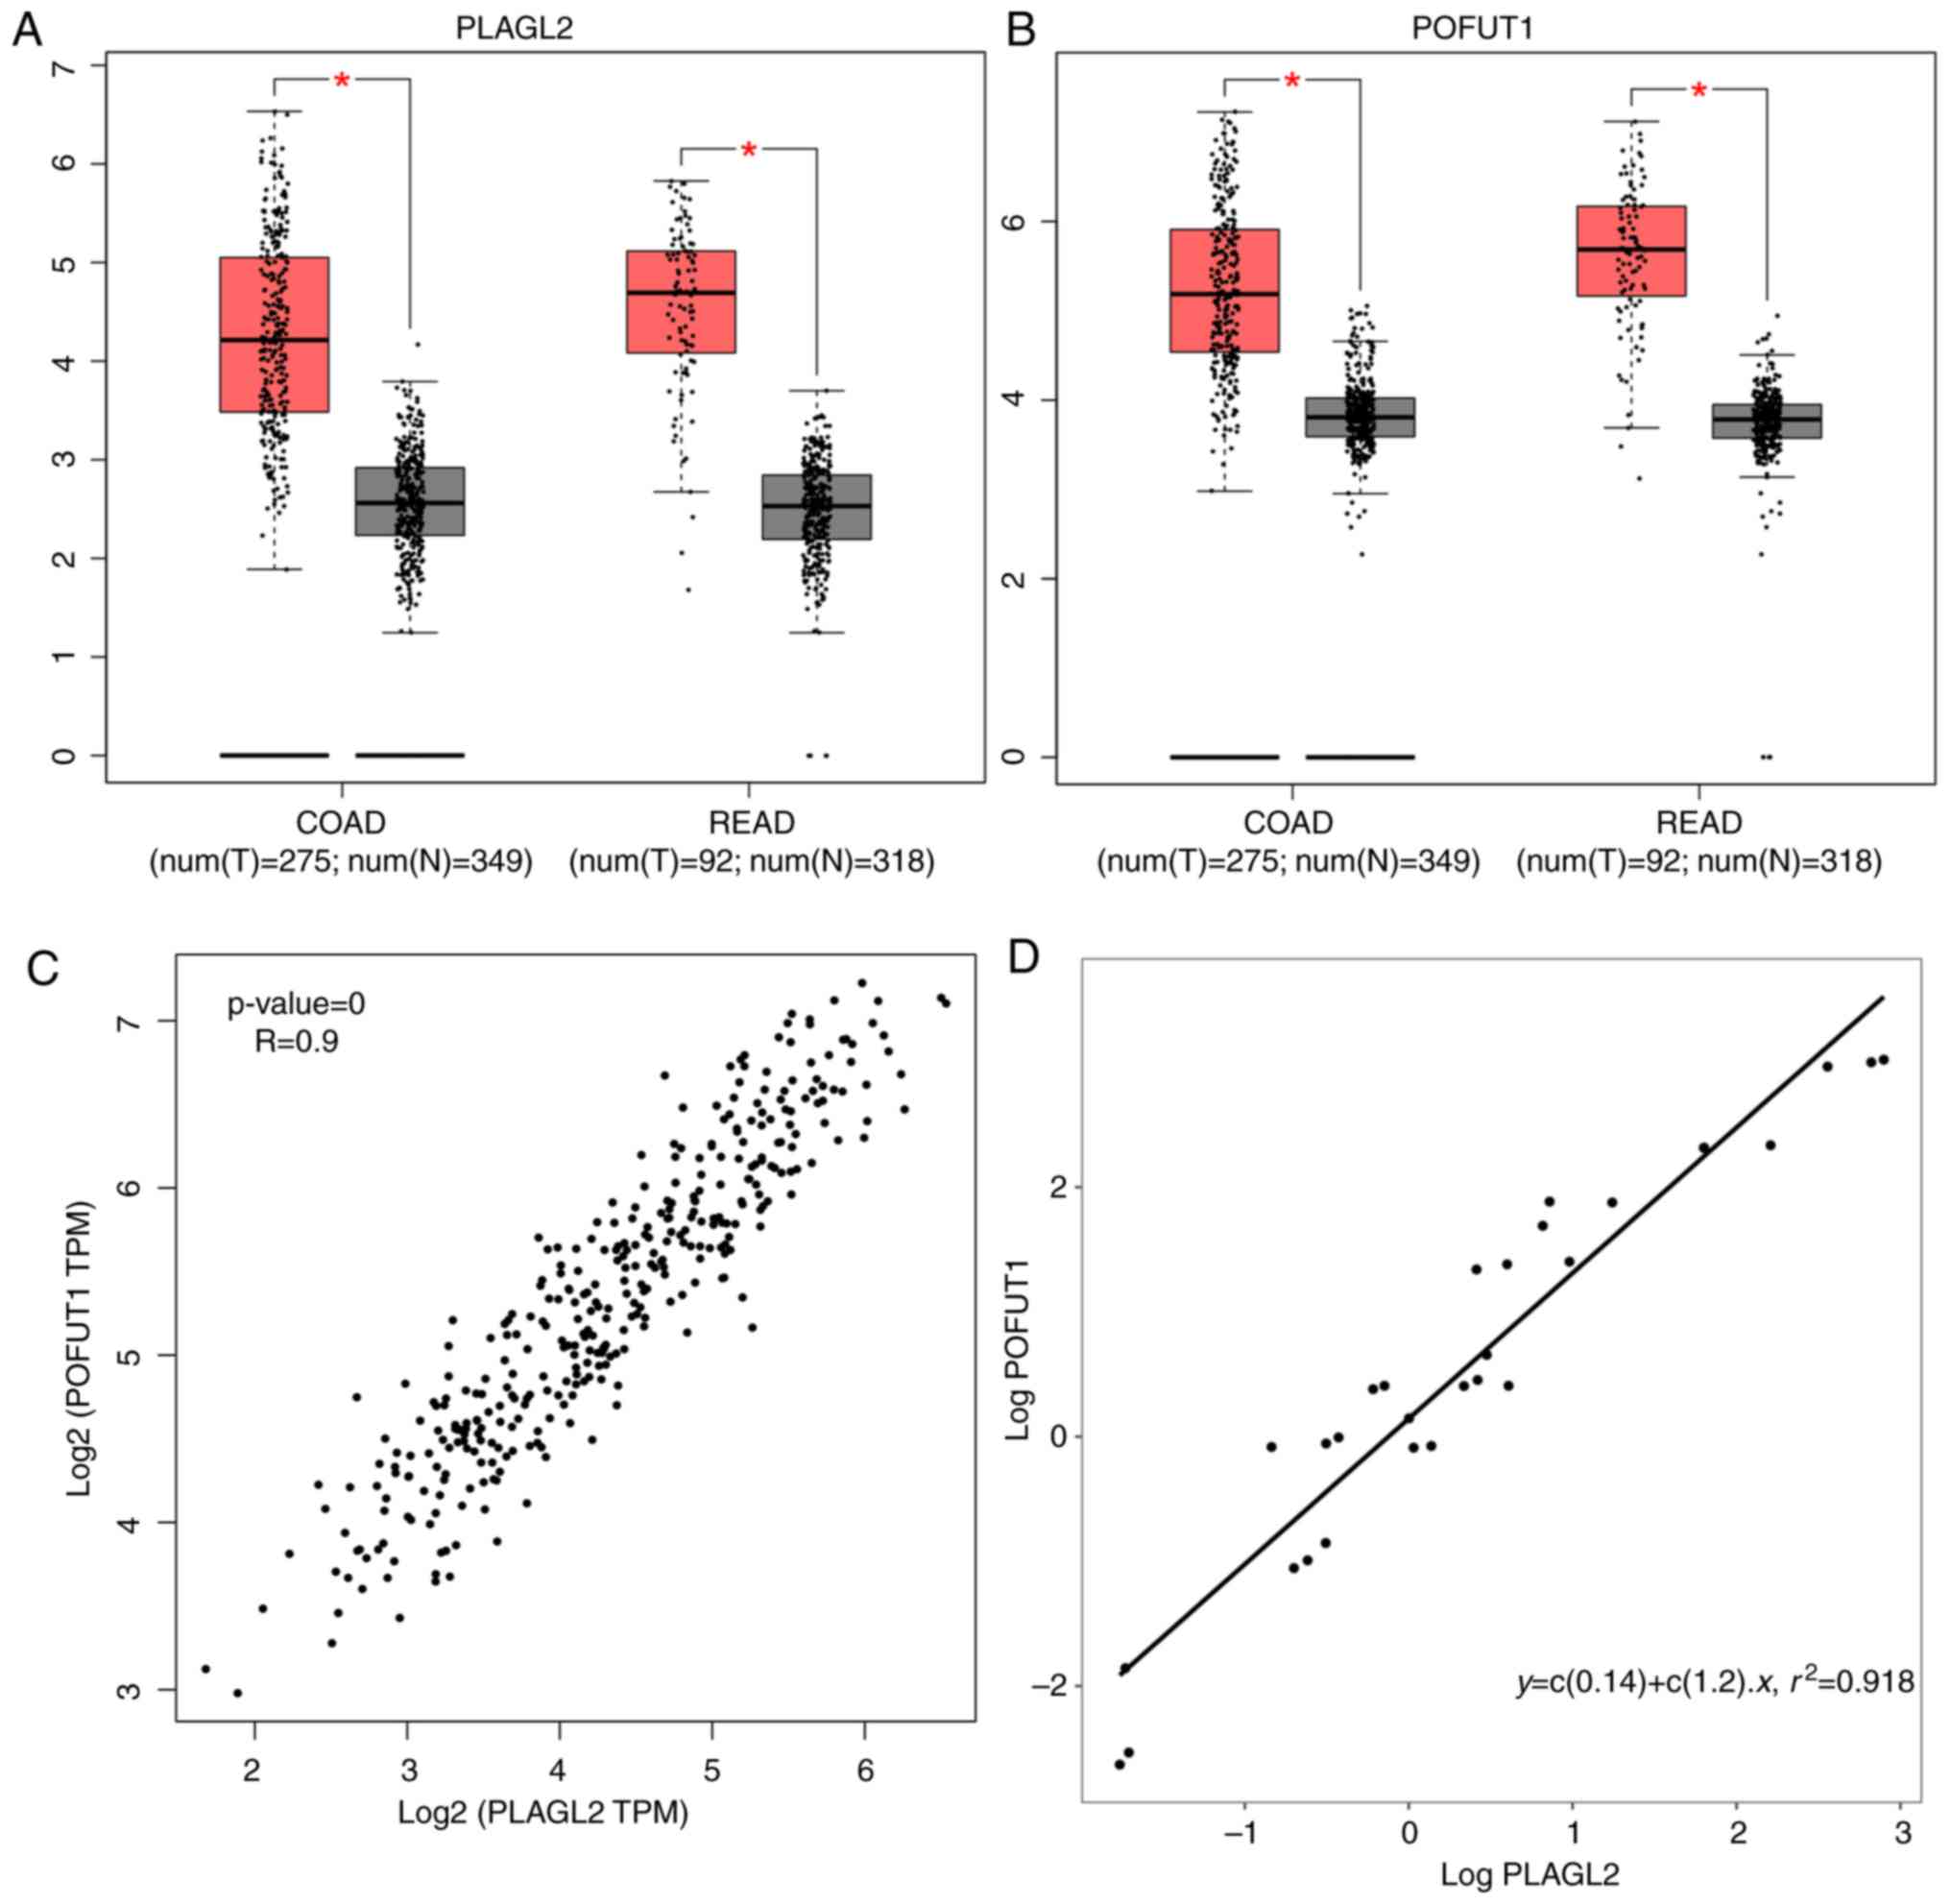
Validation of the hub genes
We concentrated on PLAGL2 and POFUT1
because of their high gene significance and their presence in both
datasets. We then evaluated their expression with the online
TCGA-based tool GEPIA. PLAGL2 and POFUT1 were found
to be significantly differentially expressed between tumor and
normal tissue in both the COAD and READ datasets (Fig. 8A and B). We also performed a
correlation analysis between PLAGL2 and POFUT1. The
plot shows that the Pearson correlation coefficient is tightly
correlated to 0.9 in CRC (Fig.
8C).
We utilized quantitative polymerase chain reaction
(qPCR) to measure the RNA expression of PLAGL2 and
POFUT1 in CRC samples. PLAGL2 had a high positive
correlation with POFUT1 according to the qPCR results
(Fig. 8D).
Survival analysis and gene set
enrichment analysis
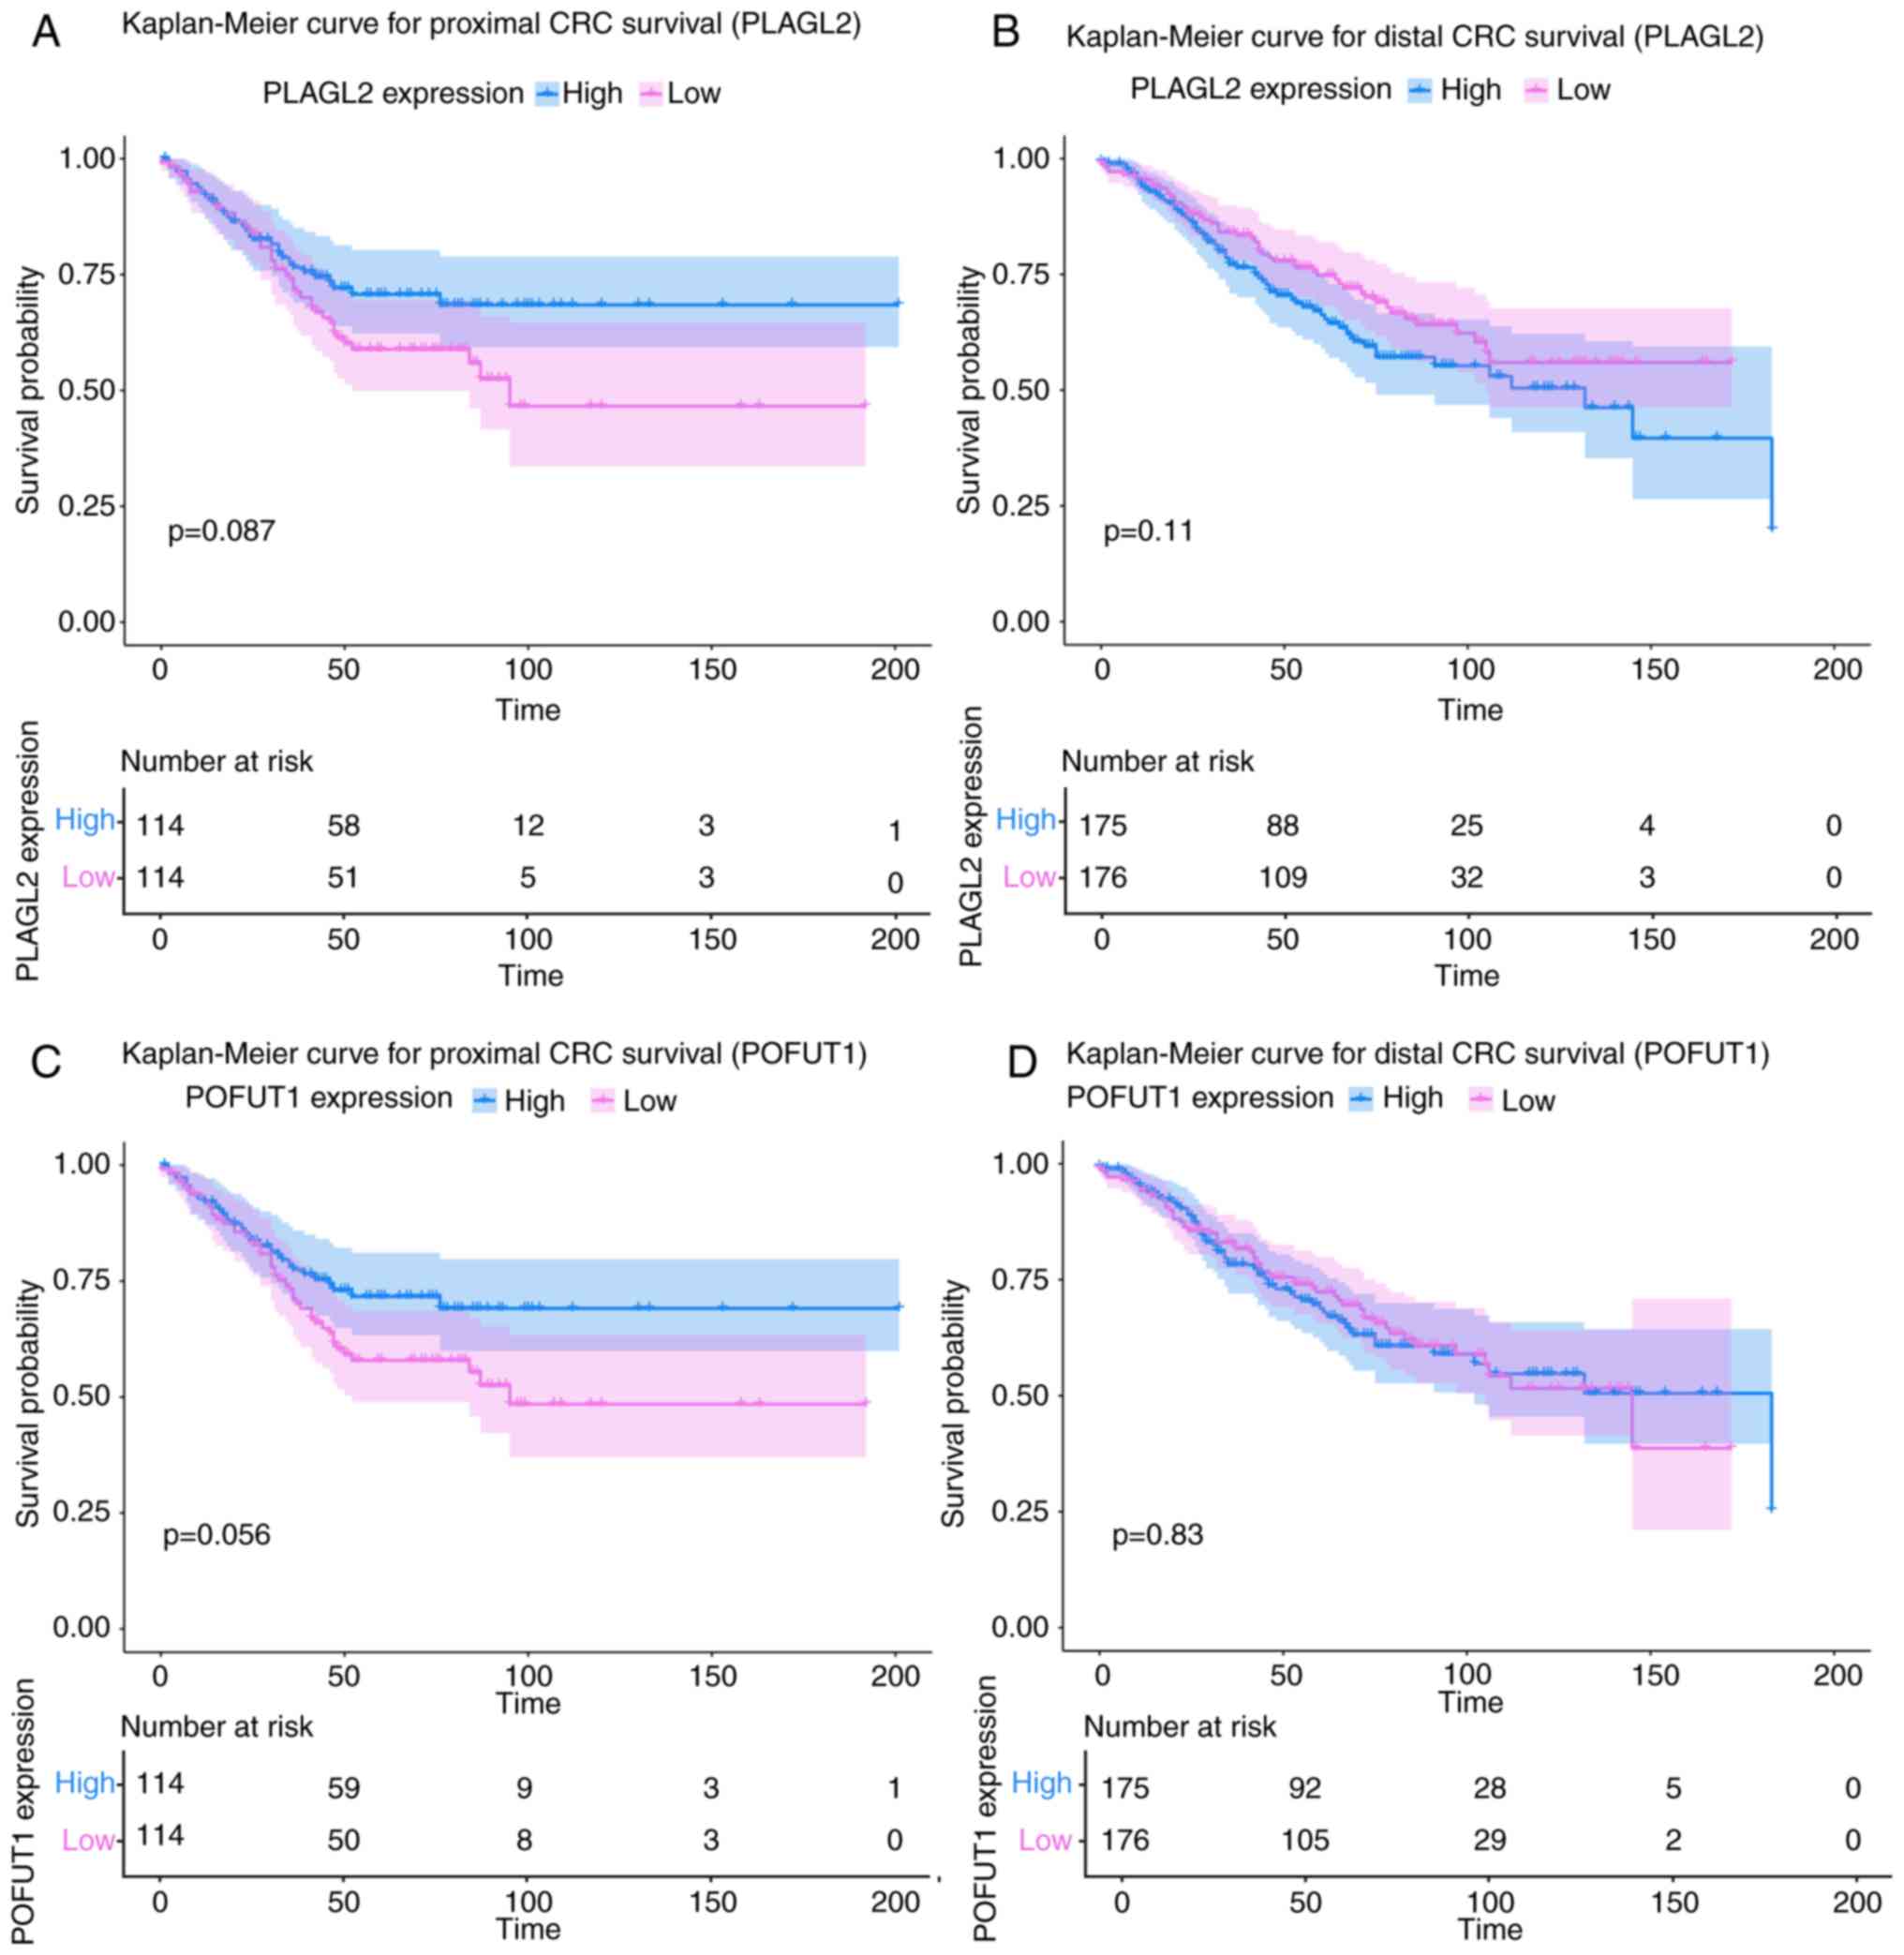
For survival analysis, Kaplan-Meier curves were
drawn for PLAGL2 and POFUT1 in both proximal and
distal CRC (Fig. 9). Although the
log-rank P-value of all the analyses was >0.05 (not
statistically significant), we still compared the results from
different parts of the colon. In proximal CRC samples, there was a
clear trend that high PLAGL2 and POFUT1 expression is
related to adverse prognosis in CRC patients. However, in distal
CRC samples, the expression of POFUT1 was not related to
survival, and the high expression of PLAGL2 was even
associated with poor survival.
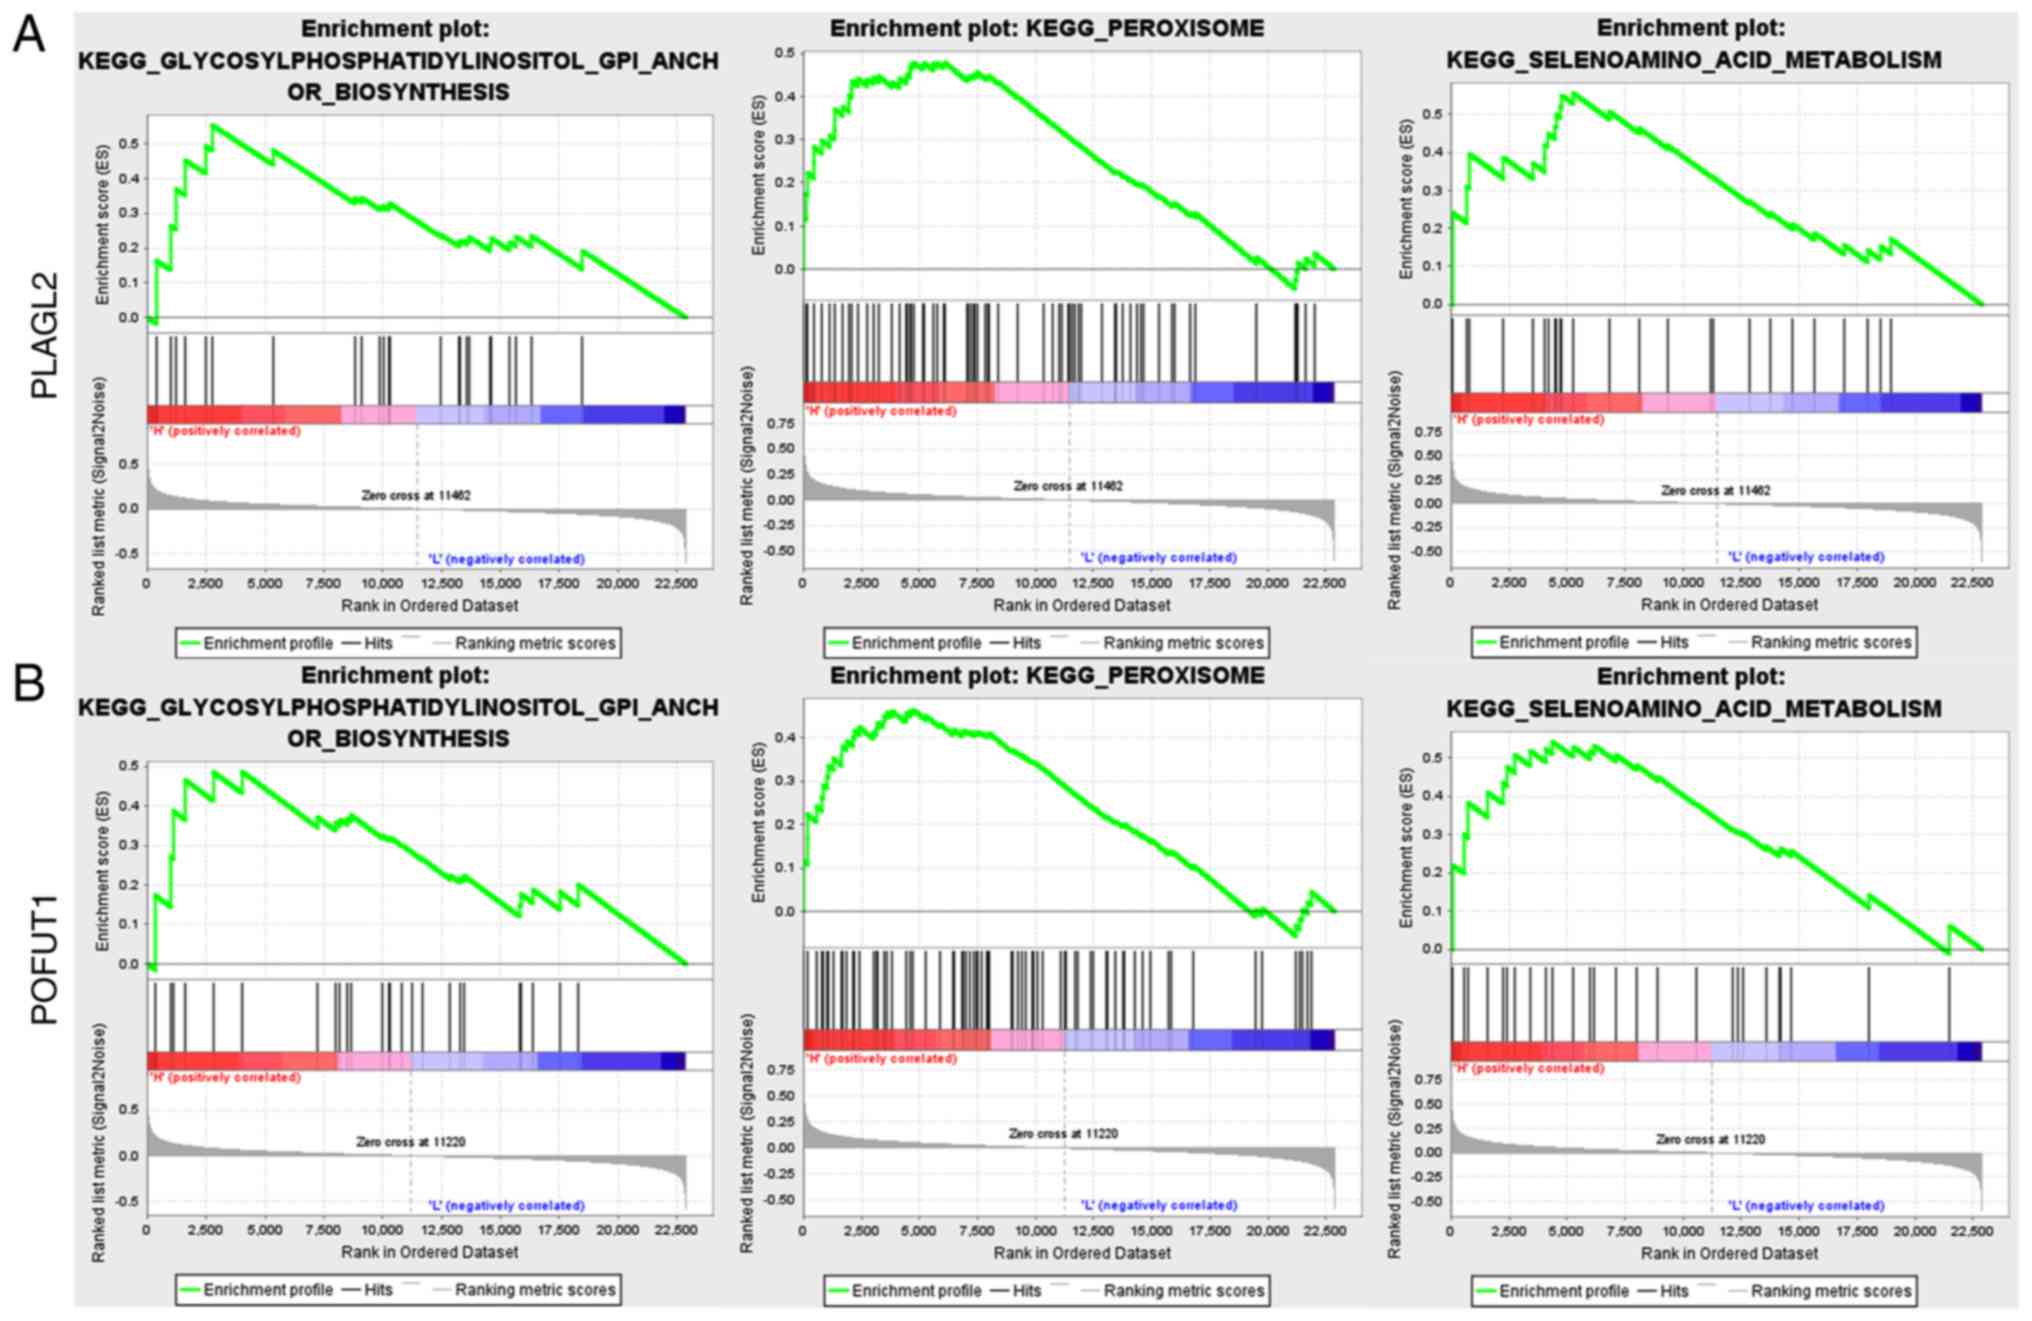
We also performed a Gene Set Enrichment Analysis
based on the expression level of PLAGL2 and POFUT1.
As shown in Fig. 10, these two genes
share a similar enriched KEGG pathway: Glycosylphosphatidylinositol
GPI anchor biosynthesis and peroxisome and selenoaminoacid
metabolism.
Discussion
We have only recently (over the past 5 to 10 years)
determined that the parts of the colon derived from the midgut and
the hindgut are different. Numerous studies have investigated this
subject. In 2015, Guinney and colleagues published a leading
article in Nature Medicine. These researchers divided CRC into 4
well-defined subtypes by their gene expression patterns and
discovered that certain types are mainly located on one side of the
colon rather than being randomly distributed (29). Moreover, behind this phenomenon, there
must be gene expression patterns that we can be investigated.
The information captured by microarray or RNA-seq
experiments is notably richer than a list of differentially
expressed genes. Microarray and RNA-seq data are more completely
represented by considering the relationships between measured
transcripts, which can be assessed by pair-wise correlations
between gene expression profiles. Prior bioinformatics studies have
noted the importance of gene coexpression networks in various types
of cancers. However, many studies used differentially expressed
genes to build the coexpression network. It is not recommended by
the author of WGCNA, because filtering genes by differential
expression will lead to a set of correlated genes that will
essentially form a single (or a few highly correlated) module.
Since nonvarying genes usually represent noise, we used genes with
the top 75% MAD to improve the robustness and confidence of the
present analysis.
In this study, we used three different datasets to
analyze the gene expression patterns of CRC. These datasets have
different patient information which leads to the different clinical
features. However, when we clustered every gene into the modules by
WGCNA, we did not use the clinical features of any kind.
Considering the number of samples in these datasets are large,
together with the results from the module preservation test, we
could assume the key module we identified is universal. An
interesting part in the module-to-trait relationship heatmap is
that the modules with high correlation with tumor location also
highly correlate with mismatch repair (MMR) (30) and the CpG island methylator phenotype
(CIMP) (31) status. In the last
decade, extensive studies have studied this problem and found that
tumors with deficient mismatch repair (microsatellite
instability-high, MSI-H) and the CpG island methylator phenotype
are mostly located on the right side of the colon, which matches
our sample traits from GSE39582. Although dMMR or CIMP+
samples are not the majority in the dataset, this tendency may
cause a bias that the correlation between tumor sites and the key
module is mainly from MMR and CIMP status or other clinical
features. To diminish the bias, we also used module significance to
define the correlation between modules and tumor site phonotype,
both in GSE39582 and TCGA. Although other clinical information was
slightly different, the key modules we found in both datasets were
similar, which had several common hub genes.
The fundamental theory of WGCNA is that we assume
genes interact with each other in a scale-free network. In this
way, the hub genes play more important roles in the whole module
than other genes. Among the cluster of genes that have a strong
relationship with the tumor location of CRC, 12 hub genes with high
significance were identified in the GSE39582 and TCGA datasets,
which may have contributed most to the distinct behaviors. Some of
the genes have been found to be critical in CRC development and
prognostic biomarkers in specific stages from other publications
(32,33).
As we examined these hub genes, we found they are
all located on the long arm of chromosome 20 (20q11). Previous
studies have confirmed that the copy number gain in 20q (mostly in
20q11 and 20q13) occurs in more than 65% of CRC patients (34). As a consequence of copy number gain of
20q, multiple genes mapping at the chromosome 20q amplicon
contribute to colorectal adenoma to carcinoma progression (35). In our study here, we identified
several coexpressed hub genes in 20q11 that may be attributed to
the differential features of proximal and distal CRC. However, in
the 12 hub genes displayed in Table
I, PLAGL2 and POFUT1 were not only presented in
the two datasets, but also showed the highest gene significance. We
believe that they are more representative than other genes, thus we
focused on them for further exploration.
PLAGL2 encodes a zinc finger transcription
factor that contains seven C2H2 zinc finger motifs that exhibit DNA
binding and transcriptional activation activity. Recently, Li et
al found that overexpression of PLAGL2 transcriptionally
activates Wnt6 and promotes cancer development in CRC (36). PLAGL2 activates the
Wnt/β-catenin pathway as a transcription factor by binding to the
promoter region of Wnt6.
POFUT1, on the other hand, is essential for
Notch signal transduction in mammals. In 2018, Du et al
discovered that POFUT1 promotes CRC development through the
activation of Notch1 signaling (37).
Another study by Chabanais et al also confirmed that
POFUT1 is overexpressed in CRC from stage I, and its high
expression is associated with the metastatic process (38). In addition, these researchers found
that POFUT1 overexpression is markedly associated with
rectal location, which corroborates our finding.
In all the studies reviewed in this article,
PLAGL2 and POFUT1 are recognized as oncogenes that
promote or at least are associated with CRC development.
Furthermore, these genes are highly correlated based on our qPCR
result and correlation analysis from the TCGA dataset. As we found
in the GEPIA (Fig. 7), these genes
were both significantly differentially expressed between tumor and
normal tissue in both the COAD and READ datasets.
Moreover, our survival analysis, despite not being
statistically significant, found that there were different results
between left- and right-sided CRC for PLAGL2 and
POFUT1 (Fig. 9). In proximal
CRC patients, the red curves, which represent the low expression of
PLAGL2 and POFUT1, were beneath the blue ones, and
the log-rank P-value was at the verge of significance. However, in
distal CRC samples, the relationship of PLAGL2 and
POFUT1 expression and survival were vague and even reversed.
This research showed a considerable difference between left- and
right-sided survival with regard to PLAGL2 and
POFUT1, which indirectly indicates that the expression of
the genes is related to the tumor location in CRC patients.
According to our GSEA results, these two genes may
also take effect through glycosylphosphatidylinositol (GPI) anchor
biosynthesis and peroxisome and selenoamino acid metabolism
pathways. When we examined the hub genes in Table I, we found that one of the hub genes
from GSE39582 is associated with one of the pathways mentioned
above. PIGU is a component of the GPI transamidase complex
that may be involved in the recognition of either the GPI
attachment signal or the lipid portion of GPI. This finding
confirms that the hub genes' functions are as tightly connected as
their expression levels, which is the foundation of the WGCNA
theory. However, there are few articles discussing the association
of this gene with the development of CRC. This subject warrants
further investigation in the future.
Another thorough study of gene expression in colon
cancer from Slattery et al used Ingenuity Pathway Analysis
(IPA) to determine networks associated with deregulated genes
(39). In his study, PLAGL2
and POFUT1 were found to be differentially expressed genes
in both MSI and CIMP status comparisons. In other words, we could
assume that these genes may be related to the anatomical site of
CRC through MSI and CIMP status.
The findings of these studies indicate that the hub
genes that we found are oncogenes that may relate to the sidedness
of CRC. Notably, PLAGL2 and POFUT1 are the centers of
the module and are differentially expressed between normal and
tumor tissues, which makes them promising biomarkers.
As Dr Alan P. Venook noted in Clinical Advances in
Hematology & Oncology (40), what
matters is not the sidedness of the tumor because sidedness is
simply a surrogate for the types of tumors that tend to occur on
that side. Our work, while preliminary, suggests that a weak link
may exist between the oncogenesis triggered by these genes and the
primary site of CRC. However, the underlying mechanism requires
further investigation.
Acknowledgements
This research represents partial fulfillment of the
requirements for a Master degree for YL and WZ.
Funding
This research did not receive any specific grant
from funding agencies in the public, commercial, or not-for-profit
sectors.
Availability of data and materials
The datasets analyzed during the current study are
available from the corresponding author on reasonable request.
Authors' contributions
YL, BX, XH and HZ conceived and designed the study.
BB collected the data. YL and BX performed the bioinformatics
analysis. LS and WZ performed the experiments. YL and BX wrote the
paper. BB, LS, WZ, XH and HZ reviewed and edited the manuscript.
All authors read and approved the manuscript and agree to be
accountable for all aspects of the research in ensuring that the
accuracy or integrity of any part of the work are appropriately
investigated and resolved.
Ethics approval and consent to
participate
Research was authorized by the Ethics Committee of
Sir Run Run Shaw Hospital and informed consent was obtained from
all participating patients. The reference number was
20180226-88.
Patient consent for publication
Not applicable.
Competing interests
The authors declare that they have no competing
interests.
References
|
1
|
Bray F, Ferlay J, Soerjomataram I, Siegel
RL, Torre LA and Jemal A: Global cancer statistics 2018: GLOBOCAN
estimates of incidence and mortality worldwide for 36 cancers in
185 countries. CA Cancer J Clin. 68:394–424. 2018. View Article : Google Scholar : PubMed/NCBI
|
|
2
|
Arnold M, Sierra MS, Laversanne M,
Soerjomataram I, Jemal A and Bray F: Global patterns and trends in
colorectal cancer incidence and mortality. Gut. 66:683–691. 2017.
View Article : Google Scholar : PubMed/NCBI
|
|
3
|
Bufill JA: Colorectal cancer: Evidence for
distinct genetic categories based on proximal or distal tumor
location. Ann Intern Med. 113:779–788. 1990. View Article : Google Scholar : PubMed/NCBI
|
|
4
|
Elsaleh H, Joseph D, Grieu F, Zeps N, Spry
N and Iacopetta B: Association of tumour site and sex with survival
benefit from adjuvant chemotherapy in colorectal cancer. Lancet.
355:1745–1750. 2000. View Article : Google Scholar : PubMed/NCBI
|
|
5
|
Deng G, Kakar S, Tanaka H, Matsuzaki K,
Miura S, Sleisenger MH and Kim YS: Proximal and distal colorectal
cancers show distinct gene-specific methylation profiles and
clinical and molecular characteristics. Eur J Cancer. 44:1290–1301.
2008. View Article : Google Scholar : PubMed/NCBI
|
|
6
|
Minoo P, Zlobec I, Peterson M, Terracciano
L and Lugli A: Characterization of rectal, proximal and distal
colon cancers based on clinicopathological, molecular and protein
profiles. Int J Oncol. 37:707–718. 2010. View Article : Google Scholar : PubMed/NCBI
|
|
7
|
Lee GH, Malietzis G, Askari A, Bernardo D,
Al-Hassi HO and Clark SK: Is right-sided colon cancer different to
left-sided colorectal cancer? -a systematic review. Eur J Surg
Oncol. 41:300–308. 2015. View Article : Google Scholar : PubMed/NCBI
|
|
8
|
Glebov OK, Rodriguez LM, Nakahara K,
Jenkins J, Cliatt J, Humbyrd CJ, DeNobile J, Soballe P, Simon R,
Wright G, et al: Distinguishing right from left colon by the
pattern of gene expression. Cancer Epidemiol Biomarkers Prev.
12:755–762. 2003.PubMed/NCBI
|
|
9
|
Birkenkamp-Demtroder K, Olesen SH,
Sørensen FB, Laurberg S, Laiho P, Aaltonen LA and Orntoft TF:
Differential gene expression in colon cancer of the caecum versus
the sigmoid and rectosigmoid. Gut. 54:374–384. 2005. View Article : Google Scholar : PubMed/NCBI
|
|
10
|
Langfelder P and Horvath S: WGCNA: An R
package for weighted correlation network analysis. BMC
Bioinformatics. 9:5592008. View Article : Google Scholar : PubMed/NCBI
|
|
11
|
Marisa L, de Reynies A, Duval A, Selves J,
Gaub MP, Vescovo L, Etienne-Grimaldi MC, Schiappa R, Guenot D,
Ayadi M, et al: Gene expression classification of colon cancer into
molecular subtypes: Characterization, validation, and prognostic
value. PLoS Med. 10:e10014532013. View Article : Google Scholar : PubMed/NCBI
|
|
12
|
Jorissen RN, Gibbs P, Christie M, Prakash
S, Lipton L, Desai J, Kerr D, Aaltonen LA, Arango D, et al:
Metastasis-associated gene expression changes predict poor outcomes
in patients with dukes Stage B and C colorectal cancer. Clin Cancer
Res. 15:7642–7651. 2009. View Article : Google Scholar : PubMed/NCBI
|
|
13
|
Gautier L, Cope L, Bolstad BM and Irizarry
RA: Affy-analysis of Affymetrix GeneChip data at the probe level.
Bioinformatics. 20:307–315. 2004. View Article : Google Scholar : PubMed/NCBI
|
|
14
|
Hastie T, Tibshirani R, Narasimhan B and
Chu G: Impute: Imputation for microarray data. Bioinformatics.
17:520–525. 2001.PubMed/NCBI
|
|
15
|
Irizarry RA, Hobbs B, Collin F,
Beazer-Barclay YD, Antonellis KJ, Scherf U and Speed TP:
Exploration, normalization, and summaries of high density
oligonucleotide array probe level data. Biostatistics. 4:249–264.
2003. View Article : Google Scholar : PubMed/NCBI
|
|
16
|
Ritchie ME, Phipson B, Wu D, Hu Y, Law CW,
Shi W and Smyth GK: Limma powers differential expression analyses
for RNA-sequencing and microarray studies. Nucleic Acids Res.
43:e472015. View Article : Google Scholar : PubMed/NCBI
|
|
17
|
Law CW, Chen Y, Shi W and Smyth GK: Voom:
Precision weights unlock linear model analysis tools for RNA-seq
read counts. Genome Biol. 15:R292014. View Article : Google Scholar : PubMed/NCBI
|
|
18
|
Zhang B and Horvath S: A general framework
for weighted gene co-expression network analysis. Stat Appl Genet
Mol Biol. 4:172005. View Article : Google Scholar
|
|
19
|
Yip AM and Horvath S: Gene network
interconnectedness and the generalized topological overlap measure.
BMC Bioinformatics. 8:222007. View Article : Google Scholar : PubMed/NCBI
|
|
20
|
Langfelder P, Zhang B and Horvath S:
Defining clusters from a hierarchical cluster tree: The dynamic
tree cut package for R. Bioinformatics. 24:719–720. 2008.
View Article : Google Scholar : PubMed/NCBI
|
|
21
|
Langfelder P, Luo R, Oldham MC and Horvath
S: Is my network module preserved and reproducible? PLoS Comput
Biol. 7:e10010572011. View Article : Google Scholar : PubMed/NCBI
|
|
22
|
Tang Z, Li C, Kang B, Gao G, Li C and
Zhang Z: GEPIA: A web server for cancer and normal gene expression
profiling and interactive analyses. Nucleic Acids Res. 45:W98–W102.
2017. View Article : Google Scholar : PubMed/NCBI
|
|
23
|
Livak KJ and Schmittgen TD: Analysis of
relative gene expression data using real-time quantitative PCR and
the 2(-Delta Delta C(T)) method. Methods. 25:402–408. 2001.
View Article : Google Scholar : PubMed/NCBI
|
|
24
|
Therneau TM and Lumley T: Package
‘survival’. Survival analysis Published on CRAN. 2014.
|
|
25
|
Kassambara A, Kosinski M and Biecek P:
Survminer: Drawing survival curves usingggplot2. R package version
0.3 1. 2017.
|
|
26
|
Subramanian A, Kuehn H, Gould J, Tamayo P
and Mesirov JP: GSEA-P: A desktop application for gene set
enrichment analysis. Bioinformatics. 23:3251–3253. 2007. View Article : Google Scholar : PubMed/NCBI
|
|
27
|
Liberzon A, Subramanian A, Pinchback R,
Thorvaldsdóttir H, Tamayo P and Mesirov JP: Molecular signatures
database (MSigDB) 3.0. Bioinformatics. 27:1739–1740. 2011.
View Article : Google Scholar : PubMed/NCBI
|
|
28
|
Benjamini Y and Hochberg Y: Controlling
the false discovery rate: A practical and powerful approach to
multiple testing. J R Stat Soc: Series B (Methodological).
57:289–300. 1995.
|
|
29
|
Guinney J, Dienstmann R, Wang X, de
Reyniès A, Schlicker A, Soneson C, Marisa L, Roepman P, Nyamundanda
G, Angelino P, et al: The consensus molecular subtypes of
colorectal cancer. Nat Med. 21:1350–1356. 2015. View Article : Google Scholar : PubMed/NCBI
|
|
30
|
Boland CR and Goel A: Microsatellite
instability in colorectal cancer. Gastroenterology.
138:2073–2087.e3. 2010. View Article : Google Scholar : PubMed/NCBI
|
|
31
|
Toyota M, Ahuja N, Ohe-Toyota M, Herman
JG, Baylin SB and Issa JP: CpG island methylator phenotype in
colorectal cancer. Proc Natl Acad Sci USA. 96:8681–8686. 1999.
View Article : Google Scholar : PubMed/NCBI
|
|
32
|
Damas ND, Marcatti M, Côme C, Christensen
LL, Nielsen MM, Baumgartner R, Gylling HM, Maglieri G, Rundsten CF,
Seemann SE, et al: SNHG5 promotes colorectal cancer cell survival
by counteracting STAU1-mediated mRNA destabilization. Nature
Commun. 7:138752016. View Article : Google Scholar
|
|
33
|
Song S, Li D, Yang C, Yan P, Bai Y, Zhang
Y, Hu G, Lin C and Li X: Overexpression of NELFCD promotes
colorectal cancer cells proliferation, migration, and invasion.
Onco Targets Ther. 11:8741–8750. 2018. View Article : Google Scholar : PubMed/NCBI
|
|
34
|
Sillars-Hardebol AH, Carvalho B, Tijssen
M, Beliën JA, de Wit M, Delis-van Diemen PM, Pontén F, van de Wiel
MA, Fijneman RJ and Meijer GA: TPX2 and AURKA promote 20q
amplicon-driven colorectal adenoma to carcinoma progression. Gut.
61:1568–1575. 2012. View Article : Google Scholar : PubMed/NCBI
|
|
35
|
Carvalho B, Postma C, Mongera S, Hopmans
E, Diskin S, van de Wiel MA, van Criekinge W, Thas O, Matthäi A,
Cuesta MA, et al: Multiple putative oncogenes at the chromosome 20q
amplicon contribute to colorectal adenoma to carcinoma progression.
Gut. 58:79–89. 2009. View Article : Google Scholar : PubMed/NCBI
|
|
36
|
Li N, Li D, Du Y, Su C, Yang C, Lin C, Li
X and Hu G: Overexpressed PLAGL2 transcriptionally activates Wnt6
and promotes cancer development in colorectal cancer. Oncol Rep.
41:875–884. 2019.PubMed/NCBI
|
|
37
|
Du Y, Li D, Li N, Su C, Yang C, Lin C,
Chen M, Wu R, Li X and Hu G: POFUT1 promotes colorectal cancer
development through the activation of Notch1 signaling. Cell Death
Dis. 9:9952018. View Article : Google Scholar : PubMed/NCBI
|
|
38
|
Chabanais J, Labrousse F, Chaunavel A,
Germot A and Maftah A: POFUT1 as a promising novel biomarker of
colorectal cancer. Cancers. 10(pii): E4112018. View Article : Google Scholar : PubMed/NCBI
|
|
39
|
Slattery ML, Pellatt DF, Mullany LE, Wolff
RK and Herrick JS: Gene expression in colon cancer: A focus on
tumor site and molecular phenotype. Genes Chromosomes Cancer.
54:527–541. 2015. View Article : Google Scholar : PubMed/NCBI
|
|
40
|
Venook AP: Right-sided vs left-sided
colorectal cancer. Clin Adv Hematol Oncol. 15:22–24.
2017.PubMed/NCBI
|