Introduction
Hepatocellular carcinoma (HCC) is the third-leading
cause of malignant tumor mortality in the world. In China,
approximately 466,100 new diagnoses of HCC and 422,100 deaths
occurred in 2015 (1). Chronic
hepatitis resulting from hepatitis B virus (HBV) or hepatitis C
virus (HCV) infection is a predominant risk factor for HCC
(2). HCC is commonly diagnosed at a
late stage, resulting in extensive tumor invasion and/or distant
metastases and a poor 5-year survival rate (3). Therefore, specific prognostic factors,
which guide the choice of therapeutic strategies, are necessary for
prolonging survival of HCC patients (4). Alpha fetoprotein (AFP) is currently the
most extensively used biological marker for HCC, particularly in
developing countries (5,6). However, AFP has poor reliability. Hence,
the identification of novel diagnostic and prognostic biomarkers
for HCC are urgently required (7).
Transcriptome analyses, using next-generation
sequencing technologies (RNA-Seq), have facilitated the molecular
classification and stratification of HCC tumors in relation to
prognosis (8–10). RNA-Seq offers an integral view of the
transcriptome and is an effective strategy for understanding
complex pathways involved in metastasis and invasion of HCC
(11). Furthermore, large-scale
cancer genome projects, such as The Cancer Genome Atlas (TCGA), can
be used to build comprehensive and multi-dimensional maps,
highlighting key genomic changes in cancer (12,13). A
better comprehension of the regulatory circuits underlying
candidate marker genes is necessary to develop novel therapeutic
strategies.
The aim of the present study was to identify novel
diagnostic and prognostic biomarkers that predict the outcome of
HCC based on analysis of the clinical and RNA-seq data presented in
TCGA database. The differentially expressed genes (DEGs) in HCC
patients with long vs. short-term survival and in normal vs. tumor
tissues were assessed. Then, the critical processes and pathways
related to the progression of HCC were analyzed. Changes in four
genes (GABRR1, SOX11, COL24A1 and MYLK2) that were
correlated with poor outcomes in HCC patients were identified. To
validate these results, the expression levels of these genes were
assessed in tumor tissues and paired normal tissues from HCC
patients. Moreover, the diagnostic properties of these four genes
were described via ROC analysis. The present results demonstrated
that all four genes were associated with poor prognosis, indicating
that this gene signature is a potential novel biomarker that can be
used to guide targeted therapy in HCC patients.
Materials and methods
TCGA database
The clinical, follow-up, and RNA-seq information
from TCGA database are available on the Cancer Genomics Browser of
the University of California Santa Cruz website (https://genome-cancer.ucsc.edu/). The 423
subjects from TCGA enrolled in the present study included 373 HCC
patients and 50 normal control patients (NCs). The data used in
this study are accessible without limitation or restriction.
Patients were divided into high and low expression groups based on
the ROC cutoff values or median survival time: Long-term survivors
(>805 days) and short-term survivors (≤805 days). Detailed
information on the datasets is described in Table I.
 | Table I.Clinicopathological characteristics
of HCC patients in TCGA. |
Table I.
Clinicopathological characteristics
of HCC patients in TCGA.
| Variable | Total (n=332)
(%) | Long OS (n=106)
(%) | Short OS (n=226)
(%) |
|---|
| Sex |
|
|
|
|
Male | 222 (66.87) | 66 (62.26) | 156 (69.03) |
|
Female | 110 (33.13) | 40 (37.74) | 70
(30.97) |
| Age |
|
|
|
| <65
years | 189 (56.92) | 57 (53.77) | 132 (58.41) |
| ≥65
years | 143 (43.07) | 49 (46.23) | 94
(41.59) |
| Tumor stage |
|
|
|
| T1 | 172 (51.81) | 61 (57.55) | 111 (49.12) |
| T2 | 85
(25.60) | 25 (23.58) | 60
(26.55) |
| T3 | 60
(18.07) | 17 (16.04) | 43
(19.03) |
| T4 | 12 (0.03) | 2 (0.02) | 10 (4.42) |
|
Unknown | 3
(0.01) | 1 (0.01) | 2
(0.01) |
| Grade |
|
|
|
| G1 | 45
(13.55) | 16 (15.10) | 30
(13.27) |
| G2 | 160 (48.19) | 50 (47.17) | 110 (48.67) |
| G3 | 110 (33.13) | 34 (32.08) | 76
(33.63) |
| G4 | 12 (0.03) | 3 (0.03) | 9
(0.04) |
|
Unknown | 5
(0.01) | 3 (0.03) | 2
(0.015) |
| Survival
status |
|
|
|
|
Alive | 225 (67.77) | 73 (68.87) | 152 (67.26) |
|
Died | 107 (32.22) | 33 (31.13) | 74
(32.74) |
Patients
The Institutional Review Board of the First
Affiliated Hospital of Zhengzhou University approved the study and
written informed consent was obtained from all patients according
to the Declaration of Helsinki. From October 2013 to June 2014, 53
HCC patients, who underwent surgery at the First Affiliated
Hospital of Zhengzhou University, were enrolled in the study.
Patients with HCC were followed-up until May 2017. Histological
characterization and tumor grading were assessed based on the
current Union for International Cancer Control (UICC) criteria.
Fresh tumor tissue samples (n=53) and paired normal tissues (n=20,
>5 cm from the tumor edge) were obtained from operative
specimens. Tissues were washed twice with PBS and flash frozen in
liquid nitrogen immediately after dissection. Samples were stored
at −80°C until further processing. These patients were divided into
high and low-expression groups according to median values. Table II reveals the clinical
characteristics of patients.
| Table II.Clinical parameters of HCC
patients. |
Table II.
Clinical parameters of HCC
patients.
| Variable | Total (n=53)
(%) | Long OS (n=28)
(%) | Short OS (n=25)
(%) |
|---|
| Sex |
|
|
|
|
Male | 41 (77.35) | 21 (80.77) | 20 (80.00) |
|
Female | 12 (22.64) | 7
(19.23) | 5
(20.00) |
| Age |
|
|
|
| <65
years | 31 (58.49) | 20 (71.43) | 14 (56.00) |
| ≥65
years | 22 (41.51) | 8
(28.57) | 6
(24.00) |
| Tumor stage |
|
|
|
| T1 | 25 (47.17) | 17 (14.29) | 8
(32.00) |
| T2 | 13 (24.53) | 8
(28.57) | 5
(20.00) |
| T3 | 9
(16.98) | 2 (0.71) | 7
(28.00) |
| T4 | 6 (0.11) | 1 (0.36) | 5
(20.00) |
| Grade |
|
|
|
| G1 | 11 (20.75) | 7
(25.00) | 4
(16.00) |
| G2 | 20 (37.74) | 9
(32.14) | 11 (44.00) |
| G3 | 18 (33.96) | 11 (39.29) | 7
(28.00) |
| G4 | 4 (0.08) | 1 (0.36) | 3
(12.00) |
| Survival
status |
|
|
|
|
Alive | 24 (45.28) | 24 (85.71) | 0 (0.00) |
|
Died | 29 (53.70) | 4
(14.29) | 25
(100.00) |
Quantitative real time-PCR
Total tissue RNA was isolated from frozen tissue
samples using TRIzol reagent (Invitrogen; Thermo Fosher Scientific,
Inc.). Quality and concentration of RNA were assessed using a
NanoDrop 2000 spectrophotometer (Thermo Fisher Scientific, Inc.).
Total tissue RNA was reverse-transcribed using the Primescript RT
reagent Kit (Takara Biotechnology Co., Ltd.). Amplification was
achieved with a Real-Time PCR System (Agilent Technologies, Inc.)
and the 2(-Delta Delta C(T)) was calculated as was mentioned in a
previous protocol (14). The
thermocycling conditions were as follows: An initial denaturation
step at 95°C for 10 min, followed by 40 cycles of 95°C 5 sec, 60°C
30 sec and 72°C 10 sec. Primers for GAPDH, GABRR1, SOX11,
COL24A1 and MYLK2 are presented in Table III.
| Table III.Primers of differentially expressed
genes. |
Table III.
Primers of differentially expressed
genes.
| Primer | Sense | Antisense |
|---|
| GAPDH |
5′-GGAGCCAAAAGGGTCATCATCTC-3′ |
5′-GAGGGGCCATCCACAGTCTTCT-3′ |
| GABRR1 |
5′-TGGAGAGTTTGGATAGCATCTCA-3′ |
5′-GTCGTGGATGAAGGAGCGT-3′ |
| SOX11 |
5′-AGCAAGAAATGCGGCAAGC-3′ |
5′-ATCCAGAAACACGCACTTGAC-3′ |
| COL24A1 |
5′-AACAAGGCGTGGAAAAGTCTC-3′ |
5′-GCAGTCGCTGGTGATGAGT-3′ |
| MYLK2 |
5′-GACAAGGCACCTAAAGGTCCC-3′ |
5′-TTGGCTGCTAGTTGAGGGTTG-3′ |
Bioinformatics analysis
Distributions in DEGs and biological functions were
determined using OmicsBean (http://www.omicsbean.com:88/), a multi-omics data
analysis tool. The log2 (fold-change) is the log-ratio
of a gene or transcript, when comparing two groups. Genes were
considered differentially expressed when meeting the cut-off
criterion of |fold change| ≥1.2 and P<0.05.
Gene Ontology analysis
To understand the biological processes contributing
to HCC development based on genetic overexpression, we used the
gene ontology method (GO), which classifies genes that share common
biological properties. The Fisher's exact test was used to classify
the GO category, and the false discovery rate (FDR) was calculated
to correct the P-value. P<0.05 and FDR<0.05 were used as a
threshold to select significant GO categories. The enrichment score
reflects the enrichment level per GO category.
Statistical analysis
SPSS 17.0 (SPSS, Inc.) and GraphPad Prism 5.0
software (GraphPad Software, Inc.) were used for general
statistical analyses and results. Data are presented as the mean ±
standard deviation (SD). The association between these four genes
and clinical parameters were analyzed by χ2 test (sex, age, tumor
stage and grade stage and survival status) or Student's t-test
[overall survival, (OS)]. The AUC of ROC curves were utilized to
evaluate the diagnostic efficiency and predictive value of
GABRR1, SOX11, COL24A1 and MYLK2. Overall survival
and relapse-free survival (RFS) were calculated using the
Kaplan-Meier method with the log-rank test and Cox proportional
hazard model applied for comparison. A P-value of <0.05 was
considered to indicate a statistically significant difference.
Results
Patient clinical characteristics
A total of 332 HCC patients with integrated overall
survival (OS) information, clinical parameters, and complete
RNA-seq information were enrolled in the study. As revealed in
Table I, patient age ranged from 17
to 90 years, with a median age of 57, and 222 (66.9%) were male
patients, while 110 (33.1%) were female. The median follow-up time
was 805 days and 107 patients died in the follow-up period.
Patients with HCC were divided into long-term (>805 days, n=106)
and short-term (≤805 days, n=226) survivors. No significant
differences in clinical covariates were detected. In our sample
database, 53 frozen tumor tissues and 20 paired normal tissues from
HCC patients were analyzed to detect DEGs. The demographic,
clinical, survival status, and tumor pathological features of these
patients are listed in Table II.
Identification of DEGs
Whole-genome expression profiling is widely used to
identify genes and biological processes that contribute to the
development and progression of liver cancer. RNA-seq data from HCC
tissues collected from long-term and short-term survivors were
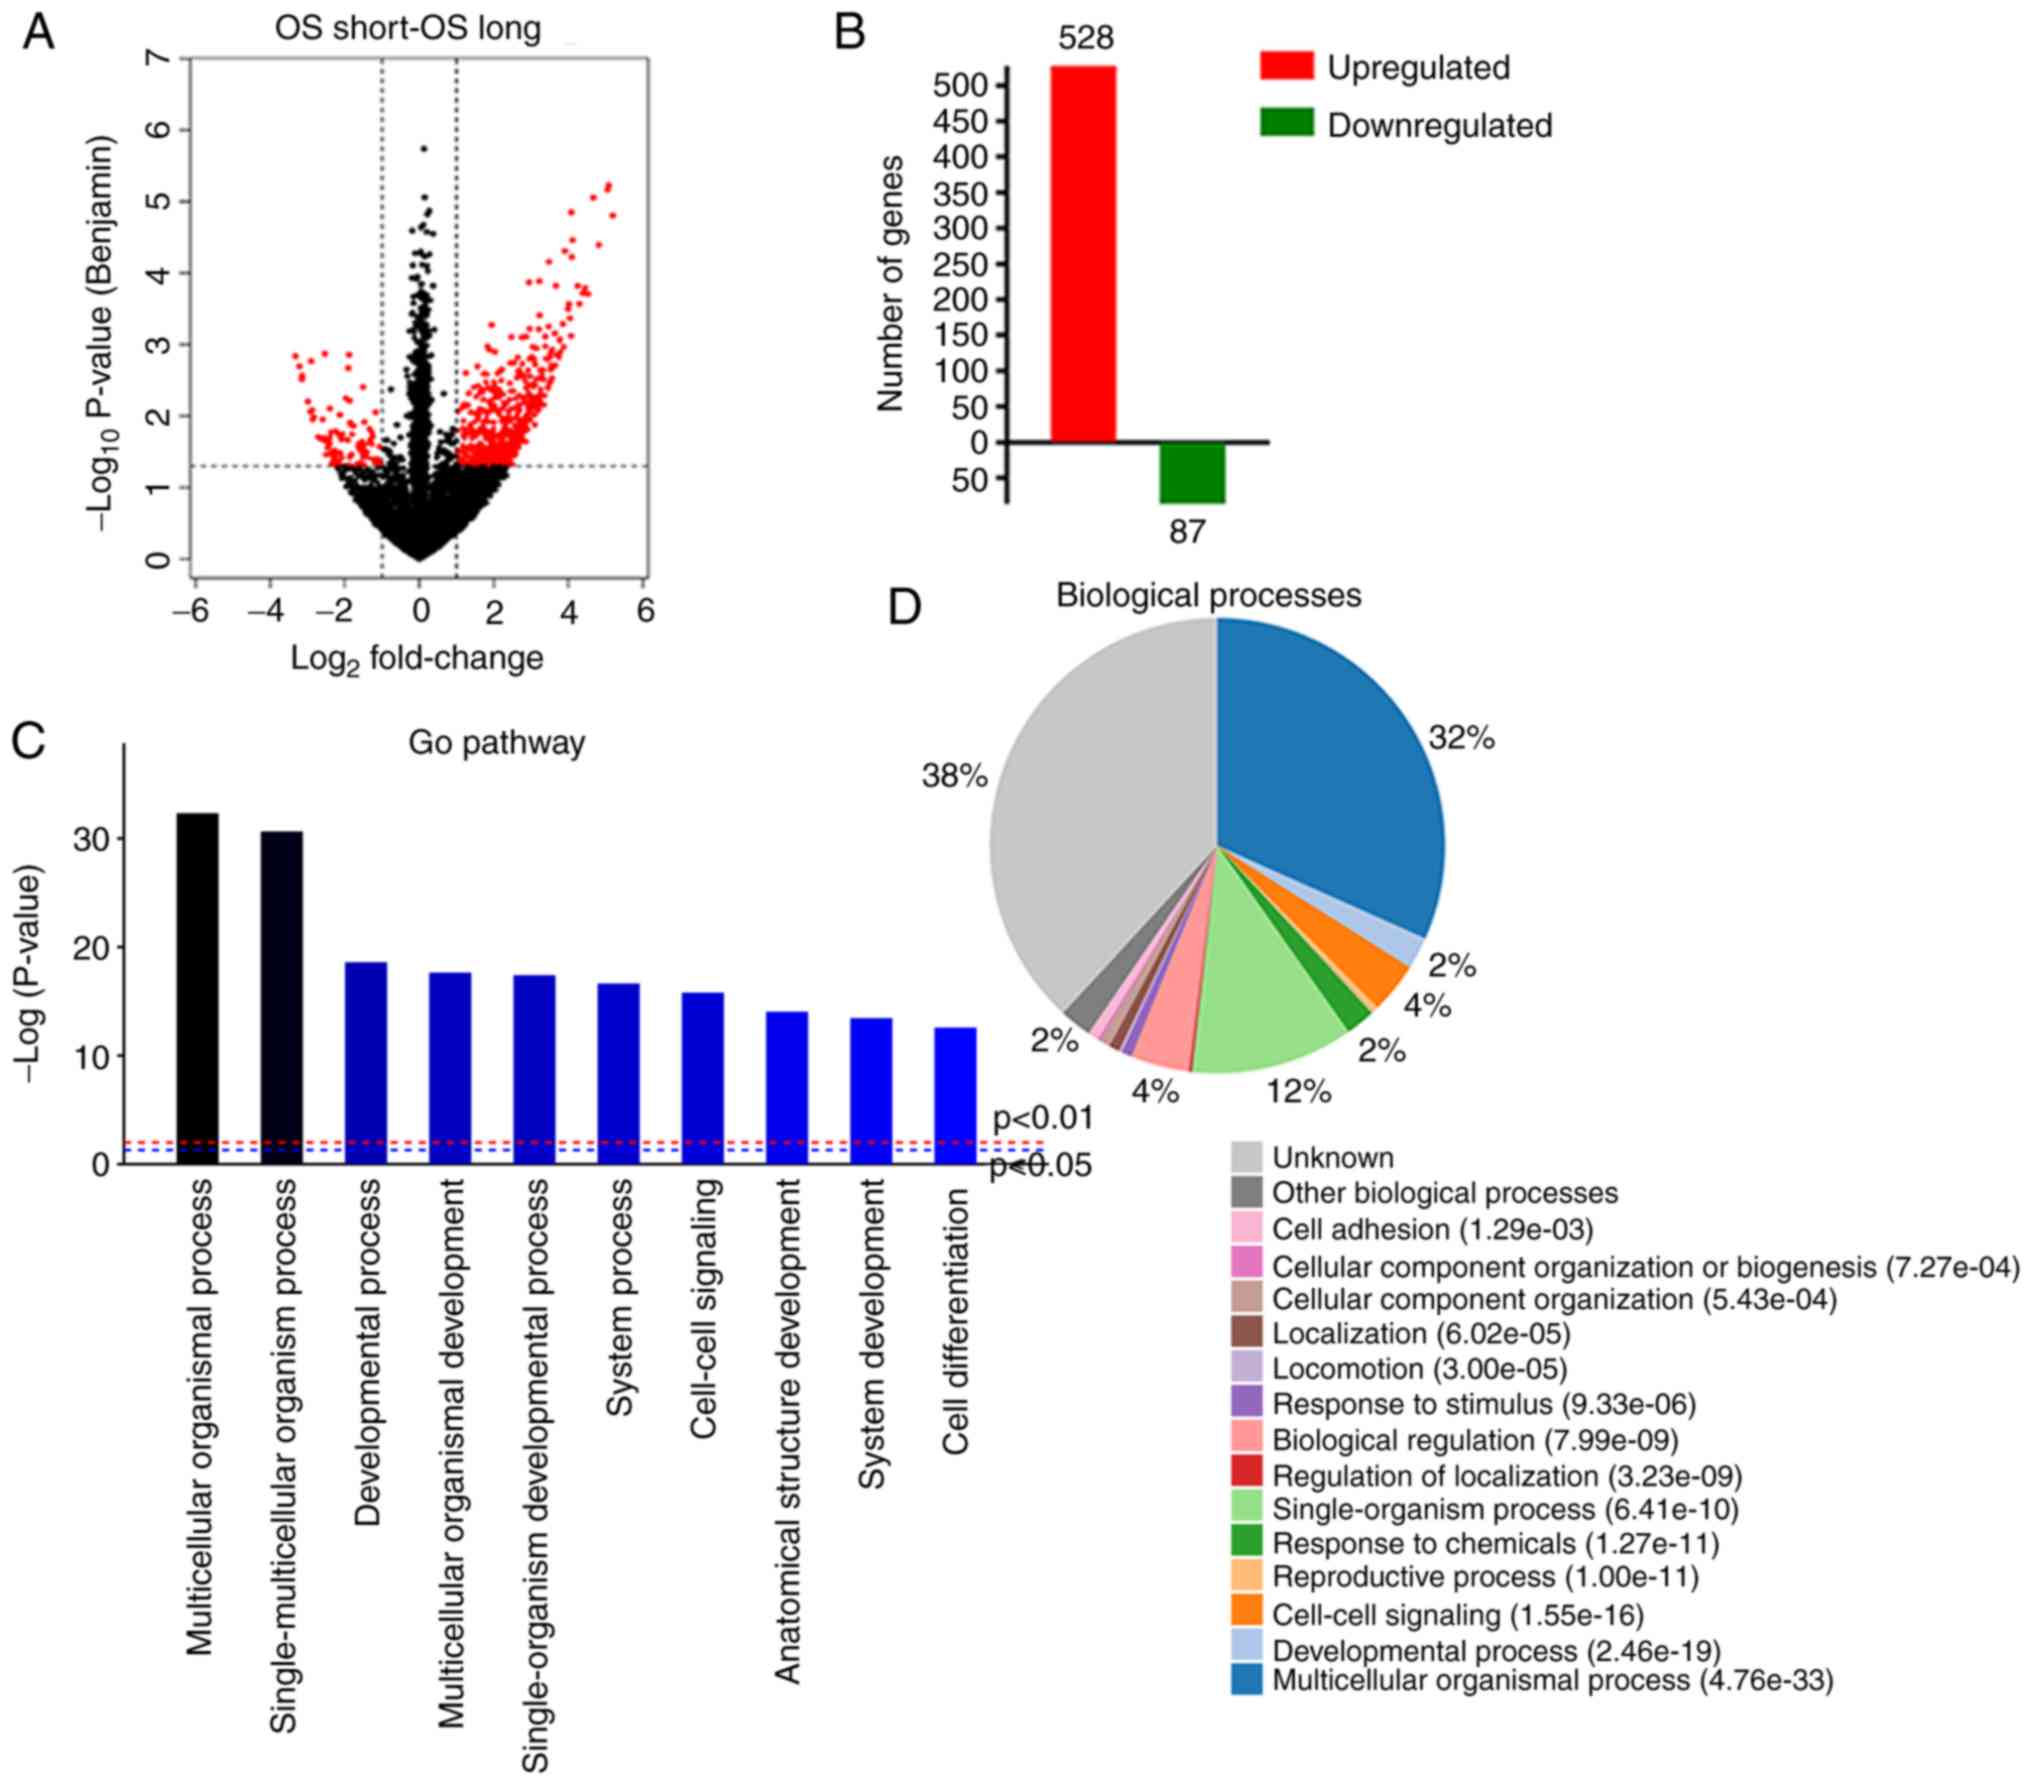
examined to detect differentially expressed genes. As revealed in
Fig. 1A and B, 615 genes (528
upregulated and 87 downregulated genes) were identified as DEGs
between long-term and short-term survivors.
A GO analysis was conducted to identify significant
associations of genes with specific biological processes. Processes
that were significantly enriched based on GO terms included
multicellular organismal process, single-multicellular organism
process, multicellular organismal development, developmental
process, single-organism developmental process, system process,
system development, cell-cell signaling, anatomical structure
development, and response to chemicals. These biological processes
are related to the growth and migration of cancer cells (Fig. 1C and D).
Identification of four genes from the
TCGA database
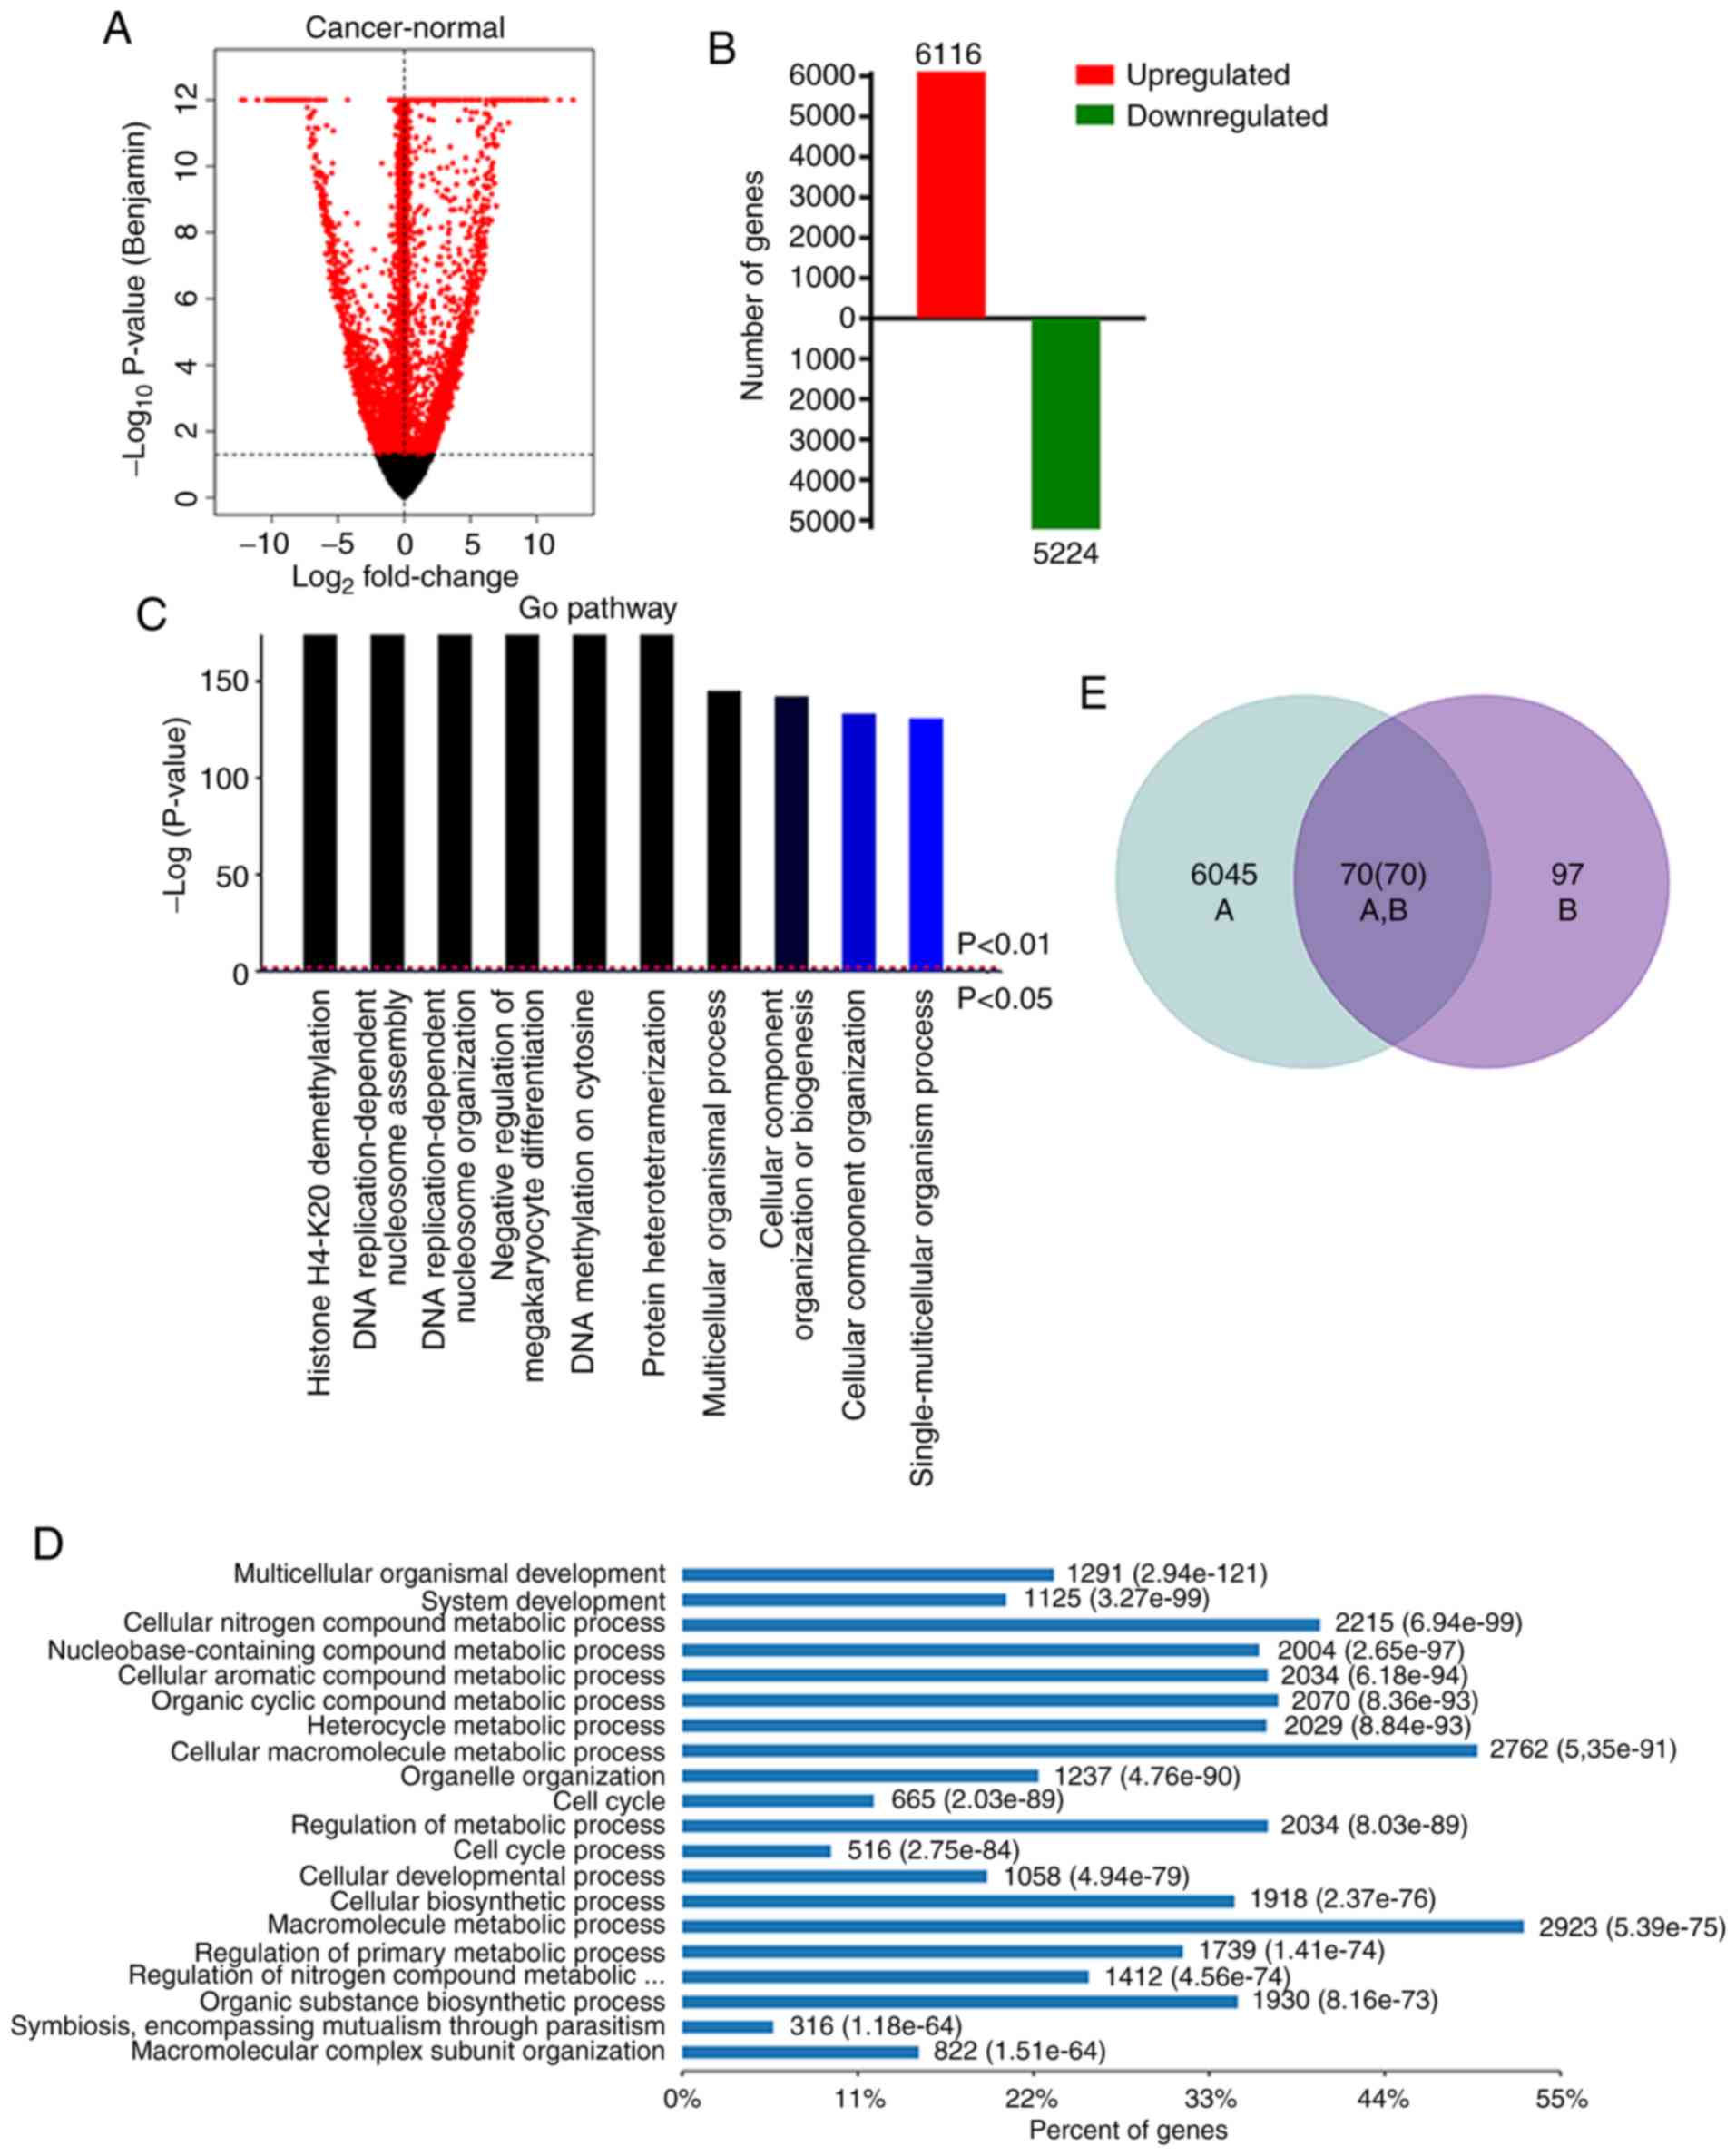
The gene-expression profiles from HCC tumor tissues
and adjacent non-tumor tissues were compared to narrow down
candidate DEGs from TCGA database. Compared to the normal tissues,
it was revealed that 6,116 genes were upregulated and 5,224 genes
were downregulated in tumor tissues. (Fig. 2A and B). GO analysis was performed to
identify biological processes enriched in the upregulated genes.
The most enriched GO biological processes included histone H3-K4
methylation, DNA replication process, and multicellular organismal
process, which are associated with the development and progression
of HCC (Fig. 2C and D). The
intersection of the DEGs revealed 70 DEGs, which may have
prognostic value (Fig. 2E). Four of
these DEGs (GABRR1, SOX11, COL24A1 and MYLK2) were
consistently overexpressed in HCC.
Diagnostic value of DEGs for HCC
patients
The expression levels of these four genes in normal
and tumor tissues were evaluated to calculate the cutoff values
using ROC analyses. The corresponding areas under the ROC curve
(AUCs) were 0.634, 0.722, 0.767 and 0.698 for GABRR1, SOX11,
COL24A1 and MYLK2, respectively (Fig. 3A). Using a cutoff point of 0.143,
GABRR1 had a sensitivity of 35.9%, a specificity of 90.0%, a
positive predictive value (PPV) of 96.4%, and a negative predictive
value (NPV) of 15.8%. The cutoff point of SOX11 was 0.224,
which had a sensitivity of 64.8%, a specificity of 72.0%, a PPV of
94.5%, and an NPV of 21.6%. The optimal diagnostic cutoff for
COL24A1 (sensitivity 56.6%, specificity 86.0%, PPV 96.3%,
and NPV 20.6%) was 1.719 and for MYLK2 (sensitivity 37.0%,
specificity 96.0%, PPV 98.6%, and NPV 17.0%) was 2.027.
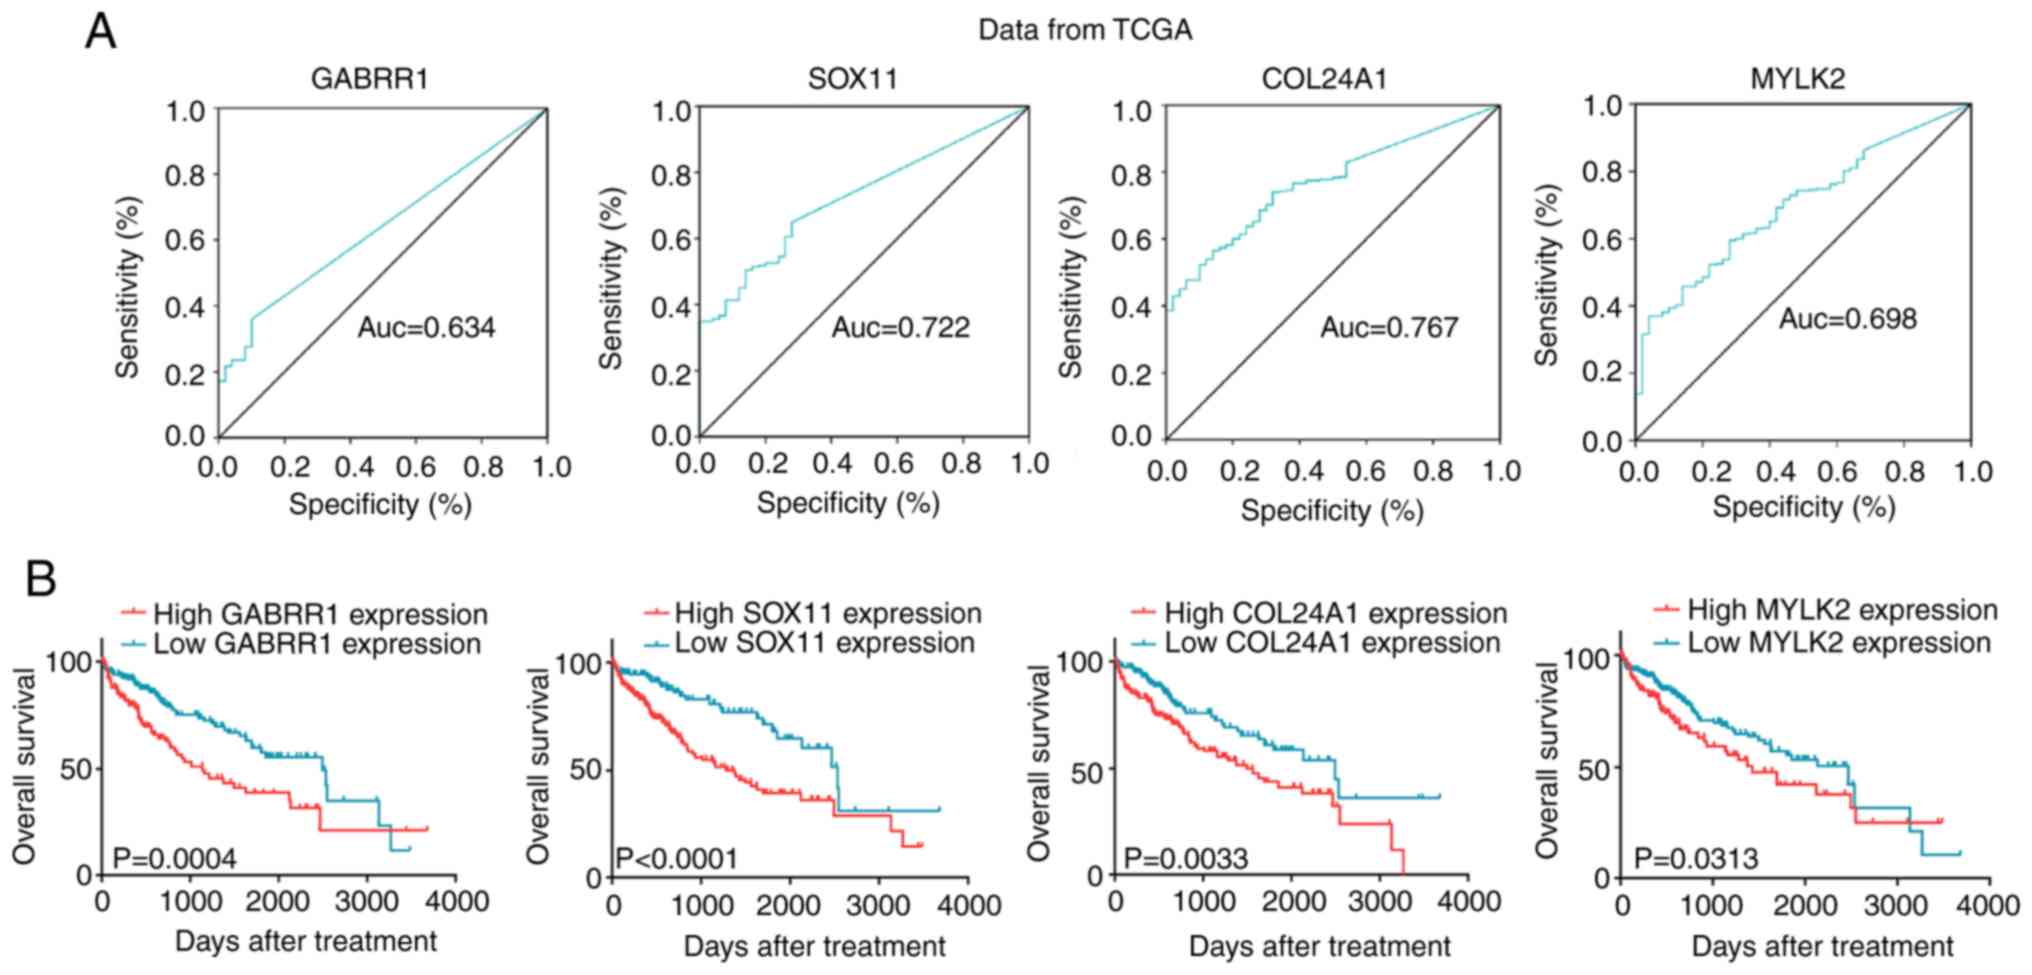 | Figure 3.Diagnostic value of the four genes in
TCGA database. (A) The ROC curves of GABRR1, SOX11, COL24A1
and MYLK2 for HCC patients form TCGA data. (B) Based on the
cutoff value, patients were divided into high and low-mRNA groups.
GABRR1, high expression (n=120) and low expression (n=212).
SOX11, high expression (n=209) and low expression (n=123).
COL24A1, high expression (n=187) and low expression (n=145).
MYLK2, high expression (n=122) and low expression (n=210).
The OS of patients was shorter in the high-mRNA group. TCGA, The
Cancer Genome Atlas; HCC, hepatocellular carcinoma; OS, overall
survival. |
The performance of the four-gene signature in 53 HCC
patients was assessed using ROC analyses. The corresponding AUCs
for GABRR1, SOX11, COL24A1 and MYLK2 were 0.655,
0.751, 0.858 and 0.655, respectively (data not shown). Based on
these cutoff values, the OS of HCC patients with high levels of
GABRR1, SOX11, COL24A1 or MYLK2 was significantly
shorter compared to patients with low levels of these genes
(Fig. 3B). However, the OS was not
significantly different between the high and low cutoff value
groups in the 53 HCC patients (data not shown).
Validation of survival value in
patients with HCC using the four-gene signature
To the best of our knowledge, the association of the
4 genes (GABRR1, SOX11, COL24A1 and MYLK2) with HCC
has not been reported, nor have they been associated with clinical
parameters. Thus, the clinical significance of these four genes was
determined in HCC patients. The selected clinical and pathological
factors were as follows: Sex, age, disease stage, grade stage, and
survival status (Table IV).
GABRR1, SOX11 and MYLK2 were significantly associated
with survival status (P<0.01). In addition, SOX11
and MYLK2 were also associated with tumor stage and grade.
The association between the expression of these genes and patient
survival was assessed by analyzing the prognostic significance of
these genes using a Kaplan-Meier analysis of TCGA datasets. The
four-gene signature classified HCC patients into low-mRNA and
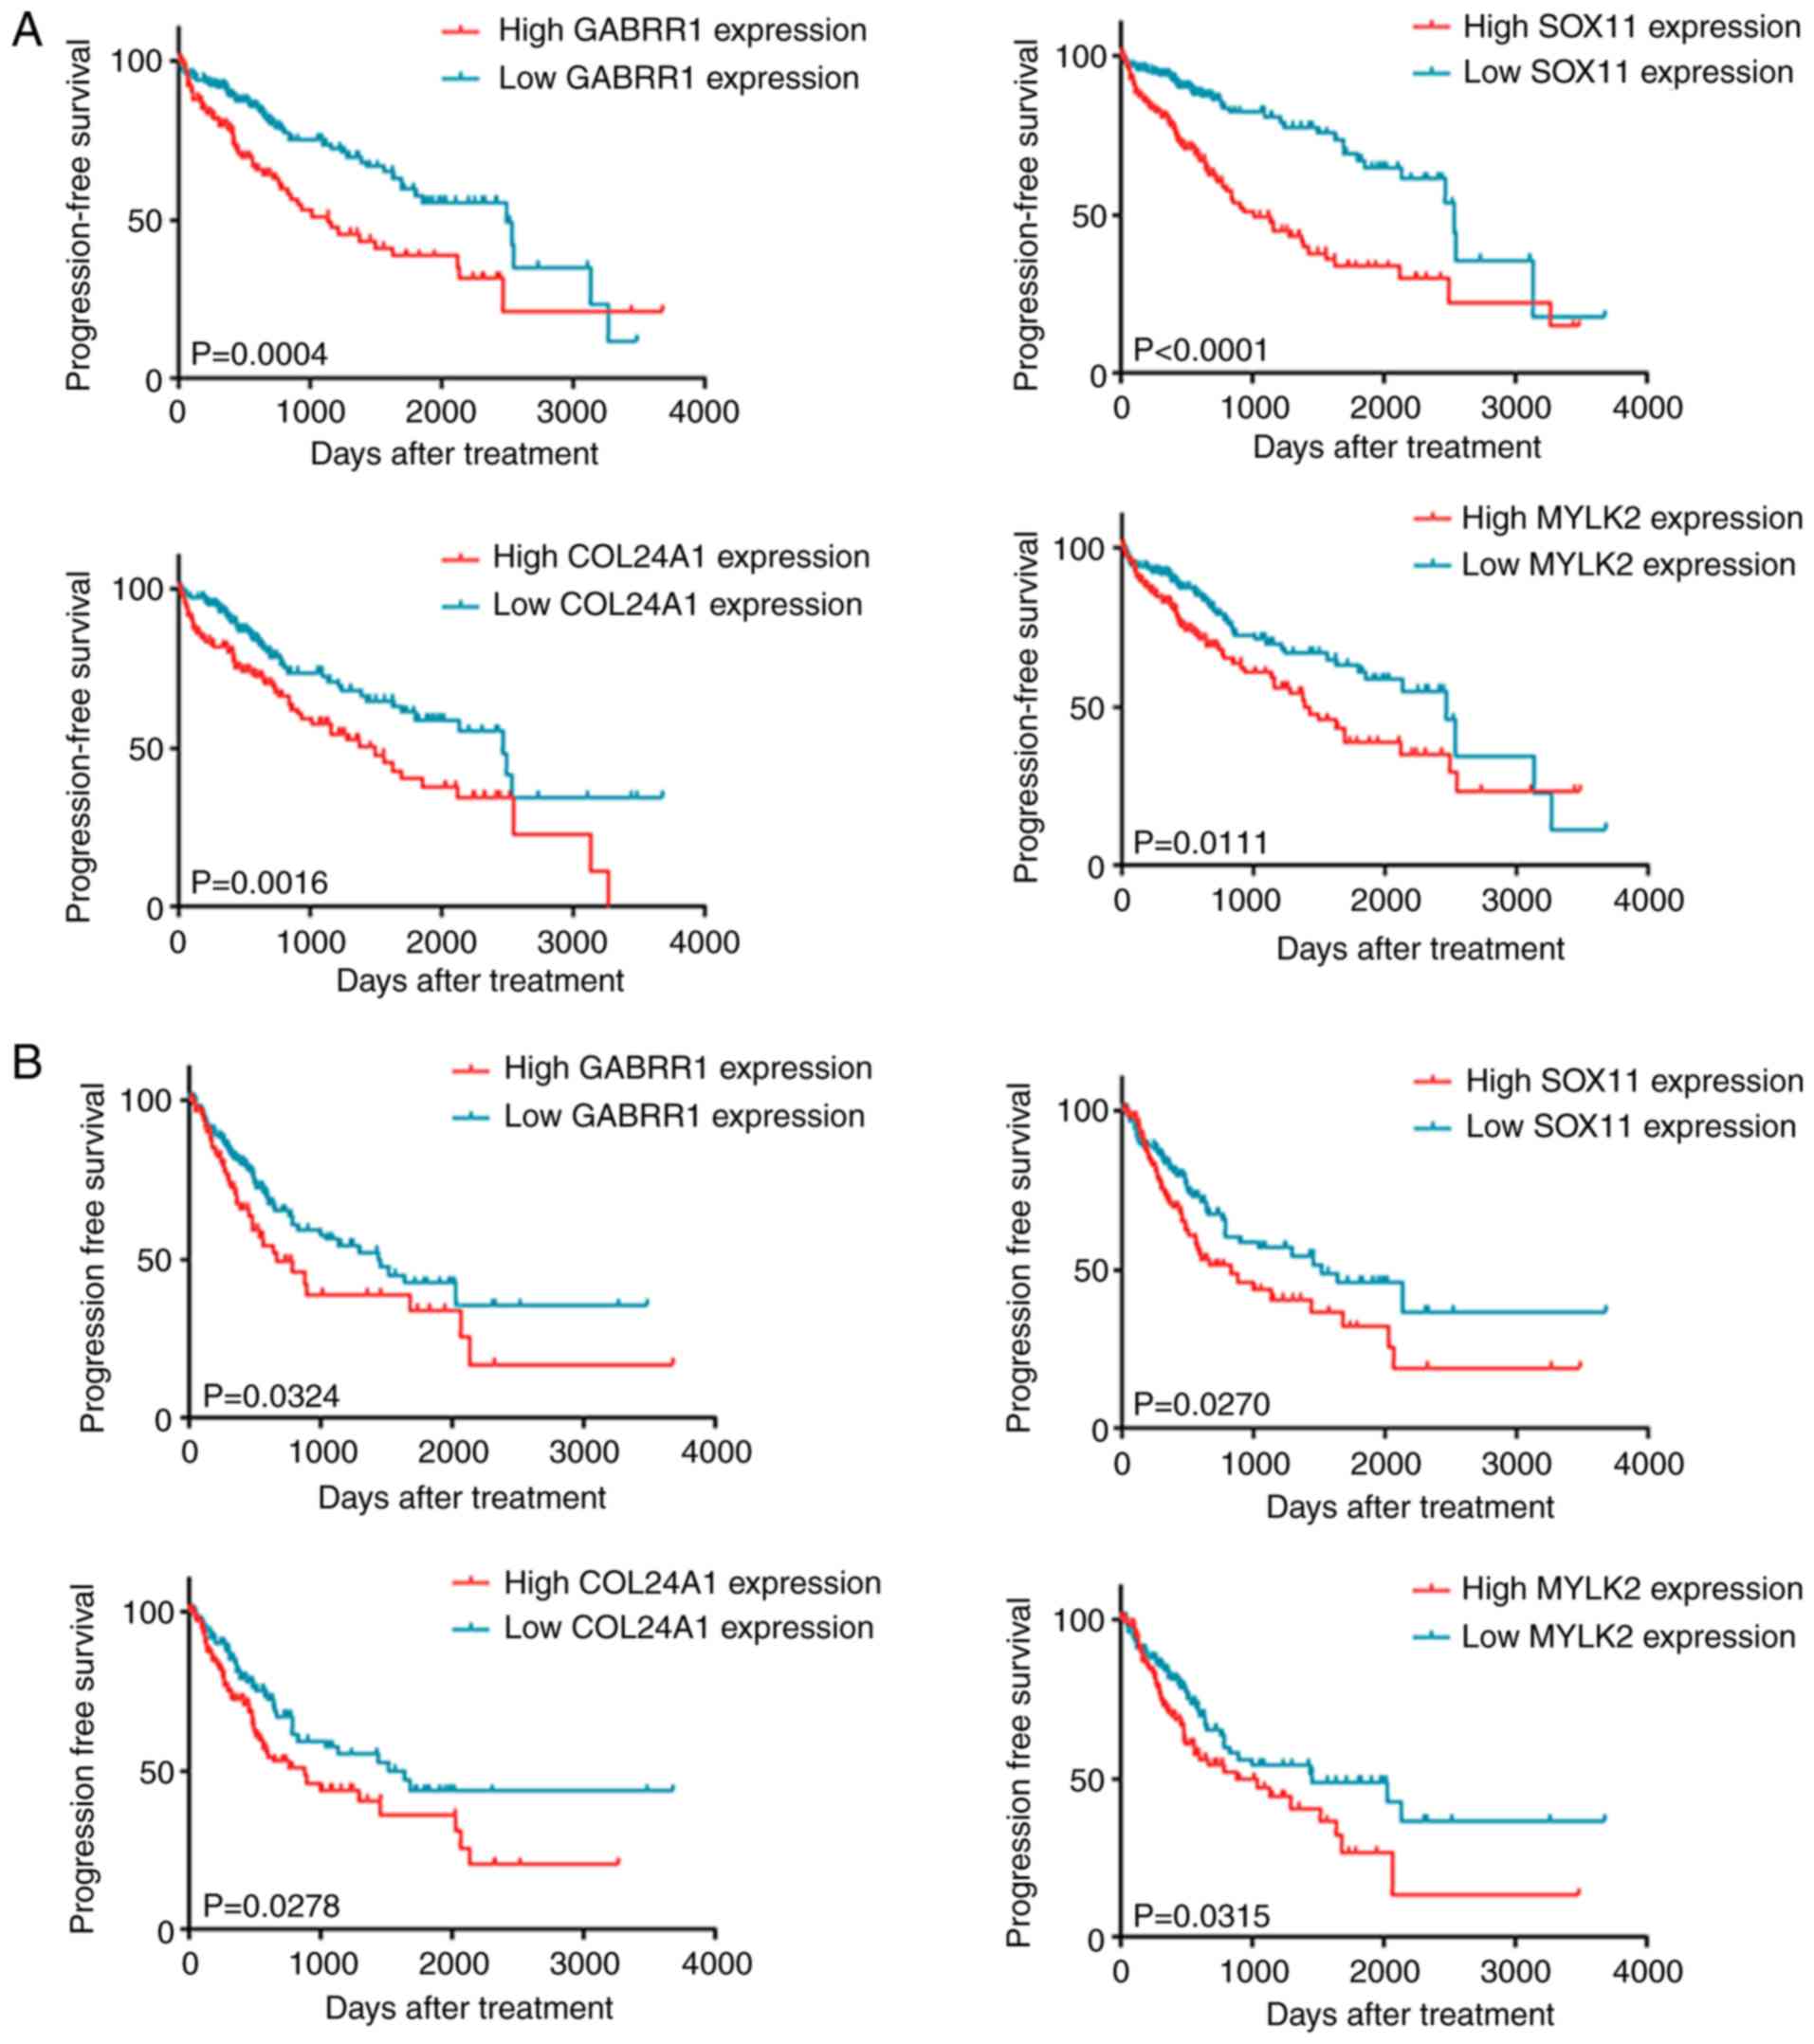
high-mRNA expression groups, which differed in OS and PFS (Table V). As revealed in Fig. 4A, upregulation of GABRR1, SOX11,
COL24A1 and MYLK2 was significantly correlated with
shorter OS and shorter median survival time. This demonstrates that
patients with high levels of these mRNAs had worse clinical
prognosis compared to other HCC patients. Moreover, overexpression
of the four genes was negatively correlated with PFS (Fig. 4B). These results indicated that the
four genes are effective biomarkers for predicting the prognosis of
HCC patients.
| Table IV.Association between GABRR1, SOX11,
COL24A1 and MYLK2 expression and clinicopathological
characteristics of HCC patients in TCGA. |
Table IV.
Association between GABRR1, SOX11,
COL24A1 and MYLK2 expression and clinicopathological
characteristics of HCC patients in TCGA.
|
| GABRR1 | SOX11 | COL24A1 | MYLK2 |
|---|
|
|
|
|
|
|
|---|
| Category | High | Low | P-value | High | Low | P-value | High | Low | P-value | High | Low | P-value |
|---|
| Sexa |
|
| 0.001 |
|
| 0.010 |
|
| 0.816 |
|
| 0.062 |
|
Male | 67 | 155 |
| 100 | 122 |
| 112 | 110 |
| 103 | 119 |
|
|
Female | 53 | 57 |
| 66 | 44 |
| 54 | 56 |
| 63 | 47 |
|
| Agea |
|
| 0.320 |
|
| 0.740 |
|
| 0.580 |
|
| 0.060 |
| <65
years | 64 | 125 |
| 96 | 93 |
| 91 | 96 |
| 103 | 86 |
|
| ≥65
years | 56 | 87 |
| 70 | 73 |
| 75 | 70 |
| 63 | 80 |
|
| Tumor
stagea |
|
| 0.437 |
|
| <0.001 |
|
| 0.088 |
|
| 0.260 |
| 1 | 52 | 110 |
| 61 | 101 |
| 71 | 91 |
| 71 | 91 |
|
| 2 | 29 | 50 |
| 48 | 31 |
| 46 | 33 |
| 42 | 37 |
|
| 3 | 26 | 38 |
| 40 | 24 |
| 31 | 33 |
| 37 | 27 |
|
| 4 | 3 | 2 |
| 4 | 1 |
| 4 | 1 |
| 3 | 2 |
|
| NA | 10 | 12 |
| 13 | 9 |
| 14 | 8 |
| 13 | 9 |
|
| Grade
stagea |
|
| 0.430 |
|
| 0.067 |
|
| 0.521 |
|
| 0.062 |
| 1 | 11 | 34 |
| 19 | 26 |
| 20 | 25 |
| 16 | 29 |
|
| 2 | 58 | 102 |
| 74 | 86 |
| 87 | 73 |
| 77 | 83 |
|
| 3 | 45 | 65 |
| 67 | 43 |
| 50 | 60 |
| 62 | 48 |
|
| 4 | 4 | 8 |
| 4 | 8 |
| 7 | 5 |
| 9 | 3 |
|
| NA | 2 | 3 |
| 2 | 3 |
| 2 | 3 |
| 2 | 3 |
|
| Survive
statea |
|
| <0.001 |
|
| <0.001 |
|
| 0.026 |
|
| 0.046 |
|
Alive | 67 | 158 |
| 95 | 130 |
| 103 | 122 |
| 104 | 121 |
|
|
Dead | 53 | 54 |
| 71 | 36 |
| 63 | 44 |
| 62 | 45 |
|
| Table V.OS, PFS and median day survival of
GABRR1, SOX11, COL24A1 and MYLK2 in TCGA. |
Table V.
OS, PFS and median day survival of
GABRR1, SOX11, COL24A1 and MYLK2 in TCGA.
|
| OS (Days) | PFS (Days) |
|---|
|
|
|
|
|---|
|
| Total | Median
survival | P-value | Total | Median
survival | P-value |
|---|
| GABRR1 High
level | 120 | 1,135 | <0.001 | 91 | 658 | 0.032 |
| GABRR1 Low
level | 212 | 2,486 |
| 173 | 1,432 |
|
| SOX11 High
level | 166 | 1,005 | <0.001 | 132 | 828 | 0.027 |
| SOX11 Low
level | 166 | 2,532 |
| 132 | 1,509 |
|
| COL24A1 High
level | 166 | 1,490 | 0.002 | 139 | 875 | 0.028 |
| COL24A1 Low
level | 166 | 2,456 |
| 125 | 1,509 |
|
| MYLK2 High
level | 166 | 1,386 | 0.011 | 129 | 875 | 0.032 |
| MYLK2 Low
level | 166 | 2,456 |
| 135 | 1,453 |
|
Validation of the four-gene signature
in HCC patients
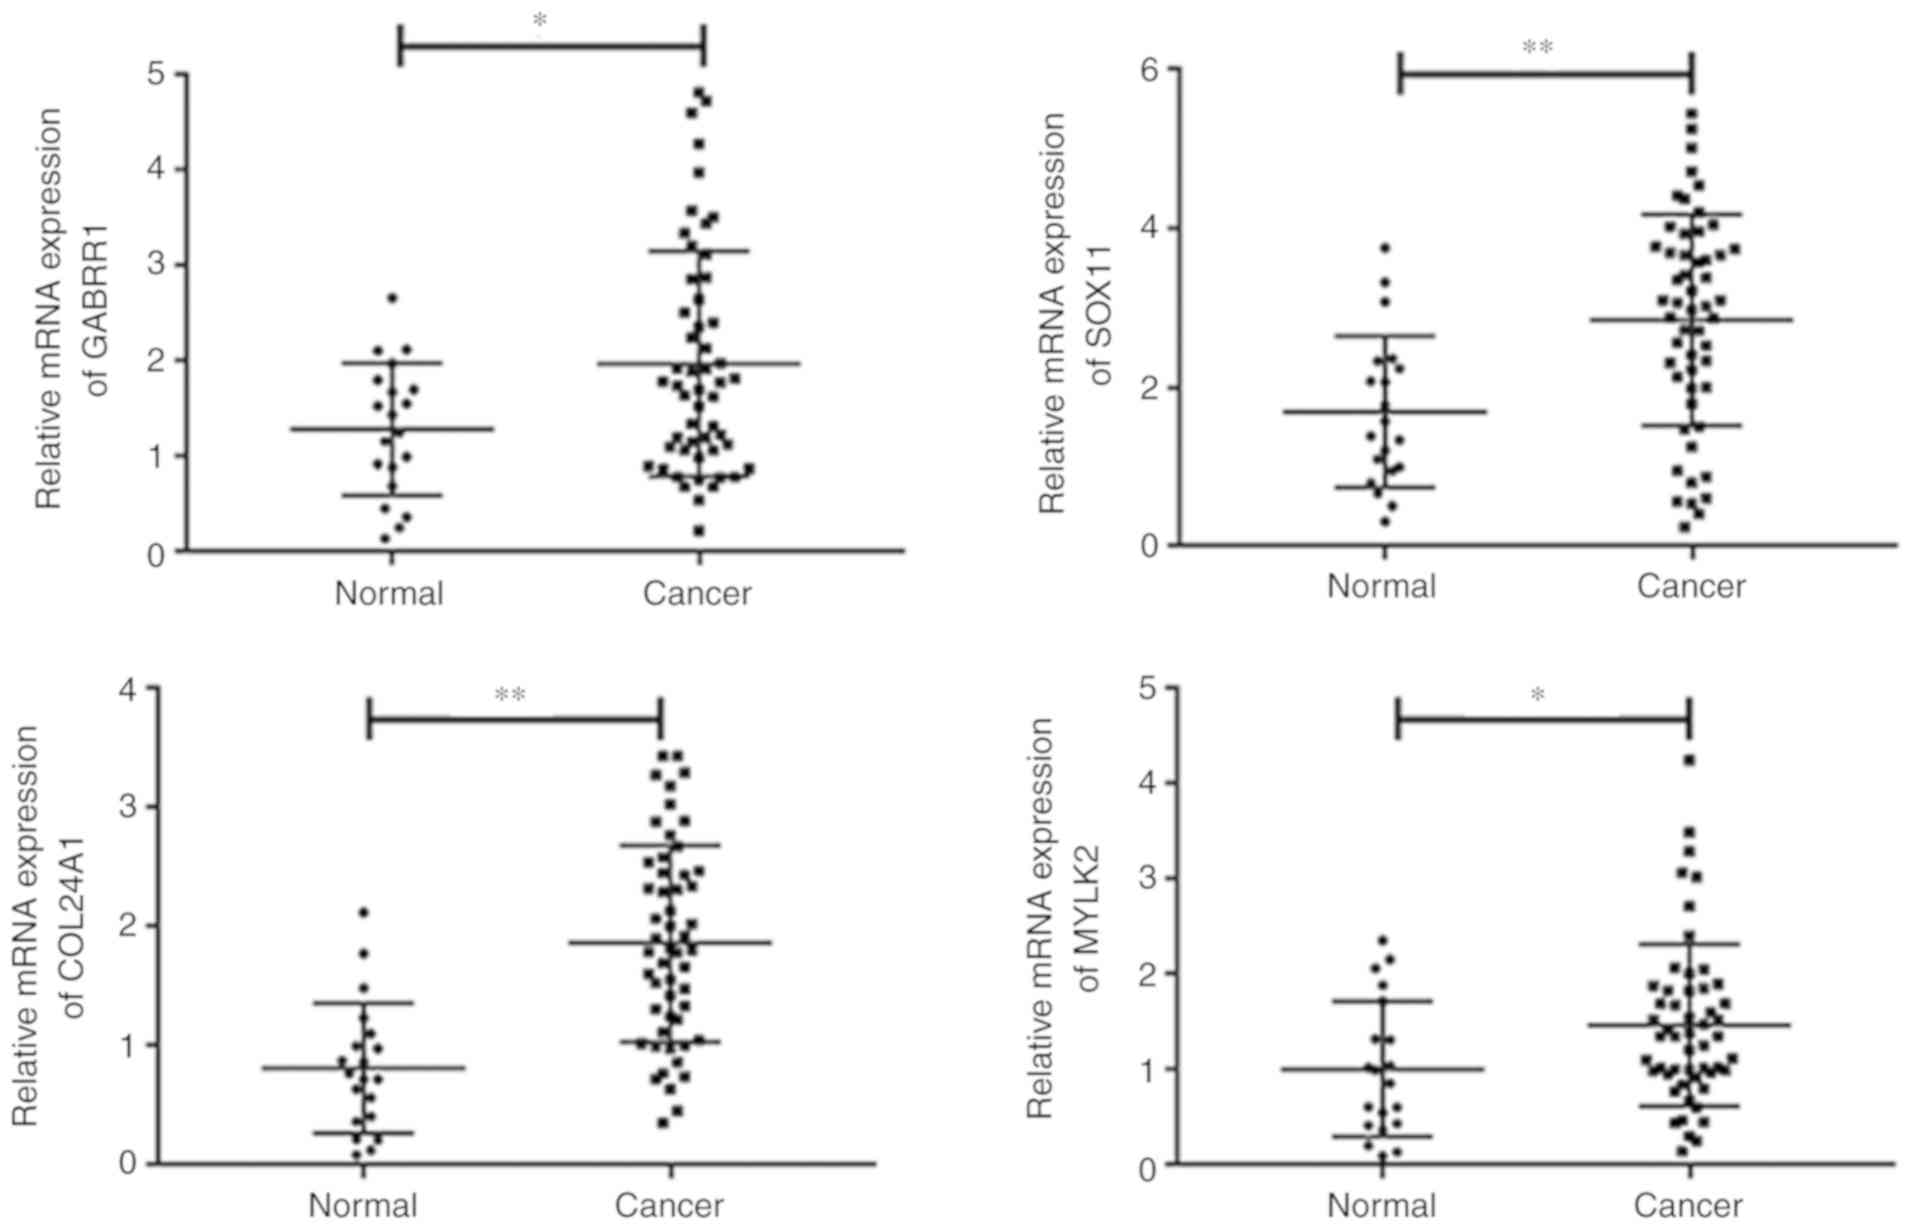
The four prognostic genes We were validated using
the mRNA expression levels measured by qRT-PCR. Expression profiles
were acquired from TCGA. The results revealed that the four genes
were upregulated in tumor tissues compared to non-tumor tissues
(data not shown). The expression of the four genes was also
assessed in tumor and non-tumor samples from HCC patients. The
levels of GABRR1, SOX11, COL24A1 and MYLK2 were
significantly higher in the tumor tissues compared to normal
tissues (Fig. 5). Associations
between the expression of the four genes and clinical parameters
were assessed. GABRR1, SOX11 and COL24A1 expression
levels were associated with OS. Although OS was longer in the low
level MYLK2 group, the difference was not significant. No
associations were detected among target gene expression and patient
age, sex, tumor stage, or grade stage (Table VI). Overall, the results indicated
that GABRR1, SOX11, COL24A1 and MYLK2 may affect the
progression of HCC.
| Table VI.Association between GABRR1, SOX11,
COL24A1 and MYLK2 expression and clinicopathological
characteristics of HCC patients. |
Table VI.
Association between GABRR1, SOX11,
COL24A1 and MYLK2 expression and clinicopathological
characteristics of HCC patients.
|
| GABRR1 | SOX11 | COL24A1 | MYLK2 |
|---|
|
|
|
|
|
|
|---|
| Category | High | Low | P-value | High | Low | P-value | High | Low | P-value | High | Low | P-value |
|---|
| Sexa |
|
| 0.560 |
|
| 0.788 |
|
| 0.788 |
|
| 0.788 |
|
Male | 20 | 21 |
| 21 | 20 |
| 21 | 20 |
| 21 | 20 |
|
|
Female | 7 | 5 |
| 6 | 6 |
| 6 | 6 |
| 6 | 6 |
|
| Agea |
|
| 0.268 |
|
| 0.268 |
|
| 0.743 |
|
| 0.743 |
| <65
years | 17 | 20 |
| 17 | 20 |
| 18 | 19 |
| 18 | 19 |
|
| ≥65
years | 10 | 6 |
| 10 | 6 |
| 9 | 7 |
| 9 | 7 |
|
| Tumor
stagea |
|
| 0.059 |
|
| 0.831 |
|
| 0.322 |
|
| 0.912 |
| T1 | 13 | 12 |
| 12 | 13 |
| 12 | 13 |
| 14 | 11 |
|
| T2 | 3 | 10 |
| 6 | 7 |
| 5 | 8 |
| 6 | 7 |
|
| T3 | 6 | 3 |
| 5 | 4 |
| 7 | 2 |
| 4 | 5 |
|
| T4 | 5 | 1 |
| 4 | 2 |
| 3 | 3 |
| 3 | 3 |
|
| Grade
stagea |
|
| 0.540 |
|
| 0.553 |
|
| 0.568 |
|
| 0.156 |
| G1 | 6 | 5 |
| 6 | 5 |
| 4 | 7 |
| 4 | 7 |
|
| G2 | 11 | 9 |
| 12 | 8 |
| 10 | 10 |
| 14 | 6 |
|
| G3 | 7 | 11 |
| 8 | 10 |
| 10 | 8 |
| 8 | 10 |
|
| G4 | 3 | 1 |
| 1 | 3 |
| 3 | 1 |
| 1 | 3 |
|
| OSb (months) | 26.5 | 40 | 0.020 | 24.0 | 34.5 | 0.002 | 26 | 40 | 0.016 | 32.5 | 40 | 0.080 |
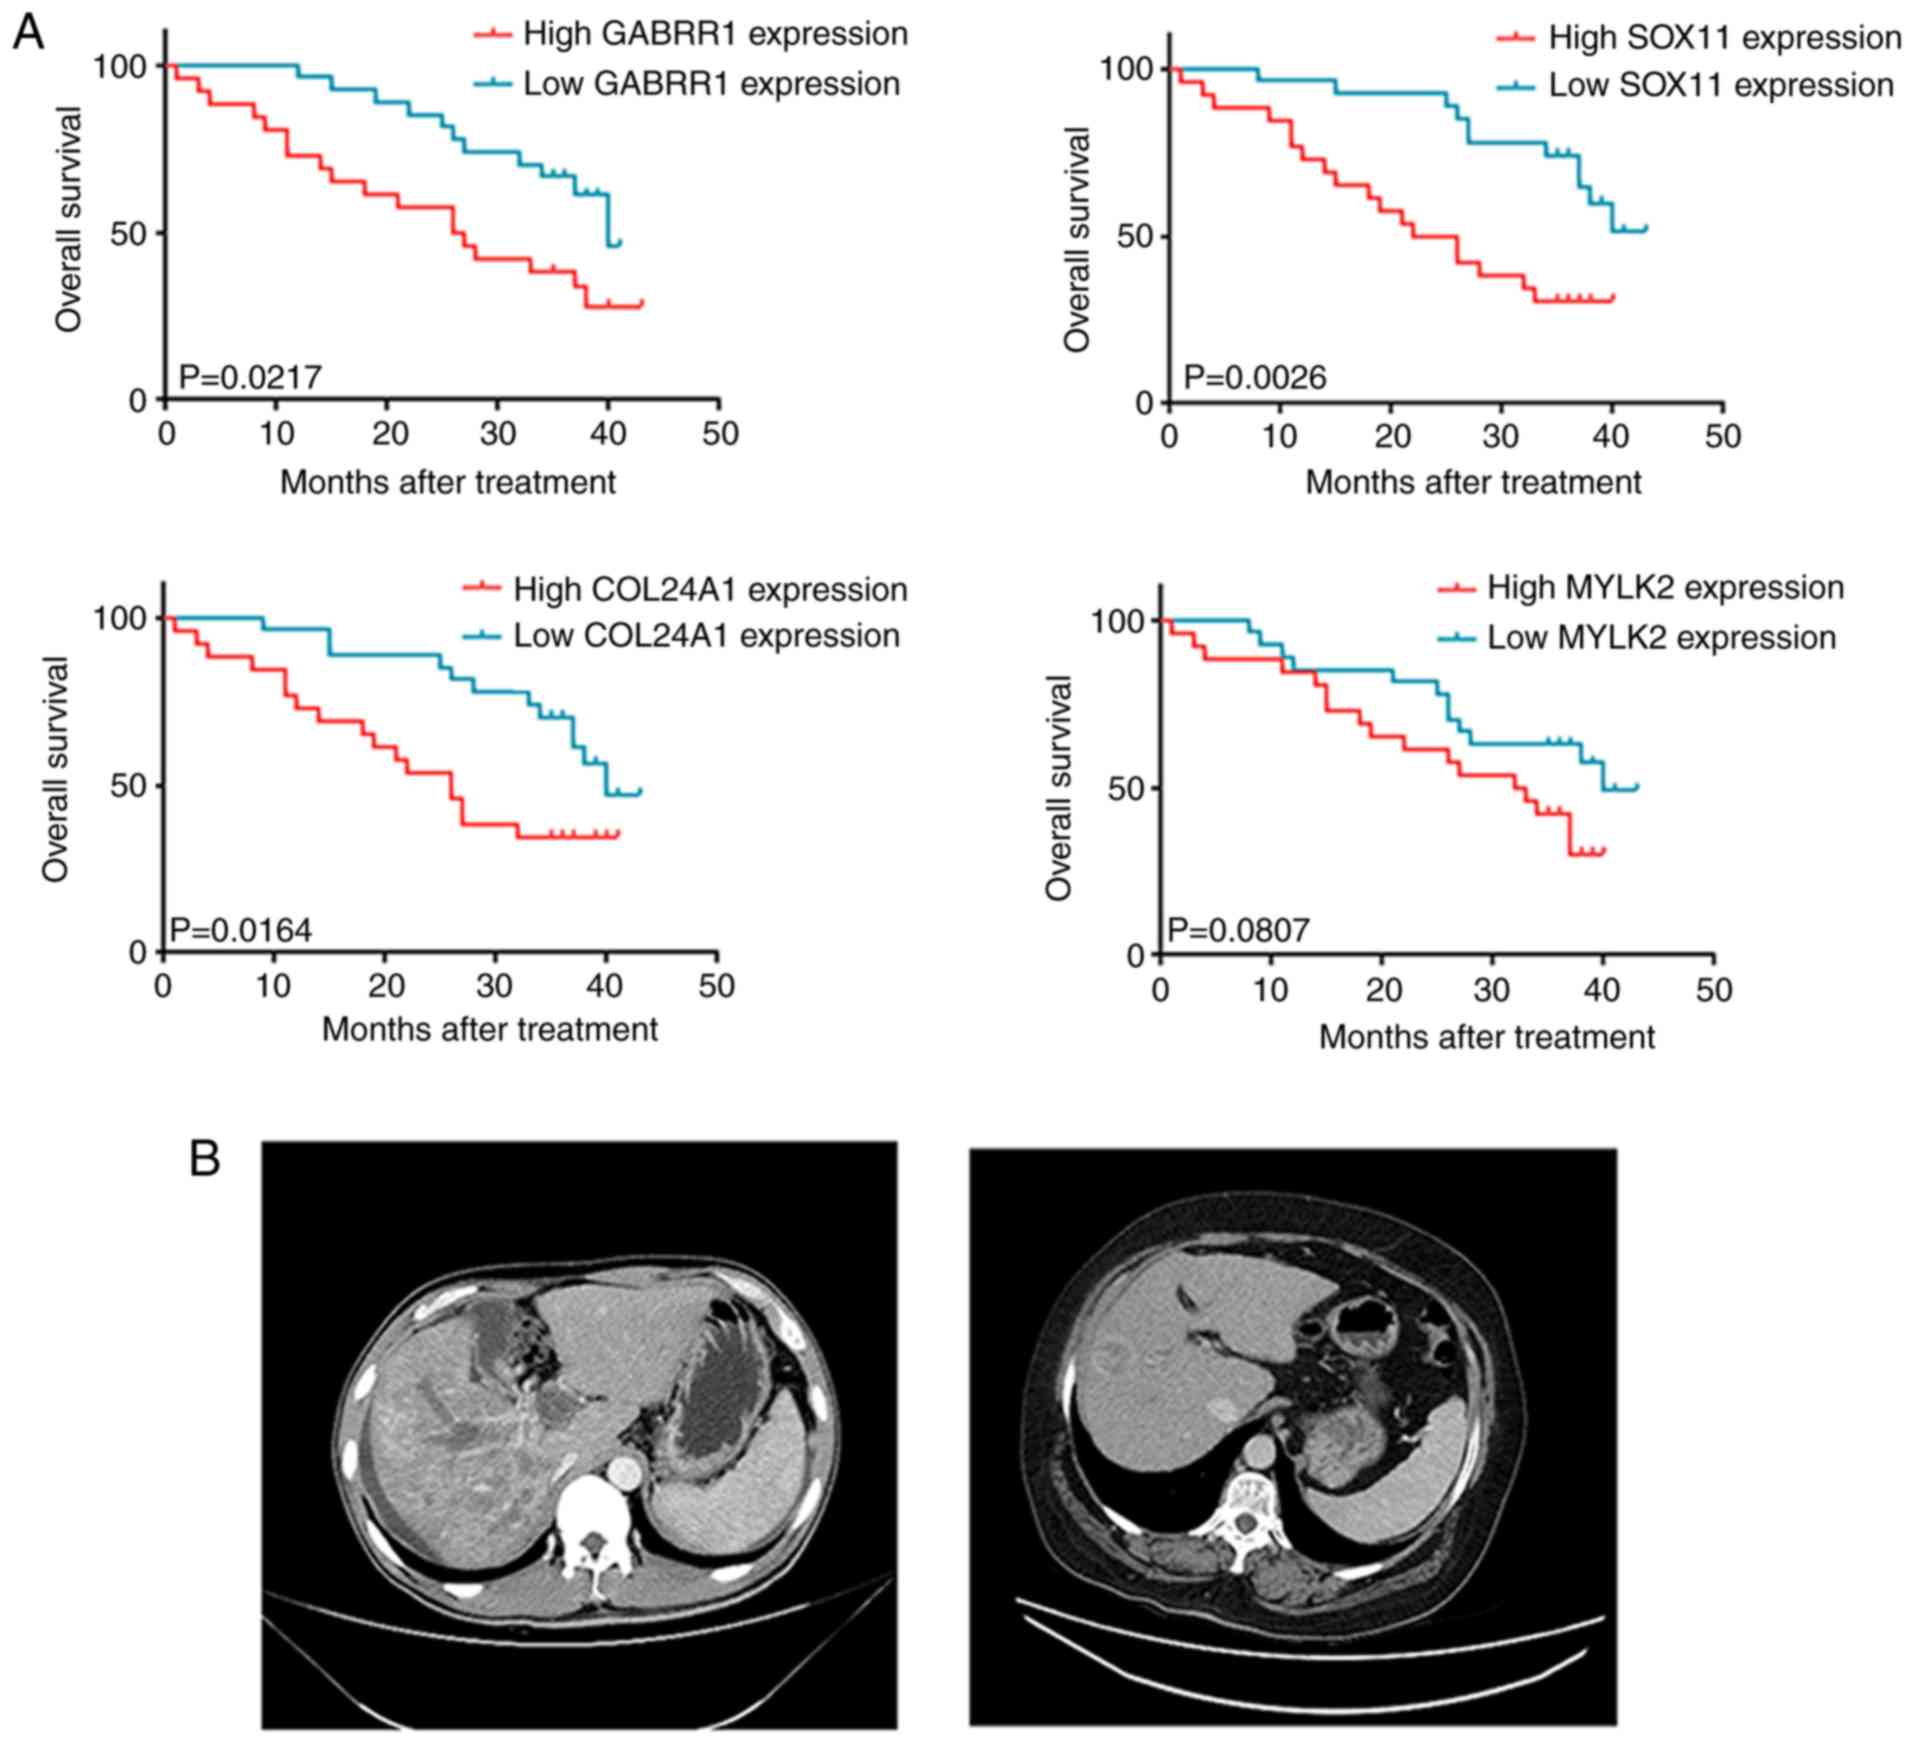
Validation of HCC survival value using
the four genes
To evaluate the association between the expression
of the validated DEGs and patient survival, the prognostic
significance of the genes in the 53 HCC patients was assessed using
Kaplan-Meier analysis. Patients were classified into either
low-mRNA or high-mRNA expression groups, using the expression
levels of the four-gene signature. The present results revealed
that the patients with high mRNA expression in their tumors had a
worse OS (Fig. 6A). Thus, this
four-gene signature was effective in predicting the survival of HCC
patients. These results revealed the clinical value of testing the
expression of these genes to identify high-risk cases and guide
additional medical interventions.
Next, computed tomography (CT) scans of HCC patients
with or without elevated levels of the four-gene signature were
compared (Fig. 6B). One of the
patients with high gene expression was diagnosed with stage IV HCC
using a CT-guided aspiration biopsy of the liver. Enhanced CT
scanning revealed that this patient had metastases and multiple
lesions on the liver. Moreover, the patient received four cycles of
gemcitabine plus nedaplatin chemotherapy, which resulted in
progressive disease (PD) and the OS was <4 months. The other
patient, with stage IV HCC, was treated with the same chemotherapy
regimens and had no expression of these four genes. The result of
CT scanning revealed that this patient had fewer lesions on the
liver. Collectively, these results indicated that high expression
of the four-gene signature is indicative of a negative chemotherapy
response.
Discussion
Currently, gene expression datasets have been used
to classify patients according to known prognostic factors
(15–17). However, most studies only focused on
specific genes and few studies have explored DEGs in HCC using a
comprehensive array-based approach (18,19). In
the present study, it was revealed that four genes (GABRR1,
SOX11, COL24A1 and MYLK2) were significantly increased
in HCC tumor samples compared to normal tissues. ROC analysis
demonstrated a relatively high sensitivity and specificity for the
diagnosis of HCC. Moreover, the expression levels of these genes
were negatively correlated with OS and PFS. These data support the
feasibility of utilizing these genes as potential biomarkers for
HCC.
GABRR1 is a member of the rho subunit family
(20). GABRR1, which encodes
for the GABA receptor subunit ρ1, is widely expressed in the brain
and spinal cord. Family-based association analyses indicate that
single nucleotide polymorphisms (SNPs) in GABRR1 are
significantly associated with alcohol (21). GABRR1 gene expression was
revealed to be upregulated in medullary thyroid carcinoma and
contributed to disease progression (22). However, there are very few studies
demonstrating a role of this gene in human cancers. In the present
study, it was demonstrated that the elevated expression of
GABRR1 in tumor tissues of HCC was associated with short OS.
This result warrants investigation of the specific role of
GABRR1 in HCC in our future study.
SOX11, a transcription factor, is a member of
the SRY-related HMG-box family (sex determining region Y-related
HMG-box family) (23,24). SOX11 is extensively expressed during
organogenesis in mouse embryos and is associated with human
developmental and differentiation processes. SOX11 is highly
expressed in human cancers and can promote tumor cell survival,
proliferation, and metastasis in cancer (25). SOX11 was revealed to regulate
growth and invasion in breast cancer. Increased SOX11
expression was also an independent prognostic indicator of poor
survival in breast cancer patients (26,27).
SOX11 expression was correlated with poor outcome in
small-cell lung cancer and large cell neuroendocrine carcinomas
(28). SOX11 expression might slow
cancer progression in a variety of human cancers, including glioma,
mantle cell lymphoma, and prostate cancer (25). However, the function of this gene in
HCC patients is unclear. The present results revealed that
increased SOX11 expression was positively correlated with
poor prognosis in HCC patients, indicating that SOX11 is a
biomarker for HCC.
COL24A1, also referred to as collagen XXIV,
is a relatively uncharacterized fibrillar collagen expressed in the
developing skeleton of the mouse embryo (29). In a murine model, Matsuo et al
revealed that COL24A1 transcripts accrue at ossification
centers of the craniofacial, axial, and appendicular skeleton.
Thus, this gene is likely involved in osteoblast differentiation
and bone formation. The expression of COL24A1 is also
expressed at low levels in non-skeletal tissues, indicating a
potentially broader role in organogenesis (29). Pre-clinical evidence indicated that
the mRNA levels of COL24A1 are associated with tumor size in
squamous cell carcinoma of the head and neck (HNSCC). Moreover,
overexpression of COL24A1 may play a crucial role in HNSCC
progression, suggesting a prognostic value in HNSCC patients
(30). Consistent with that study,
the present results also suggest that COL24A1 mRNA could be a
prognostic predictor of HCC.
MYLK2 encodes for a
calcium/calmodulin-dependent serine/threonine kinase, which is
exclusively expressed in adult skeletal muscle. The highly
restricted distribution of MYLK2 in normal tissues (skeletal and
cardiac muscles) suggests that the functions of this protein may be
related to cell motility (31). This
enzyme is also associated with a variety of disorders, including
cerebral hypoxia and ovarian cancer. Hence, MYLK2 is a potential
therapeutic target in a variety of diseases (30). Extensive studies have demonstrated
that MYLK2 methylation is associated with better OS in
ovarian cancer patients, which may help determine the response to
surgery (32). The present results
revealed that patients with high MYLK2 expression had a
shorter OS. However, no significant differences were detected
between high- and low-MYLK2 expression groups.
Bioinformatic analysis of potential genes and a
subsequent Go analysis are promising approaches for identifying
plausible biomarkers and key events in tumor development and
progression (33,34). Specific biological processes,
including single-multicellular organism and multicellular
organismal processes, which are associated with the development and
migration of cancer were identified. Further molecular biological
experiments are required to validate the regulatory mechanisms of
the four genes.
In summary, four genes that were upregulated in
tumor tissues and were correlated with the progression of HCC were
identified. The diagnostic values of these genes for HCC were
confirmed using ROC analysis. A large proportion of patients with
liver cancer from TCGA were analyzed and the patients that
expressed high levels of GABRR1, SOX11, COL24A1 and
MYLK2 had a poor prognosis. Furthermore, this observation
was validated by comparing the expression of these genes in tumor
and normal tissues from HCC patients. The present data indicated
that these four genes represent a potentially valuable biomarker
for HCC and can be utilized to predict poor prognosis.
Acknowledgements
Not applicable.
Funding
The present study was supported by grants from Henan
Province Health and Family Planning Science and Technology Talents
Overseas Research Project (2018010).
Availability of data and materials
The datasets used during the present study are
available from the corresponding author upon reasonable
request.
Authors' contributions
FW and JG designed the experiments. FW, YoZ and JD
performed the experiments. SY, HG and PL analyzed the data. Yuz, YW
and WZ collected and analyzed the clinical data. FW wrote the paper
and revised the manuscript. All authors read and approved the final
manuscript.
Ethics approval and consent to
participate
The Institutional Review Board of the First
Affiliated Hospital of Zhengzhou University approved the study and
written informed consent was obtained from all patients according
to the Declaration of Helsinki.
Patient consent for publication
Not applicable.
Competing interests
The authors declare that they have no competing
interests.
References
|
1
|
Chen W, Zheng R, Baade PD, Zhang S, Zeng
H, Bray F, Jemal A, Yu XQ and He J: Cancer statistics in China,
2015. CA Cancer J Clin. 66:115–132. 2016. View Article : Google Scholar : PubMed/NCBI
|
|
2
|
Asghar K, Farooq A, Zulfiqar B and Rashid
MU: Indoleamine 2,3-dioxygenase: As a potential prognostic marker
and immunotherapeutic target for hepatocellular carcinoma. World J
Gastroenterol. 23:2286–2293. 2017. View Article : Google Scholar : PubMed/NCBI
|
|
3
|
Ruan H, Wang T, Yang C, Jin G, Gu D, Deng
X, Wang C, Qin W and Jin H: Co-expression of LASS2 and TGF-β1
predicts poor prognosis in hepatocellular carcinoma. Sci Rep.
6:324212016. View Article : Google Scholar : PubMed/NCBI
|
|
4
|
Thomas MB and Zhu AX: Hepatocellular
carcinoma: The need for progress. J Clin Oncol. 23:2892–2899. 2005.
View Article : Google Scholar : PubMed/NCBI
|
|
5
|
Lou J, Zhang L, Lv S, Zhang C and Jiang S:
Biomarkers for hepatocellular carcinoma. Biomark Cancer. 9:1–9.
2017. View Article : Google Scholar : PubMed/NCBI
|
|
6
|
Tateyama M, Yatsuhashi H, Taura N,
Motoyoshi Y, Nagaoka S, Yanagi K, Abiru S, Yano K, Komori A, Migita
K, et al: Alpha-fetoprotein above normal levels as a risk factor
for the development of hepatocellular carcinoma in patients
infected with hepatitis C virus. J Gastroenterol. 46:92–100. 2011.
View Article : Google Scholar : PubMed/NCBI
|
|
7
|
He B, Yin J, Gong S, Gu J, Xiao J, Shi W,
Ding W and He Y: Bioinformatics analysis of key genes and pathways
for hepatocellular carcinoma transformed from cirrhosis. Medicine
(Baltimore). 96:e69382017. View Article : Google Scholar : PubMed/NCBI
|
|
8
|
Wang Z, Gerstein M and Snyder M: RNA-Seq:
A revolutionary tool for transcriptomics. Nat Rev Genet. 10:57–63.
2009. View
Article : Google Scholar : PubMed/NCBI
|
|
9
|
Nagalakshmi U, Waern K and Snyder M:
RNA-Seq: A method for comprehensive transcriptome analysis. Curr
Protoc Mol Biol Chapter. 4:Unit 4.11.1–13. 2010.
|
|
10
|
Zhang C, Peng L, Zhang Y, Liu Z, Li W,
Chen S and Li G: The identification of key genes and pathways in
hepatocellular carcinoma by bioinformatics analysis of
high-throughput data. Med Oncol. 34:1012017. View Article : Google Scholar : PubMed/NCBI
|
|
11
|
Ye ZH, Gao L, Wen DY, He Y, Pang YY and
Chen G: Diagnostic and prognostic roles of IRAK1 in hepatocellular
carcinoma tissues: An analysis of immunohistochemistry and
RNA-sequencing data from the cancer genome atlas. Onco Targets
Ther. 10:1711–1723. 2017. View Article : Google Scholar : PubMed/NCBI
|
|
12
|
He R, Gao L, Ma J, Peng Z, Zhou S, Yang L,
Feng Z, Dang Y and Chen G: The essential role of MTDH in the
progression of HCC: A study with immunohistochemistry, TCGA,
meta-analysis and in vitro investigation. Am J Transl Res.
9:1561–1579. 2017.PubMed/NCBI
|
|
13
|
Peng L, Yuan XQ, Zhang CY, Ye F, Zhou HF,
Li WL, Liu ZY, Zhang YQ, Pan X and Li GC: High TGF-β1 expression
predicts poor disease prognosis in hepatocellular carcinoma
patients. Oncotarget. 8:34387–34397. 2017.PubMed/NCBI
|
|
14
|
Livak KJ and Schmittgen TD: Analysis of
relative gene expression data using real-time quantitative PCR and
the 2(-Delta Delta C(T)) method. Methods. 25:402–408. 2001.
View Article : Google Scholar : PubMed/NCBI
|
|
15
|
Zhang X, Ye ZH, Liang HW, Ren FH, Li P,
Dang YW and Chen G: Down-regulation of miR-146a-5p and its
potential targets in hepatocellular carcinoma validated by a TCGA-
and GEO-based study. FEBS Open Bio. 7:504–521. 2017. View Article : Google Scholar : PubMed/NCBI
|
|
16
|
Li G, Zhong Y, Shen Q, Zhou Y, Deng X, Li
C, Chen J, Zhou Y and He M: NEK2 serves as a prognostic biomarker
for hepatocellular carcinoma. Int J Oncol. 50:405–413. 2017.
View Article : Google Scholar : PubMed/NCBI
|
|
17
|
Ho DW, Kai AK and Ng IO: TCGA
whole-transcriptome sequencing data reveals significantly
dysregulated genes and signaling pathways in hepatocellular
carcinoma. Front Med. 9:322–330. 2015. View Article : Google Scholar : PubMed/NCBI
|
|
18
|
Komatsu H, Iguchi T, Masuda T, Hirata H,
Ueda M, Kidogami S, Ogawa Y, Sato K, Hu Q, Nambara S, et al:
Attenuated RND1 expression confers malignant phenotype and predicts
poor prognosis in hepatocellular carcinoma. Ann Surg Oncol.
24:850–859. 2017. View Article : Google Scholar : PubMed/NCBI
|
|
19
|
Wang J, Zhang SM, Wu JM, Lu ZC, Yang JR,
Wu HS, Chen H, Lin B, Xu RH and Cao TS: Mastermind-like
transcriptional coactivator 1 overexpression predicts poor
prognosis in human with hepatocellular carcinoma. Ann Clin Lab Sci.
46:502–507. 2016.PubMed/NCBI
|
|
20
|
Blednov YA, Benavidez JM, Black M, Leiter
CR, Osterndorff-Kahanek E, Johnson D, Borghese CM, Hanrahan JR,
Johnston GA, Chebib M and Harris RA: GABAA receptors containing ρ1
subunits contribute to in vivo effects of ethanol in mice. PLoS
One. 9:e855252014. View Article : Google Scholar : PubMed/NCBI
|
|
21
|
Xuei X, Flury-Wetherill L, Dick D, Goate
A, Tischfield J, Nurnberger J Jr, Schuckit M, Kramer J, Kuperman S,
Hesselbrock V, et al: GABRR1 and GABRR2, encoding the GABA-A
receptor subunits rho1 and rho2, are associated with alcohol
dependence. Am J Med Genet B Neuropsychiatr Genet. 153B:418–427.
2010. View Article : Google Scholar : PubMed/NCBI
|
|
22
|
Oczko-Wojciechowska M, Włoch J, Wiench M,
Fujarewicz K, Simek K, Gala G, Gubała E, Szpak-Ulczok S and Jarzab
B: Gene expression profile of medullary thyroid
carcinoma-preliminary results. Endokrynol Pol. 57:420–426. 2006.(In
Polish). PubMed/NCBI
|
|
23
|
Xu X, Chang X, Li Z, Wang J, Deng P, Zhu
X, Liu J, Zhang C, Chen S and Dai D: Aberrant SOX11 promoter
methylation is associated with poor prognosis in gastric cancer.
Cell Oncol (Dordr). 38:183–194. 2015. View Article : Google Scholar : PubMed/NCBI
|
|
24
|
Zhang S, Li S and Gao JL: Promoter
methylation status of the tumor suppressor gene SOX11 is associated
with cell growth and invasion in nasopharyngeal carcinoma. Cancer
Cell Int. 13:1092013. View Article : Google Scholar : PubMed/NCBI
|
|
25
|
Yang Z, Jiang S, Lu C, Ji T, Yang W, Li T,
Lv J, Hu W, Yang Y and Jin Z: SOX11: Friend or foe in tumor
prevention and carcinogenesis? Ther Adv Med Oncol.
11:17588359198534492019. View Article : Google Scholar : PubMed/NCBI
|
|
26
|
Shepherd JH, Uray IP, Mazumdar A,
Tsimelzon A, Savage M, Hilsenbeck SG and Brown PH: The SOX11
transcription factor is a critical regulator of basal-like breast
cancer growth, invasion, and basal-like gene expression.
Oncotarget. 7:13106–13121. 2016. View Article : Google Scholar : PubMed/NCBI
|
|
27
|
Makoukji J, Makhoul NJ, Khalil M, El-Sitt
S, Aldin ES, Jabbour M, Boulos F, Gadaleta E, Sangaralingam A,
Chelala C, et al: Gene expression profiling of breast cancer in
Lebanese women. Sci Rep. 6:366392016. View Article : Google Scholar : PubMed/NCBI
|
|
28
|
Walter RF, Mairinger FD, Werner R, Ting S,
Vollbrecht C, Theegarten D, Christoph DC, Zarogoulidis K, Schmid
KW, Zarogoulidis P and Wohlschlaeger J: SOX4, SOX11 and PAX6 mRNA
expression was identified as a (prognostic) marker for the
aggressiveness of neuroendocrine tumors of the lung by using
next-generation expression analysis (NanoString). Future Oncol.
11:1027–1036. 2015. View Article : Google Scholar : PubMed/NCBI
|
|
29
|
Matsuo N, Tanaka S, Yoshioka H, Koch M,
Gordon MK and Ramirez F: Collagen XXIV (Col24a1) gene expression is
a specific marker of osteoblast differentiation and bone formation.
Connect Tissue Res. 49:68–75. 2008. View Article : Google Scholar : PubMed/NCBI
|
|
30
|
Misawa K, Kanazawa T, Imai A, Endo S,
Mochizuki D, Fukushima H, Misawa Y and Mineta H: Prognostic value
of type XXII and XXIV collagen mRNA expression in head and neck
cancer patients. Mol Clin Oncol. 2:285–291. 2014. View Article : Google Scholar : PubMed/NCBI
|
|
31
|
Soung YH, Lee JW, Kim SY, Nam SW, Park WS,
Lee JY, Yoo NJ and Lee SH: Mutational analysis of the kinase domain
of MYLK2 gene in common human cancers. Pathol Res Pract.
202:137–140. 2006. View Article : Google Scholar : PubMed/NCBI
|
|
32
|
Phelps DL, Borley JV, Flower KJ, Dina R,
Darb-Esfahani S, Braicu I, Sehouli J, Fotopoulou C,
Wilhelm-Benartzi CS, Gabra H, et al: Methylation of MYLK3 gene
promoter region: A biomarker to stratify surgical care in ovarian
cancer in a multicentre study. Br J Cancer. 116:1287–1293. 2017.
View Article : Google Scholar : PubMed/NCBI
|
|
33
|
Li L, Lu J, Xue W, Wang L, Zhai Y, Fan Z,
Wu G, Fan F, Li J, Zhang C, et al: Target of obstructive sleep
apnea syndrome merge lung cancer: Based on big data platform.
Oncotarget. 8:21567–21578. 2017.PubMed/NCBI
|
|
34
|
Laenen G, Thorrez L, Börnigen D and Moreau
Y: Finding the targets of a drug by integration of gene expression
data with a protein interaction network. Mol Biosyst. 9:1676–1685.
2013. View Article : Google Scholar : PubMed/NCBI
|