Introduction
Colorectal cancer (CRC) is the third and second most
commonly diagnosed cancer in males and females, respectively,
worldwide (1). The 5-year survival
rate of patients with CRC at the localized stage in the USA between
2008 and 2012 was 90.3%, which was an ~8-fold change compared with
patients with distant metastasis, emphasizing the importance of
early diagnosis and surgical treatment. However, only 59% of
patients with CRC are diagnosed at the localized stage (2). Therefore, investigations that aim to
elucidate the molecular mechanisms underlying CRC are urgently
required in order to improve the rate of early diagnosis.
Transglutaminase 3 (TGM3), reported as an enzyme
that can catalyze the irreversible cross-linking of peptide-bound
glutamine residues either with peptide-bound lysines or with
primary amines, is widely expressed in a number of different types
of tissue, including the small intestine, brain, skin and mucosa
(3). Recently, studies have
revealed that TGM3 plays a significant role in physiology and
pathology. In the skin and mucosa, TGM3 is essential for epidermal
terminal differentiation and the formation of the cornified cell
envelope through cross-linking structural proteins such as
involucrin, loricrin and small proline-rich proteins (4). Furthermore, the downregulation of TGM3
is associated with a variety of different types of human cancer,
such as esophageal carcinoma, laryngeal carcinoma and oral squamous
cell carcinoma (OSCC). In addition, TGM3 expression is different in
node-positive and node-negative primary tumors in patients with
OSCC, which implies that the decreased expression of TGM3 may cause
the metastatic potential of OSCC. It is worth noting that TGM3 is a
candidate tumor suppressor in the carcinogenesis and development of
head and neck cancer (HNC) (5–7).
However, whether there is an association between TGM3 and
colorectal carcinoma remain unclear. In addition, the biological
function and molecular mechanism of TGM3 in colorectal carcinoma
have also not yet been reported.
Epithelial-to-mesenchymal transition (EMT), a
developmental process of cell alteration from an epithelial state
toward a mesenchymal state, modifies the adhesion molecules
expressed by the cell, allowing it to adopt a migratory and
invasive behavior (8). A variety of
studies have demonstrated that EMT plays a critical role in the
initiation of cancer cell metastasis (9). This process involves the loss of the
expression of epithelial cell adhesion molecules such as
E-cadherin, accompanied by the acquisition of mesenchymal
molecules, such as vimentin and N-cadherin. Multiple regulatory
mechanisms are involved in the regulation of EMT, among which
activation of phosphatidylinositol 3-kinase (PI3K)/protein kinase B
(AKT) have been extensively studied (10). However, the association between TGM3
and EMT in CRC has not yet been widely investigated.
The present study aimed to analyze the expression of
TGM3 in CRC and paired adjacent normal tissues. Gain- and
loss-of-function assays were performed in order to further
investigate the biological role of TGM3 in CRC cells both in
vivo and in vitro via knockdown and overexpression of
TGM3. Finally, the potential molecular mechanisms underlying the
effects of TGM3 in the progression of CRC were investigated.
Materials and methods
Patients and tissue samples
All tissues were supplied from the tissue bank of
the First Affiliated Hospital of Nanjing Medical University
(ethical approval no. 2010-SR-091.A1). In total, 100 pairs of
tissue samples were used in the present study, obtained from
patients with CRC between January, 2011 and December, 2013,
including CRC tissues and adjacent noncancerous tissues. The
average age of the patients (male: 68, female: 32) was 58.7 years
(range, 24–81 years), and no patients had received radiotherapy or
chemotherapy prior to surgery. All specimens were stored in liquid
nitrogen within 5 min of excision, and then stored for long-term
conservation at −70°C. The Tumor-Node-Metastasis (TNM) stage was
assigned to each sample according to the National Comprehensive
Cancer Network (https://www.nccn.org/). Informed
consent was obtained from human participants or their family
members.
Cell culture
All cell lines (HCT116, SW480, LoVo, DLD-1, NCM460)
were supplied by the American Type Culture Collection (ATCC). All
cell lines used in this study were authenticated with STR
profiling. Cells were cultured in DMEM mixed with 10% fetal bovine
serum (Winsent, Inc.), and penicillin (100 µg/ml) (Invitrogen;
Thermo Fisher Scientific, Inc.) at 37°C in a humidified incubator
with 5% CO2. MK-2206 2HCl (Selleck) was dissolved in
DMSO at a stock concentration of 10 mM and added to cell cultures
at a final concentration of 10 µM. We found that the final
concentration of DMSO used in our study did not affect cell
survival or protein phosphorylation.
RNA isolation and reverse
transcription-quantitative PCR (RT-qPCR)
RNAs were extracted from tissues and CRC cell lines
using TRIzol® reagent (Invitrogen; Thermo Fisher
Scientific, Inc.) according to the manufacturer's protocol.
PrimeScript RT Master Mix was used to reverse transcribe the
isolated RNAs (Takara Bio Inc.).
A SYBR-Green PCR kit (Roche Diagnostics) was used
alongside SYBR (10 µl), cDNA (2 µl), primers (1.2 µl) and
dH2O (6.8 µl) as the buffer of the RT-qPCR system. The
StepOnePlus Real-time PCR system (Applied Biosystems; Thermo Fisher
Scientific, Inc) was used for the final reaction. The thermocycling
conditions were as follows: Hot-start DNA polymerase activation
(95°C; 10 min); 40 cycles (95°C; 15 sec and 60°C; 1 min); and last
melt curve analysis (95°C; 15 sec, 60°C; 1 min and 95°C; 15
sec).
The primer sequences used were: GAPDH forward,
5′-GGAGCGAGATCCCTCCAAAAT-3′ and reverse,
5′-GGCTGTTGTCATACTTCTCATGG-3′; TGM3 forward,
5′-ATGGCTGCTCTAGGAGTCCAG-3′ and reverse,
5′-GTTTTGGCCTCTCCGCAAGAT-3′.
Immunohistochemistry (IHC)
All tissues were fixed in 4% paraformaldehyde
overnight at 4°C, processed, and sectioned into slices 4-µm thick.
Xylene was used for dewaxing the tissue sections and different
concentrations of alcohol and distilled water were used for
rehydrating, followed by microwave antigen retrieval. Sections were
deparaffinized followed by rehydration steps through a graded
ethanol series and distilled water and treated with 3%
H2O2 in methanol for 30 min to block
endogenous peroxidase activity. Sections were then washed with PBS
three times and immersed in 5% bovine serum albumin (Servicebio)
for 1 h. The slides were incubated with primary antibody (dilution
1:1,000) overnight at 4°C. Negative controls were prepared by
replacing the primary antibody with either serum or antibody
dilution buffer. The slides were incubated the next day with
secondary anti-rabbit antibodies (dilution 1:1,000) at room
temperature for 1 h, alongside the color agent diaminobenzidine.
The nuclei were counterstained with hematoxylin, and different
grades of ethyl alcohol and xylene were using to dehydrate the
sections. After staining, an inverted microscope was used to
observe sections (Nikon Eclipse TI-SR; Nikon Corporation). The
grade of TGM3 included 0 (no staining), 1 (+), 2 (++) and 3 (+++),
according to the staining intensity. The scores represented the
following values of staining intensity: 0, negative; 1, <30; 2,
31–60; and 3, >60%, according to the proportion of TGM3-positive
cells. The total score was equal to the intensity score plus the
positive rate score. Scores ≥4 were considered as TGM3-high level,
and scores <4 were considered as TGM3-low level. The antibodies
used were as follows: Polyclonal rabbit anti-TGM3 primary antibody
was used (cat. no. ab78393; Abcam) and polyclonal anti-rabbit
horseradish peroxidase conjugated secondary antibody was used
(dilution 1:1,000; cat. no. ab6721; Abcam).
Knockdown and overexpression of
TGM3
Short hairpin (sh)RNAs of TGM3 were designed for the
target sequence: Sh1, GCATCTGCCTCTCAATCTTGG; sh2,
GCACAAACCGAATTGGCATGA. The synthesized and purified TGM3 gene
fragment was inserted into a lentivirus vector (PCDH), termed
LV-TGM3. Recombinant lentivirus was generated from 293T cells using
Lipofectamine® 3000 (Invitrogen; Thermo Fisher
Scientific, Inc.), and transfected into CRC cell lines mediated by
polybrene (8 µg/ml, Sigma-Aldrich; Merck KGaA).
Cell viability assay
In order to detect the function of TGM3 in the
proliferation of CRC cells, cells (3×10³ cells/well)
were cultured in 96-well plates with 100 µl of medium/well. To
detect the cell viability, a Cell Counting Kit-8 (CCK-8) was used
(Dojindo Molecular Technologies, Inc.). Briefly, CCK-8 assay
reagent (10 µl) mixed with serum-free medium (90 µl) was added into
each well. The viability was measured every 24 h from 0 to 96 h,
and the absorbance was detected 2 h later using a microplate reader
(450 nm as the test wavelength and 630 nm as the reference
wavelength).
Cell migration and invasion assay
Cell migration and invasion were determined using
Transwell chambers (8-µm pore size; EMD Millipore). In the
migration assay, cells were cultured in the upper chamber with
serum-free medium. In the invasion assay, medium supplemented with
10% FBS was added to the lower chamber. After 48 h, cells that had
migrated or invaded through the membrane were fixed with 4%
methanol, stained with crystal violet (Beyotime) for 15 min. The
chamber was then washed with PBS three times, and a cotton bud was
used to remove cells and medium from the upper chambers. The
migrated and invaded cells in the lower chambers were observed
under a light microscope (NIKON ECLIPSE TI-SR; Nikon Corporation;
magnification, ×200). The cell number was calculated as the mean
value of three visions for each chamber. Triplicate chambers were
counted for each sample.
Cell apoptosis and cell cycle
analysis
Cells were transfected with siRNA or plasmids for 48
h and then collected for analysis.
For the cell apoptosis analysis, all cells were
obtained in flow cytometry tubes and Annexin V-FITC Apoptosis
Detection kit I (BD Biosciences) was used to stain the cells.
For the cell cycle analysis, cells were washed in
PBS, and then 75% ethyl alcohol was used to mix the cells overnight
at 4°C. The next day, all cells were extracted from the separated
ethyl alcohol and stained with propidium iodide (PI) staining
solution (500 µl) for 30 min in the dark at room temperature.
Following staining of the cells, flow cytometry (BD
Biosciences) was used to detect the number of apoptotic cells. A
FACSCalibur flow cytometer alongside CellQuest software (version
3.0; BD Biosciences) and fluorescence-activated cell sorting was
used to analyze the cell cycle.
Plate colony formation assay
In order to elucidate the function that TGM3 has on
the influence of colony formation in CRC cells, cells were cultured
in 6-well plates at a density of 500 cells/well. The cells from
each well were collected and washed with PBS three times after 7
days. The cells were then fixed in 4% ethyl alcohol for 30 sec, and
crystal violet dye was used to stain for 20 min. Finally, each well
was washed again. Colonies were defined as ≥50 cells, and images
were captured using a digital camera (Canon DS126211; Canon) in
order to count and image the colonies.
Western blot analysis
Proteins were extracted from tissues or cultured
cells using RIPA buffer containing phenylmethanesulfonyl fluoride
(Beyotime Institute of Biotechnology). The protein concentration
was then measured using a Bicinchoninic Acid Protein Assay kit
(Beyotime Institute of Biotechnology), which determined the
quantity loaded for the subsequent SDS-PAGE. Equal amounts of
proteins (40 µg) were separated via SDS-PAGE (15%) and transferred
to polyvinylidene fluoride membranes. The membranes were incubated
with 5% bovine serum albumin for >2 h and incubated with
specific primary antibodies at 4°C overnight.
The next day, the membranes were washed with TBST
three times (10 min each) and incubated with secondary antibodies
(anti-rabbit or anti-mouse) at room temperature for 2 h. Equal
amounts of protein loading in each lane were confirmed using GAPDH
antibody. ImageJ software 1.47 (National Institutes of Health,
Bethesda, MD, USA) was used to quantify the integrated density of
the bands.
The primary and secondary antibodies used were as
follows: Anti-TGM3 (dilution 1:1,000; cat. no. Ab27001);
anti-N-cadherin (dilution 1:1,000; cat. no. Ab18203);
anti-E-cadherin (dilution 1:500; cat. no. Ab1416); anti-AKT
(dilution 1:500; cat. no. Ab8805); anti-p-AKT (dilution 1:500; cat.
no. Ab38449); anti-P21 (dilution 1:500; cat. no. Ab38449);
anti-vimentin (dilution 1:2,000; cat. no. Ab92547); anti-rabbit or
anti-mouse (dilution 1:5,000; cat. no. GAB007) (all from Hangzhou
Multi Sciences Biotech Co., Ltd.). Anti-GAPDH (dilution 1:5,000;
Abcam) was used as the loading control throughout.
Subcutaneous xenotransplantation model
and lung metastasis model
All animal experiments were approved by the Animal
Ethics Committee of Nanjing Medical University. Mice were
maintained in 12-h light/dark cycles (lights on at 6:00 a.m.). In
order to detect the function of TGM3 on tumor growth in mice, 20
4-week-old male mice (weight, 13–15 g) were used in the present
study. For subcutaneous xenotransplantation model, the nude mice
(n=10) were anesthetized with isoflurane and injected with shNC and
shTGM3-1 HCT-116 cells (2×10⁶) suspended in PBS (200
µl). After 4 weeks, and mice were sacrificed by carbon dioxide
inhalation (air displacement rate: 20%/min; Yuyan Instruments Co.,
Shanghai, China) and the tumor tissues were surgically removed. For
lung metastasis model, the nude mice (n=10) were anesthetized with
isoflurane and injected with LV-NC and LV-TGM3 LoVo cells
(2×10⁶) suspended in PBS (200 µl) After 5 weeks, and
mice were sacrificed by carbon dioxide inhalation (air displacement
rate: 20%/min; Yuyan Instruments Co.) and the lung tissues were
surgically removed.
Statistical analysis
Data of the in vitro experiments are
presented as the mean ± standard error of the mean from three
independent experiments (n=3), and data of the in vivo
experiments are presented as the mean ± standard deviation (n=10).
P<0.05 was considered to indicate a statistically significant
result. Unpaired t-tests were used to analyze the mRNA expression,
while χ2 tests were used to analyze IHC and the clinical
features. The datasets including multiple groups were compared by
one-way analysis of variance and the post hoc Tukey's test. The
Kaplan-Meier method was used to assess the cumulative survival.
Univariate and multivariate Cox proportional hazard regression
models were used to identify the independent prognostic factors.
Statistical analysis was performed using STATA software (version
9.2; StataCorp LP) and presented with GraphPad Prism 5 (GraphPad
Software, Inc.).
Results
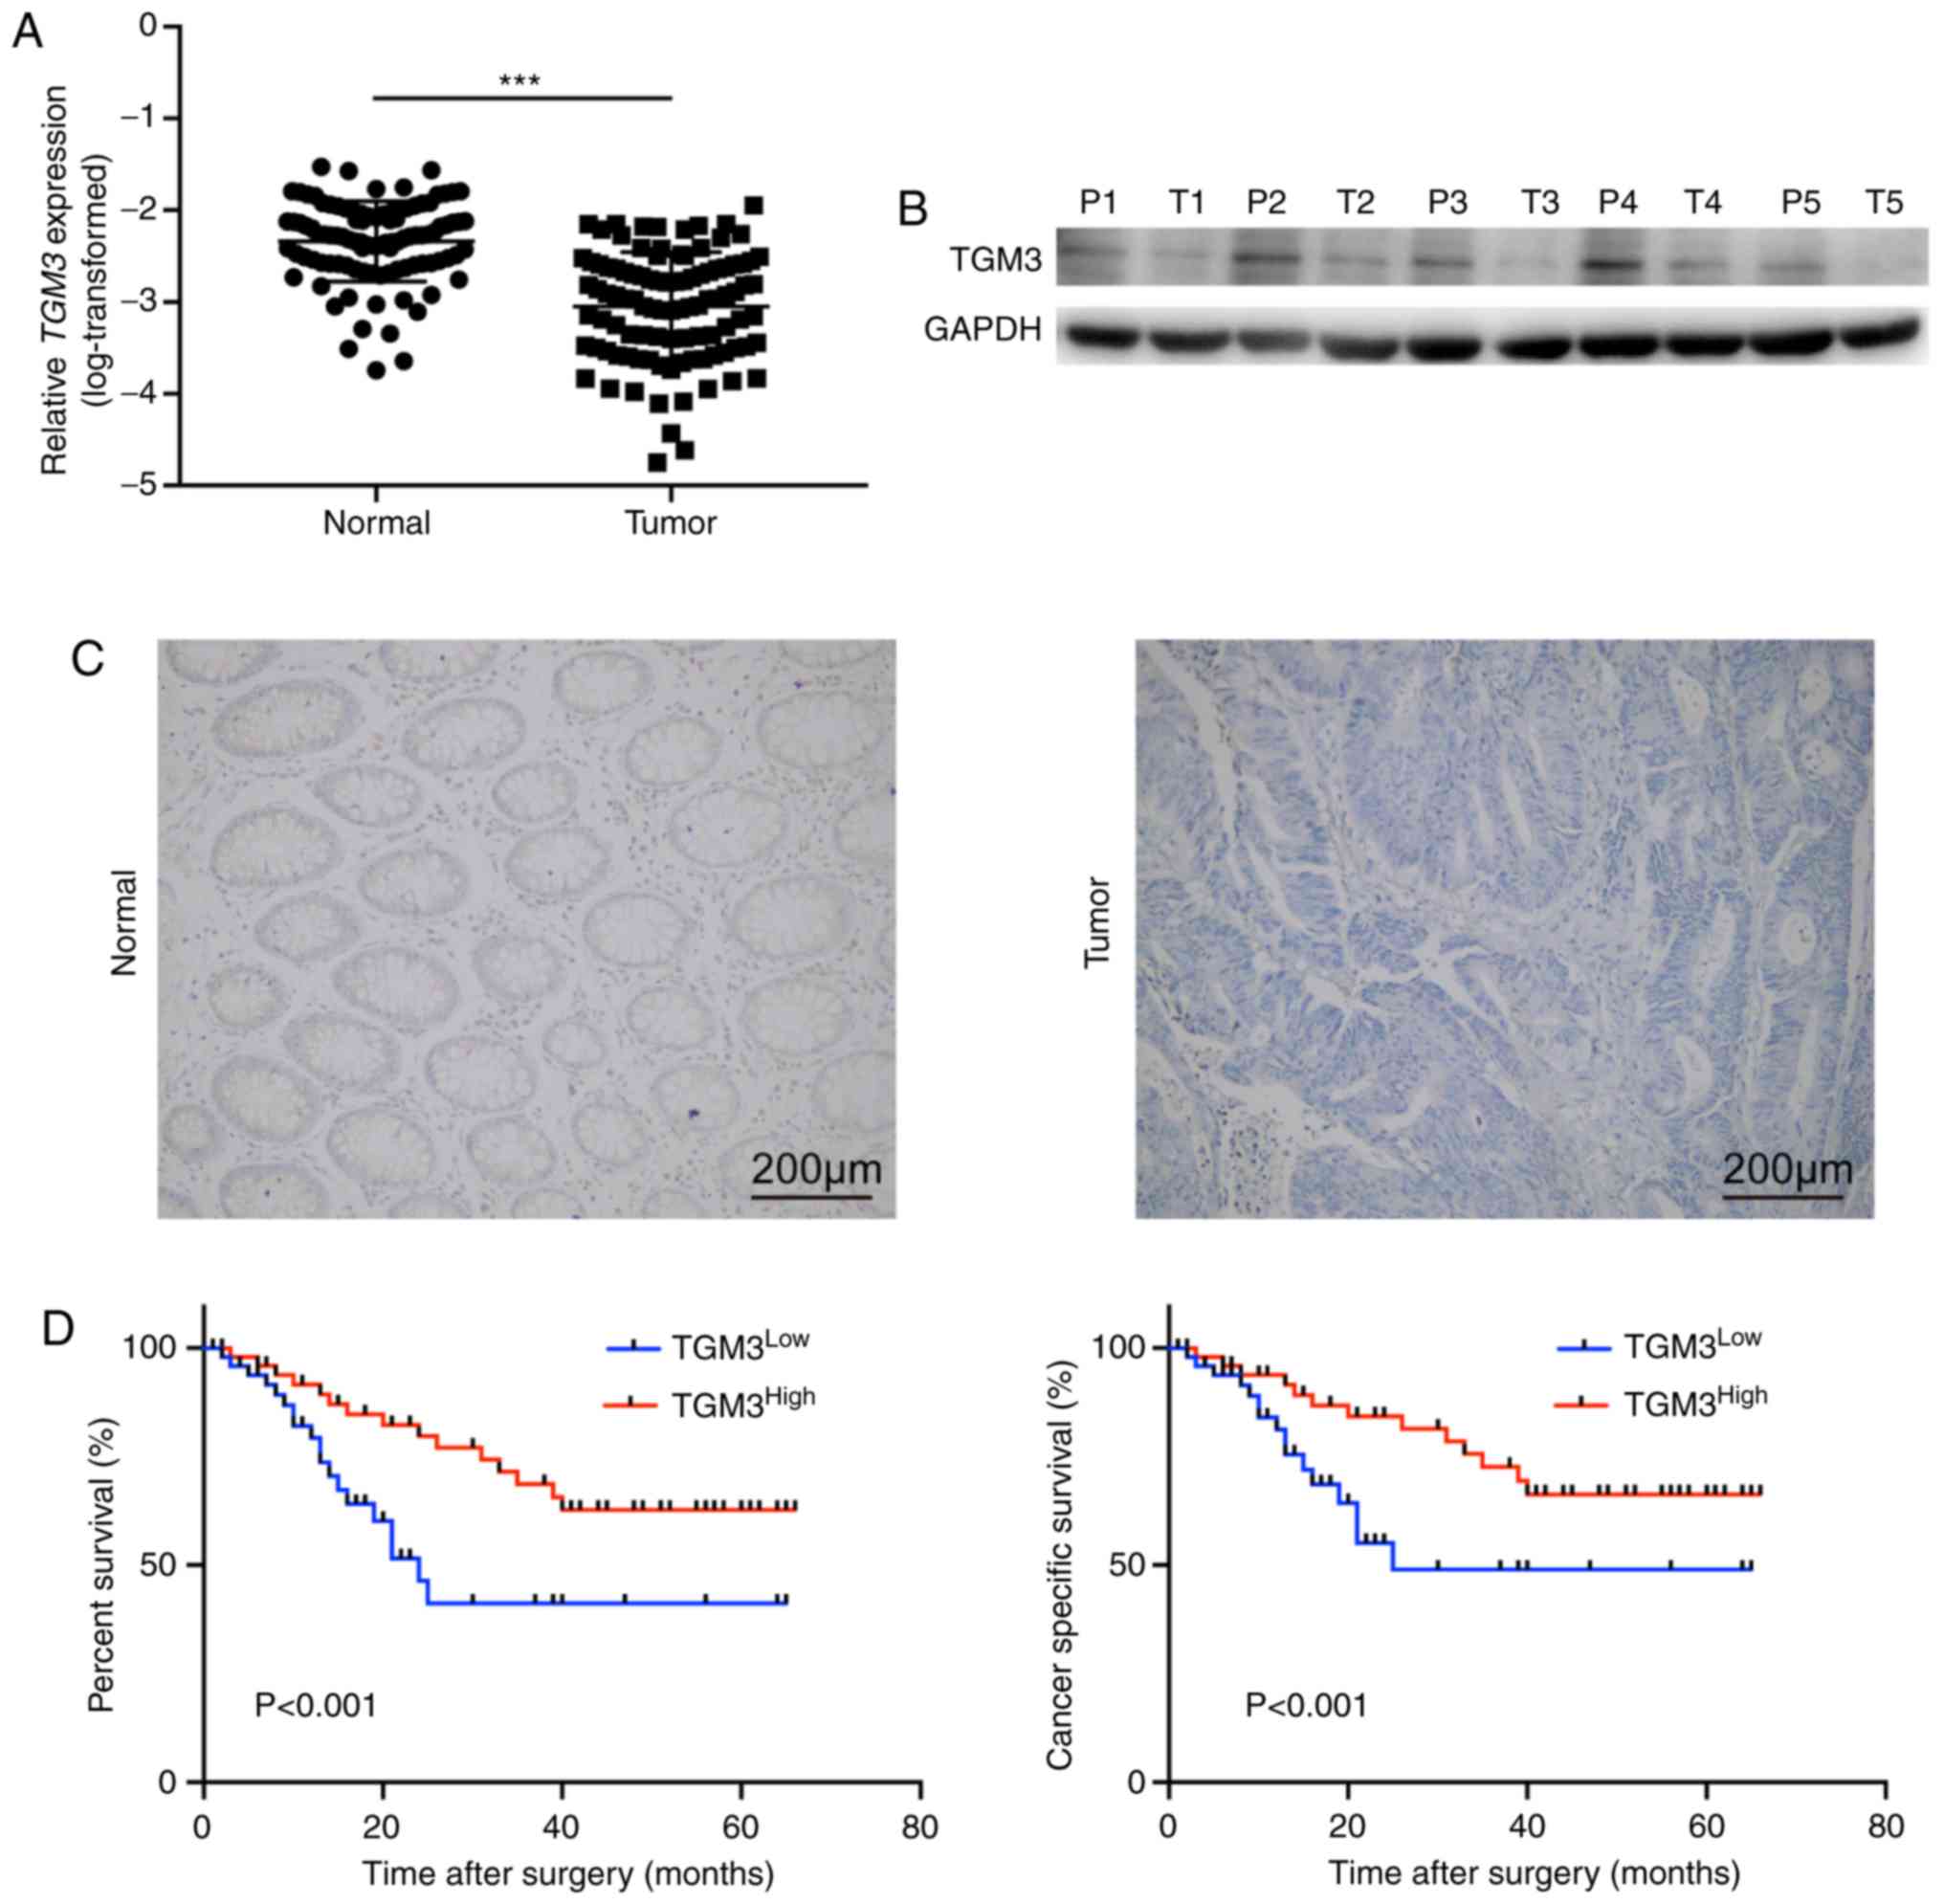
TGM3 is downregulated in CRC tissues
and associated with clinicopathological features
In order to preliminarily gain an insight into the
function of TGM3 in CRC, TGM3 expression was examined in 100 CRC
tissues and paired adjacent normal tissues. TGM3 was demonstrated
to be significantly downregulated in CRC tissues compared with
normal tissues at both the mRNA (Fig.
1A) and protein level (Fig. 1B and
C). The patients were then divided into TGM3 high and TGM3 low
groups according to the median value of TGM3 (Table I).
 | Table I.Correlation between TGM3 expression
and clinicopathological characteristics of the CRC patients
(n=100). |
Table I.
Correlation between TGM3 expression
and clinicopathological characteristics of the CRC patients
(n=100).
|
|
| TGM3 expression |
|
|---|
|
|
|
|
|
|---|
|
|
| Low | High |
|
|---|
|
|
|
|
|
|
|---|
| Clinicopathological
features | Total no.
(n=100) | n | % | n | % | P-value |
|---|
| Sex |
|
|
|
|
| 0.668 |
| Male | 68 | 33 | 66.0 | 35 | 70.0 |
|
|
Female | 32 | 17 | 34.0 | 15 | 30.0 |
|
| Age (years) |
|
|
|
|
| 0.406 |
| ≤50 | 64 | 30 | 60.0 | 34 | 68.0 |
|
|
>50 | 36 | 20 | 40.0 | 16 | 32.0 |
|
| Depth of
invasion |
|
|
|
|
| 0.026 |
|
T1-T2 | 57 | 23 | 44.0 | 34 | 68.0 |
|
|
T3-T4 | 33 | 27 | 56.0 | 16 | 32.0 |
|
| Tumor stage |
|
|
|
|
| 0.001 |
|
I–II | 43 | 13 | 26.0 | 30 | 60.0 |
|
|
III–IV | 57 | 37 | 74.0 | 20 | 40.0 |
|
| Liver
metastasis |
|
|
|
|
| 0.016 |
|
Yes | 50 | 30 | 60.0 | 26 | 52.0 |
|
| No | 50 | 20 | 40.0 | 24 | 48.0 |
|
| Lymph node
metastasis |
|
|
|
|
| 0.420 |
|
Yes | 44 | 20 | 40.0 | 24 | 48.0 |
|
| No | 56 | 30 | 60.0 | 26 | 52.0 |
|
| Location |
|
|
|
|
| 0.543 |
|
Rectum | 63 | 33 | 66.0 | 30 | 60.0 |
|
|
Colon | 37 | 17 | 34.0 | 20 | 40.0 |
|
| CEA (ng/ml) |
|
|
|
|
| 0.838 |
|
≥4.7 | 61 | 31 | 62.0 | 30 | 60.0 |
|
|
<4.7 | 39 | 19 | 38.0 | 20 | 40.0 |
|
Further analyses revealed that TGM3 expression was
significantly associated with invasion status (P=0.026), tumor
stage (P=0.001) and liver metastasis (P=0.016; Table I). Furthermore, Kaplan-Meier curves
combined with log-rank tests confirmed that TGM3 expression was
significantly associated with overall survival and cancer-specific
survival in patients with CRC (Fig.
1D), which was also validated with the univariate and
multivariate analyses (Tables II
and III).
| Table II.Univariate and multivariate survival
analyses for the evaluation of TGM3 expression influencing OS in
CRC (n=100). |
Table II.
Univariate and multivariate survival
analyses for the evaluation of TGM3 expression influencing OS in
CRC (n=100).
|
| Univariate
analysis | Multivariate
analysis |
|---|
|
|
|
|
|---|
| Variable | HR (95% CI) | P-value | HR (95% CI) | P-value |
|---|
| Sex |
| 0.627 |
| NA |
|
Male | 1 |
|
|
|
|
Female | 0.670
(0.301–1.358) |
|
|
|
| Age (years) |
| 0.589 |
| NA |
|
≤50 | 1 |
|
|
|
|
>50 | 0.853
(0.595–1.436) |
|
|
|
| Depth of
invasion |
| 0.018 |
| 0.133 |
|
T1-T2 | 1 |
| 1 |
|
|
T3-T4 | 1.501
(1.120–2.750) |
| 1.559
(0.895–2.154) |
|
| Tumor stage |
| 0.010 |
| 0.013 |
|
I–II | 1 |
| 1 |
|
|
III–IV | 2.176
(1.207–3.923) |
| 2.201
(1.178–4.113) |
|
| Liver
metastasis |
| 0.031 |
| 0.017 |
| No | 1 |
| 1 |
|
|
Yes | 1.761
(1.057–3.366) |
| 1.546
(1.319–1.883) |
|
| Lymph node
metastasis |
| 0.008 |
| 0.003 |
| No | 1 |
| 1 |
|
|
Yes | 2.252
(1.225–4.139) |
| 2.601
(1.379–4.907) |
|
| Location |
| 0.372 |
| NA |
|
Rectum | 1 |
|
|
|
|
Colon | 1.306
(0.726–2.350) |
|
|
|
| CEA (ng/ml) |
| 0.661 |
| NA |
|
≥4.7 | 1 |
|
|
|
|
<4.7 | 0.760
(0.595–1.366) |
|
|
|
| TGM3
expression |
| 0.019 |
| 0.031 |
|
Low | 1 |
| 1 |
|
|
High | 0.436
(0.153–0.826) |
| 0.480
(0.183–0.891) |
|
| Table III.Univariate and multivariate survival
analyses for evaluation of TGM3 expression influencing DFS in CRC
(n=100). |
Table III.
Univariate and multivariate survival
analyses for evaluation of TGM3 expression influencing DFS in CRC
(n=100).
|
| Univariate | Multivariate
analysis |
|---|
|
|
|
|
|---|
| Variable | HR (95% CI) | P-value | HR (95% CI) | P-value |
|---|
| Sex |
| 0.710 |
| NA |
|
Male | 1 |
|
|
|
|
Female | 0.921
(0.538–1.712) |
|
|
|
| Age (years) |
| 0.461 |
| NA |
|
≤50 | 1 |
|
|
|
|
>50 | 0.710
(0.352–1.413) |
|
|
|
| Depth of
invasion |
| 0.136 |
| NA |
|
T1-T2 | 1 |
|
|
|
|
T3-T4 | 1.245
(0.822–2.493) |
|
|
|
| Tumor stage |
| 0.006 |
| 0.024 |
|
I–II | 1 |
| 1 |
|
|
III–IV |
2.625(1.310–4.292) |
| 2.257
(1.114–4.573) |
|
| Liver
metastasis |
| 0.011 |
| 0.022 |
| No | 1 |
| 1 |
|
|
Yes | 1.641
(1.138–3.288) |
| 1.701
(1.154–2.988) |
|
| Lymph node
metastasis |
| 0.009 |
| 0.011 |
| No | 1 |
| 1 |
|
|
Yes | 1.663
(1.223–3.326) |
| 1.687
(1.235–3.098) |
|
| Location |
| 0.350 |
| NA |
|
Rectum | 1 |
|
|
|
|
Colon | 1.447
(0.832–2.326) |
|
|
|
| CEA (ng/ml) |
| 0.591 |
| NA |
|
≥4.7 | 1 |
|
|
|
|
<4.7 | 0.819
(0.695–1.591) |
|
|
|
| TGM3
expression |
| 0.010 |
| 0.022 |
|
Low | 1 |
| 1 |
|
|
High | 0.434
(0.211–0.881) |
| 0.480
(0.253–0.891) |
|
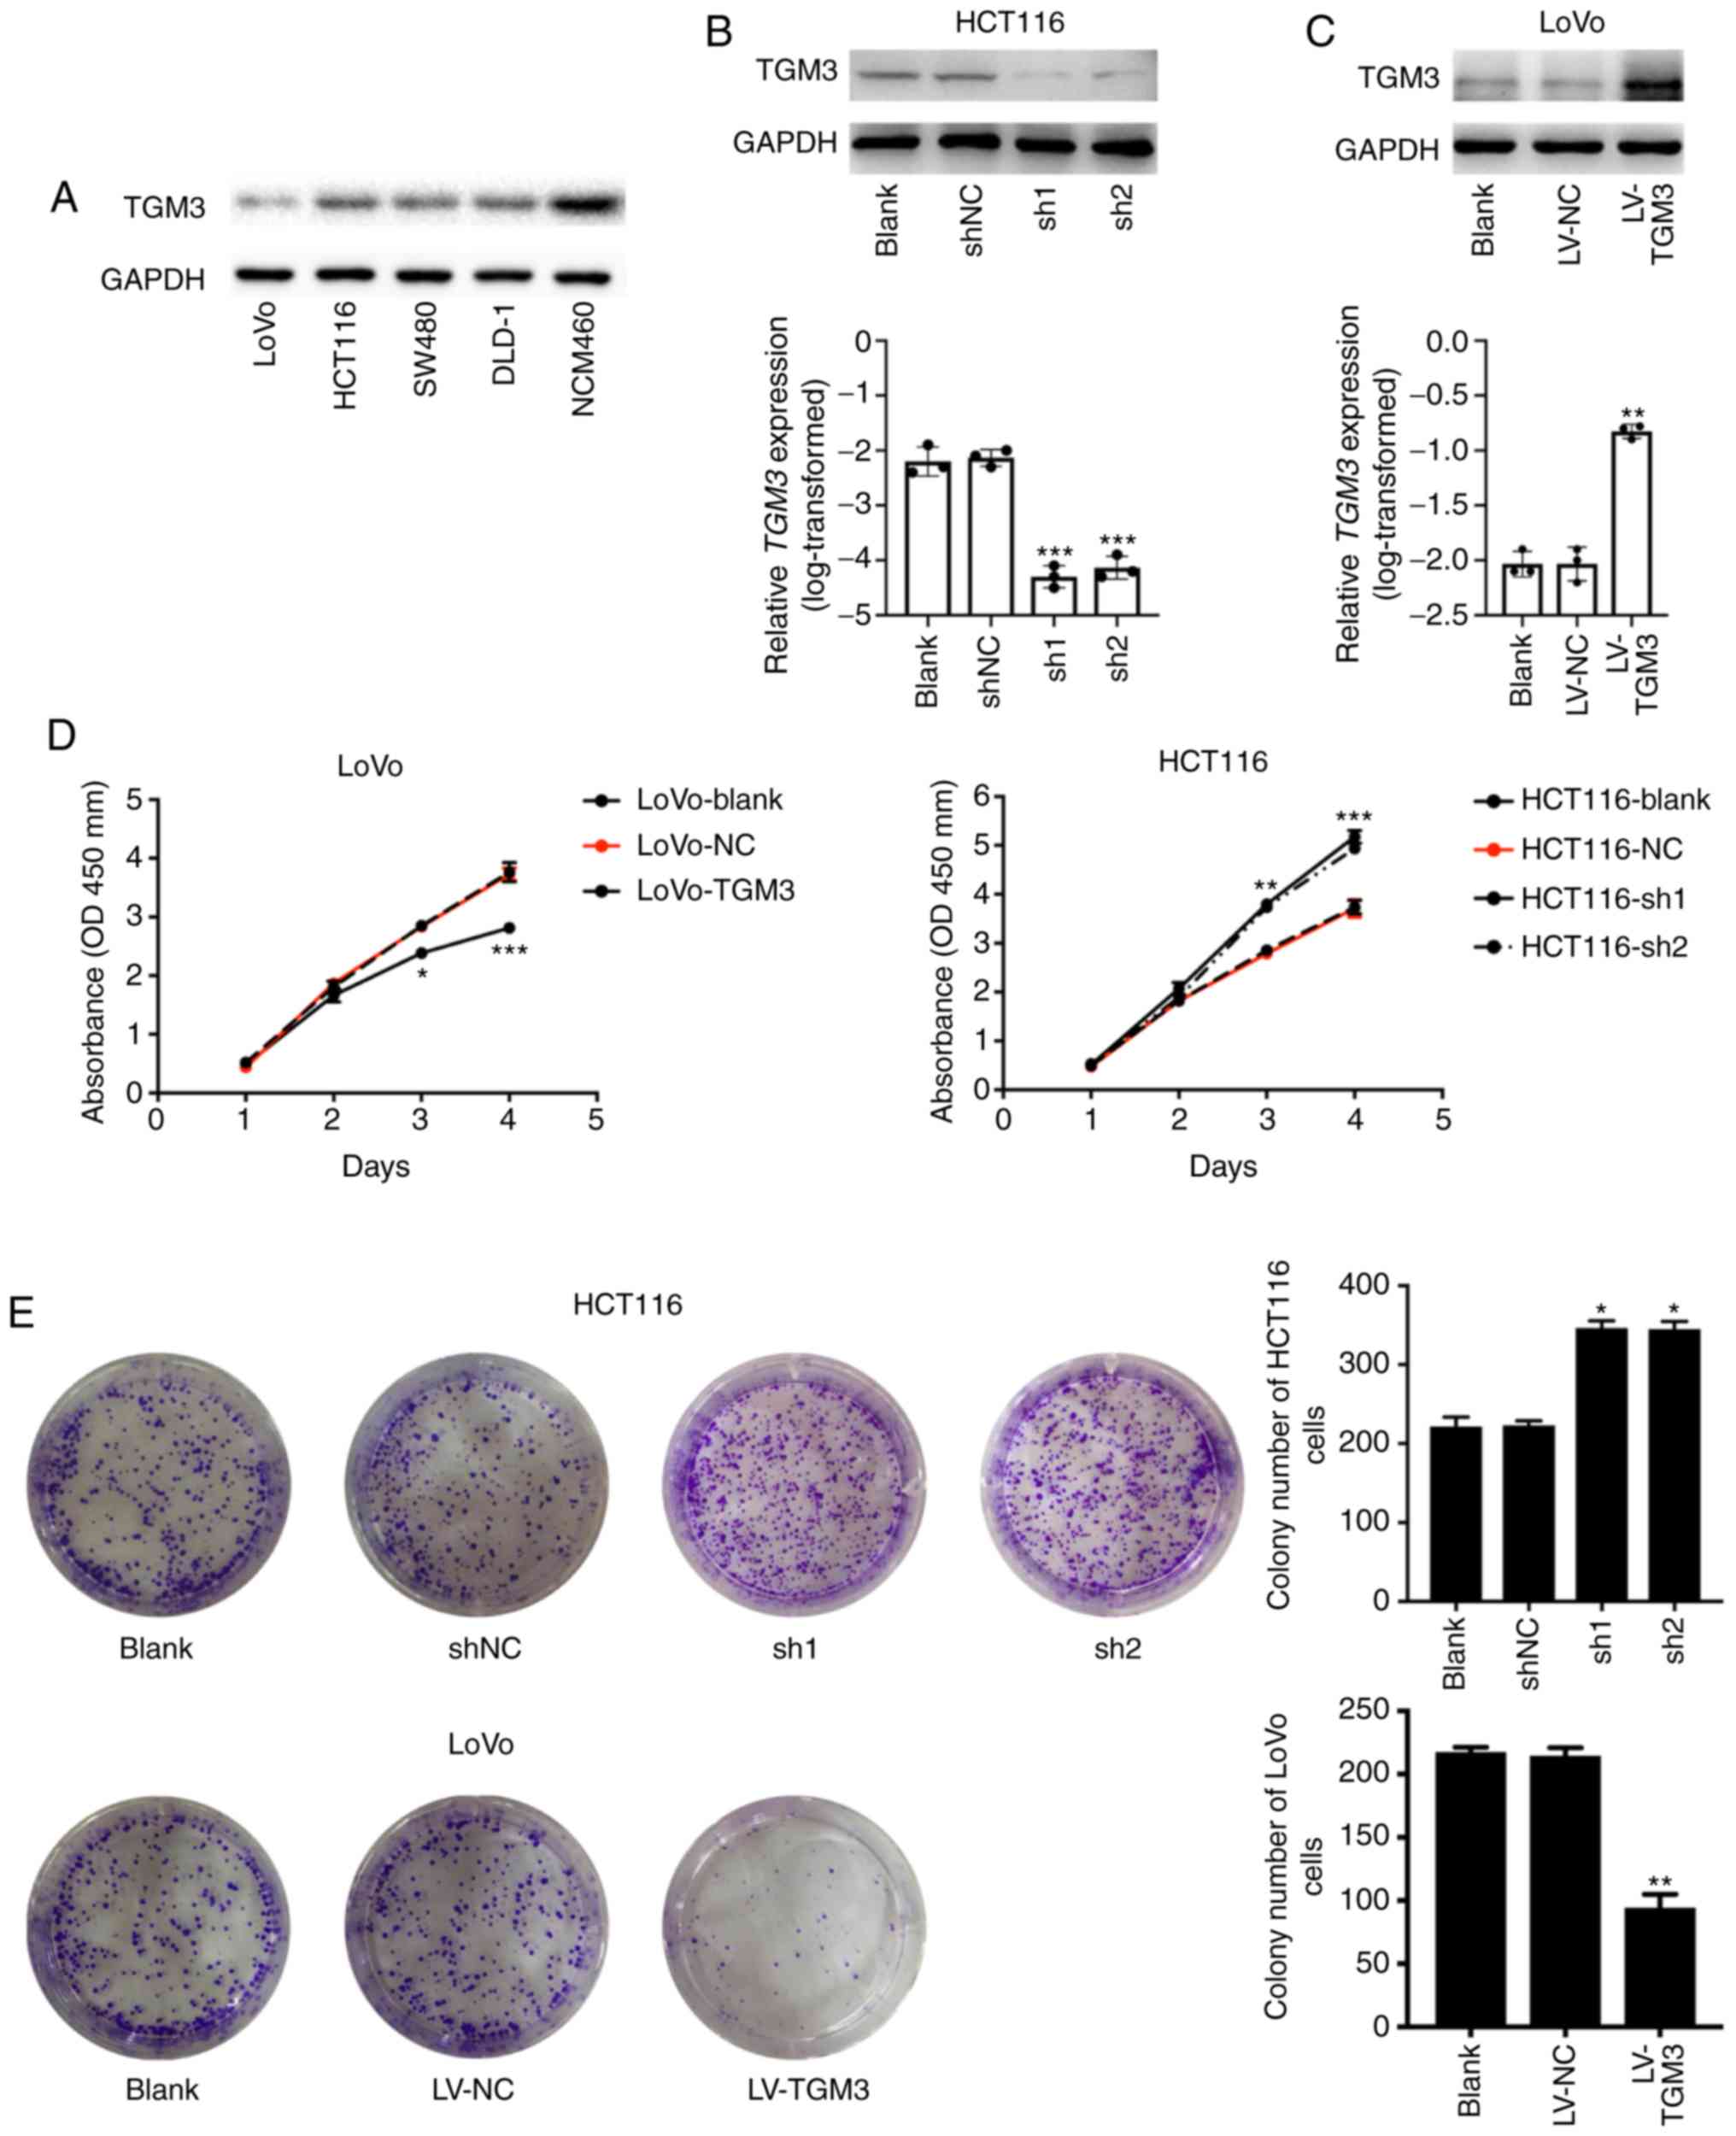
TGM3 is downregulated in CRC
cells
Consistent with the results in the human CRC
tissues, TGM3 expression was detected in different cell lines in
the present study and it was revealed that the expression of TGM3
at the protein level was downregulated in the CRC cell lines
compared with that in the NCM460 cells (Fig. 2A). When performing the gain- and
loss-of-function assays, LoVo and HCT116 cells were selected to
construct TGM3 overexpression and knockdown cells, respectively,
in vitro by transfecting cells with a TGM3-overexpressing
lentivirus or TGM3 specific shRNAs. The western blotting results
further confirmed the knockdown and overexpression efficiency of
TGM3 in the HCT116 and LoVo cells (Fig.
2B and C).
TGM3 suppresses CRC cell proliferation
in vitro
In order to elucidate the role of TGM3 in the
proliferation of CRC cells, CCK-8 and colony formation assays were
performed. Knockdown of TGM3 significantly promoted cell viability
in the HCT116 cells (Fig. 2D),
whereas overexpression of TGM3 significantly inhibited cell
proliferation in the LoVo cells (Fig.
2D). Consistently, HCT116 cells transfected with shRNAs
exhibited significantly increased colony formation ability, whereas
LoVo cells transfected with TGM3-overexpressing lentivirus
exhibited the opposite results (Fig.
2E).
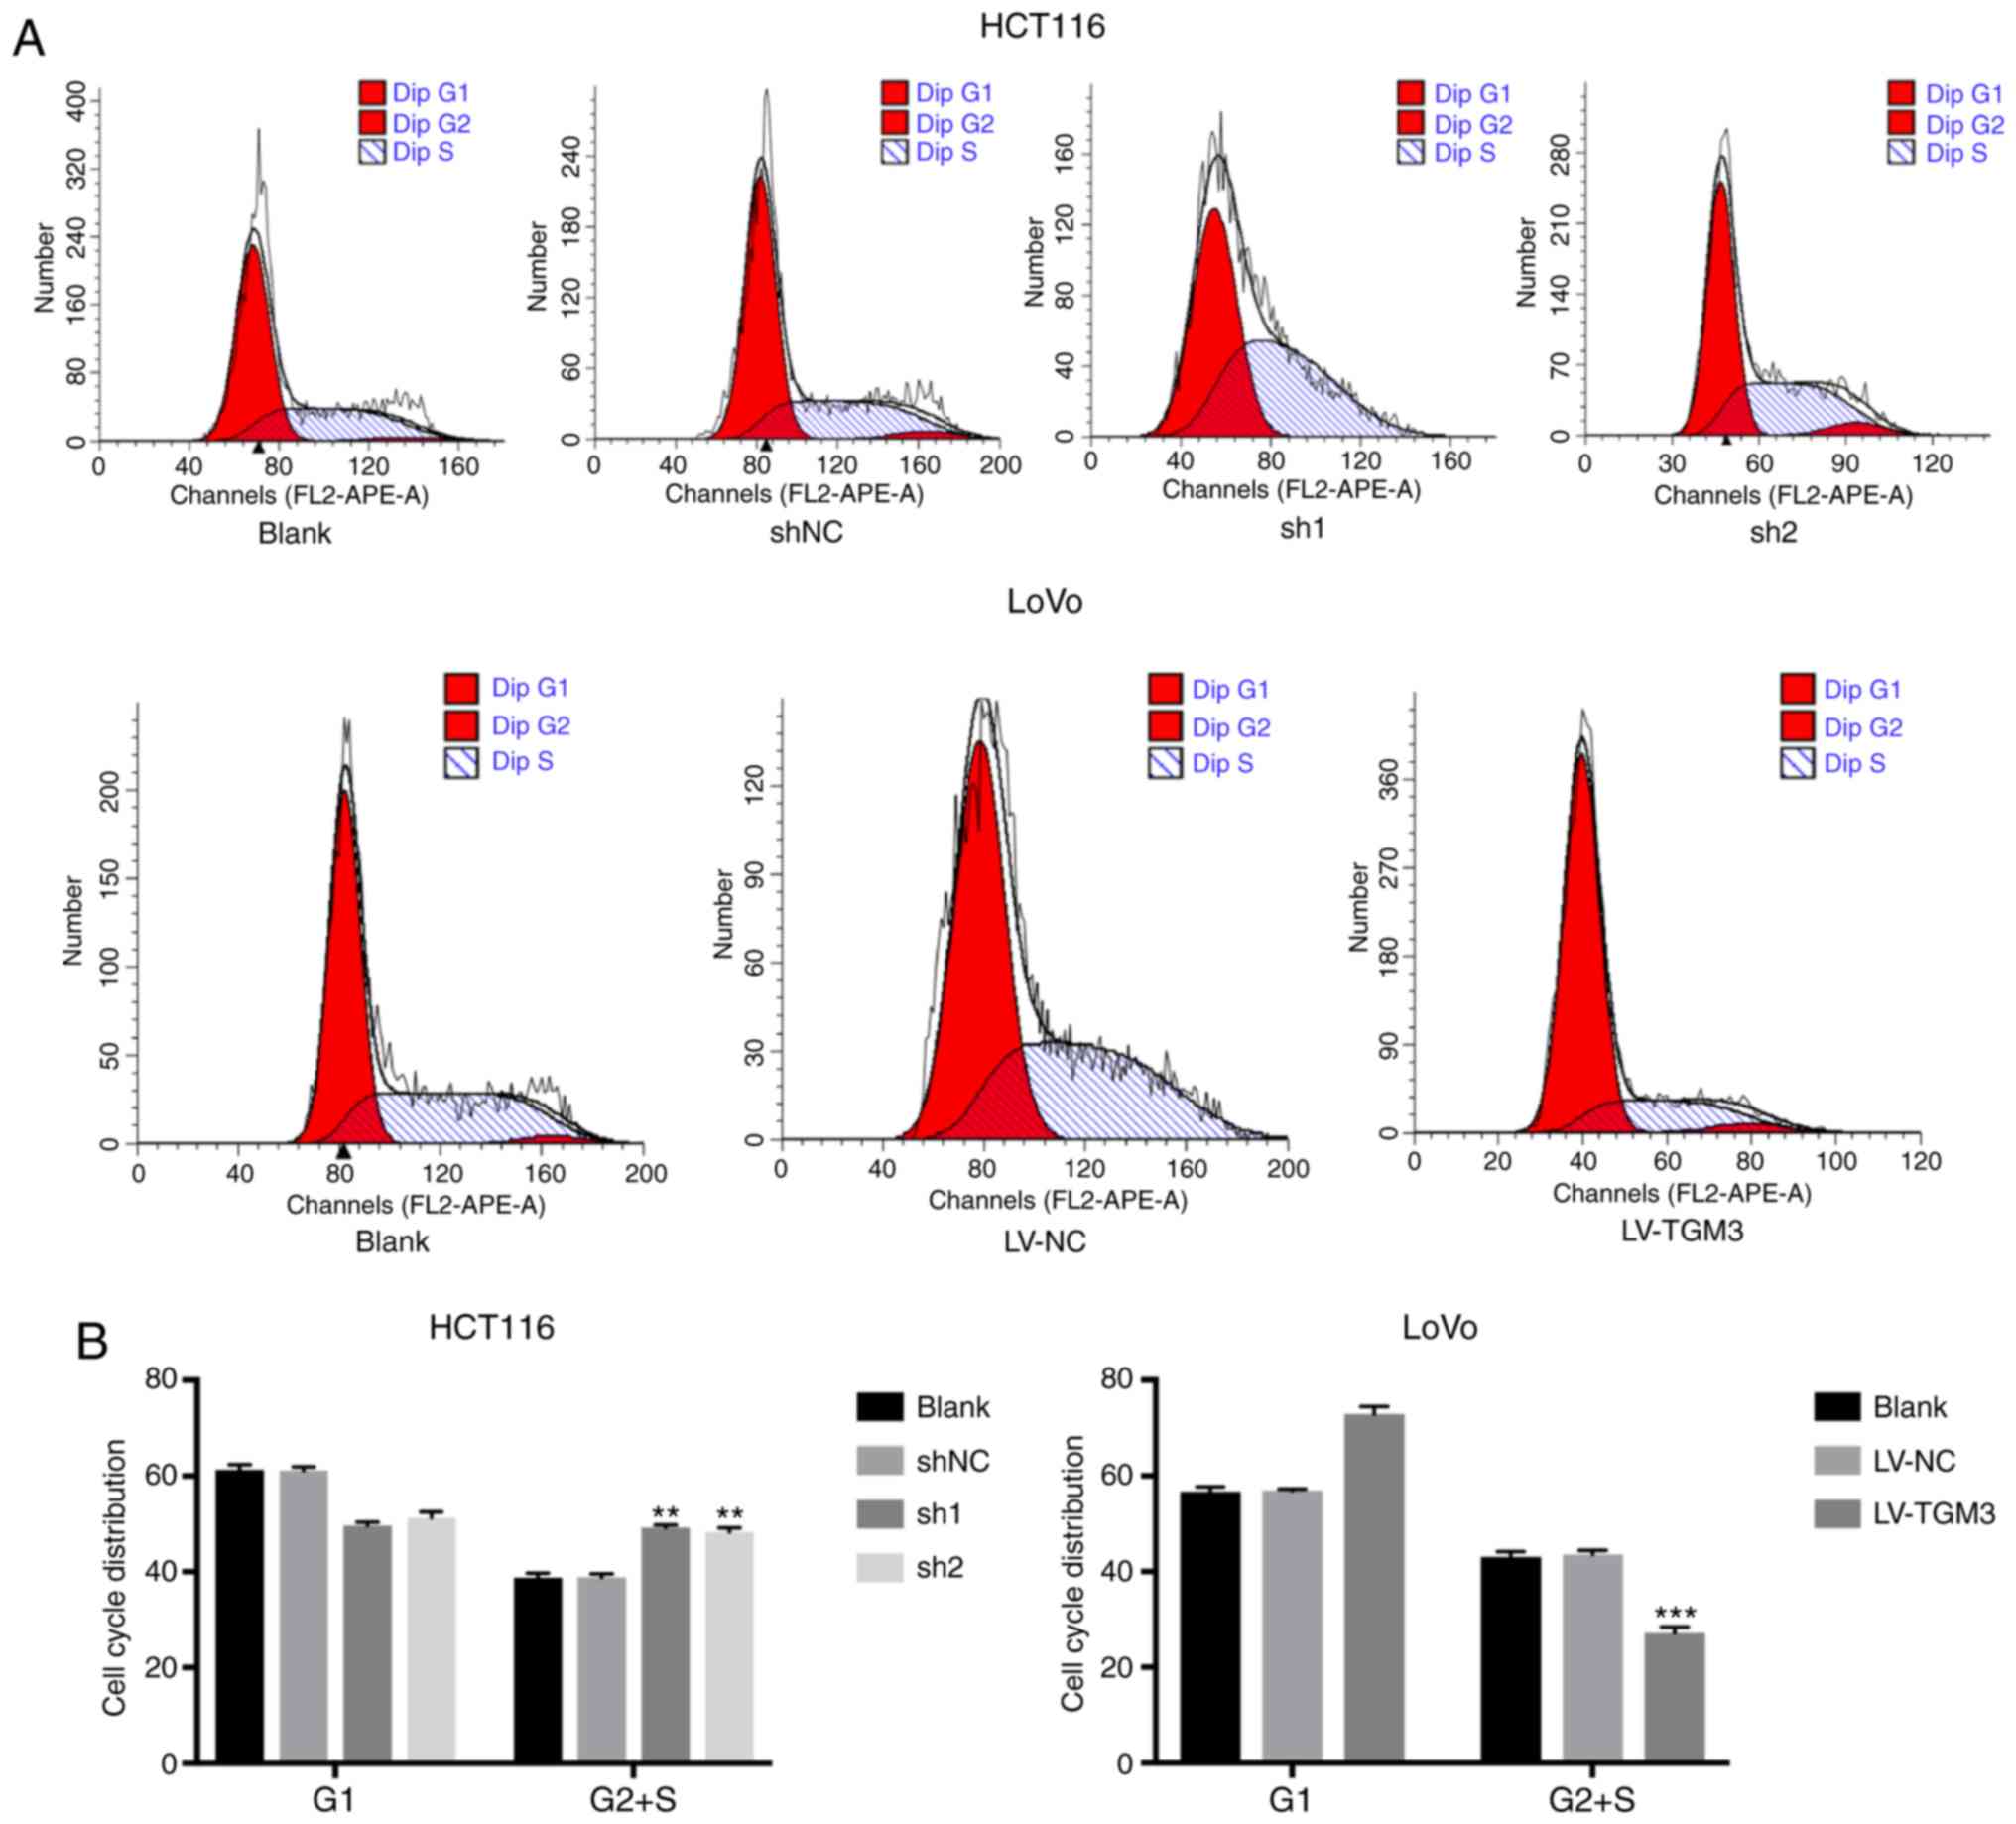
TGM3 promotes cell apoptosis and
suppresses the cell cycle of CRC cells in vitro
The FACs assay was utilized to investigate the cell
apoptosis rate and cell cycle distribution in the HCT116 and LoVo
cells. The results revealed that knockdown of TGM3 in HCT116 cells
significantly decreased the percentage of apoptotic cells, whereas
TGM3 overexpression in LoVo cells significantly enhanced the rate
of apoptosis (Fig. 3A and B).
Meanwhile, HCT116 cells transfected with the shRNA demonstrated a
significantly higher percentage of cells in the G2+S
phase and a significantly decreased percentage of cells in the
G1 phase, whereas LoVo cells transfected with the
TGM3-overexpressing lentivirus exhibited the reverse results
(Fig. 4A and B).
TGM3 suppresses the migration and
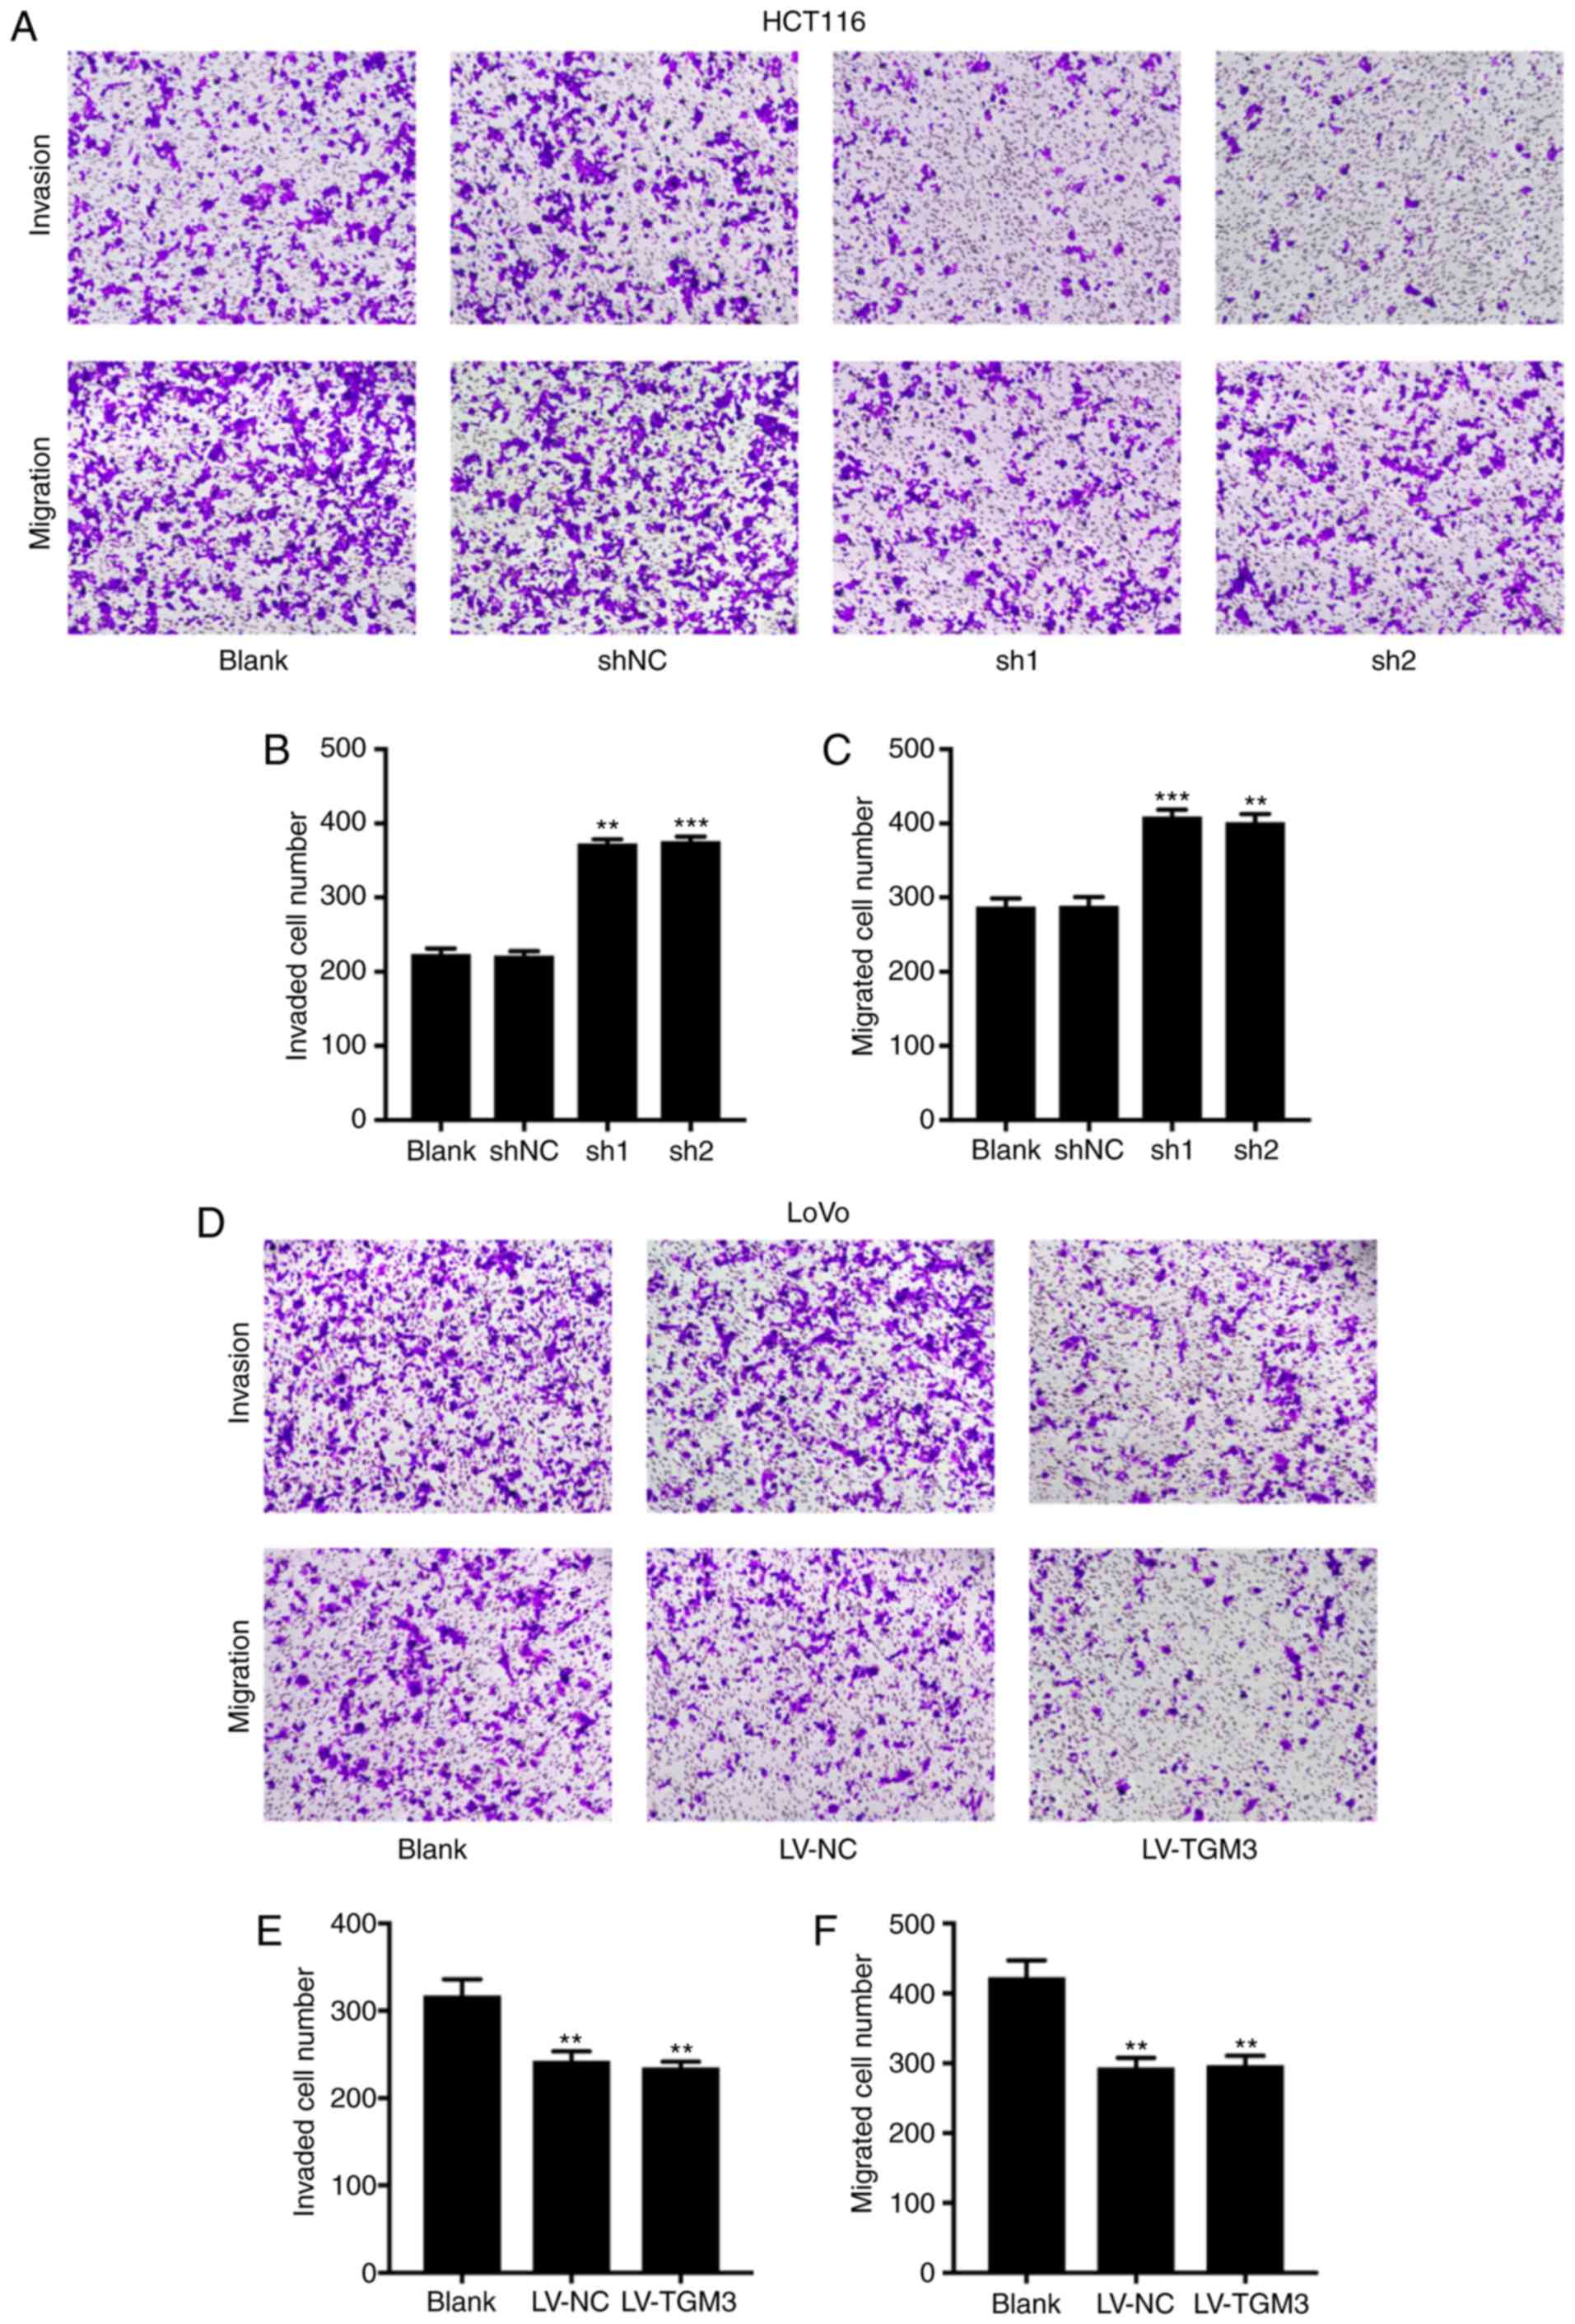
invasion of CRC cells in vitro
A Transwell assay was performed to assess the
migration and invasion abilities of HCT116 and LoVo cells. The
results revealed that the cells that translocated to the Transwell
with or without Matrigel were significantly increased when TGM3 was
silenced in HCT116 cells (Fig.
5A-C), whereas TGM3 overexpression in LoVo cells significantly
decreased the number of cells that translocated to the Transwell
with or without Matrigel (Fig.
5D-F). These results demonstrated that TGM3 suppresses the
migration and invasion ability of CRC cells.
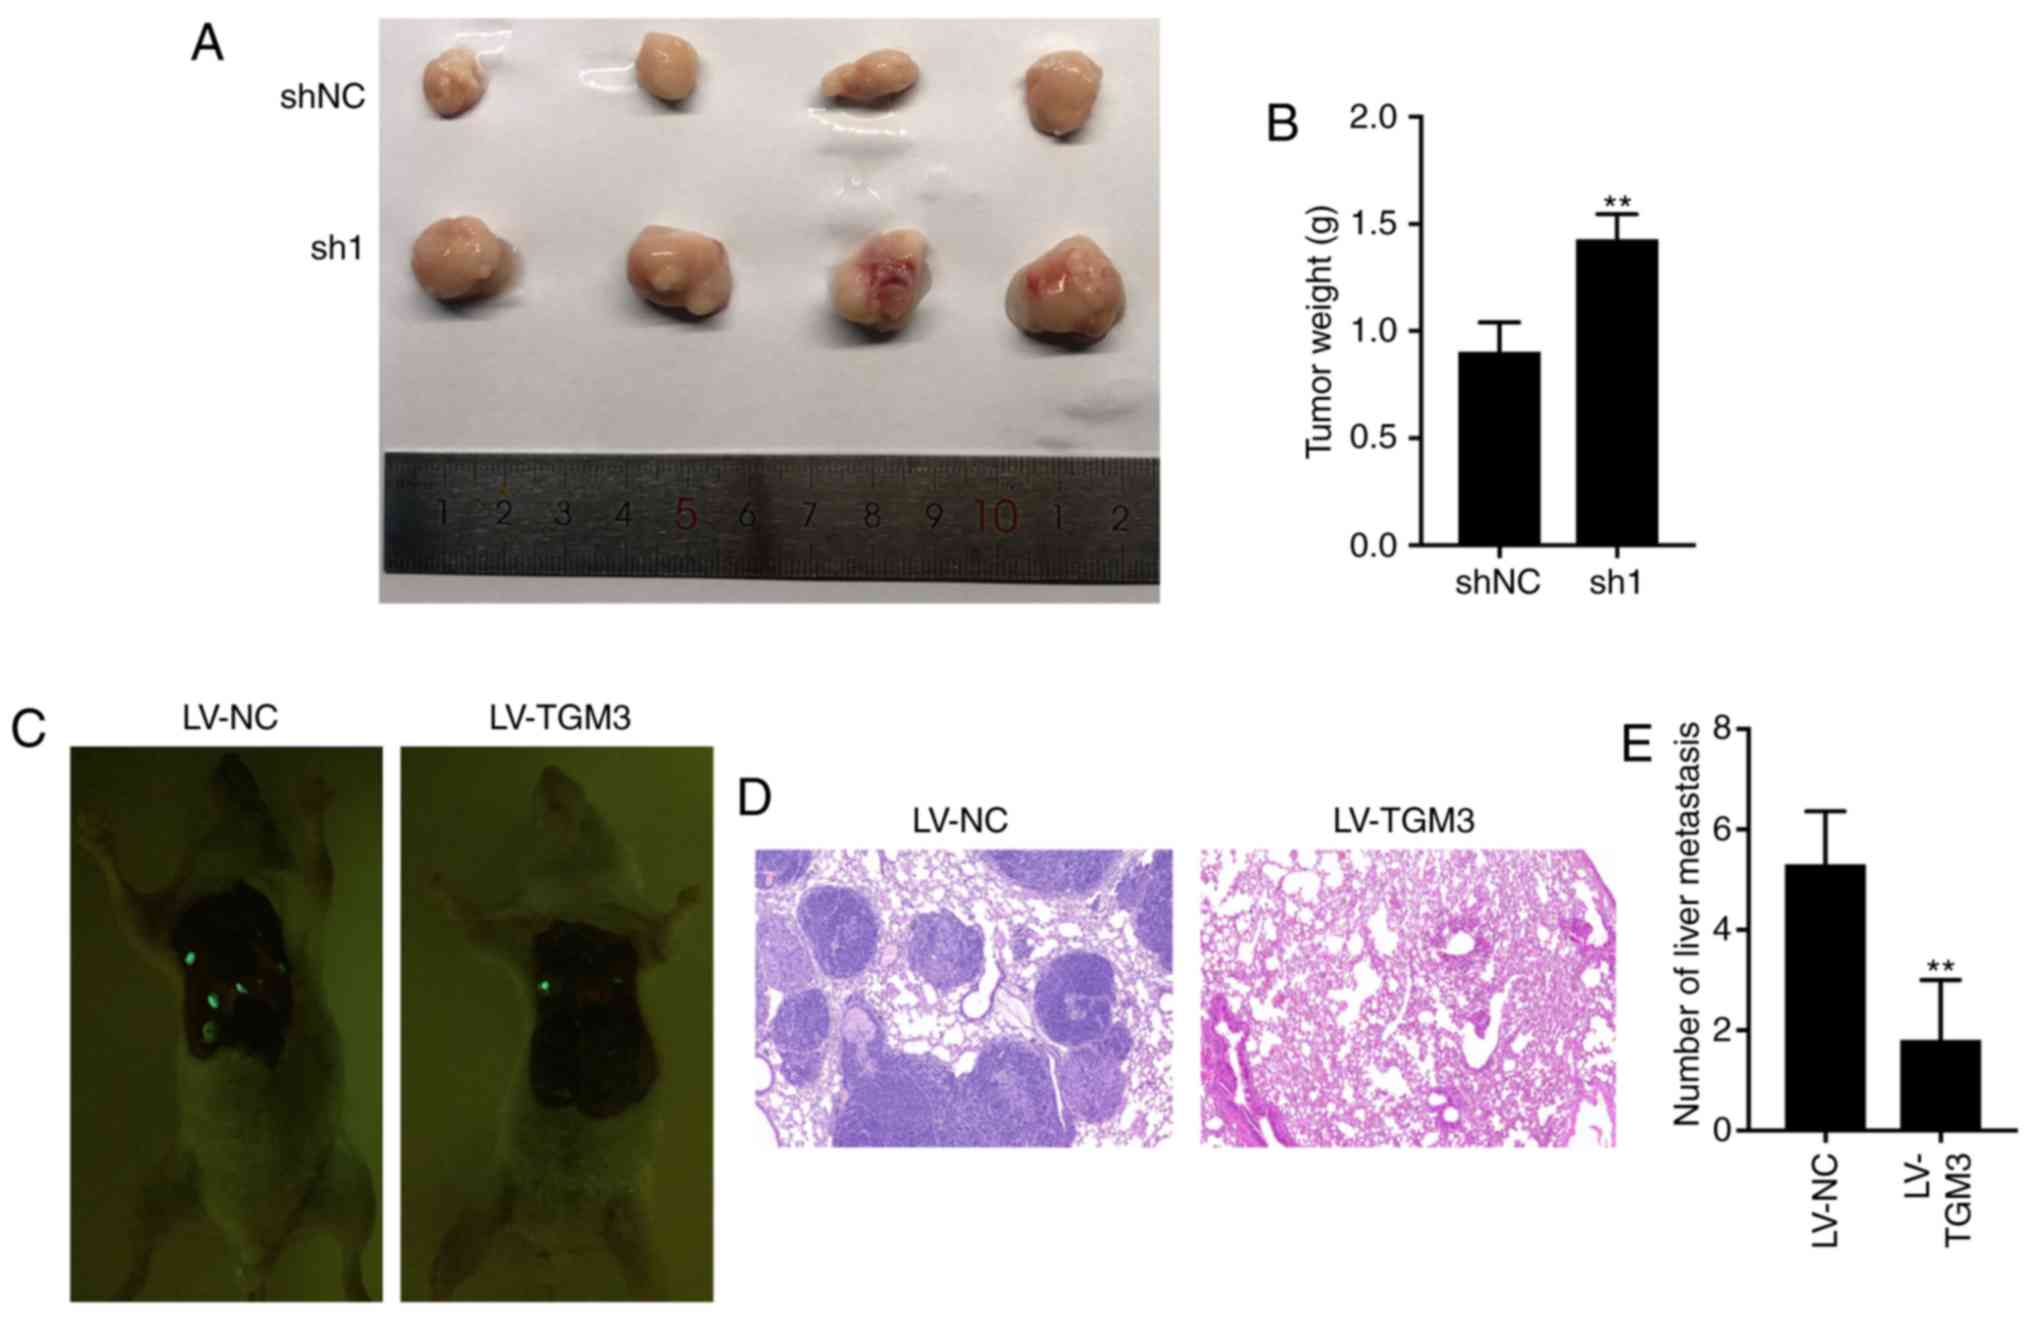
Upregulation of TGM3 inhibits tumor
proliferation and metastasis in vivo
In order to investigate whether TGM3 plays a role in
tumor growth in vivo, subcutaneous xenotransplantation
models were constructed using nude mice. TGM3-knockdown HCT116
cells exhibited a significantly increased tumor size and tumor
weight compared with the control group (Fig. 6A and B). Meanwhile, a tail vein
metastasis model in nude mice using LoVo cells was performed in
order to investigate whether TGM3 affects tumor metastasis in
vivo. A total of 5 weeks after the injection, hematoxylin and
eosin staining revealed that the overexpression of TGM3 was
associated with decreased lung metastases (Fig. 6C-E). All these results demonstrated
that TGM3 suppressed proliferation and metastasis in vivo in
CRC.
TGM3 represses the EMT process and
activation of the PI3K/AKT signaling pathway in CRC cells
In order to determine whether EMT is mediating the
inhibitory effect of TGM3 on proliferation and metastasis, the
present study investigated the expression levels of numerous
different EMT markers. As expected, overexpression of TGM3
increased the expression level of E-cadherin and decreased the
levels of N-cadherin and vimentin, while knockdown of TGM3
decreased the expression level of E-cadherin and increased the
levels of N-cadherin and vimentin (Fig.
7A and B). All these results revealed that TGM3 could suppress
the EMT process in CRC cells. Notably, the protein levels of p-PI3K
and p-AKT were decreased when TGM3 was overexpressed in LoVo cells,
whereas they were increased when TGM3 was knocked down in HCT116
cells. However, no significant differences were observed in total
PI3K and AKT expression, suggesting that TGM3 inhibits activation
of the PI3K/AKT signaling pathway (Fig.
7A and B).
 | Figure 7.TGM3 represses the EMT process and
activation of the PI3K/AKT signaling pathway in CRC cells.
Expression levels of EMT markers (E-cadherin, N-cadherin and
vimentin), PI3K/AKT effectors (p-PI3K, PI3K, p-AKT, AKT) and a
proliferation marker (P21) were detected via western blotting in
(A) HCT116 cells following TGM3 knockdown and (B) LoVo cells
following TGM3 overexpression. (C) Expression levels of EMT markers
(E-cadherin, N-cadherin and vimentin), PI3K/AKT effectors (p-PI3K,
PI3K, p-AKT and AKT) and a proliferation marker (P21) in HCT116
cells in the different groups (shNC, sh1, sh2, sh1+MK-2206 2HCl).
CRC, colorectal cancer; NC, negative control sequence; sh, short
hairpin; LV, lentivirus; TGM3, transglutaminase 3; MK-2206 2HCl,
AKT inhibitor. |
In order to further assess whether TGM3 inhibits the
EMT process through the PI3K/AKT signaling pathway, an AKT
inhibitor named MK-2206 2HCl was utilized. Treatment with MK-2206
2HCl reversed the expression level of mesenchymal markers and
activation of the PI3K/AKT signaling pathway mediated by TGM3
knockdown (Fig. 7C). Furthermore,
inactivation of PI3K/AKT by MK-2206 2HCl also reversed cell
phenotypes, such as colony formation ability (Fig. 8A), cell viability (Fig. 8B), apoptosis (Fig. 8C), cell cycle distribution (Fig. 8D), invasion and migration ability
(Fig. 8E).
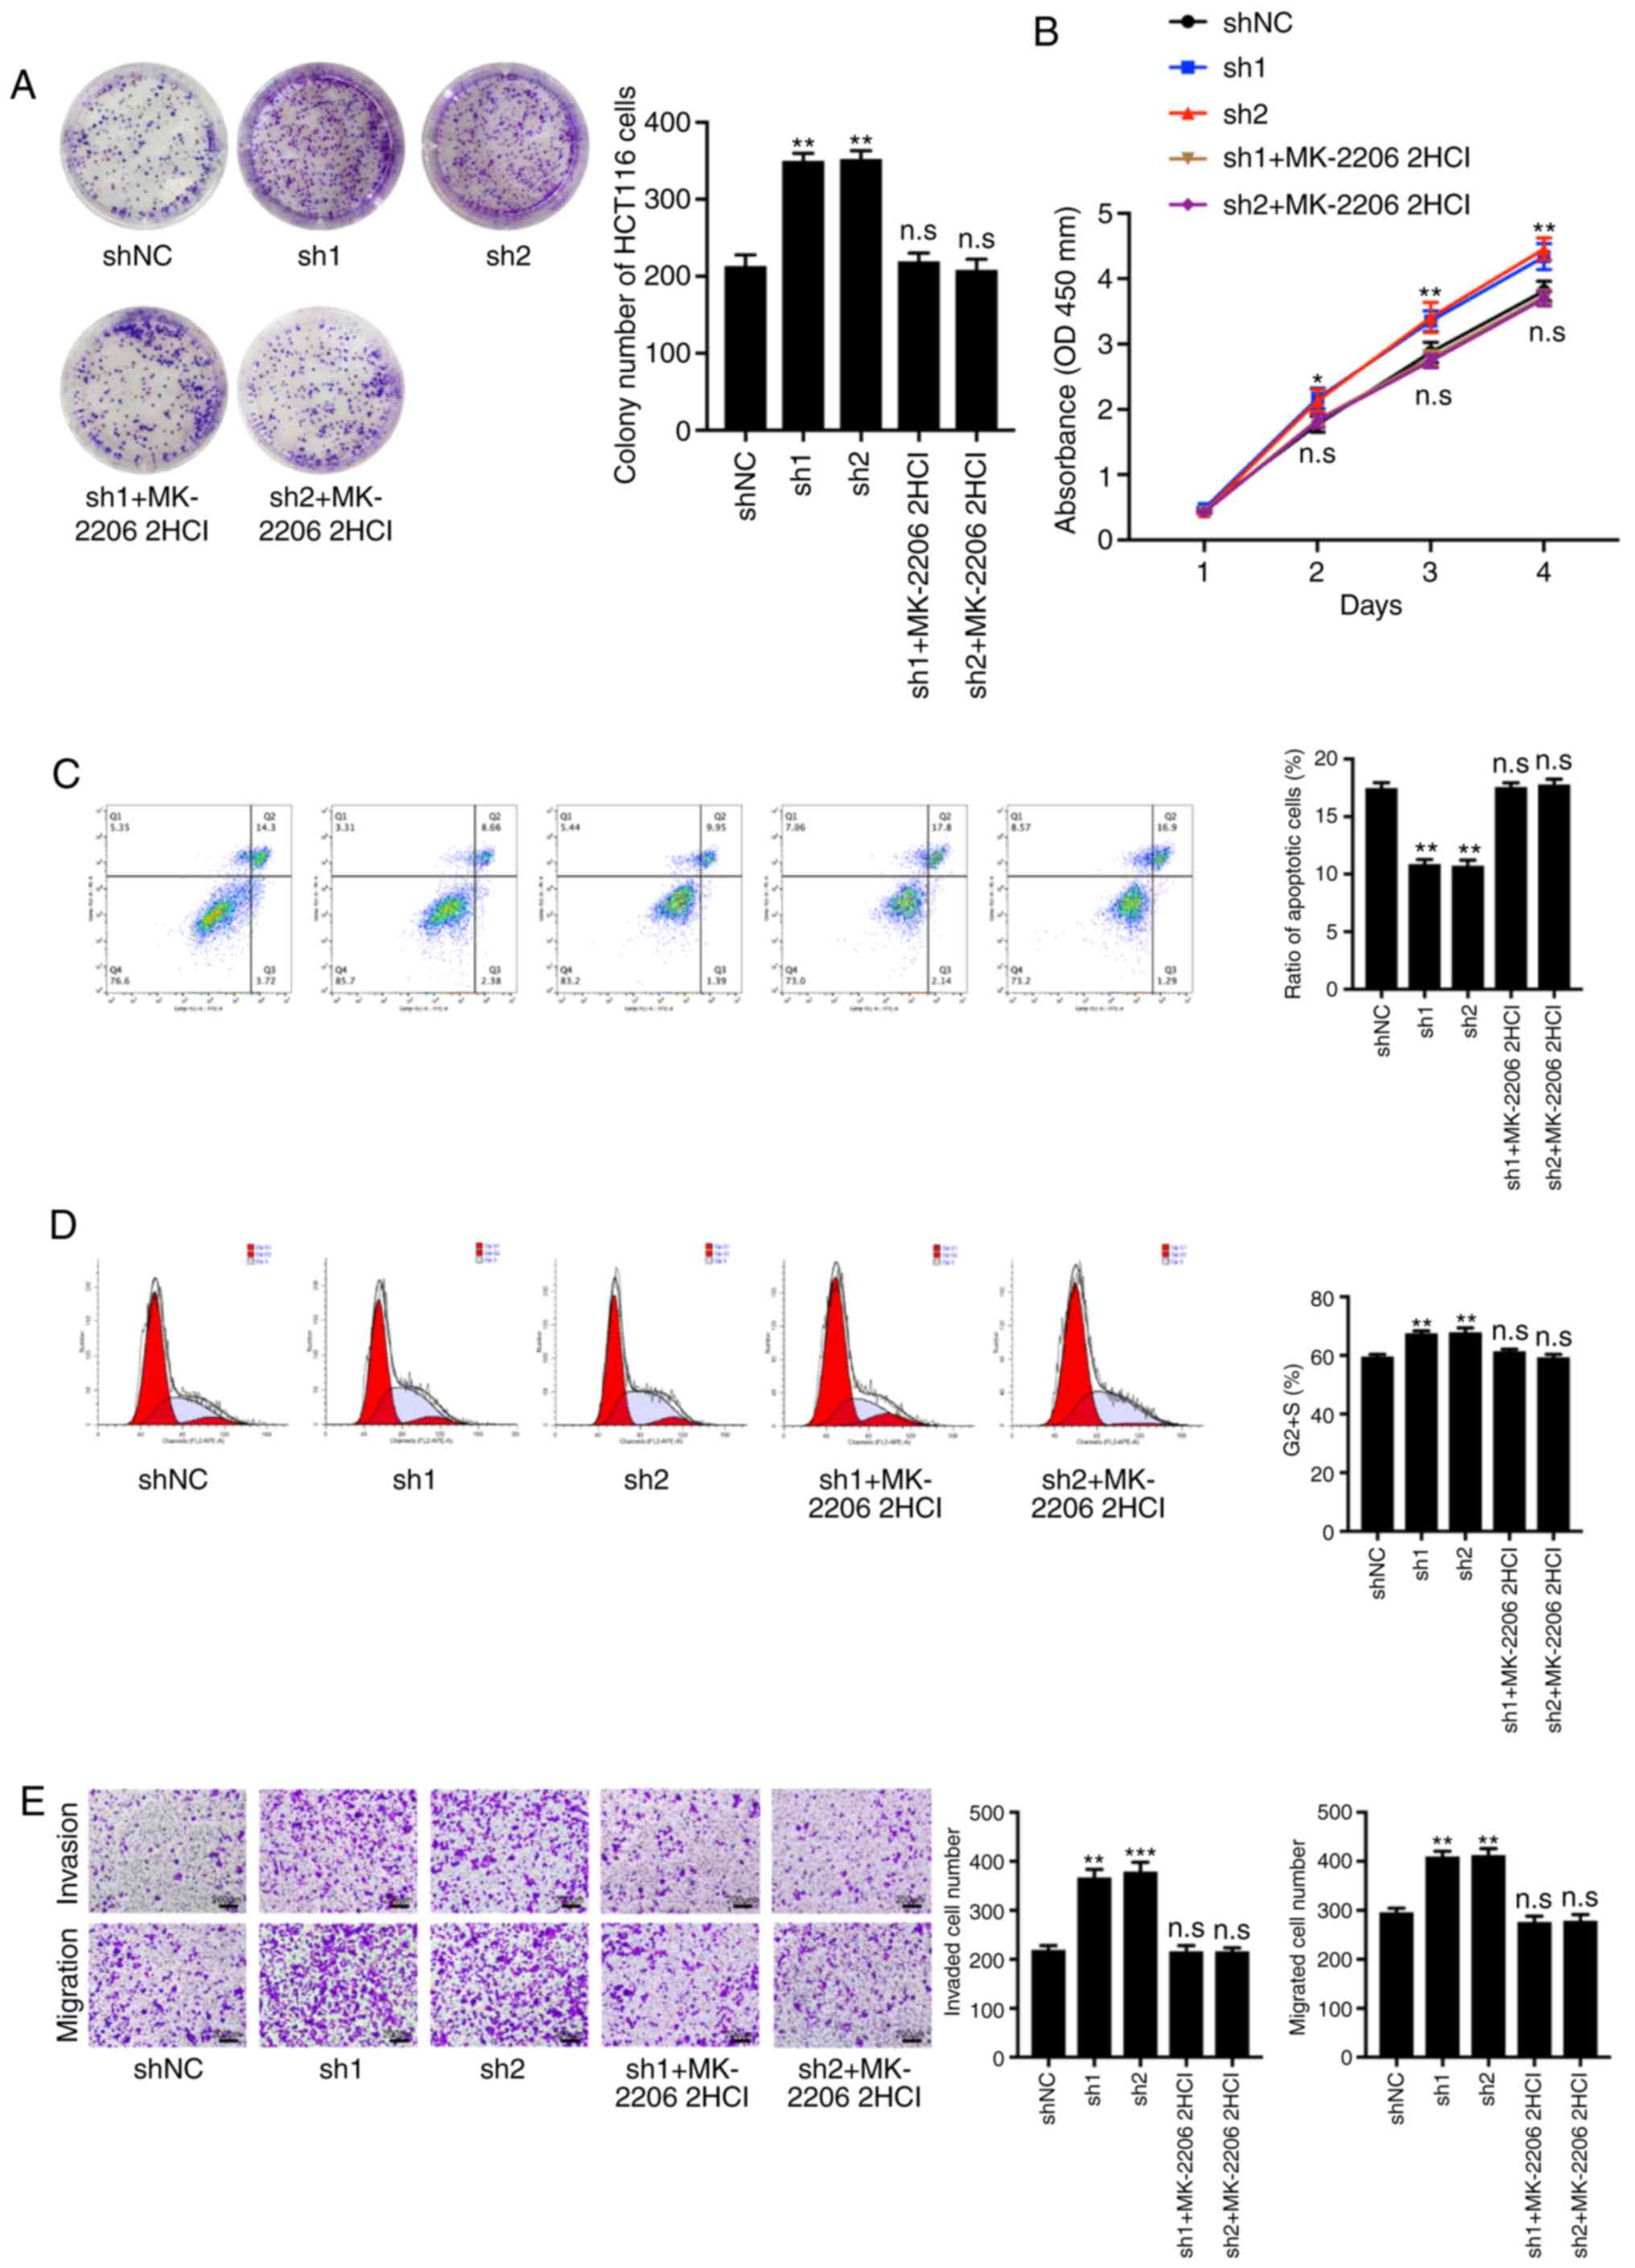 | Figure 8.Treatment with an AKT inhibitor,
MK-2206 2HCl, reverses the phenotype caused by TGM3 knockdown. (A)
Colony-forming abilities of HCT116 cells in the different groups
(shNC, sh1, sh2 and sh1+MK-2206 2HCl). (B) The Cell Counting Kit-8
assay was utilized to detect viability of HCT116 cells in the
different groups (shNC, sh1, sh2 and sh1+MK-2206 2HCl). (C) cell
apoptosis ratio and (D) the cell cycle distribution of HCT116 cells
in the different groups (shNC, sh1, sh2 and sh1+MK-2206 2HCl) were
measured using FACs. (E) The quantity of invasive and migrated
HCT116 cells through the membrane in the different groups (shNC,
sh1, sh2 and sh1+MK-2206 2HCl) is presented. *P<0.05 and
**P<0.01 and ***P<0.001; n.s, not significant. NC, negative
control sequence; sh, short hairpin; TGM3, transglutaminase 3;
MK-2206 2HCl, AKT inhibitor. |
Discussion
Transglutaminases (TGMs) are a family of
calcium-dependent enzymes that catalyze the formation of isopeptide
bonds (3,11). Transglutaminase 3 (TGM3), an
epidermal transglutaminase expressed predominantly in the
suprabasal layers of the stratified squamous epithelium, has been
reported as a regulatory protein in a number of different types of
cancer, and to serve as a prognostic biomarker (4–7).
However, the role of TGM3 in colorectal cancer (CRC) and the
underlying molecular mechanism remain unknown.
Epithelial-to-mesenchymal transition (EMT), a widely
studied process involving the alteration of epithelial cells to
mesenchymal cells (12), is
considered to be critical in the proliferation and metastasis of
various types of cancer. This process involves the acquisition of
the expression of mesenchymal molecules, such as vimentin and
N-cadherin, together with the loss of epithelial cell adhesion
molecules, such as E-cadherin (11,12).
The present study verified that TGM3 regulated the biological
functions of CRC cells via modulating the EMT process by assessing
the expression of classical EMT markers via western blotting. A
number of signaling pathways have been reported to be involved in
the regulation of the EMT process, among which PI3K/AKT is the most
notable (13,14). The present study then aimed to
assess whether PI3K/AKT is necessary for TGM3-induced inhibition of
the EMT process. As expected, phosphorylation of both PI3K and AKT
were decreased following overexpression of TGM3, and increased
following knockdown of TGM3. Nevertheless, more in-depth studies
are required in order to elucidate the association between TGM3,
EMT and the PI3K/AKT signaling pathway.
In summary, the present study focused on the novel
molecule TGM3, which was significantly downregulated and positively
correlated with the outcome in patients with CRC. Furthermore,
evidence provided by in vitro and in vivo assays
confirmed that TGM3 could repress the proliferation and metastasis
of CRC by regulating the EMT process by inhibiting the PI3K/AKT
signaling pathway.
Acknowledgements
Not applicable.
Funding
Not applicable.
Availability of data and materials
The analyzed data sets generated during the study
are available from the corresponding author on reasonable
request.
Authors' contributions
YF and DJ conducted the research. YF, YH, BJ and YZ
performed the in vitro experiments. YH, JL, WP and CZ
performed the in vivo experiments. YF, DJ, YH and DZ performed the
data collection and analyses. YS and ZX designed the experiments
and supervised the procedures and wrote the manuscript. All authors
read and approved the manuscript and agree to be accountable for
all aspects of the research in ensuring that the accuracy or
integrity of any part of the work are appropriately investigated
and resolved.
Ethics approval and consent to
participate
All tissues were supplied by the tissue bank of the
First Affiliated Hospital of Nanjing Medical University (ethical
approval no. 2010-SR-091.A1). All animal experiments were approved
by the Animal Ethics Committee of Nanjing Medical University.
Patient consent for publication
Not applicable.
Competing interests
The authors declare that they have no competing
interests.
References
|
1
|
Torre LA, Bray F, Siegel RL, Ferlay J,
Lortet-Tieulent J and Jemal A: Global cancer statistics, 2012. CA
Cancer J Clin. 65:87–108. 2015. View Article : Google Scholar : PubMed/NCBI
|
|
2
|
Siegel R, DeSantis C, Virgo K, Stein K,
Mariotto A, Smith T, Cooper D, Gansler T, Lerro C, Fedewa S, et al:
Cancer treatment and survivorship statistics, 2012. CA Cancer J
Clin. 62:220–241. 2012. View Article : Google Scholar : PubMed/NCBI
|
|
3
|
Griffin M, Casadio R and Bergamini CM:
Transglutaminases: Nature's biological glues. Biochem J.
368:377–396. 2002. View Article : Google Scholar : PubMed/NCBI
|
|
4
|
Candi E, Schmidt R and Melino G: The
cornified envelope: A model of cell death in the skin. Nat Rev Mol
Cell Biol. 6:328–340. 2005. View
Article : Google Scholar : PubMed/NCBI
|
|
5
|
Uemura N, Nakanishi Y, Kato H, Saito S,
Nagino M, Hirohashi S and Kondo T: Transglutaminase 3 as a
prognostic biomarker in esophageal cancer revealed by proteomics.
Int J Cancer. 124:2106–2115. 2009. View Article : Google Scholar : PubMed/NCBI
|
|
6
|
Wu X, Cao W, Wang X, Zhang J, Lv Z, Qin X,
Wu Y and Chen W: TGM3, a candidate tumor suppressor gene,
contributes to human head and neck cancer. Mol Cancer. 12:1512013.
View Article : Google Scholar : PubMed/NCBI
|
|
7
|
Li W, Zhang Z, Zhao W and Han N:
Transglutaminase 3 protein modulates human esophageal cancer cell
growth by targeting the NF-KB signaling pathway. Oncol Rep.
36:1723–1730. 2016. View Article : Google Scholar : PubMed/NCBI
|
|
8
|
Nieto MA, Huang RY, Jackson RA and Thiery
JP: EMT: 2016. Cell. 166:21–45. 2016. View Article : Google Scholar : PubMed/NCBI
|
|
9
|
De Craene B and Berx G: Regulatory
networks defining EMT during cancer initiation and progression. Nat
Rev Cancer. 13:97–110. 2013. View
Article : Google Scholar : PubMed/NCBI
|
|
10
|
Larue L and Bellacosa A:
Epithelial-mesenchymal transition in development and cancer: Role
of phosphatidylinositol 3′ kinase/AKT pathways. Oncogene.
24:7443–7454. 2005. View Article : Google Scholar : PubMed/NCBI
|
|
11
|
Lorand L and Graham RM: Transglutaminases:
Crosslinking enzymes with pleiotropic functions. Nat Rev Mol Cell
Biol. 4:140–156. 2003. View
Article : Google Scholar : PubMed/NCBI
|
|
12
|
Radisky DC and LaBarge MA:
Epithelial-mesenchymal transition and the stem cell phenotype. Cell
Stem Cell. 2:511–512. 2008. View Article : Google Scholar : PubMed/NCBI
|
|
13
|
Thiery JP, Acloque H, Huang RY and Nieto
MA: Epithelial-mesenchymal transitions in development and disease.
Cell. 139:871–890. 2009. View Article : Google Scholar : PubMed/NCBI
|
|
14
|
Yang J and Weinberg RA:
Epithelial-mesenchymal transition: At the crossroads of development
and tumor metastasis. Dev Cell. 14:818–829. 2008. View Article : Google Scholar : PubMed/NCBI
|