Introduction
Almost half of all anterior mediastinal tumors (47%)
are thymic epithelial tumors (TETs) (1,2). The
2014 consensus statement of the International Thymic Malignancy
Interest Group on the histological classification of TETs informed
the 2015 update of the World Health Organization (WHO) TET
classification. According to this WHO classification, TETs can be
subdivided into thymoma (subtypes A, AB, B1, B2 and B3) and thymic
carcinoma (subtype C), in the order of increasing degree of
malignancy (3,4). In patients who have TETs with a low
risk of malignancy (subtypes A, AB and B1), complete surgical
resection without adjuvant or neoadjuvant chemotherapy is typically
sufficient. In contrast, patients who have TETs with a high risk of
malignancy (subtypes B2, B3 and C) require a combination of
treatments, including chemotherapy, radiotherapy, and/or surgical
resection (5,6). Pretreatment needle biopsy is a
reliable method of diagnosing TETs. However, a small biopsy
specimen may not always be representative of the entire tumor, and
deep biopsy is an invasive procedure that poses the risk of
complications (2,7).
Different imaging modalities have been used for the
preoperative assessment of TETs. The most common of these is
thoracic computed tomography (CT) with intravenous contrast
enhancement. On enhanced CT images, irregular contours,
heterogeneous enhancement, and mediastinal fat invasion strongly
suggest a high-risk TET (8–10). However, the value of qualitative CT
features in determining the degree of tumor invasiveness remains
controversial. Furthermore, the assessment of qualitative imaging
features is subjective and subject to inter-reader variability.
Therefore, an effective and objective approach for preoperative
determination of the subtype of TET is urgently required.
Radiomics is a field of medical research in which a
large amount of high-quality, quantitative, mineable data is
extracted from conventional medical images (11,12).
The application of radiomics techniques to further the development
of personalized medicine in the field of oncology has already
provided insights on the detection and classification of tumors,
and the assessment of therapeutic response (13). Objective and quantitative radiomics
signatures that may serve as prognostic biomarkers have already
been developed for tumors such as brain glioblastoma, breast cancer
and lung cancer (13–15). However, to date, only one study
(16) has investigated the
relationship between CT-based radiomics parameters and the
histological classification of TETs. Furthermore, that study
included only 16 patients and did not involve a comprehensive
quantitative texture analysis to reflect whole-tumor radiomics
characteristics.
Therefore, the purpose of our research was to
develop and validate a radiomics model that incorporated both the
radiomics signature and subjective CT features for individual
preoperative prediction of the pathological invasiveness of
TETs.
Materials and methods
Patient selection
The study protocol was approved by the Institutional
Review Boards of Jiangmen Central Hospital and The Fifth Affiliated
Hospital of Sun Yat-sen University. The need for informed consent
was waived as our study has a retrospective design. We searched the
electronic medical database of the two hospitals for the records of
all patients who underwent resection for thymic neoplasms and
histopathologic diagnosis between February 2009 and March 2019. The
following inclusion criteria were applied: i) histopathologically
confirmed primary TETs; ii) CT images available in the picture
archiving and communication system; iii) thoracic spiral CT scan
with intravenous contrast dual-phase enhancement was performed
within 4 weeks before surgery; iv) no history of prior resection
for thymic neoplasm or other malignant tumor, and v) no history of
biopsy, chemotherapy, or radiotherapy prior to the primary thoracic
CT scans.
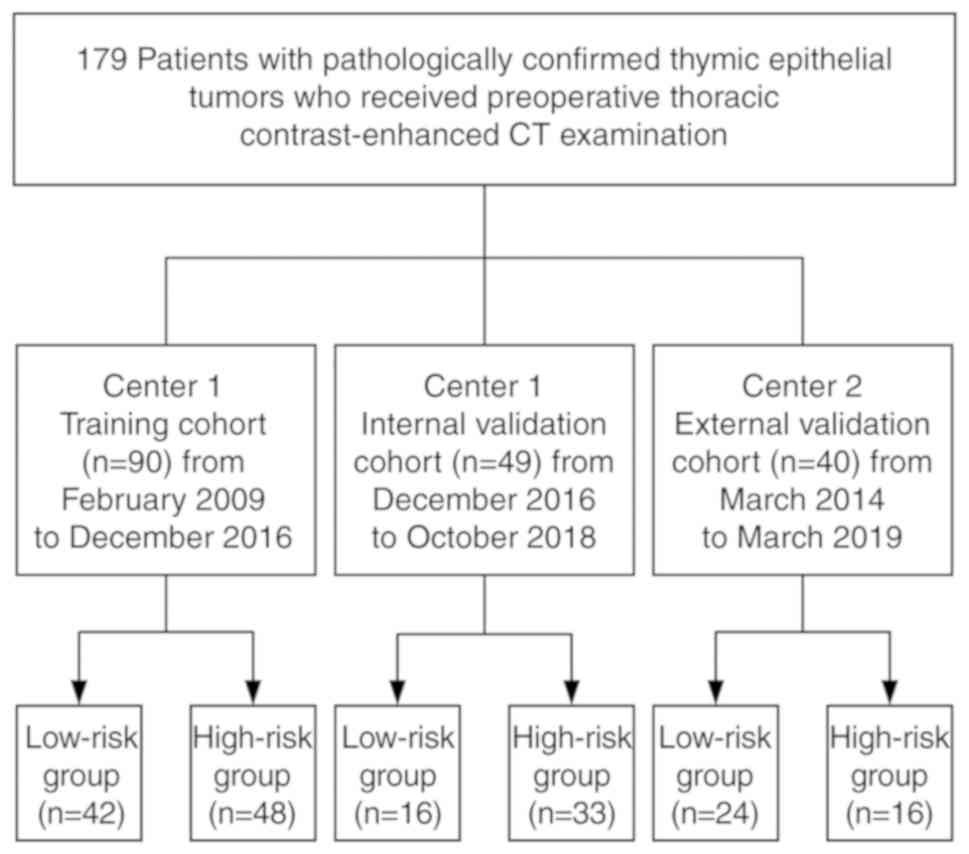
After the application of the selection criteria, we
enrolled 139 patients from center 1, including 69 men and 70 women.
The median age of the patients was 54 years (age range, 19–81
years). Between 25 February 2009 and 2 December 2016, 90 patients
(42 men, 48 women; median age, 53 years; age range, 19–81 years)
were identified, and these patients comprised the training cohort.
Between 15 December 2016 and 10 October 2018, 49 consecutive
patients (27 men, 22 women; median age, 55 years; age range, 26–75
years) were selected using the same criteria as those used for the
training cohort; these patients formed an internal validation
cohort. In center 2, 40 consecutive patients (21 men, 19 women;
median age, 57 years; age range, 28–83 years) were enrolled between
March 2014 and March 2019 using the same criteria as those used in
center 1, and constituted the external validation cohort. A
flowchart of the patient-selection process is shown in Fig. 1.
Thoracic contrast-enhanced CT scan
protocol
Chest CT was performed using four different CT
scanners: Aquilion One-64 (Toshiba Medical Systems), Somatom
Sensation-16 and Dual-energy Force (Siemens Medical Solutions), and
Discovery HD 750 (GE Medical Systems). The scanning parameters were
as follows: 120 kVp; 80–200 mAs; rotation time, 0.5 sec; field of
view, 350×350 mm; detector collimation, 64×0.625 mm or 16×0.6 mm;
and matrix, 512×512. Two different slice thicknesses of 3.0 mm
(n=164) and 2.5 mm (n=15) were obtained, and the corresponding
images were reconstructed using soft-tissue and lung kernels,
respectively.
CT scanning was conducted during a single deep
breath-hold, with the patient in a supine position. The scanning
field extended from the level of the thoracic inlet to the level of
the adrenal glands. First, a conventional plain CT scan was
obtained, and then, an iodinated contrast agent was injected into
the antecubital vein of the patient (Ultravist, Bayer Schering
Pharma; dose, 1.5 ml/kg; injection rate, 3.5–4.5 ml/sec). Enhanced
CT scans in the arterial and venous phases were obtained at 30 and
60 sec, respectively, after the injection of the contrast
material.
Analysis of subjective CT
findings
All CT scans were independently reviewed by two
radiologists, one with 10 years of experience (Reader 1) and the
other with 25 years of experience (Reader 2) in thoracic radiology.
Both radiologists were blinded to the clinical history and final
histopathological diagnosis. For lesion evaluation, they reviewed
images obtained using both the mediastinal [level, 30 HU
(hounsfield unit); width, 350 HU] and lung (level, −600 HU; width,
1500 HU) window settings.
Subjective CT findings were evaluated as follows: i)
location (left, right, or midline in the anterior mediastinum); ii)
diameter (average of the maximum long axis and the maximum short
axis perpendicular to the long axis in the same transverse
cross-sectional slice); iii) margin (regular or irregular), iv)
calcification (absent or present); v) enhancement pattern
(homogeneous or heterogeneous); vi) enhancement degree (none,
minimal, moderate, or severe), and vii) infiltration (absent or
present). Minimal, moderate, and severe enhancement was defined as
enhancement less than, equal to, and greater than that of the
chest-wall muscle, respectively (17). Infiltration was defined as the
disappearance of the fat-density plane between the tumor and the
adjacent tissue (18). Consensus
was reached through discussion.
Inter-reader agreement and subjective
findings model
Interobserver agreement for the evaluation of the
subjective findings was determined using the Cohen kappa test as
follows: κ<0.00, poor agreement; κ=0.00–0.20, slight agreement;
κ=0.21–0.40, fair agreement; κ=0.41–0.60, moderate agreement;
κ=0.61–0.80, substantial agreement; and κ=0.81–1.00, almost perfect
agreement (19).
Age, sex, and subjective CT findings (lesion
location, diameter, margin, calcification, enhancement pattern,
enhancement degree, and infiltration) were compared between study
groups by using the t-test, Chi-square test, or Mann-Whitney U
test, as required. Variables that were found to be significant on
univariate analysis were entered into multivariate logistic
regression analysis. The results were used to construct a model of
the subjective findings.
Pathological diagnosis
The median time between CT imaging and surgery was
18 days. Complete resection was achieved in 159 (88.8%) patients
and incomplete resection was achieved in 20 (11.2%) patients. TET
specimens were fixed with formalin and stained with hematoxylin and
eosin. Pathological analysis was performed by two pathologists, one
with 10 years of experience and the other with 15 years of
experience in thoracic pathological analysis. Both pathologists
were blinded to the clinical history and chest CT findings. TETs
were evaluated and classified according to the
epithelial-tumor-cell morphology, relative proportion of the
nontumoral lymphocytic component, immunohistochemical findings, and
degree of resemblance to the normal thymic structure. The tumors
were subdivided into a low-risk group (subtypes A, AB and B1) and a
high-risk group (subtypes B2, B3 and C) according to the 2015 WHO
histological classification (3,4). All
tumors were also staged according to the Masaoka-Koga
clinical-pathologic staging system (2).
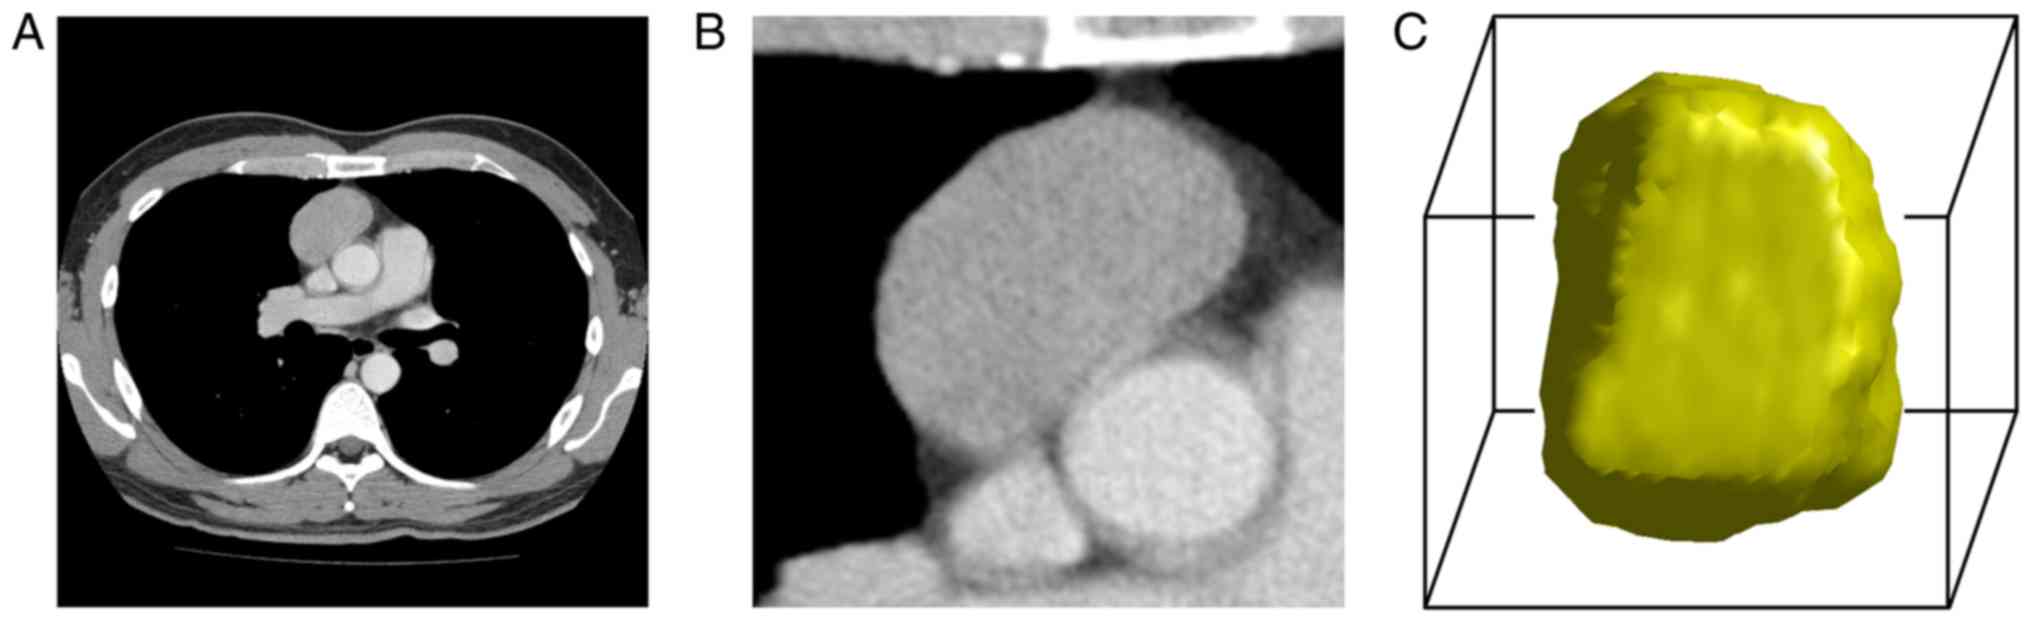
Volume of interest segmentation
Volume of interest (VOI) segmentations were manually
implemented by the same two readers who assessed the subjective CT
findings. Using our in-house tool developed on MATLAB 2016
(Mathworks), the TET lesions were manually delineated on
venous-phase axial CT images because most TETs exhibit significant
enhancement and relatively clear margins in this phase. Contouring
was performed slightly within the tumor borders in order to avoid
the adjacent tissues, such as mediastinal fat, tracheal, vessel,
and lung tissues. For lesions that were ambiguous in the axial
plane, the corresponding sagittal and coronal planes were
referenced. Whole tumor volume was contoured on two-dimensional
images. For each lesion, two VOIs were obtained. Grayscale
discretization and isotropic resampling were used to reconstruct
the VOIs (Fig. 2).
Radiomics feature extraction and
radiomics signature model
We extracted 10,394 three-dimensional radiomics
features that were based on factors such as shape, intensity,
texture, and wavelets. Feature extraction was performed using our
in-house software developed with MATLAB 2016 (Mathworks). We
randomly selected 20 patients in the training cohort, and Readers 1
and 2 performed tumor segmentations for these patients. Reader 1
repeated this same procedure 1 week later. Intraclass coefficients
(ICCs) were calculated to assess the interobserver and
intraobserver reproducibility of the extracted radiomics features.
The remaining TET lesions were segmented by Reader 1. Radiomics
features were extracted from all segmentations. The value of each
feature in distinguishing between high- and low-risk TETs was
determined using the Mann-Whitney U test. Features that
significantly differed between the low- and high-risk TETs and had
an intraclass coefficient (ICC) >0.75 were filtered using
Pearson correlation coefficient analysis and subjected to least
absolute shrinkage and selection operator (LASSO) logistic
regression with a 10-fold cross validation (20).
Radiomics features that were found to have non-zero
coefficients on LASSO logistic regression were subjected to Pearson
correlation analysis. Features with Pearson correlation
coefficients of <0.9 were selected as independent factors for
building a radiomics-signature model. We created the radiomics
signature via the linear combination of the chosen radiomics
features. For each patient, a radiomics score was calculated using
the linear combination of the chosen features, weighted according
to their coefficients (Appendix 1 and Table S1). The radiomics signature was
employed to construct a model for the detection of high-risk TETs
in the training cohort.
Combined model
Multivariate logistic regression analysis was
performed to construct a model including both relevant subjective
findings and the radiomics signature. Backward step-wise
elimination was used with the likelihood ratio test and Akaike
information criterion.
Model validation, performance, and
potential clinical value
Receiver operating characteristic (ROC) curve
analysis was used to evaluate the performances of all three models.
We calculated the sensitivity, specificity, positive and negative
predictive values (PPV and NPV, respectively), accuracy, and area
under the curve (AUC). Next, cutoff values were chosen such that
the sum of the sensitivity value and specificity value was
maximized. Finally, we compared the AUCs of the three models by
using the DeLong test. The calibrations of the subjective finding,
radiomics signature, and combined models were assessed using
calibration curves and the Hosmer-Lemeshow test. Moreover,
stratified analyses of clinical variables (sex, age, CT device, and
CT slice thickness) were carried out to assess the impact of the
combined model in the training, internal and external validation
cohorts.
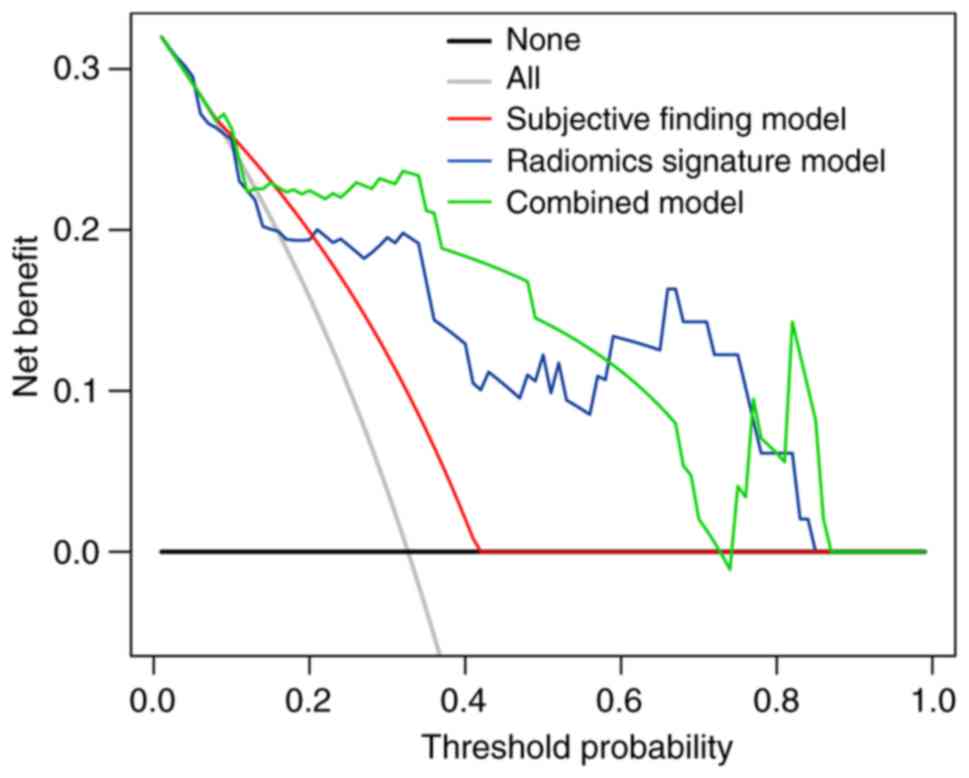
To estimate the clinical usefulness of the three
models, we quantified their net benefits for multiple threshold
probabilities by using decision-curve analysis (DCA) (21).
Statistical analysis
All statistical analyses were performed using R
software (v3.0.1; http://www.rproject.org) and MATLAB. LASSO analysis,
ROC curve analysis, Pearson correlation coefficient analysis, and
DCA were performed using the glmnet (https://cran.r-project.org/web/packages/glmnet/index.html),
pROC (https://www.rdocumentation.org/packages/pROC/versions/1.12.1),
cor function (https://www.rdocumentation.org/packages/stats/versions/3.4.1/topics/cor)
and dca.r (https://www.rdocumentation.org/packages/DecisionCurve/versions/1.4)
packages, respectively. Parametric differences between the low- and
high-risk groups were compared using the two-tailed t-test.
P<0.05 was considered to indicate a statistically significant
difference.
Results
General patient characteristics
In the two centers, there were 82 patients in the
low-risk TET group (type A, 20 patients; type AB, 41 patients; and
type B1, 21 patients), and 97 patients in the high-risk TET group
(type B2, 57 patients; type B3, 22 patients; and type C, 18
patients). We found no significant differences between the low-risk
and high-risk groups in terms of sex (training cohort, P=0.799;
internal validation cohort, P=0.617; external validation cohort,
P=0.796) and age (training cohort, P=0.898; internal validation
cohort, P=0.794; external validation cohort, P=0.744). The
locations of the TET lesions were as follows: Left anterior
mediastinum, 52 lesions; right anterior mediastinum, 69 lesions;
and midline anterior mediastinum, 58 lesions (Table I). Patient distribution according to
Masaoka-Koga stage were classified as follows: Stage I, 76
patients; stage II, 56 patients; stage III, 30 patients; stage IV,
17 patients.
 | Table I.Clinical characteristics and
subjective CT findings of the patients with TETs. |
Table I.
Clinical characteristics and
subjective CT findings of the patients with TETs.
|
| Training cohort
(n=90) |
| Internal validation
cohort (n=49) |
| External validation
cohort (n=40) |
|
|---|
|
|
|
|
|
|
|
|
|---|
|
Characteristics | Low-risk group
(n=42) | High-risk group
(n=48) | P-value | Low-risk group
(n=16) | High-risk group
(n=33) | P-value | Low-risk group
(n=24) | High-risk group
(n=16) | P-value |
|---|
| Sex, n |
|
|
|
|
|
|
|
|
|
|
Male | 19 | 23 | 0.799 | 8 | 19 | 0.617 | 13 | 8 | 0.796 |
|
Female | 23 | 25 |
| 8 | 14 |
| 11 | 8 |
|
| Age, median (range)
(years) | 56 (32–81) | 52 (19–73) | 0.898 | 53 (32–75) | 55 (26–64) | 0.794 | 56 (28–83) | 57 (29–80) | 0.744 |
| Location, n |
|
|
|
|
|
|
|
|
|
| Left | 15 | 11 | 0.370 | 4 | 9 | 0.628 | 7 | 6 | 0.021a |
| Right | 16 | 24 |
| 7 | 10 |
| 11 | 1 |
|
| Midline | 11 | 13 |
| 5 | 14 |
| 6 | 9 |
|
| Diameter (mean ±
SD) in cm | 4.78±2.17 | 4.77±2.04 | 0.926 | 4.14±1.92 | 3.27±1.78 | 0.141 | 5.40±4.49 | 3.74±1.36 | 0.090 |
| Margin, n |
|
|
|
|
|
|
|
|
|
|
Regular | 31 | 23 | 0.012a | 11 | 10 | 0.011a | 18 | 7 | 0046a |
|
Irregular | 11 | 25 |
| 5 | 23 |
| 6 | 9 |
|
| Calcification,
n |
|
|
|
|
|
|
|
|
|
|
Absent | 30 | 32 | 0.626 | 13 | 20 | 0.148 | 20 | 12 | 0.809 |
|
Present | 12 | 16 |
| 3 | 13 |
| 4 | 4 |
|
| Enhancement
pattern, n |
|
|
|
|
|
|
|
|
|
|
Homogeneous | 16 | 12 | 0.181 | 6 | 13 | 0.898 | 7 | 3 | 0.709 |
|
Heterogeneous | 26 | 36 |
| 10 | 20 |
| 17 | 13 |
|
| Enhancement degree,
n |
|
|
|
|
|
|
|
|
|
|
None | 0 | 1 | 0.491 | 0 | 1 | 0.198 | 1 | 0 | 0.094 |
|
Minimal | 12 | 19 |
| 3 | 8 |
| 7 | 4 |
|
|
Moderate | 20 | 20 |
| 1 | 9 |
| 8 | 11 |
|
|
Severe | 10 | 8 |
| 12 | 15 |
| 8 | 1 |
|
| Infiltration,
n |
|
|
|
|
|
|
|
|
|
| Absent | 36 | 19 |
<0.001a | 11 | 10 | 0.011a | 19 | 6 | 0.008a |
| Present | 6 | 29 |
| 5 | 23 |
| 5 | 10 |
|
| Rad-score,
median | 1.025 | −1.334 |
<0.001a | 0.587 | −1.402 |
<0.001a | 0.613 | 0.454 | 0.009a |
| (interquartile
range) | (0.621 to
1.747) | (−2.468 to
−0.604) |
| (−0.444 to
1.381) | (−2.286 to
−0.690) |
| (0.538 to
0.664) | (0.335 to
0.516) |
|
|---|
Subjective-finding model
In the training cohort, the mean tumor diameter did
not significantly differ between the low-risk (4.78±2.17 cm) and
high-risk tumors (4.77±2.04 cm; P=0.926). Irregular margins were
significantly more frequent in high-risk tumors (n=25) than in
low-risk tumors (n=11; P=0.012). Calcifications were slightly less
common in low-risk tumors (n=12) than in high-risk tumors (n=16),
although the difference was not significant (P=0.626).
Additionally, there were no significant differences in the pattern
(P=0.181) and degree of enhancement (P=0.491) on venous-phase CT
images between the two study groups. Infiltration was significantly
less frequent in low-risk tumors (n=6) than in high-risk tumors
(n=29; P<0.001). These findings in the internal and external
validation cohorts were similar. Patient characteristics in the
training and two validation cohorts are presented in Table I.
Using multivariate logistic regression, we
identified infiltration [odds ratio (OR), 0.109; 95% confidence
interval (CI): 0.039–0.309; P<0.001] as an independent predictor
in the subjective findings model. The interobserver agreement for
various qualitative subjective CT features of TETs ranged from
κ=0.557 to κ=0.972. Calcification showed perfect agreement
(κ=0.944, 95% CI: 0.879–0.972), while enhancement pattern (κ=0.798,
95% CI: 0.692–0.876) and enhancement degree (κ=0.728, 95% CI:
0.623–0.830) showed substantial agreement. Lesion margins (κ=0.656,
95% CI: 0.557–0.786) and infiltration (κ=0.670, 95% CI:
0.560–0.738) showed moderate agreement.
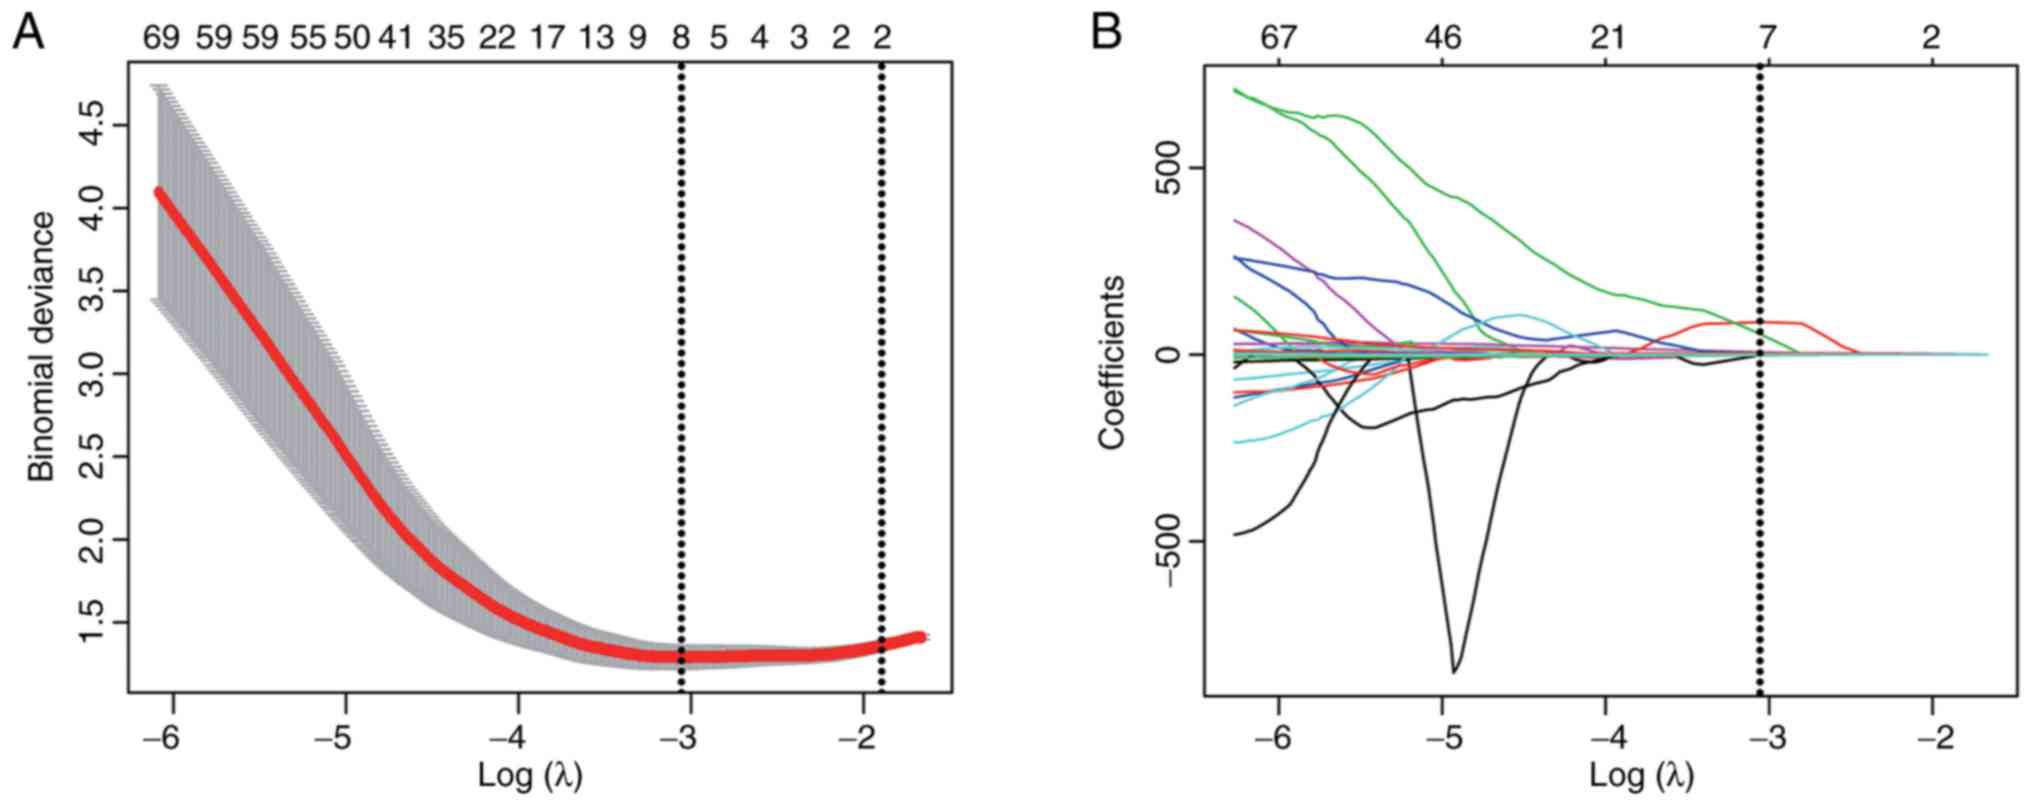
Radiomics feature selection and
radiomics signature
Of the 10,394 radiomics features, 294 had ICC values
between 0.75 and 1.0 and showed significant differences between the
low-risk and high-risk groups (P=1.112×10⁻⁴−0.049) in
the training cohort. These 294 features were subjected to LASSO
logistic regression, which identified 8 features with non-zero
coefficients. No repeatability was shown between these 8 radiomics
features through the Person correlation coefficient analysis
(Table SII). These 8 features were
used to create a formula for the calculation of a radiomics score
(Table II; Fig. 3). The radiomics score thus
calculated significantly differed between the low-risk and
high-risk tumors in the training (P<0.001), internal validation
(P<0.001) and external validation cohorts (P=0.009) (Table I; Fig.
4).
| Table II.Eight radiomics features with
non-zero LASSO coefficients in the training cohort. |
Table II.
Eight radiomics features with
non-zero LASSO coefficients in the training cohort.
|
Characteristics | Low-risk group
(n=42) | High-risk group
(n=48) | P-value |
|---|
|
GLSZM_SZE_0.5_1.5_Lloyd_32 | 0.676±0.040 | 0.659±0.024 | 0.048a |
|
GLSZM_SZHGE_0.5_2_Lloyd_8 | 9.010±1.726 | 8.061±1.906 | 0.010a |
|
GLCM_Variance_1_1.2_Equal_16 | 0.077±0.002 | 0.076±0.002 | 0.019a |
|
GLCM_Variance_1_2_Lloyd_32 | 0.018±0.011 | 0.014±0.006 | 0.032a |
|
GLCM_Variance_1.5_1.2_Equal_16 | 0.077±0.002 | 0.077±0.002 | 0.026a |
|
GLRLM_HGRE_1.5_0.67_Lloyd_8 | 25.550±2.914 | 23.369±2.443 |
<0.001a |
| Eccentricity | 0.716±0.092 | 0.666±0.099 | 0.008a |
| Solidity | 0.795±0.109 | 0.707±0.105 |
<0.001a |
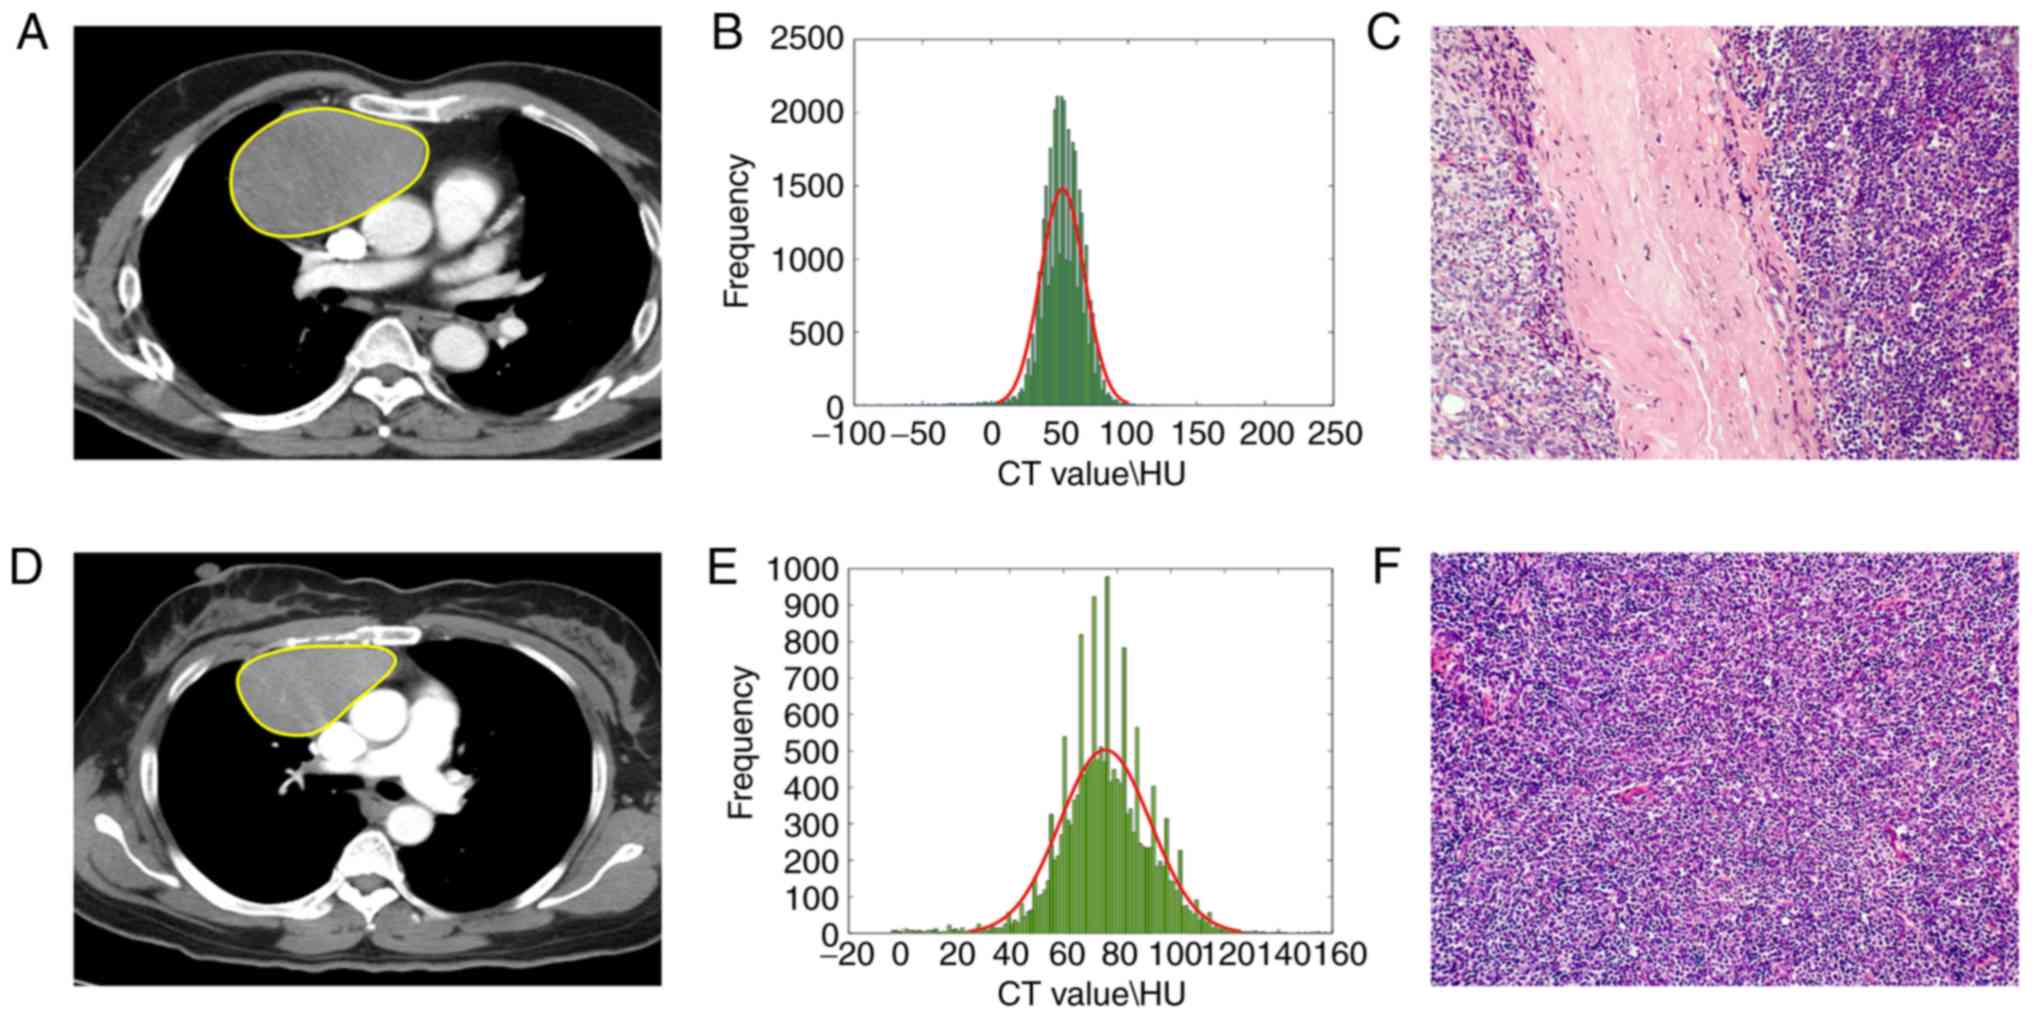
Among the 8 selected features, the shape-related
features eccentricity and solidity had smaller values for high-risk
tumors than for low-risk tumors. The texture-related features small
zone emphasis_gray level size zone matrix (SZE_GLSZM), small zone
high gray-level emphasis_gray level size zone matrix (SZHGE_GLSZM)
and high gray-level run emphasis_gray-level run-length matrix
(HGRE_GLRLM) also had smaller values for the high-risk tumors than
for the low-risk tumors. Variance of the gray-level co-occurrence
matrix (GLCM) under low gray-scale ranges, a texture spatial
distribution-related feature, had larger values for low-risk tumors
than for high-risk tumors (Table
II).
Model construction and
performance
Multivariate analysis revealed that infiltration
(OR, 0.208; 95% CI: 0.047–0.930; P=0.040) and the radiomics
signature (OR, 7.444; 95% CI: 2.981–18.585; P<0.001) were
independent predictors of high-risk TETs (Table III). Therefore, we developed three
models: One based on infiltration alone (subjective finding model),
one based on the radiomics signature alone (radiomics signature
model), and one based on the combination of these two factors
(combined model).
| Table III.Multivariate logistic regression
analysis of parameters for distinguishing between low-risk and
high-risk TETs. |
Table III.
Multivariate logistic regression
analysis of parameters for distinguishing between low-risk and
high-risk TETs.
| Intercept and
variable | β | Odds ratio (95%
CI) | P-value |
|---|
| Intercept | 0.573 |
| 0.212 |
| Infiltration | −1.570 | 0.208
(0.047–0.930) | 0.040a |
| Radiomics
signature | 2.007 | 7.444
(2.981–18.585) |
<0.001a |
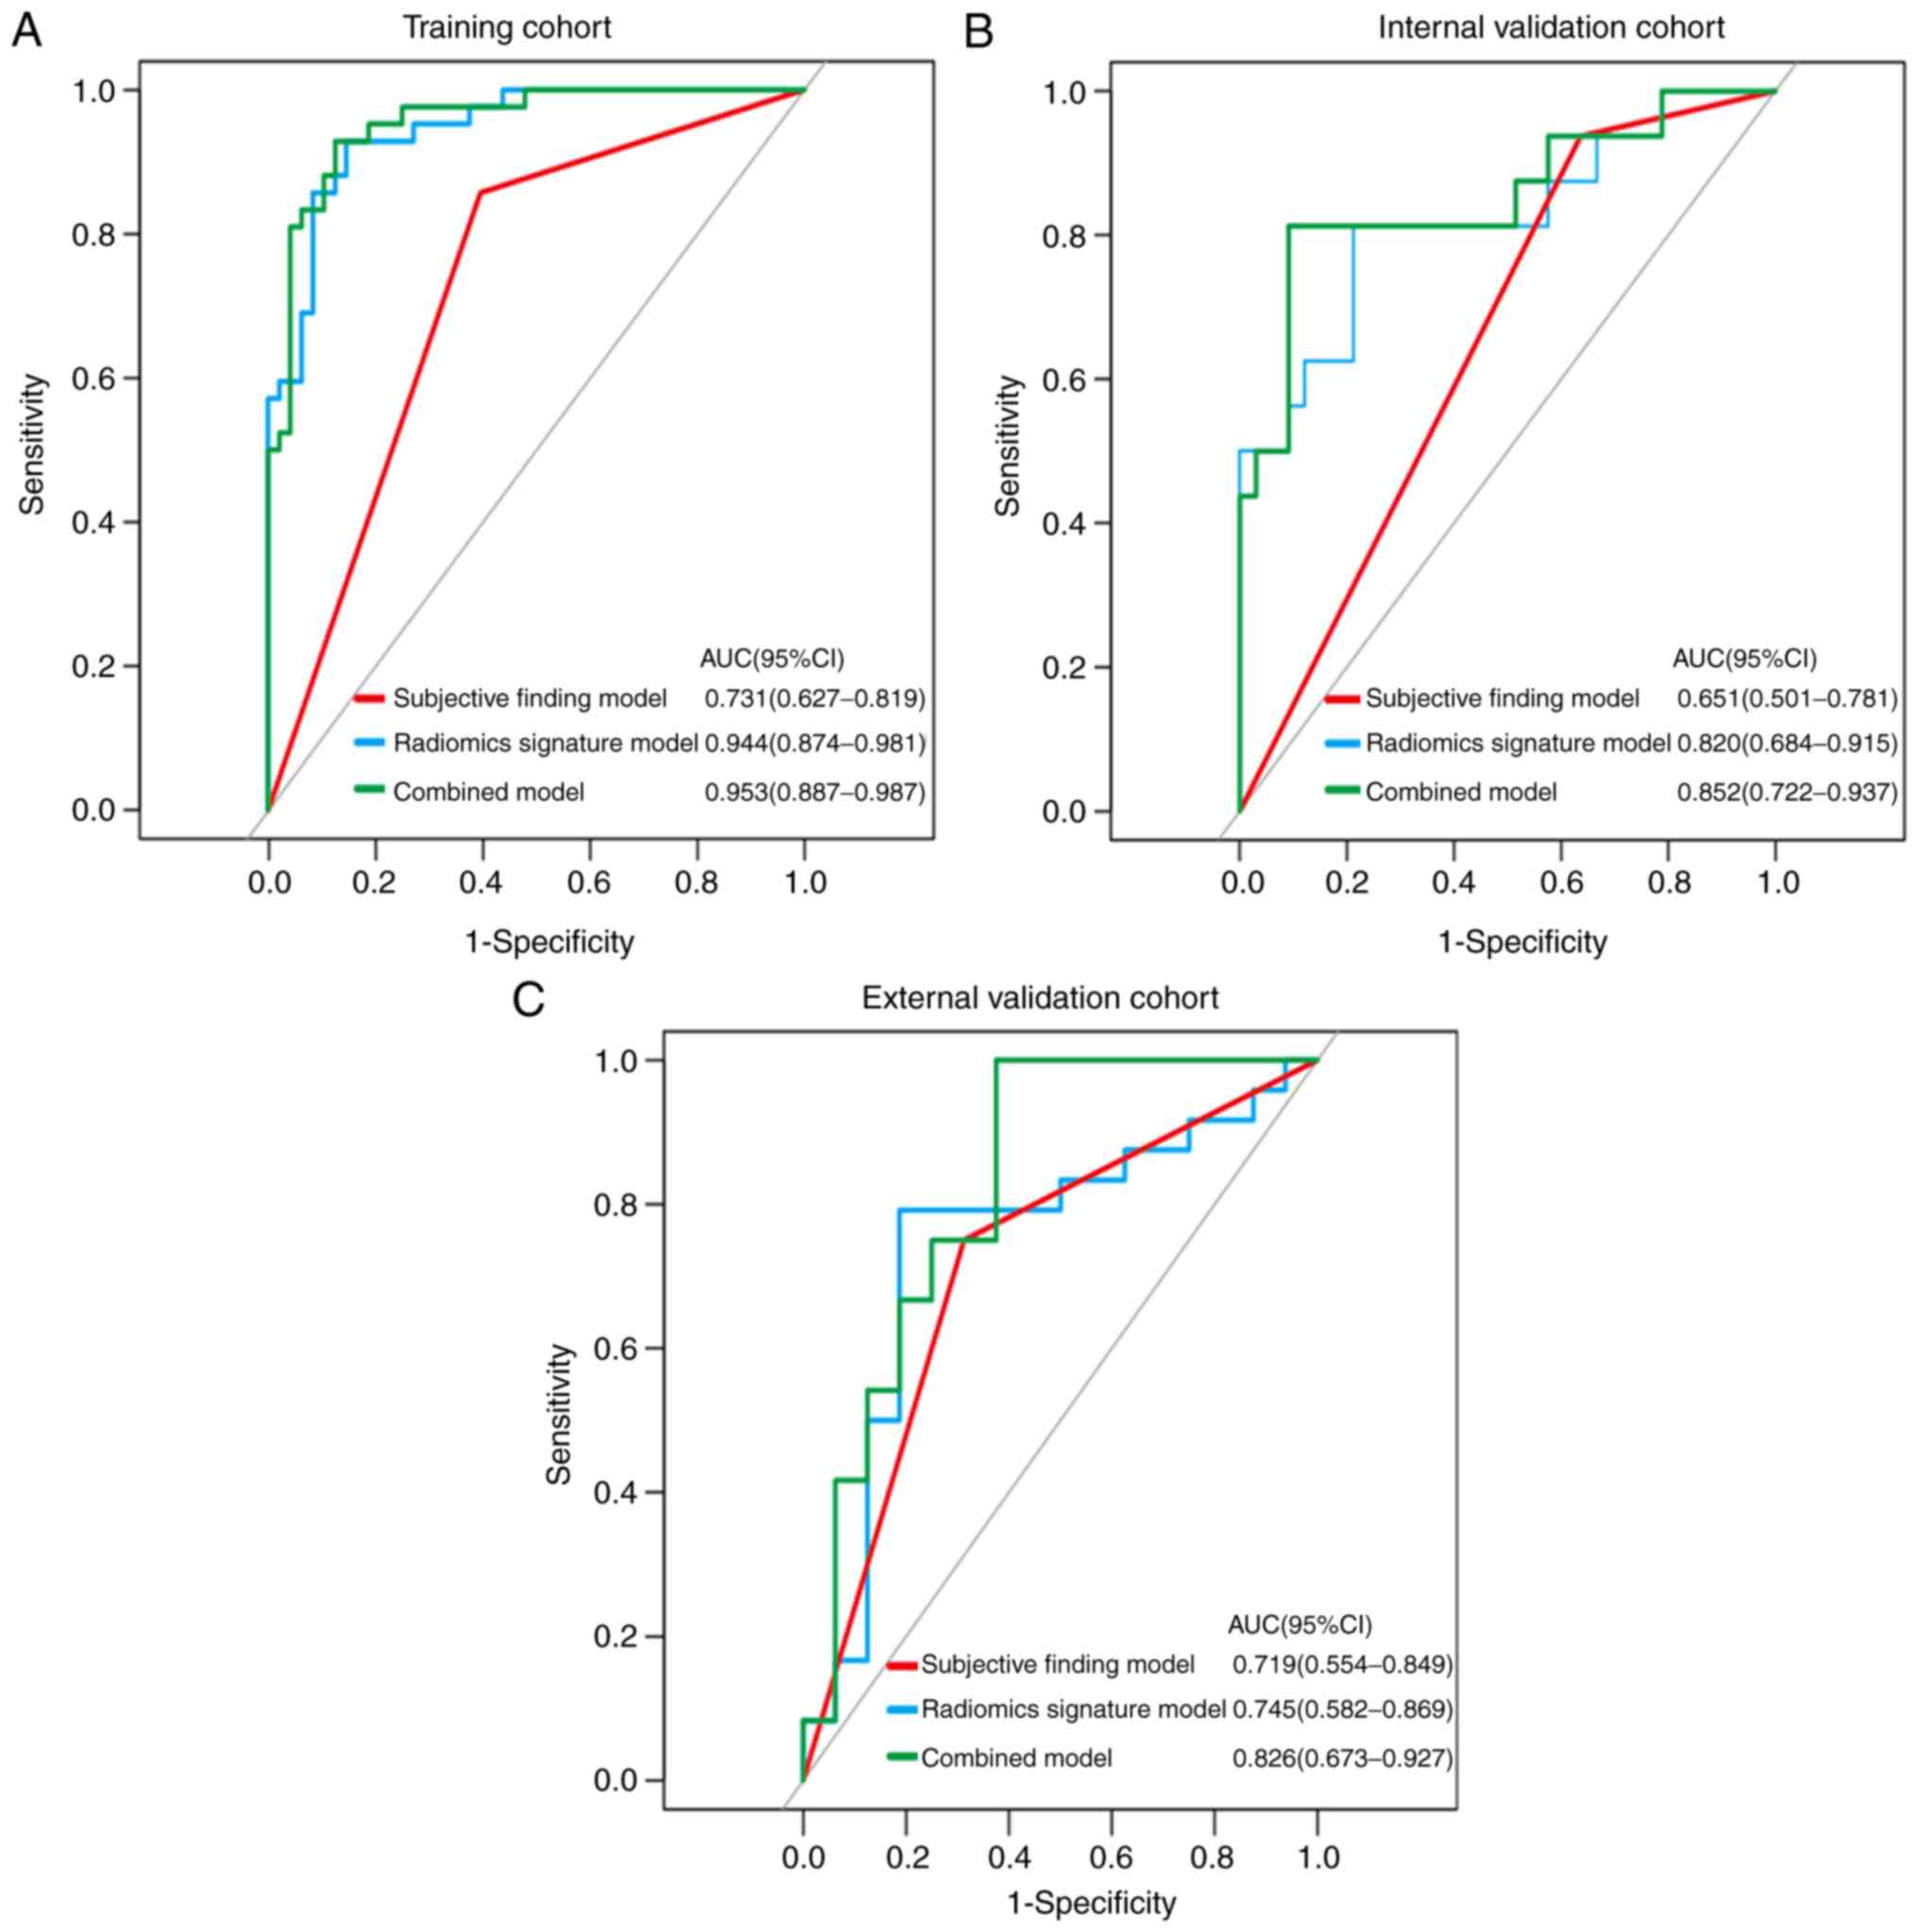
In the training cohort, sensitivity, specificity,
accuracy, PPV and NPV were lower in the subjective finding model
than in the radiomics signature and combined models. The cut-off
values for the subjective finding model, radiomics signature model,
and combined model were 0.1710, −0.3534 and 0.3923, respectively.
The AUC value of the subjective finding model (0.731, 95% CI:
0.627–0.819) was significantly lower than the AUC values of the
radiomics signature model (0.944, 95% CI: 0.874–0.981; P<0.001)
and the combined model (0.953, 95% CI, 0.887–0.987; P<0.001).
However, no significant difference was found between the AUCs of
the radiomics signature and combined models (P=0.266). The
diagnostic performance of each model and their ROC curves were
summarized in Table IV and
Fig. 5. The calibration curves for
each model demonstrated good agreement. The Hosmer-Lemeshow tests
were not significant (all P>0.05), representing a good fit
(Table SIII, Fig. S1). As shown in Fig. S2, the stratified analysis (Appendix
2) showed that the performance of the combined model was not
affected by sex, age, CT device, or CT slice thickness (Delong
test; P>0.05).
| Table IV.Diagnostic performances of the three
models in the training, internal and external validation
cohorts. |
Table IV.
Diagnostic performances of the three
models in the training, internal and external validation
cohorts.
|
| Training cohort
(n=90) | Internal validation
cohort (n=49) | External validation
cohort (n=40) |
|---|
|
|
|
|
|
|---|
|
| Subjective finding
model | Radiomics signature
model | Combined model | Subjective finding
model | Radiomics signature
model | Combined model | Subjective finding
model | Radiomics signature
model | Combined model |
|---|
| AUC (95% CI) | 0.731 | 0.944 | 0.953 | 0.651 | 0.820 | 0.852 | 0.719 | 0.745 | 0.826 |
|
| (0.627–0.819) | (0.874–0.981) | (0.887–0.987) | (0.501–0.781) | (0.684–0.915) | (0.722–0.937) | (0.554–0.849) | (0.582–0.869) | (0.673–0.927) |
| Sensitivity | 0.857 (36/42) | 0.929 (39/42) | 0.929 (39/42) | 0.938 (15/16) | 0.688 (11/16) | 0.813 (13/16) | 0.750 (18/24) | 0.792 (19/24) | 0.958 (23/24) |
| Specificity | 0.604 (29/48) | 0.854 (41/48) | 0.875 (42/48) | 0.364 (12/33) | 0.788 (26/33) | 0.909 (30/33) | 0.688 (11/16) | 0.813 (13/16) | 0.625 (10/16) |
| Accuracy | 0.722 (65/90) | 0.889 (80/90) | 0.900 (81/90) | 0.551 (27/49) | 0.755 (37/49) | 0.878 (43/49) | 0.725 (29/40) | 0.800 (32/40) | 0.825 (33/40) |
| PPV | 0.655 (36/55) | 0.848 (39/46) | 0.867 (39/45) | 0.417 (15/36) | 0.611 (11/18) | 0.813 (13/16) | 0.783 (18/23) | 0.864 (19/22) | 0.793 (23/29) |
| NPV | 0.829 (29/35) | 0.932 (41/44) | 0.933 (42/45) | 0.923 (12/13) | 0.839 (26/31) | 0.909 (30/33) | 0.647 (11/17) | 0.722 (13/18) | 0.909 (10/11) |
Clinical value of the models
DCA showed that the net benefit of the combined
model (threshold probability, 0.01–0.87) was greater than those of
the treat-all-patients and treat-no-patients schemes. Furthermore,
the net benefit of the combined model was greater than that of the
subjective finding model (0.01–0.42) and similar to that of the
radiomics signature model (0.01–0.84; Fig. 6).
Discussion
The preoperative prediction of the WHO histological
subtype of TETs may help determine whether surgical tumor resection
alone is sufficient or if preoperative adjuvant treatment is
required. In the present study, we investigated the ability of
enhanced CT-based radiomics analysis to predict the risk status of
patients with TETs. A radiomics model combining subjective findings
and a radiomics signature was established, and showed better
performance in the training and two validation cohorts than the
prediction model based on subjective findings. Thus, radiomics
features could serve as a noninvasive method to preoperatively
predict the risk of malignancy, which has implications for
treatment decisions.
Studies have shown that several CT features may be
helpful in differentiating the invasiveness of TET subtypes.
Tomiyama et al, found that tumor size did not significantly
differ among the various TET subtypes (22). Another study revealed that
homogeneous enhancement tended to indicate a low risk of
malignancy, while heterogeneous enhancement indicated a high risk
of malignancy (17). However, these
density findings were not observed in our study. Sadohara et
al, reported that tumors with smooth contours likely carried a
low risk of malignancy (23).
Infiltration, which reflects invasion of the adjacent structures,
suggests a high risk of malignancy (24). In the present study, lesion margins
and infiltration significantly differed between the two TET
subtypes in both the training and validation cohorts, which is
consistent with previous findings (9,23,24).
The major drawbacks of subjective radiological evaluation were
inter-reader variability and weak repeatability. Only moderate
interobserver agreement was found for the characterization of
margins and infiltration (κ=0.656 and 0.670, respectively), even
though two experienced thoracic radiologists performed the
assessments in our study. Thus, the current descriptive criteria
need to be replaced with more objective and quantitative
criteria.
Our combined model was constructed in a training
cohort of 90 patients (AUC, 0.953) and was confirmed to have a good
predictive performance in two validation cohorts (internal
validation, 49 patients, AUC: 0.852; external validation, 40
patients, AUC: 0.826). Two shape-related features, eccentricity and
solidity, were selected for the prediction of TET-risk status.
Eccentricity was a first-order shape feature obtained by
calculating the long axis-to-short axis ratio within the tumor
volume. This feature describes the image compactness, and its value
is 1 when the volume is close to a sphere. The greater eccentricity
in low-risk tumors than in high-risk tumors could be interpreted as
reflecting the expansive growth pattern and slow tumor-doubling
time in the former group (25,26).
Solidity is also a first-order shape feature that represents image
compactness. Solidity was determined by calculating the number of
voxels in the convex hull of the VOI. This feature also had higher
values in low-risk tumors than in high-risk tumors. This finding
could be explained by low-risk TETs being mostly
well-differentiated with a complete capsule and high-risk TETs
being typically poorly differentiated without a capsule (27,28).
These two quantitative radiomics parameters are based on 3D
segmentation and offer an advantage over viewing the lesion in a
single plane. Moreover, these features may distinguish and
characterize the morphological measures of the edge characteristics
of TETs more reproducibly and accurately than visual
assessment.
Textural radiomics parameters reflect the
intra-tumor heterogeneity and cannot be identified visually. In our
study, the variance of the GLCM under the low gray-scale range was
valuable for predicting the invasiveness of TETs. This variance was
greater in low-risk tumors than in high-risk tumors, probably
because more voxels with regular signal intensity spatial
distribution were required to represent low-grade, highly
differentiated tumor cells. The texture unit-related features
SZE_GLSZM, SZHGE_GLSZM, and HGRE_GLRLM had lower values in
high-risk tumors than in low-risk tumors, probably due to greater
tumor-cell accumulation, increased nucleocytoplasmic ratio, and
decreased extracellular space. The pathophysiological basis of
tumor invasiveness is complex and involves multiple mechanisms;
therefore, the precise relationship of pathological findings with
radiomics features, especially higher-order features, remains to be
fully elucidated (29).
Few studies have investigated the radiomics features
of TETs based on CT images (16).
We have created a highly prognostic radiomics model that was
validated in two independent datasets of TET patients. The
prediction ability of the radiomics model was greatly improved,
compared with that of the subjective finding model, and significant
differences were found between the AUCs of the two models in the
training, and internal and external validation cohorts (DeLong
test: P<0.0001, P=0.0187, P=0.0169, respectively). As the
information of subjective findings may only take into consideration
certain aspects of TETs, a better diagnostic performance can be
achieved by integrating subjective findings with radiomics features
to create a radiomics model. We used venous-phase images rather
than non-enhanced or arterial-phase images because venous-phase
images enable improved lesion visualization and accurate
segmentation of anterior mediastinal neoplasms, which are
surrounded by mediastinal fat tissue, large vessels, pleura, and
lung parenchyma. Moreover, venous-phase images have previously been
used to reveal enhancement heterogeneity for the radiomics analysis
of soft-tissue neoplasms, such as gastric cancer, renal tumor, and
hepatocellular cancer (30–32). We selected 3D radiomics features
over 2D features because the former provide comprehensive
information and improve the accuracy of radiomics-based predictions
(33). All extracted features with
ICC values >0.75 were analyzed using LASSO logistic regression
in our study.
The present study has certain limitations. First of
all, the retrospective study design was associated with selection
bias, and the sample size was relatively small, although datasets
from two hospitals were collected independently. A larger
prospective, multicenter study is required to validate our
preliminary results. Secondly, the use of four different CT
scanners may have influenced the evaluation of some CT findings
owing to partial volume effects. However, all patient CT images
were reconstructed using a slice thickness ≤3.0 mm, and multiplanar
reconstruction including coronal and sagittal planes was applied.
Moreover, there were no significant differences in the
stratification analyses of CT devices and CT slice thicknesses.
Thirdly, lesions were manually segmented slice-by-slice and
semi-automatically delineated. Further research and the development
of advanced, automated segmentation techniques are needed for more
widespread clinical implementation of radiomics-based prediction
models in the future. Finally, radiomics signatures were extracted
from enhanced CT images in our study since thoracic enhanced CT
scans are routinely performed for patients with clinical suspected
mediastinal masses. A radiomics model combining conventional CT
images with more detailed and informative imaging biomarkers as
well as positron emission tomography/computed tomography (PET/CT)
parameters could substantially enhance the predictive value in the
risk status of TETs. In the future, we will recruit more patients
to increase the sample size and include more patients with PET/CT
data to update our results.
In conclusion, our results suggest that enhanced
CT-based radiomics signature is a noninvasive, reliable, and
reproducible imaging marker that may help to assess the
pathological risk of TETs. Our combined model, which included both
the radiomics signature and a subjective finding, may greatly
facilitate the preoperative identification of low-risk and
high-risk TETs.
Supplementary Material
Supporting Data
Acknowledgements
Not applicable.
Funding
No funding was received.
Availability of data and materials
All data generated or analyzed during the present
study are included in this published article or are available from
the corresponding author on reasonable request.
Authors' contributions
Study concept and design were carried out by XC, ZL,
BF and WL. Literature research was collected by CL and YC. Clinical
studies were conducted by XC, XD, ZL, and CZ. Data and statistical
analyses were performed by CL and XD. XC, WL and BF guarantee the
integrity of the entire research study. All authors read and
approved the manuscript and agree to be accountable for all aspects
of the research in ensuring that the accuracy or integrity of any
part of the work are appropriately investigated and resolved.
Ethics approval and consent to
participate
The study protocol was approved by the Institutional
Review Boards of Jiangmen Central Hospital (Jiangmen, Guangdong,
China) and The Fifth Affiliated Hospital of Sun Yat-sen University
(Zhuhai, Guangdong, China). Informed consent was waived as the
study had a retrospective design.
Patient consent for publication
Not applicable.
Competing interests
The authors declare that they have no competing
interests.
References
|
1
|
Marom EM: Advances in thymoma imaging. J
Thorac Imaging. 28:69–83. 2013. View Article : Google Scholar : PubMed/NCBI
|
|
2
|
Fujii Y: Published guidelines for
management of thymoma. Thorac Surg Clin. 21:125–129. 2011.
View Article : Google Scholar : PubMed/NCBI
|
|
3
|
Marx A, Ströbel P, Badve SS, Chalabreysse
L, Chan JK, Chen G, de Leval L, Detterbeck F, Girard N, Huang J, et
al: ITMIG consensus statement on the use of the WHO histological
classification of thymoma and thymic carcinoma: Refined
definitions, histological criteria, and reporting. J Thorac Oncol.
9:596–611. 2014. View Article : Google Scholar : PubMed/NCBI
|
|
4
|
Marx A, Chan JK, Coindre JM, Detterbeck F,
Girard N, Harris NL, Jaffe ES, Kurrer MO, Marom EM, Moreira AL, et
al: The 2015 World Health Organization classification of tumors of
the thymus: Continuity and changes. J Thorac Oncol. 10:1383–1395.
2015. View Article : Google Scholar : PubMed/NCBI
|
|
5
|
Giaccone G, Wilmink H, Paul MA and van der
Valk P: Systemic treatment of malignant thymoma. Am J Clin Oncol.
29:336–344. 2006. View Article : Google Scholar : PubMed/NCBI
|
|
6
|
Okumura M, Miyoshi S, Fujii Y, Takeuchi Y,
Shiono H, Inoue M, Fukuhara K, Kadota Y, Tateyama H, Eimoto T and
Matsuda H: Clinical and functional significance of WHO
classification on human thymic epithelial neoplasms: A study of 146
consecutive tumors. Am J Surg Pathol. 25:103–110. 2001. View Article : Google Scholar : PubMed/NCBI
|
|
7
|
Falkson CB, Bezjak A, Darling G, Gregg R,
Malthaner R, Maziak DE, Yu E, Smith CA, McNair S, Ung YC, et al:
The management of thymoma: A systematic review and practice
guideline. J Thorac Oncol. 4:911–919. 2009. View Article : Google Scholar : PubMed/NCBI
|
|
8
|
Jeong YJ, Lee KS, Kim J, Shim YM, Han J
and Kwon OJ: Does CT of thymic epithelial tumors enable us to
differentiate histologic subtypes and predict prognosis? AJR Am J
Roentgenol. 183:283–289. 2004. View Article : Google Scholar : PubMed/NCBI
|
|
9
|
Marom EM, Milito MA, Moran CA, Liu P,
Correa AM, Kim ES, Komaki R, Erasmus JJ, Hofstetter WL, Rice DC and
Swisher SG: Computed tomography findings predicting invasiveness of
thymoma. J Thorac Oncol. 6:1274–1281. 2011. View Article : Google Scholar : PubMed/NCBI
|
|
10
|
Liu GB, Qu YJ, Liao MY, Hu HJ, Yang GF and
Zhou SJ: Relationship between computed tomography manifestations of
thymic epithelial tumors and the WHO pathological classification.
Asian Pac J Cancer Prev. 13:5581–5585. 2012. View Article : Google Scholar : PubMed/NCBI
|
|
11
|
Lambin P, Rios-Velazquez E, Leijenaar R,
Carvalho S, van Stiphout RG, Granton P, Zegers CM, Gillies R,
Boellard R, Dekker A and Aerts HJ: Radiomics: Extracting more
information from medical images using advanced feature analysis.
Eur J Cancer. 48:441–446. 2012. View Article : Google Scholar : PubMed/NCBI
|
|
12
|
Kumar V, Gu Y, Basu S, Berglund A,
Eschrich SA, Schabath MB, Forster K, Aerts HJ, Dekker A,
Fenstermacher D, et al: Radiomics: The process and the challenges.
Magn Reson Imaging. 30:1234–1248. 2012. View Article : Google Scholar : PubMed/NCBI
|
|
13
|
Aerts HJ, Velazquez ER, Leijenaar RT,
Parmar C, Grossmann P, Carvalho S, Bussink J, Monshouwer R,
Haibe-Kains B, Rietveld D, et al: Decoding tumour phenotype by
noninvasive imaging using a quantitative radiomics approach. Nat
Commun. 5:40062014. View Article : Google Scholar : PubMed/NCBI
|
|
14
|
Braman NM, Etesami M, Prasanna P, Dubchuk
C, Gilmore H, Tiwari P, Plecha D and Madabhushi A: Intratumoral and
peritumoral radiomics for the pretreatment prediction of
pathological complete response to neoadjuvant chemotherapy based on
breast DCE-MRI. Breast Cancer Res. 19:572017. View Article : Google Scholar : PubMed/NCBI
|
|
15
|
Kuo MD and Jamshidi N: Behind the numbers:
Decoding molecular phenotypes with radio-genomics-Guiding
principles and technical considerations. Radiology. 270:320–325.
2014. View Article : Google Scholar : PubMed/NCBI
|
|
16
|
Iannarelli A, Sacconi B, Tomei F, Anile M,
Longo F, Bezzi M, Napoli A, Saba L, Anzidei M, D'Ovidio G, et al:
Analysis of CT features and quantitative texture analysis in
patients with thymic tumors: Correlation with grading and staging.
Radiol Med. 123:345–350. 2018. View Article : Google Scholar : PubMed/NCBI
|
|
17
|
Priola AM, Priola SM, Di Franco M, Cataldi
A, Durando S and Fava C: Computed tomography and thymoma:
Distinctive findings in invasive and noninvasive thymoma and
predictive features of recurrence. Radiol Med. 115:1–21. 2010.(In
English, Italian). View Article : Google Scholar : PubMed/NCBI
|
|
18
|
Carter BW, Benveniste MF, Madan R, Godoy
MC, Groot PM, Truong MT, Rosado-de-Christenson ML and Marom EM:
IASLC/ITMIG staging system and lymph node map for thymic epithelial
neoplasms. Radiographics. 37:758–776. 2017. View Article : Google Scholar : PubMed/NCBI
|
|
19
|
Landis JR and Koch GG: The measurement of
observer agreement for categorical data. Biometrics. 33:159–174.
1977. View
Article : Google Scholar : PubMed/NCBI
|
|
20
|
Shrout PE and Fleiss JL: Intraclass
correlations: Uses in assessing rater reliability. Psychol Bull.
86:420–428. 1979. View Article : Google Scholar : PubMed/NCBI
|
|
21
|
Vickers AJ, Cronin AM, Elkin EB and Gonen
M: Extensions to decision curve analysis, a novel method for
evaluating diagnostic tests, prediction models and molecular
markers. BMC Med Inform Decis Mak. 8:532008. View Article : Google Scholar : PubMed/NCBI
|
|
22
|
Tomiyama N, Johkoh T, Mihara N, Honda O,
Kozuka T, Koyama M, Hamada S, Okumura M, Ohta M, Eimoto T, et al:
Using The World Health Organization classification of thymic
epithelial neoplasms to describe CT findings. AJR Am J Roentgenol.
179:881–886. 2002. View Article : Google Scholar : PubMed/NCBI
|
|
23
|
Sadohara J, Fujimoto K, Müller NL, Kato S,
Takamori S, Ohkuma K, Terasaki H and Hayabuchi N: Thymic epithelial
tumors: Comparison of CT and MR imaging findings of low-risk
thymomas, high-risk thymomas, and thymic carcinomas. Eur J Radiol.
60:70–79. 2006. View Article : Google Scholar : PubMed/NCBI
|
|
24
|
Tomiyama N, Müller NL, Ellis SJ, Cleverley
JR, Okumura M, Miyoshi S, Kusumoto M, Johkoh T, Yoshida S, Mihara
N, et al: Invasive and non-invasive thymoma: Distinctive CT
features. J Comput Assist Tomogr. 25:388–393. 2001. View Article : Google Scholar : PubMed/NCBI
|
|
25
|
Choe J, Lee SM, Lim S, Choi SH, Kim N, Do
KH and Seo JB: Doubling time of thymic epithelial tumours on CT:
Correlation with histological subtype. Eur Radiol. 27:4030–4036.
2017. View Article : Google Scholar : PubMed/NCBI
|
|
26
|
Henschke CI, Lee IJ, Wu N, Farooqi A, Khan
A, Yankelevitz D and Altorki NK: CT screening for lung cancer:
Prevalence and incidence of mediastinal masses. Radiology.
239:586–589. 2006. View Article : Google Scholar : PubMed/NCBI
|
|
27
|
Detterbeck FC: Clinical value of the WHO
classification system of thymoma. Ann Thorac Surg. 81:2328–2334.
2006. View Article : Google Scholar : PubMed/NCBI
|
|
28
|
Qu YJ, Liu GB, Shi HS, Liao MY, Yang GF
and Tian ZX: Preoperative CT findings of thymoma are correlated
with postoperative Masaoka clinical stage. Acad Radiol. 20:66–72.
2013. View Article : Google Scholar : PubMed/NCBI
|
|
29
|
Lambin P, Leijenaar RTH, Deist TM,
Peerlings J, de Jong EEC, van Timmeren J, Sanduleanu S, Larue RTHM,
Even AJG, Jochems A, et al: Radiomics: The bridge between medical
imaging and personalized medicine. Nat Rev Clin Oncol. 14:749–762.
2017. View Article : Google Scholar : PubMed/NCBI
|
|
30
|
Ma Z, Fang M, Huang Y, He L, Chen X, Liang
C, Huang X, Cheng Z, Dong D, Liang C, et al: CT-based radiomics
signature for differentiating Borrmann type IV gastric cancer from
primary gastric lymphoma. Eur J Radiol. 91:142–147. 2017.
View Article : Google Scholar : PubMed/NCBI
|
|
31
|
Kocak B, Ates E, Durmaz ES, Ulusan MB and
Kilickesmez O: Influence of segmentation margin on machine
learning-based high-dimensional quantitative CT texture analysis: A
reproducibility study on renal clear cell carcinomas. Eur Radiol.
12:4765–4775. 2019. View Article : Google Scholar
|
|
32
|
Ma X, Wei J, Gu D, Zhu Y, Feng B, Liang M,
Wang S, Zhao X and Tian J: Preoperative radiomics nomogram for
microvascular invasion prediction in hepatocellular carcinoma using
contrast-enhanced CT. Eur Radiol. 29:3595–3605. 2019. View Article : Google Scholar : PubMed/NCBI
|
|
33
|
Shen C, Liu Z, Guan M, Song J, Lian Y,
Wang S, Tang Z, Dong D, Kong L, Wang M, et al: 2D and 3D CT
radiomics features prognostic performance comparison in non-small
cell lung cancer. Transl Oncol. 10:886–894. 2017. View Article : Google Scholar : PubMed/NCBI
|