Introduction
Colorectal cancer (CRC) is the third most common
type of cancer worldwide and the fourth most common cause of
cancer-associated death (1,2). Of newly diagnosed CRC cases, 5–25% of
patients present with advanced-stage disease, and the prognosis for
these patients remains poor (3).
ADP-ribosylation is an important post-translational
modification. It is a reversible process mediated by
ADP-ribosyltransferase and ADP-ribosylhydrolase. There are two
forms of mono-ADP-ribosylation and poly-ADP-ribosylation (4,5).
ADP-ribosylation involves the regulation of multiple biological
processes, including different forms of stress response and
metabolism (5). Increasing
attention is being paid to the role of ADP ribosylation in tumors.
Poly-ADP ribose polymerase inhibitors have recently entered
clinical trials as anticancer agents (5,6), and
the FDA-approved inhibitors, olaparib, niraparib and rucaparib, are
used for treatment of breast and ovarian cancer (7,8).
Studies have shown that MACRO domain containing 2
mono-ADP-ribosylhydrolase focal deletions are observed in human CRC
(9,10). The level of ADP-ribosylation of
targets is dependent on the kinetics of turnover at the
modification site (4). Numerous
studies have focused on the identification of ADP ribosylation
sites (8,11,12),
including arginine-specific mono-ADP-ribosyltransferase 1 (ARTC1)
which can mono-ADP-ribosylate several arginine residues in the
immune modulatory cationic peptides LL-37 and human neutrophil
peptide-1 (4). ARTC1 in airway
epithelial cells catalyzes arginine-14 of defensin-1 to reduce its
antibacterial and cytotoxic activity (13). This suggests that ADP-ribosylation
at different sites may exert different biological effects. Compared
with poly-ADP-ribosylation, mono-ADP-ribosylation has not been
studied as extensively. The mono-ADP-ribosylation modification
sites of histones in human CRC cell lines with differing degrees of
differentiation were screened in a previous study. Arginine-117 of
histone H3 (H3R117) in human colon cancer Lovo cells, which are not
substantially differentiated, was mono-ADP-ribosylated, and this
promoted the proliferation of colon cancer cells (14).
Advances in high-throughput RNA sequencing (RNA-seq)
techniques and bioinformatics methods have facilitated the
sequencing of the entire human genome over the past decade
(15), and are increasingly being
used to identify novel targets for clinical use. Identifying
drug-sensitive target genes using transcriptome sequencing may be
used to better personalize treatments for each specific patient
(3,16,17).
In a previous study, it was shown that there was no
significant difference in proliferation and apoptosis between Lovo
cells transfected with an empty vector and untransfected cells.
Lovo cells transfected with a H3R117A mutant construct and
untransfected cells were thus used to analyze the effects of
mono-ADP-ribosylation on the gene expression profiles of colon
cancer cells by sequencing the transcriptomes of each cell type.
The functions of these differentially expressed genes (DEGs) were
analyzed using bioinformatics analysis, and Kyoto Encyclopedia of
Genes of Genomes (KEGG) analysis of the DEGs showed that pathways
associated with glycosaminoglycan biosynthesis-chondroitin
sulfate/dermatan sulfate were significantly enriched. Studies have
shown that the content and composition of glycosaminoglycan
disaccharide are altered in CRC (18–20).
Changes in the expression levels of associated enzymes, such as
glycosyltransferases and sulfotransferases, also play an important
role during the process of chondroitin sulfate biosynthesis.
Additionally, chondroitin sulfate chains promote
epithelial-mesenchymal transition (21,22),
suggesting that glycosaminoglycan biosynthesis-chondroitin
sulfate/dermatan sulfate are closely associated with CRC
metastasis. In the present study, the association between mono-ADP
ribosylation on members of this pathway and the progression of CRC
was examined, with the aim of providing a basis for further
studying the role of mono-ADP-ribosylation in tumor development and
progression.
Materials and methods
Cell samples
In a previous study, it was demonstrated that H3R117
is a mono-ADP-ribosylated site in Lovo cells, and Lovo cells with a
point mutation resulting in H3R117A were successfully constructed
[mutation of arginine at residue 117 of H3 to a non-ADP-ribosylated
alanine (14)]. The untransfected
Lovo cells (donated by Professor Wei-Xue Tang, Chongqing Medical
University) and H3R117A Lovo cells were both lysed with RNAiso Plus
(Takara Bio, Inc.) and sent to Sangon Biotech Co., Ltd. Both types
of cells were cultured in DMEM (HyClone; GE Healthcare Life
Sciences) with 10% FBS (HyClone; GE Healthcare Life Sciences) with
5% CO2 at 37°C.
Data evaluation and quality
control
The raw image format obtained by Illumina
Hiseq™ (Illumina, Inc.) via Casava (http://support.illumina.com/sequencing/sequencing_software/casava.ilmn;
version 1.8.2) base calling analysis was converted to raw sequenced
reads, and termed raw data. The raw data quality value and other
information were statistically analyzed, and the raw data quality
of samples was visually evaluated using FastQC (http://www.bioinformatics.bbsrc.ac.uk/projects/fastqc/;
version 0.11.2). Trimmomatic (http://www.usadellab.org/cms/index.php?page=trimmomatic;
version 0.36) was used to filter the raw data to obtain the clean
data by removing n-bases and removing the adaptor sequence in
reads: Forward, AGATCGGAAGAGCACACGTCTGAAC and reverse
AGATCGGAAGAGCGTCGTGTAGGGA. Low quality bases were removed from
reads 3′-5′ (q-value <20); low quality bases were removed from
reads 5′-3′ (Q-value <20); the sliding window method (23) was used to remove the bases with a
mass value <20 in the tails of reads (window size, 5 bp); the
reads and their matched reads with a length of <35 nucleotides
were removed; 10,000 sequences were randomly extracted from the
clean data and compared with the NCBI NT database (http://ncbi.nlm.nih.gov/) using blastn. E-value
≤1×10⁻¹⁰ and comparison of results with a similarity
>90% and coverage >80% were used to calculate species
distribution and perform pollution detection.
RNA-seq evaluation
HISAT2 (version 2.1.0) was used to align the
effective sample data to the reference genome, and statistical
comparisons were performed using RseQC (http://rseqc.sourceforge.net/; version 2.6.1). RSeQC
was used to analyze the duplicate reads and the distribution of
inserted fragments based on the alignment results. Qualimap
(http://www.qualimap.org; version 2.2.1) was used
to test the gene body coverage and analyze the structural
distribution of the genome. BEDTools (http://code.google.com/p/bedtools; version 2.26.0) was
used for statistical analysis of gene coverage and read
distribution on chromosomes.
Genetic structure analysis
BCFtools (http://samtools.sourceforge.net; version 1.5) was used
to perform single nucleotide polymorphism (SNP)/insertion-deletion
(indel) calling, and the SNPs/indels in each sample were extracted.
Subsequently, SnpEff (snpeff.sourceforge.net; version 2.36) was used to
calculate the distribution of variation sites on the genome
structure; a quality value >20 and coverage cutoffs >8 were
used as the criteria for filtering. Alternative splicing analysis
was used for fusion gene analysis using ASprofier (http://ccb.jhu.edu/software/ASprofile;
version 2.36) and EricScript (http://ericscript.sourceforge.net; version 0.55).
Expression level analysis
In the RNA-seq analysis, the expression levels of
genes were estimated by counting the reads located in the genomic
regions or gene exon regions. In addition to the true expression
levels of the gene, the read count was positively correlated with
the length and sequencing depth of the gene. To make the estimated
gene expression levels of different genes and different experiments
comparable, the concept of transcripts per million (TPM) was
introduced. The calculation formula of TPM was as follows:
TPMi=XiLi*1∑jXjLj*106
Xi=total exon fragment/readsLi=exon
lengthKB
StringTie (http://ccb.jhu.edu/software/stringtie; version 1.3.3b)
and known gene models (24) were
used to assess gene expression.
Replicated correlation test
Biological replicates are necessary for any
biological experiment. The correlation of gene expression levels
between samples was used as an important index to test the
reliability of the experiments and the rationality of sample
selection. The closer the correlation coefficient was to 1, the
higher the similarity of expression patterns between samples. A
total of three correlation indexes were calculated: Pearson,
Kendall and Spearman (R software; version 3.1.2).
Expression difference analysis
DESeq2 (R package; https://github.com/mikelove/DESeq2; version 1.12.4)
was used for gene expression difference analysis, and the results
of the expression difference analysis were visualized. The DEGs
were mapped to the Search Tool for the Retrieval of Interacting
Genes/Proteins (STRING) protein interaction network database
(http://string-db.org/), which was used to
construct the protein interaction network. Based on the results of
the differential analysis, Venn diagrams (VennDiagram R package;
https://CRAN.R-project.org/package=VennDiagram;
version 1.6.17) were drawn.
Gene enrichment analysis
TopGO (R package https://bioconductor.org/packages/topGO/; version
2.24.0) was used for Gene Ontology (GO) enrichment analysis, and
the significance of GO-directed acyclic graph was drawn.
ClusterProfiler (R package https://guangchuangyu.github.io/software/clusterProfiler;
version 3.0.5) was used for KEGG pathway and eukaryotic orthologous
group (KOG) classification enrichment analysis. The association
analysis network diagram was drawn based on the results of the gene
function enrichment analysis.
Western blotting
The cells were lysed in cell lysis buffer for
western blotting (Beyotime Institute of Biotechnology) supplemented
with PMSF (100:1; Beyotime Institute of Biotechnology) to extract
the total proteins. The concentrations of the proteins were
detected using a bicinchoninic acid protein assay kit (Beyotime
Institute of Biotechnology). Proteins (20 µg per lane) were loaded
on an SDS gel (10%), resolved using SDS-PAGE and subsequently
transferred to PVDF membranes (GE Healthcare Life Sciences),
Membranes were blocked in 5% non-fat milk for 2 h at room
temperature and incubated with primary antibodies against β-actin
(ProteinTech Group, Inc; cat. no. 66009-1-Ig; 1:20,000) or
β-catenin (Wanleibio Co., Ltd.; cat. no. WL0962a; 1:500) at 4°C
overnight, and subsequently incubated with a HRP-conjugated
secondary antibody [ProteinTech Group, Inc.; cat. nos. SA00001-1
(mouse) or SA00001-2 (rabbit); 1:5,000] for 2 h at room
temperature. Signals were visualized using enhanced
chemiluminescence reagent (EMD Millipore), and the protein level
analysis was performed using ImageLab software (Bio-Rad
Laboratories, Inc.; version 6.0.0).
RNA extraction and reverse
transcription-quantitative PCR
Total RNA was extracted from cells using RNAiso Plus
reagent (Takara Bio, Inc.). RNA was reverse transcribed to cDNA
using an Evo M-MLV RT kit with gDNA Clean for qPCR (Hunan Accurate
Bio-Medical Co., Ltd.), according to the manufacturer's protocol
(37°C for 15 min, 85°C for 5 sec, then 4°C). The primers were
synthesized by Sangon Biotech Co., Ltd. The sequences of the
primers were as follows (5′-3′): Galactosylxylosyl protein
3-β-galactosyltransferase (B3GALT6) forward, CGACGCCTACGAAAACCTCA
and reverse, GTCGTACACGTAGGACAGGC; N-acetyl galactosamine 4-sulfate
6-O-sulfotransferase (CHST15) forward, GCCACTCAATGCCATCCAGA and
reverse, ATGGCAGGCTCGAGAACCAC; chondroitin 4-sulfotransferase 2
(CHST12) forward, CGACGAGTTTCTGGACAAG and reverse,
GGACCAGTCGTAGCCTCT; and β-actin forward, AGCGAGCATCCCCCAAAGTT and
reverse GGGCACGAAGGCTCATCATT. qPCR was performed using
SYBR® Premix Ex Taq™ II, according to the
manufacturer's protocol (Takara Bio, Inc.) as follows: 95°C for 30
sec, 95°C for 5 sec, 60°C for 30 sec for a total of 40 cycles,
followed by 95°C for 10 sec, and melting curve analysis between 65
and 95°C (increments of 0.5°C) for 5 sec. β-actin was used as the
reference to normalize the results and the data were analyzed using
the 2−ΔΔCq method (25).
Immunofluorescence
Cells (1×10⁵/ml) were fixed in 4%
paraformaldehyde for 20 min at room temperature and permeabilized
using 0.1% Triton X-100 for 20 min. Samples were blocked in goat
serum (Wuhan Boster Biological Technology, Ltd.; cat. no. AR009)
for 30 min and subsequently incubated with the following primary
antibodies: Anti-β-catenin (Wanleibio Co., Ltd.; cat. no. WL0962a;
1:200) and anti-mono-ADP-ribose binding reagent (EMD Millipore;
cat. no. MABE1076; 1:200) at 4°C overnight. The following day,
cells were washed in PBS and incubated with Cy3-conjugated
secondary antibody (ProteinTech Group, Inc.; cat. no. SA00009-2;
1:200) in the dark for 1 h at room temperature. DAPI (Wuhan Boster
Biological Technology, Ltd.) was used for nuclear staining (5 min
at room temperature). The images were captured using ZOETM
Fluorescent Cell Imager (Bio-Rad Laboratories, Inc.) and analyzed
using ImageJ software (version 1.48; National Institutes of Health)
The experiment was repeated three times.
Wound healing assays
Cells were seeded in 6-well plates. When the cell
density reached 90%, the monolayers were scratched using a 200 µl
sterile pipette tip, and the cells were cultured in serum-free
medium for 24 h at 37°C. The wounded monolayers were imaged using a
ZOETM Fluorescent Cell Imager (Bio-Rad Laboratories, Inc.) at the
start of the experiment and after 24 h. The experiment was repeated
three times and the images were analyzed using ImageJ version 1.48
(National Institutes of Health).
Transwell assay
Transwell assays were performed using Transwell
chambers (Merck KGaA) coated with Matrigel (Corning, Inc.).
Serum-free cell suspension with 5×10⁵ cells were added
to the upper chamber of the well at 200 µl/chamber, whereas
supplemented medium with 10% serum was added to the lower chamber.
After 24 h of incubation at 37°C, the cells were fixed with 4%
paraformaldehyde for 30 min and stained with 0.1% crystal violet
for 20 min at room temperature, followed by washing three times.
Images were captured (magnification, ×200) under a light microscope
(Nikon Corporation), the experiment was repeated three times, and
the number of cells was counted using ImageJ version 1.48 (National
Institutes of Health).
Statistical analysis
DEGs were determined using a negative binomial
distribution, and enrichment analysis was performed using a
hypergeometric distribution. DESeq2 was used to analyze differences
in gene expression difference. SnpEff was used to calculate the
distribution of variation sites in the genome structure, and the
filters used were mass value >20 and coverage >8. Variable
shear events were classified using ASprofile based on the predicted
gene model for each sample. TopGO was used for GO enrichment
analysis and ClusterProfiler was used for KEGG pathway and KOG
enrichment analysis. All experiments were performed three times and
the data are presented as the mean ± standard deviation.
Statistical analysis was performed using GraphPad Prism version 5
(GraphPad Software, Inc.). An unpaired two-tailed Students' t-test
was used to compare groups. P<0.05 was considered to indicate a
statistically significant difference.
Results
Confirmation of mono-ADP-ribosylation
in Lovo cells
A previous study identified mono-ADP-ribosylation of
H3R117 in Lovo cells using liquid chromatography with tandem mass
spectrometry (LC-MS/MS) (14). In
the present study, immunofluorescence experiments were performed to
confirm the mono-ADP-ribosylation in these cells.
Mono-ADP-ribosylation was notably present in Lovo cells,
particularly in the nucleus (Fig.
S1). These results demonstrated that nuclear
mono-ADP-ribosylation is present in CRC.
Preprocessing of raw data
FastQC was used to visually evaluate the quality of
the raw data (Fig. 1) and
Trimmomatic was used to filter the raw data to obtain the clean
data. Data information prior to and following quality control
showed Q20 >90 and Q30 >90% (Tables I and II). These results showed that the
experimental data was of high quality, and the stability of the
instrumental analysis systems was good and met the requirements for
subsequent analysis.
 | Table I.Raw data statistics. |
Table I.
Raw data statistics.
| Statistic |
Non_transfection | H3_R117A |
|---|
| Total Reads Count
(n) | 48337200 | 47928086 |
| Total Bases Count
(bp) | 7250580000 | 7189212900 |
| Average Read Length
(bp) | 150 | 150 |
| Q10 Bases Count
(bp) | 7250443310 | 7189118632 |
| Q10 Bases Ratio
(%) | 100.00% | 100.00% |
| Q20 Bases Count
(bp) | 7029222588 | 6953852019 |
| Q20 Bases Ratio
(%) | 96.95% | 96.73% |
| Q30 Bases Count
(bp) | 6666265867 | 6566925897 |
| Q30 Bases Ratio
(%) | 91.94% | 91.34% |
| N Bases Count
(bp) | 136690 | 94268 |
| N Bases Ratio
(%) | 0.00% | 0.00% |
| GC Bases Count
(bp) | 3700903258 | 3616005152 |
| GC Bases Ratio
(%) | 51.04% | 50.30% |
| Table II.Quality control data statistics. |
Table II.
Quality control data statistics.
| Statistic |
Non_transfection | H3_R117A |
|---|
| Total Reads Count
(n) | 46445980 | 45973604 |
| Total Bases Count
(bp) | 6786715331 | 6720275957 |
| Average Read Length
(bp) | 146.12 | 146.18 |
| Q10 Bases Count
(bp) | 6786671778 | 6720232139 |
| Q10 Bases Ratio
(%) | 100.00% | 100.00% |
| Q20 Bases Count
(bp) | 6670691000 | 6589709477 |
| Q20 Bases Ratio
(%) | 98.29% | 98.06% |
| Q30 Bases Count
(bp) | 6375757096 | 6272795618 |
| Q30 Bases Ratio
(%) | 93.94% | 93.34% |
| N Bases Count
(bp) | 43553 | 43818 |
| N Bases Ratio
(%) | 0.00% | 0.00% |
| GC Bases Count
(bp) | 3466686895 | 3381728755 |
| GC Bases Ratio
(%) | 51.08% | 50.32% |
RNA-seq evaluation
Certain important quality metrics can only be
measured when reads are matched with the reference genome and their
positions are aligned to the annotation information, including
sequencing saturation, distribution of reads with different genome
characteristics and coverage uniformity of transcripts.
The reference genome was used as the reference
sequence, HISAT2 was used to map the quality-controlled sequencing
reads to the reference genome, and statistical comparisons were
performed using RSeQC; ~97% of clean reads were mapped to the
reference genome (Table III).
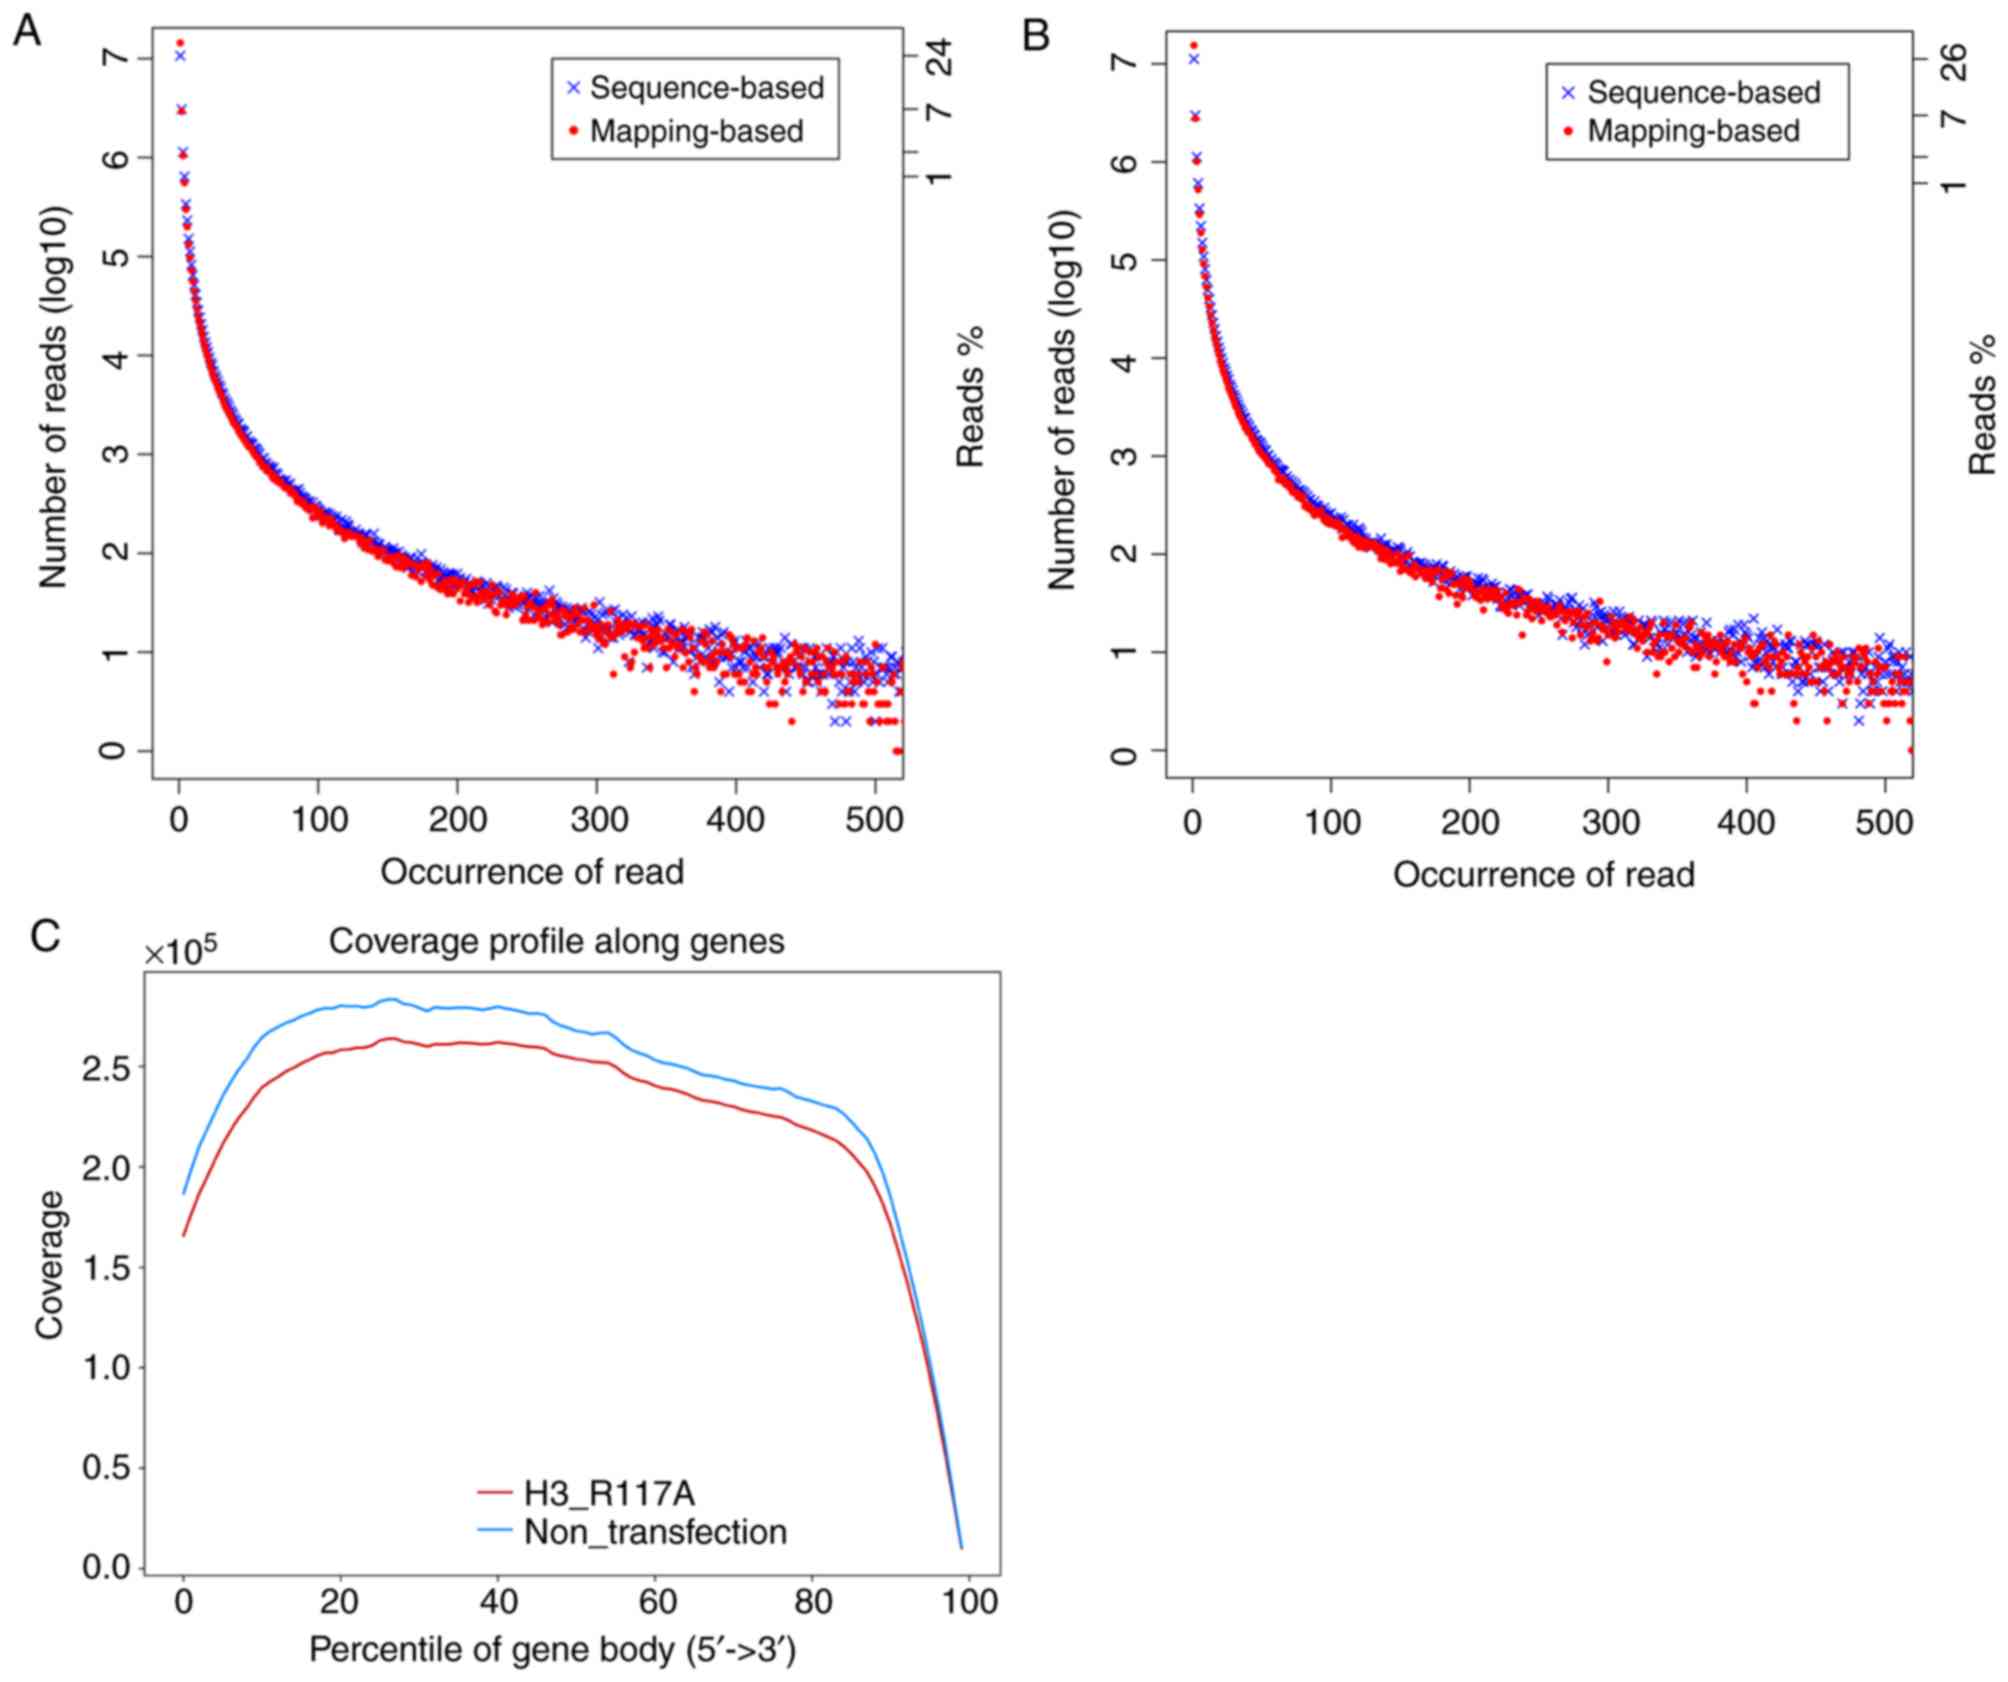
Duplicate reads were defined as sequences with exactly the same
base arrangement. Duplicate reads are primarily the result of PCR
amplification during library construction. As shown in Fig. 1A and B, the overall trend of the
curve showed a linear smooth extension and diffusion. As the
horizontal axis increased, the corresponding vertical axis
decreased, suggesting that the results were normal. Ideally, for
RNA-seq, there should be independent sampling between sequencing
reads, and the distribution of reads on all expressed transcripts
should be homogenized. The analysis of gene coverage from 5′-3′ is
an indicator used to evaluate the randomness of transcriptome
sequencing (26). By mapping the
results, the coverage of each transcriptional site was calculated,
and the coverage rate of each transcriptional site was calculated.
By calculating the coverage ratio of each gene in each sample, the
proportion of all the samples sequenced completely detected and the
proportion of genes not detected was calculated, and could be used
to determine whether there were genes with specific expression
patterns among the samples (Fig.
1C).
| Table III.Mapping results statistics. |
Table III.
Mapping results statistics.
| Statistic | H3_R117A, n
(%) | Non_transfection, n
(%) |
|---|
| Total reads | 45836984
(100.00) | 46315408
(100.00) |
| Total mapped | 44785927
(97.71) | 45140891
(97.46) |
| Multiple
mapped | 1150668 (2.51) | 1213377 (2.62) |
| Uniquely
mapped | 43635259
(95.20) | 43927514
(94.84) |
| Read-1 mapped | 21913703
(47.81) | 22096074
(47.71) |
| Read-2 mapped | 21721556
(47.39) | 21831440
(47.14) |
| Reads mapping to
‘+’ | 21829356
(47.62) | 21966410
(47.43) |
| Reads mapping to
‘−’ | 21805903
(47.57) | 21961104
(47.42) |
| Non-splice
reads | 24550439
(53.56) | 24395895
(52.67) |
| Splice reads | 19084820
(41.64) | 19531619
(42.17) |
| Reads mapped in
proper pairs | 42549038
(92.83) | 42585412
(91.95) |
Structural variation
RNA-seq can be used detect various structural
variations in mRNA. In the present study, SNPs and alternative
splicing (AS) were primarily analyzed. SNP analysis showed that the
untransfected cells possessed 60,362 SNP sites and 3,979 indel
sites. The cells expressing the mutant H3 possessed 54,918 SNP
sites and 3,876 indel sites (Fig.
2A). Of the SNPs, >50% were present in introns (Fig. 2D and E). SNPs included transition
and transversion, and the majority of the SNPs in both groups of
cells were transitions. A total of four transition types were
detected: A>G, C>T, G>A and T>C. Among these, A>G
and T>C were the most common. Transversion was relatively rarely
observed, but eight types of transversion were detected: A>C,
A>T, C>A, C>G, G>C, G>T, T>A and T>G (Fig. 2B and C). Between the two cell types
assessed, the same gene exhibited different forms of AS, which
greatly increases the capacity for gene encoding, as well as the
complexity of gene expression and the diversity of protein
function. Abnormal AS may produce potentially harmful or beneficial
effects in the organism under certain environmental conditions. In
the present study, ASprofile was used to classify AS according to
the predicted gene models of each sample. The classification was as
follows: SKIP, exon skipping; MSKIP, cassette exons; IR, retention
of single; MIR, multiple introns; AE, alternative exon ends; TSS,
alternative transcription start site; and TTS, alternative
transcription termination site. The three types of AS most commonly
observed in both cell groups were TSS, SKIP and TTS (Fig. 2F and G).
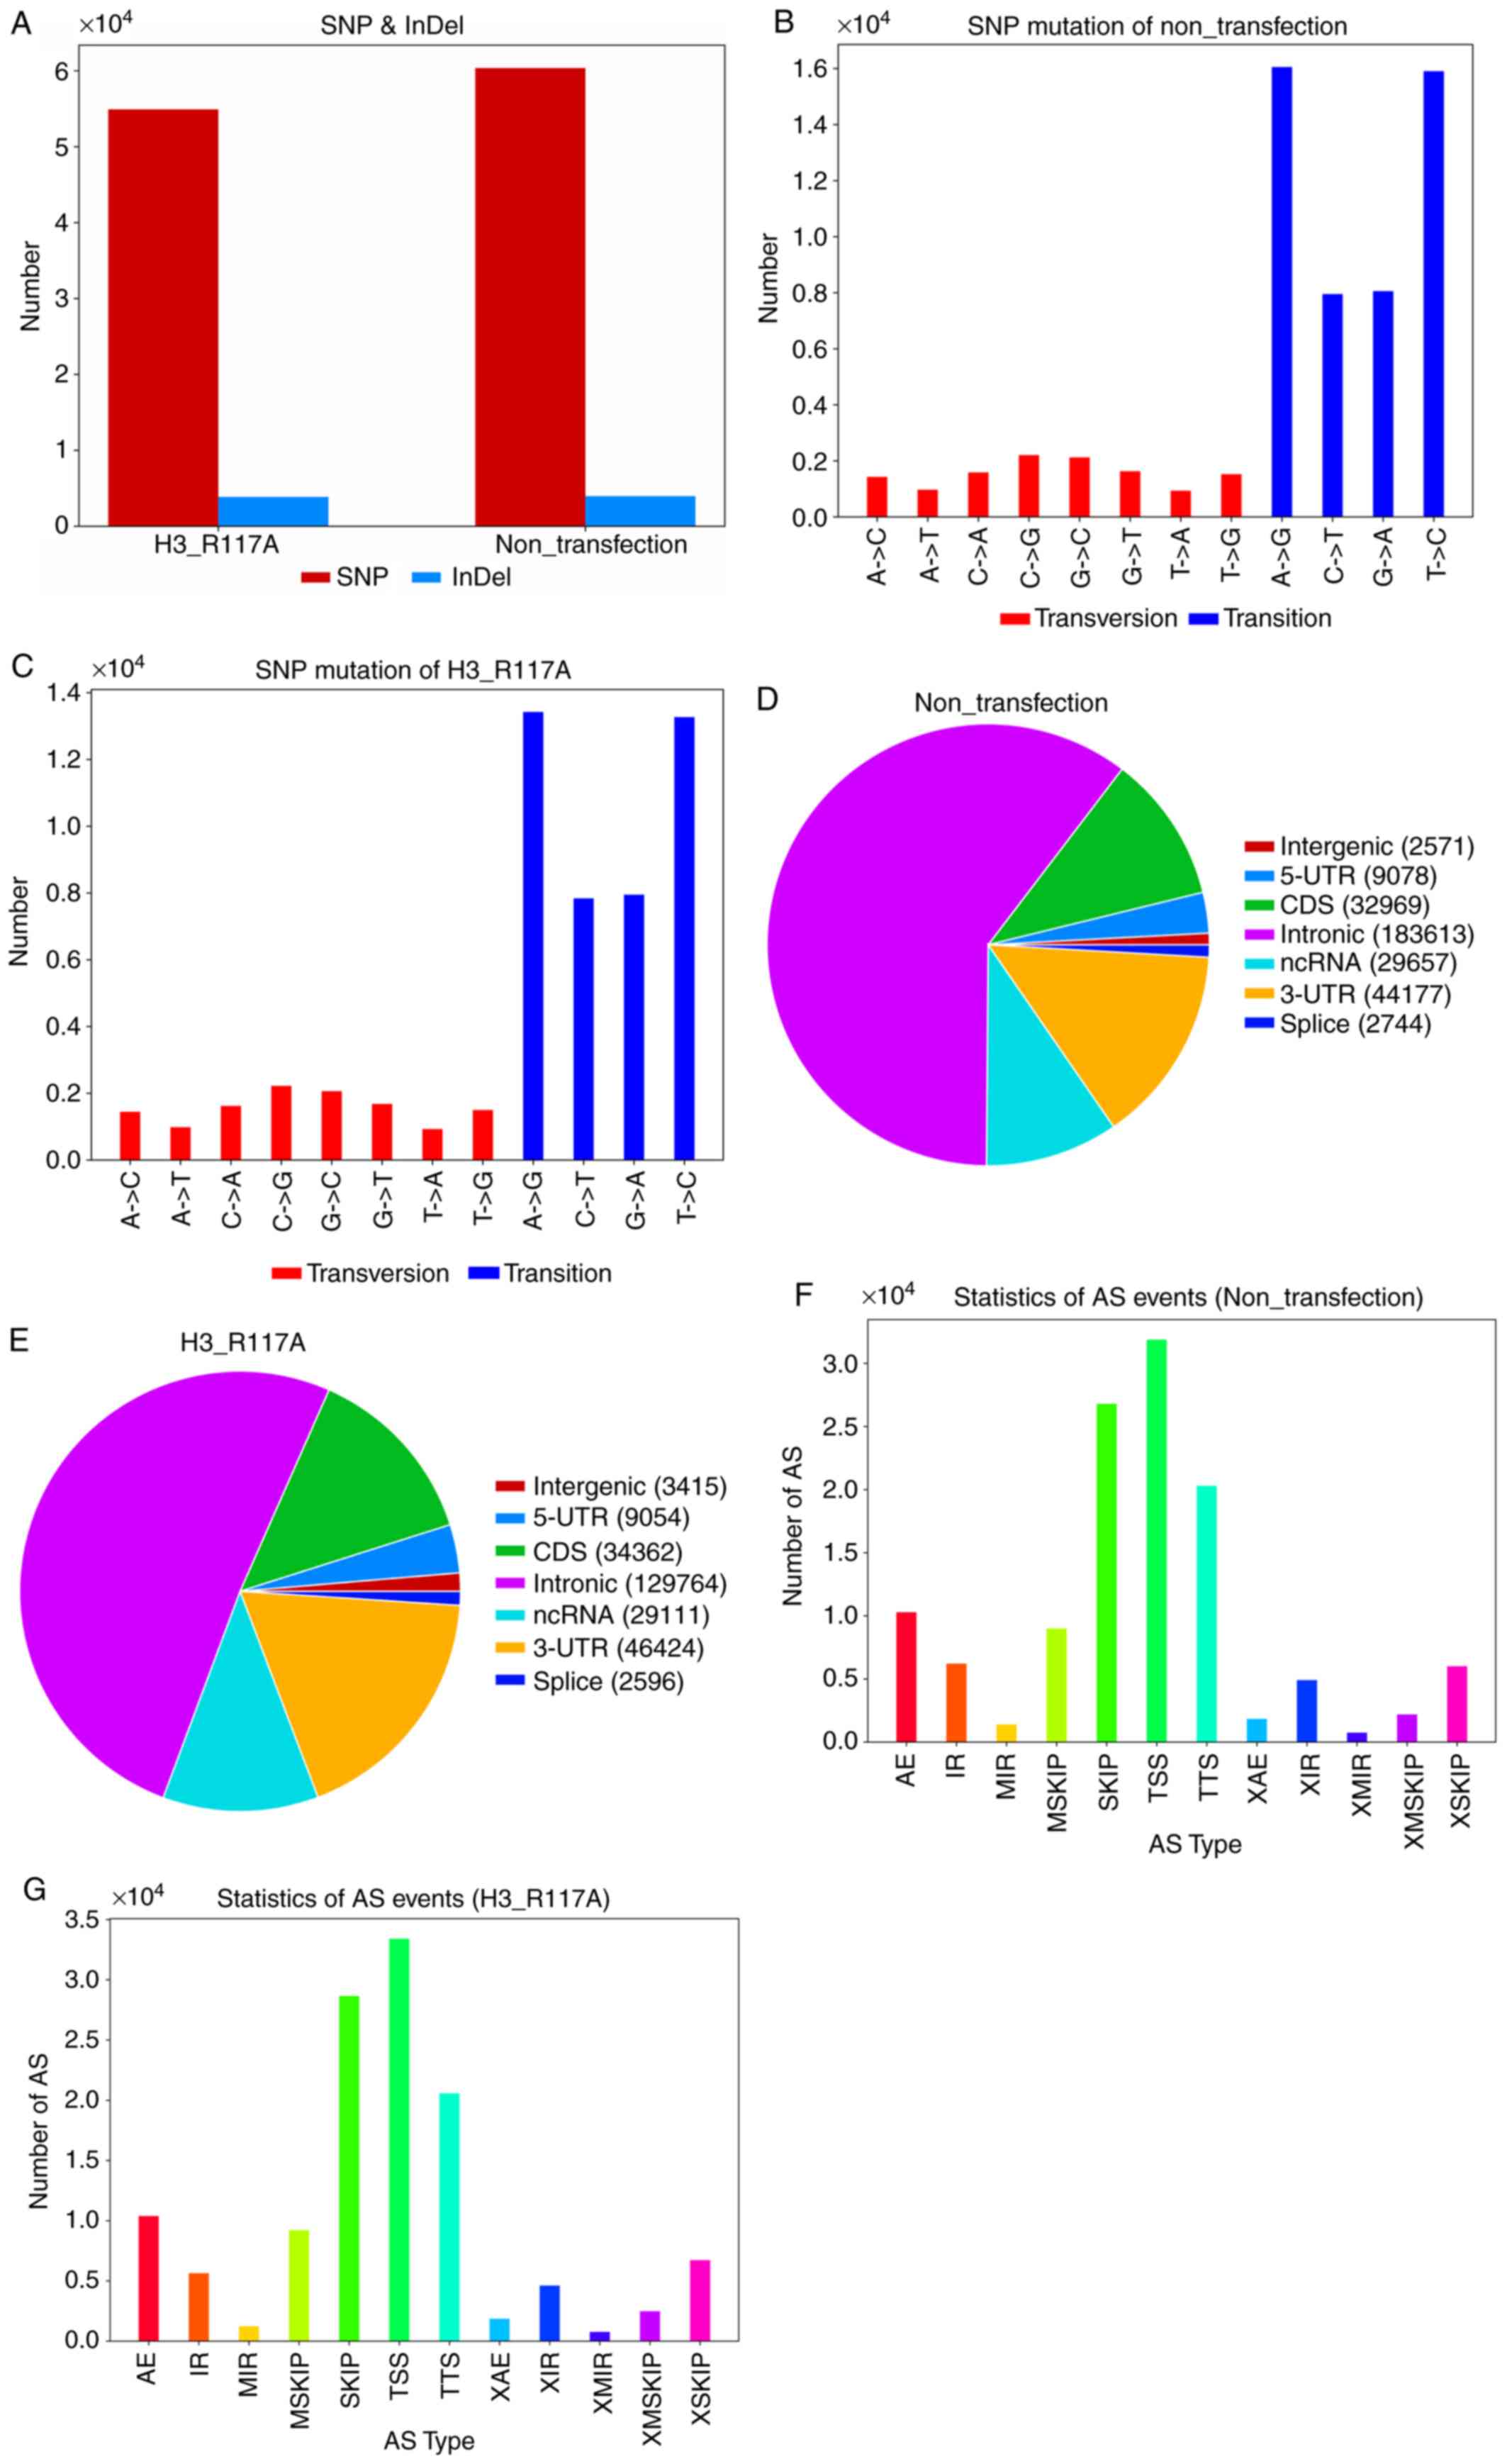 | Figure 2.(A) Number of SNPs; the horizontal
axis represents the sample name, and the vertical axis represents
the number of variations. (B) Types of SNPs in untransfected Lovo
cells; (C) types of SNPs in the mutant H3R117A; the horizontal axis
represents the type of SNP, and the vertical axis the number of
variations. (D) SNP effect region in untransfected Lovo cells; (E)
SNP effect region in the mutant H3R117A; different colors represent
different genetic elements, and the area occupied by each color
corresponds to the percentage of variation of the element in the
total variation. (F) Type of AS in untransfected Lovo cells; (G)
Type of AS in in the mutant H3R117A; the horizontal axis represents
the AS classification form, and the vertical axis represents the
number of AS events. SNP, single nucleotide polymorphism; AS,
alternative splicing; UTR, untranslated region; ncRNA, non-coding
RNA; CDS, coding sequence; AE, alternative exon ends; IR, retention
of single; MIR, multiple introns; MSKIP, cassette exons; SKIP, exon
skipping; TSS, alternative transcription start site; TTS,
alternative transcription termination site; XAE; XIR; XMIR; XMSKIP;
XSKIP; H3, histone H3. |
Biological replicates
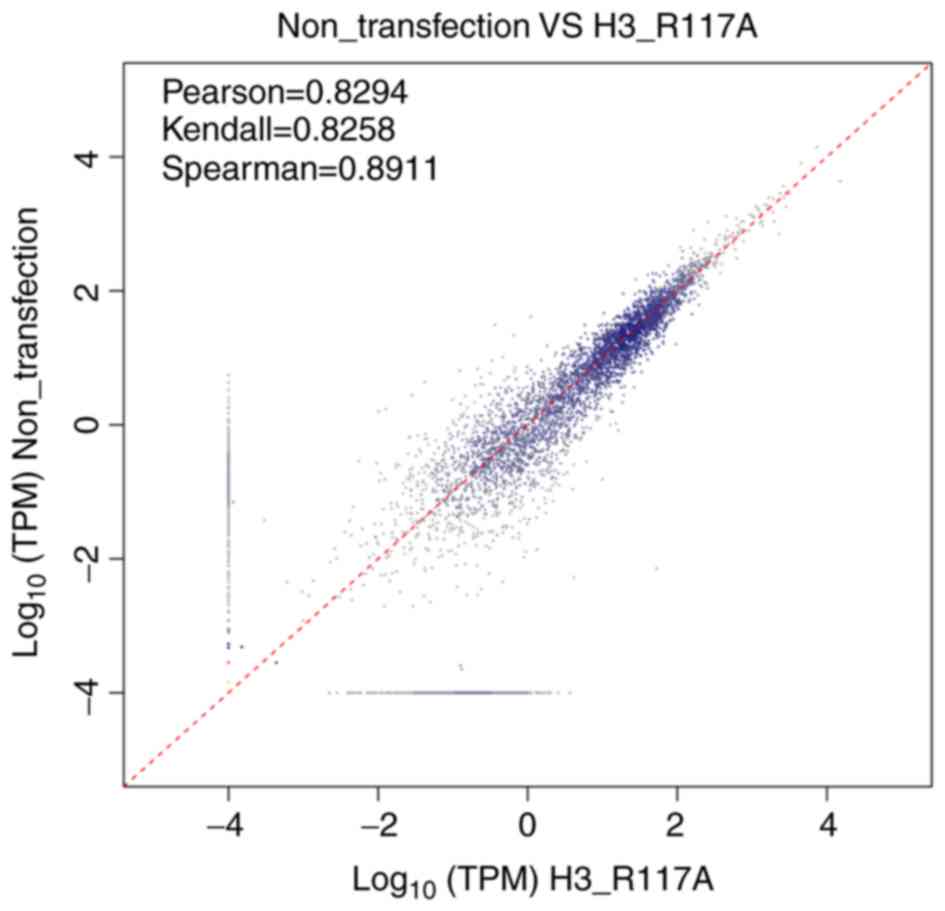
A total of three correlation indices were calculated
in the scatterplot of the replicated correlation test:
Pearson=0.8294, Kendall=0.8258 and Spearman=0.8911. These
correlation indices were all close to 1, and the scatterplot showed
that the majority of the points were centered around the diagonal
line. These results indicated that the similarity of expression
patterns between samples was high (Fig.
3).
Differential expression of genes
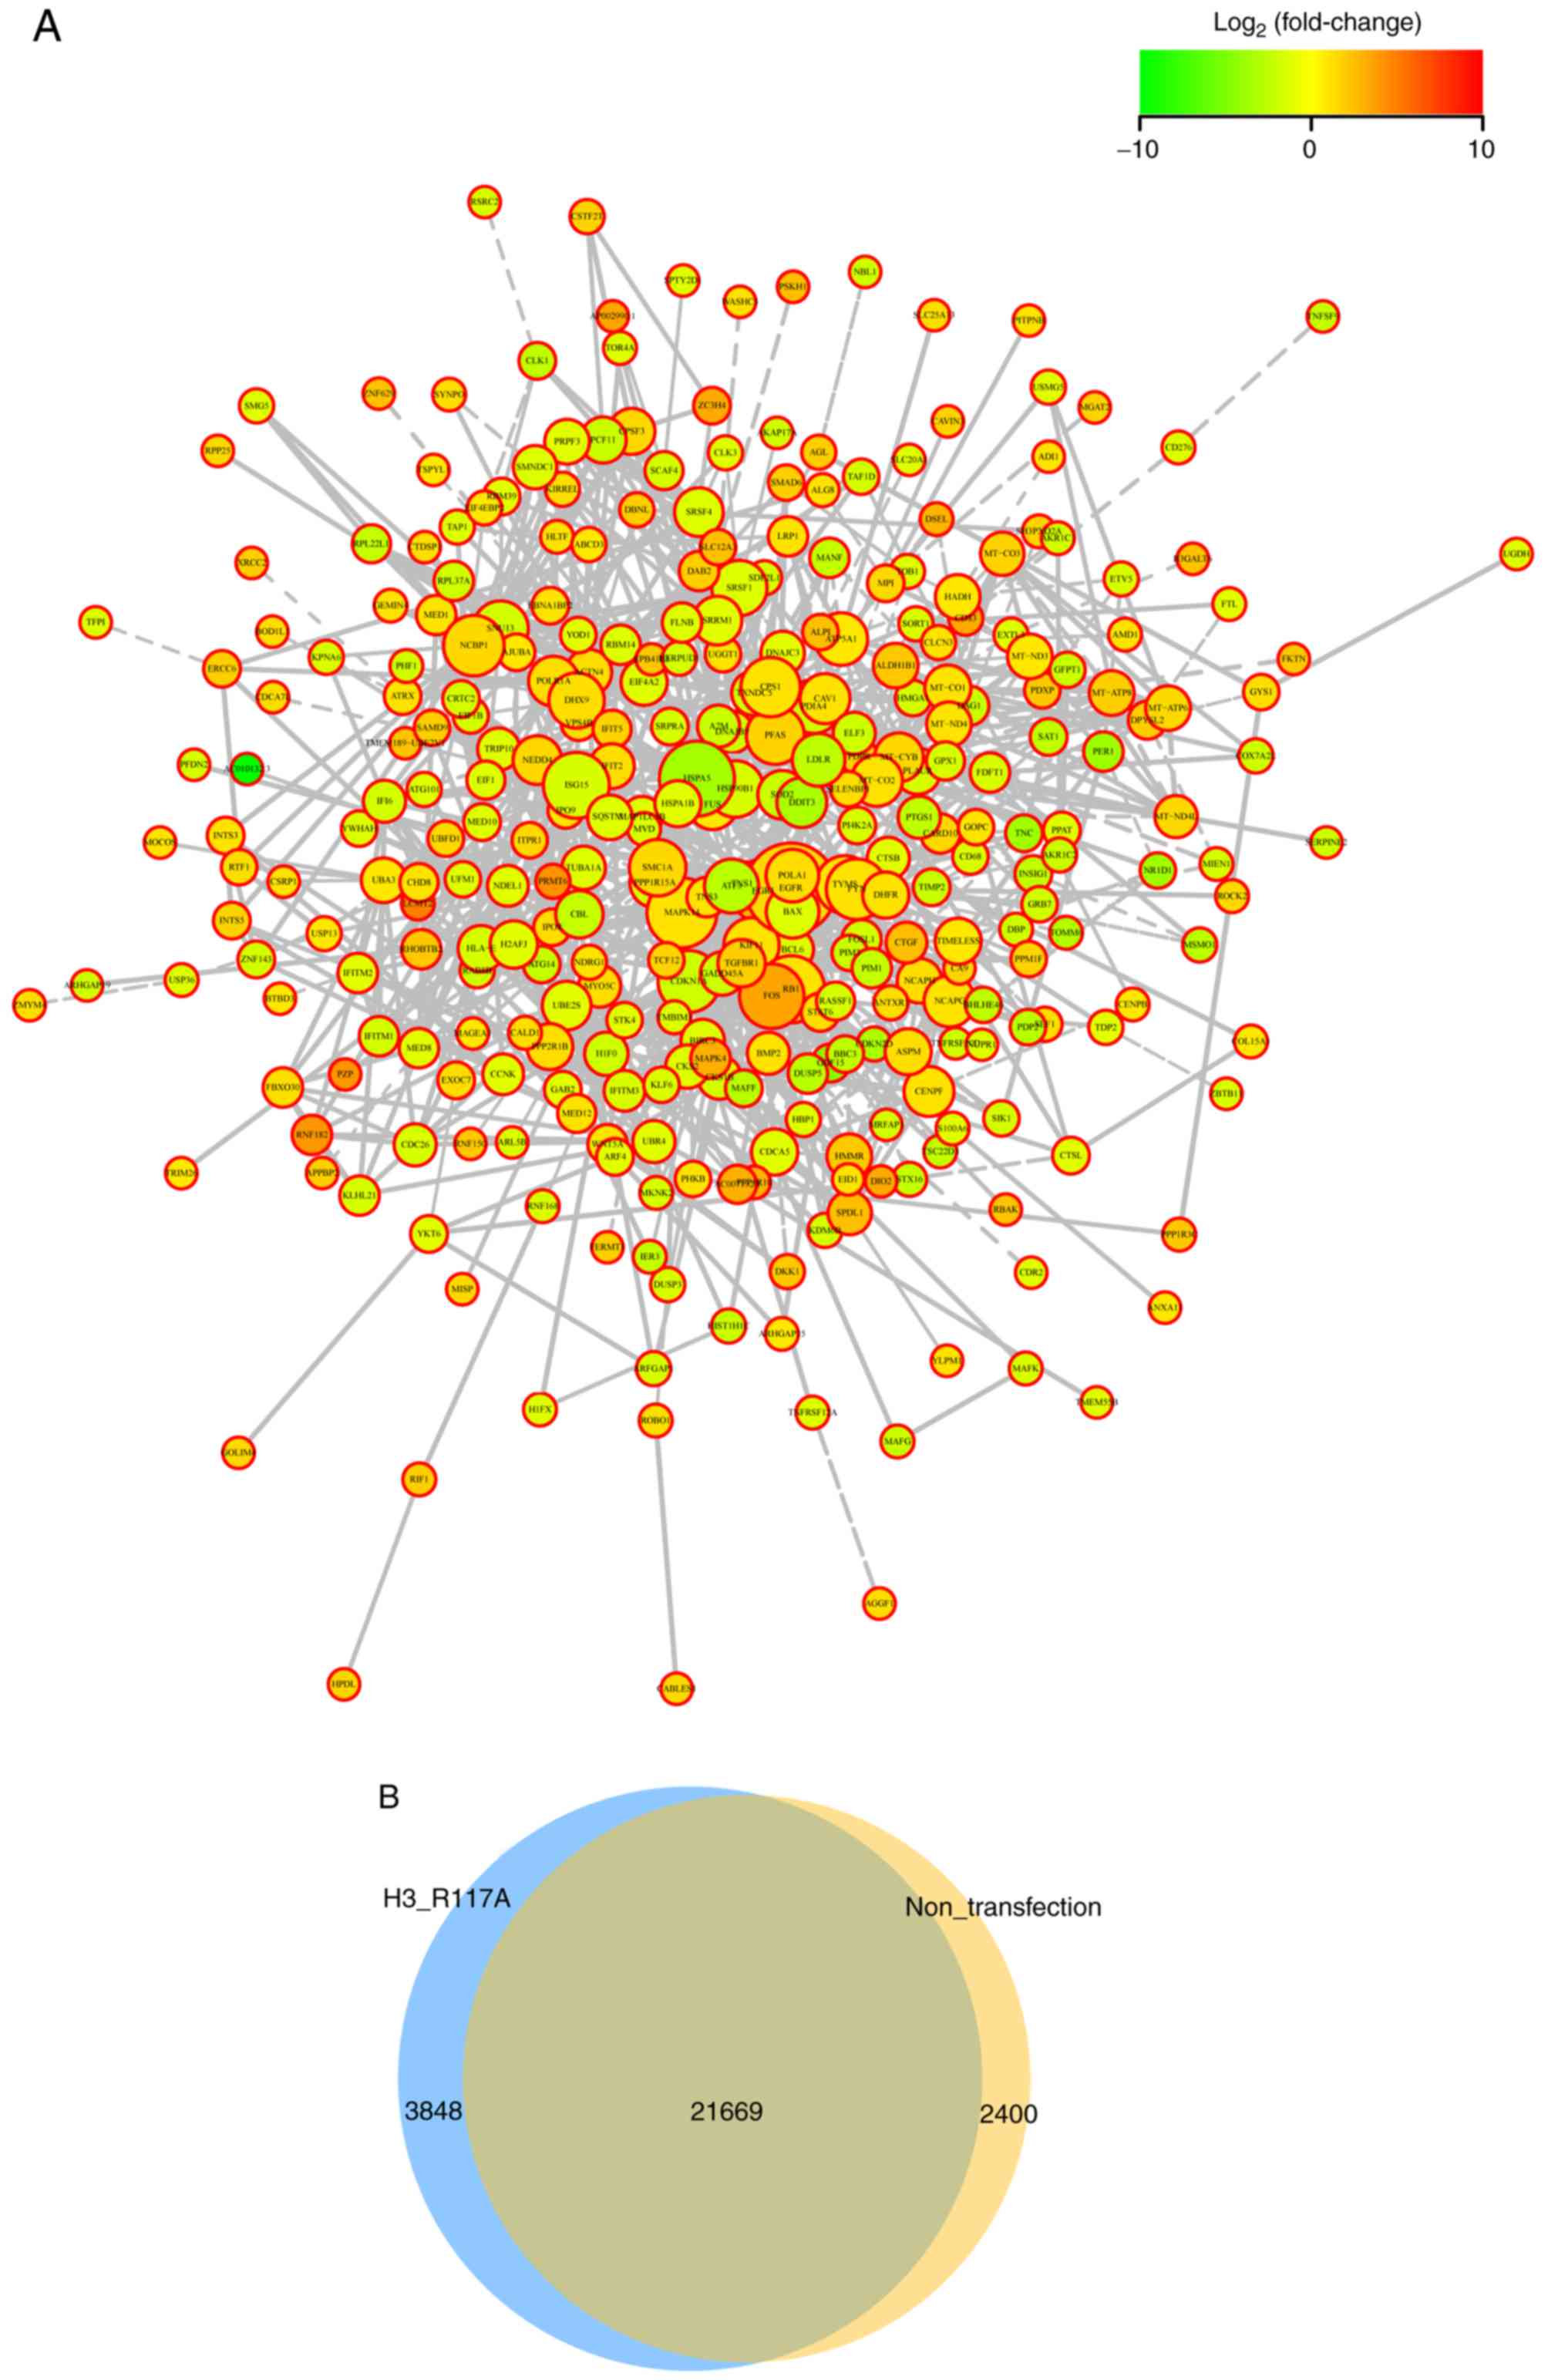
In total, 58,174 differentially expressed genes were
identified; among these, 2,324 genes were significantly different
(q-value <0.05; fold change >2). Compared with the
untransfected cells, 1,391 upregulated genes and 933 downregulated
genes were identified. DEGs were mapped using the STRING protein
interaction network database to construct protein interaction
networks (Fig. 4A). Based on the
results of the differential analysis, Venn diagrams were drawn. The
Venn diagram showed the number of expressed genes that were common
and unique between the two groups (TPM >0). A total of 21,669
genes were present in both groups; 2,400 genes were unique to the N
group, and 3,848 genes were unique to the mutant cells (Fig. 4B).
Functional enrichment analysis of
DEGs
GO is an internationally standardized functional
classification system for genes, providing a set of regularly
updated descriptions to comprehensively describe the properties of
genes and gene products in organisms. There are three ontologies in
GO: Molecular function, cellular component and biological process
(Fig. 5A). According to the results
of the GO analysis, it was identified that for biological process,
DEGs were significantly enriched in ‘metabolic process’ and
‘negative regulation of biological process’ (q-value <0.05); for
cell component, DEGs were significantly enriched in ‘organelle’,
‘organelle part’ and ‘membrane-enclosed lumen’ (q-value <0.05);
for molecular function, DEGs were significantly enriched in
‘binding’ and ‘catalytic activity’ (q-value <0.05; Fig. 5B).
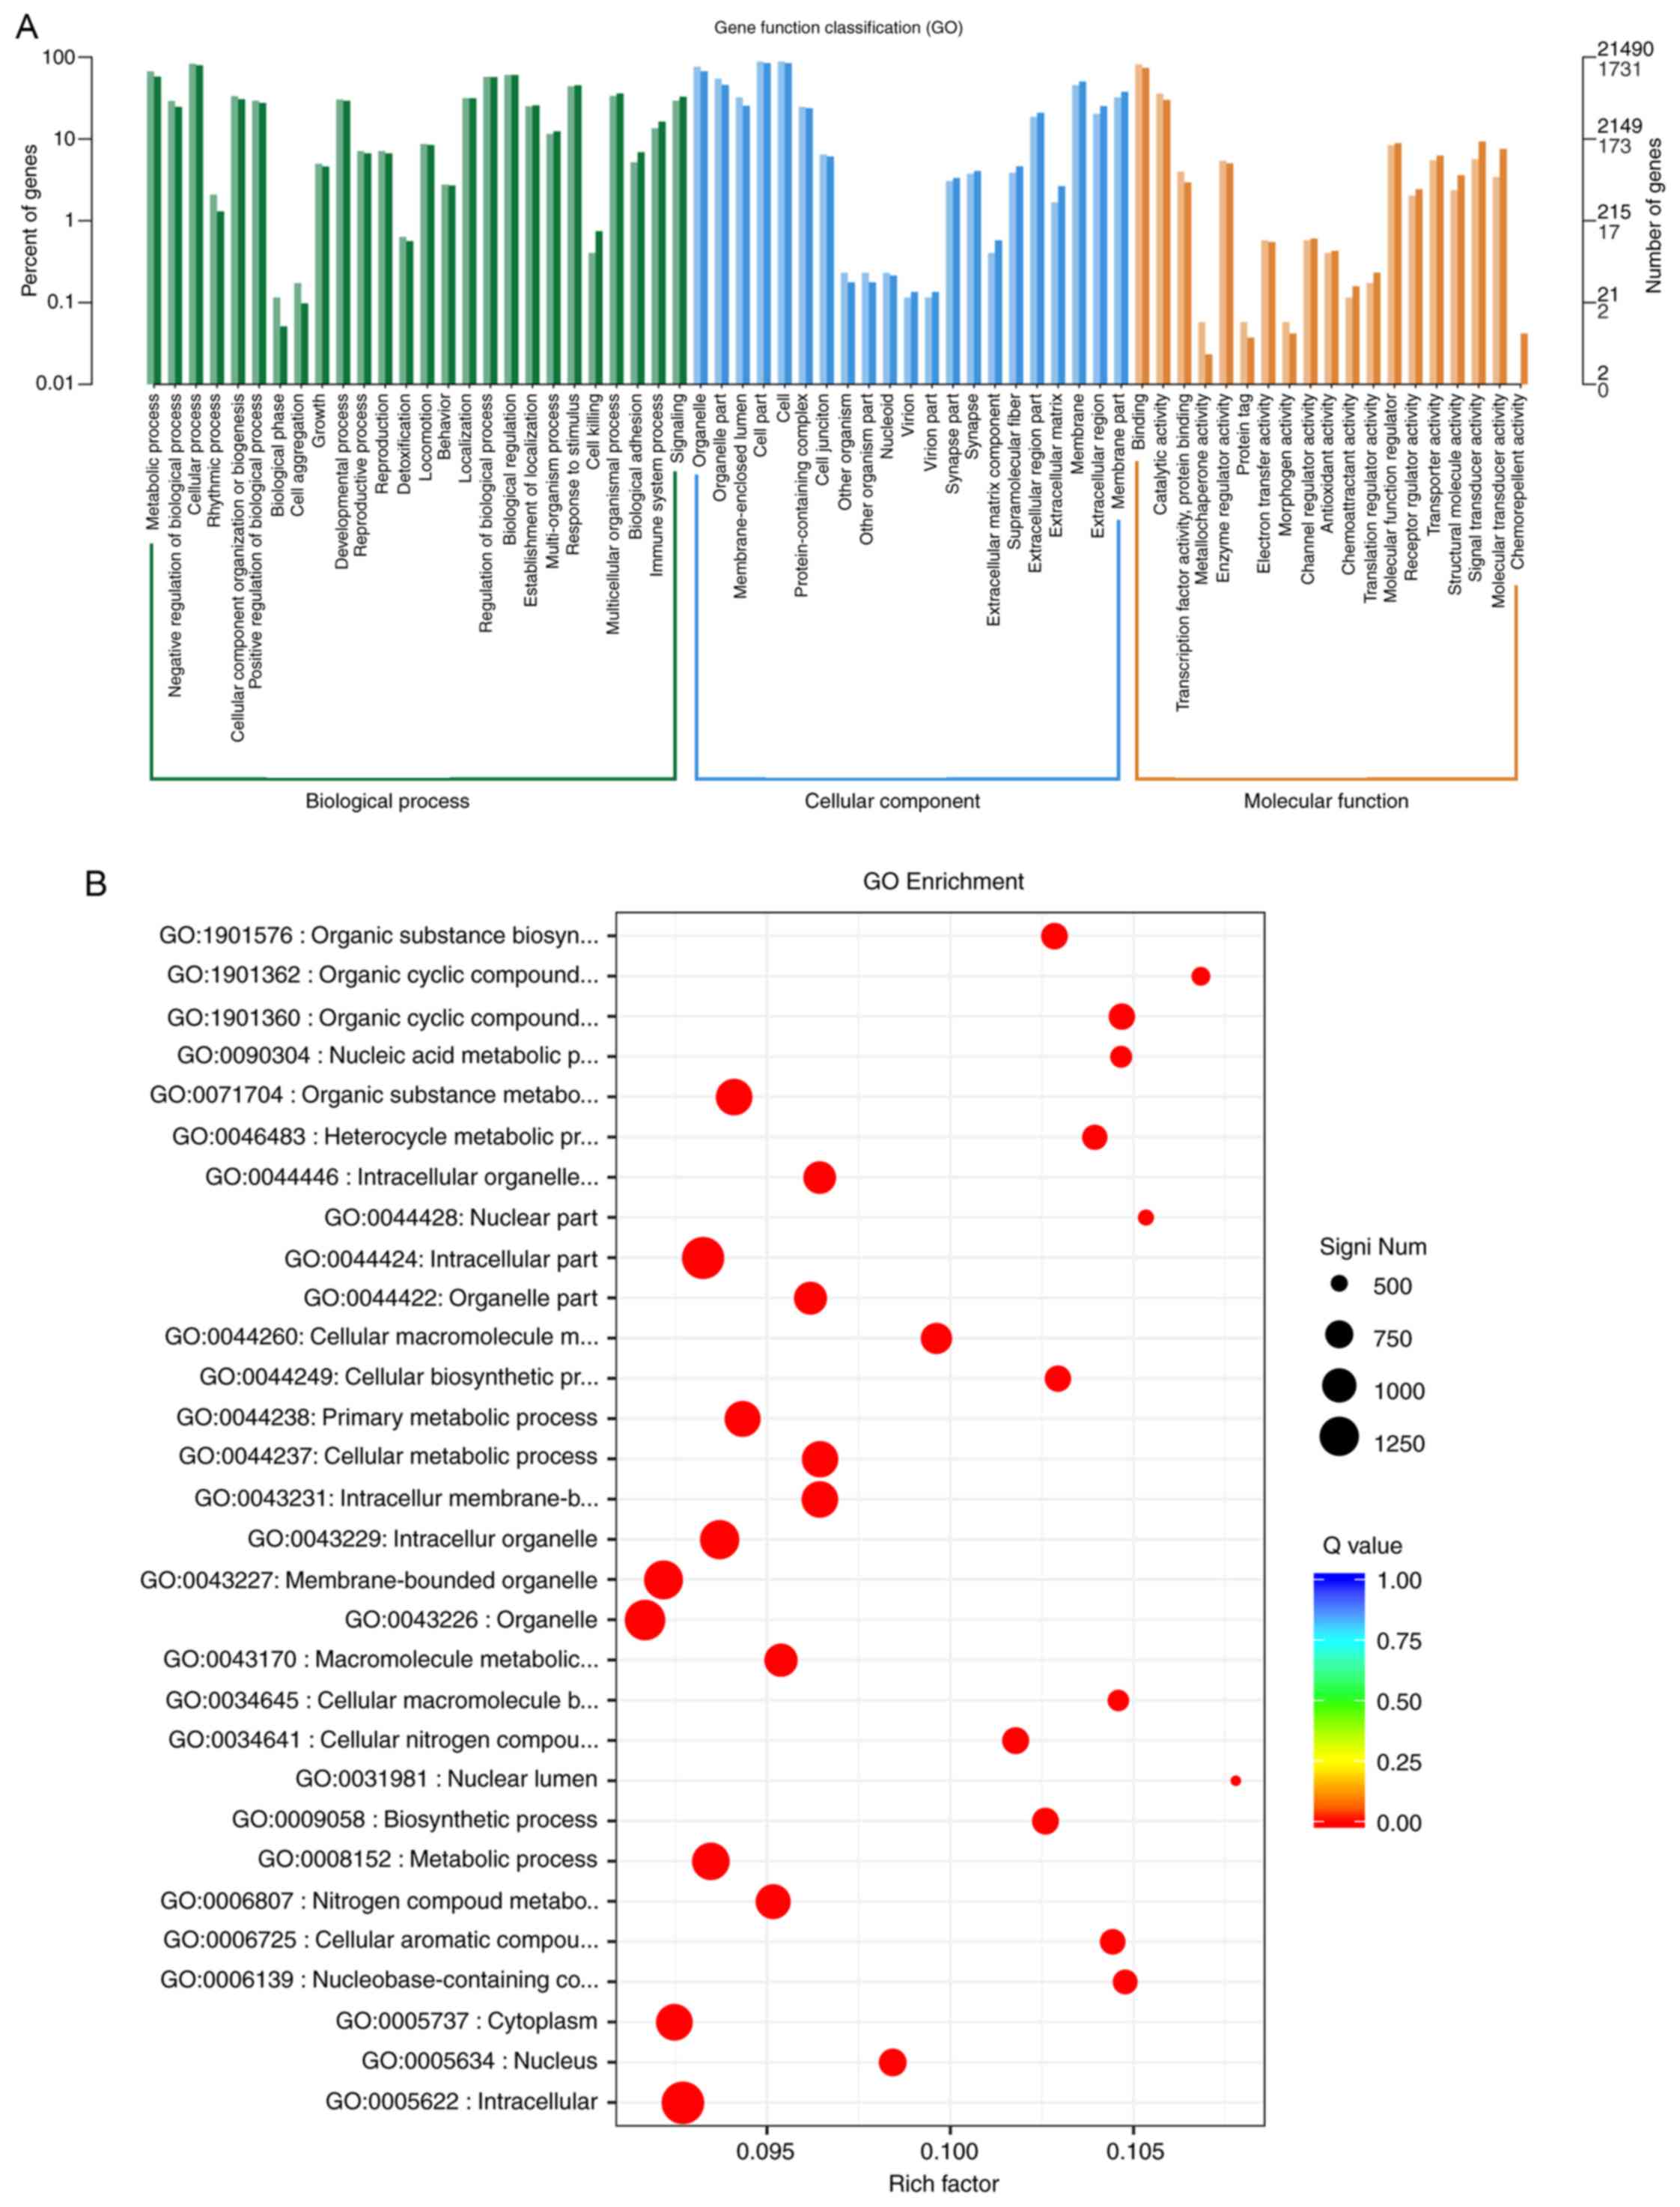 | Figure 5.(A) GO categories; the horizontal
axis is the functional classification, and the vertical axis is the
number of genes in the classification (right) and the percentage of
the total number of genes annotated (left). Different colors
represent different categories. On the histograms and axes, light
colors represent the differentially expressed genes, and dark
colors represent all genes. (B) GO enrichment scatter; the vertical
axis represents the functional annotation information, and the
horizontal axis represents the Rich factor, corresponding to the
function (the number of differentially expressed genes annotated to
this function divided by the number of genes annotated to this
function). The size of the q-value is represented by the colors of
the dots. The smaller the q-value is, the closer the color is to
red. Only the top 30 GO terms with the highest degree of enrichment
were analyzed. (C) KOG enrichment network; square nodes represent
functional information, circular nodes represent genes, and edges
represent the correlation between genes and functions. The size of
the node is proportional to the degree of connectivity of the node;
that is, the more edges there are connected with the node, the
larger the node is. The color of circular nodes represents the
expression difference of genes in the samples; green represents
downregulation, red represents upregulation, and the color depth
represents the differential regulation. The color of the square
nodes represents the P-value. The higher the enrichment degree is,
the lower the P-value is, and the darker the color is. The larger
the square node area is, the more differentially expressed genes
are involved and contribute to the biological phenomenon. Only the
top 10 functions with the highest degree of enrichment and their
differentially mapped genes were analyzed. GO, gene ontology; KOG,
eukaryotic orthologous group. |
Clusters of Orthologous Groups of proteins (COG) and
KOG are the NCBI annotation system based on direct homologous
relationships of genes. Among these, COG targets prokaryotes and
KOG targets eukaryotes. COG/KOG combines evolutionary
relationships, homologous genes from different species are divided
into different Ortholog clusters. Currently, there are 4,873
categories for COG and 4,852 categories for KOG. The genes from the
same ortholog have the same functions. In the present study, KOG
classification indicated that the DEGs were classed into 26
functional categories. The only categories that were statistically
significant were ‘chromatin structure’ and ‘dynamics’ (q-value
<0.05). A total of 43 genes involved in the functional category
were identified. Compared with the untransfected group, 14 genes
were downregulated and 29 genes were upregulated. The top four
genes with a log2FoldChange were: Histone cluster 2 H3 pseudogene 2
(HIST2H3PS2) (log2FoldChange=22.65), histone cluster 2 H3 family
member D (HIST2H3D) (log2FoldChange=5.35), CENPB DNA-binding domain
containing 1 (CENPBD1) (log2FoldChange=2.84), histone cluster 1 H2A
family member I (HIST1H2AI) (log2FoldChange=2.78; Fig. 5C).
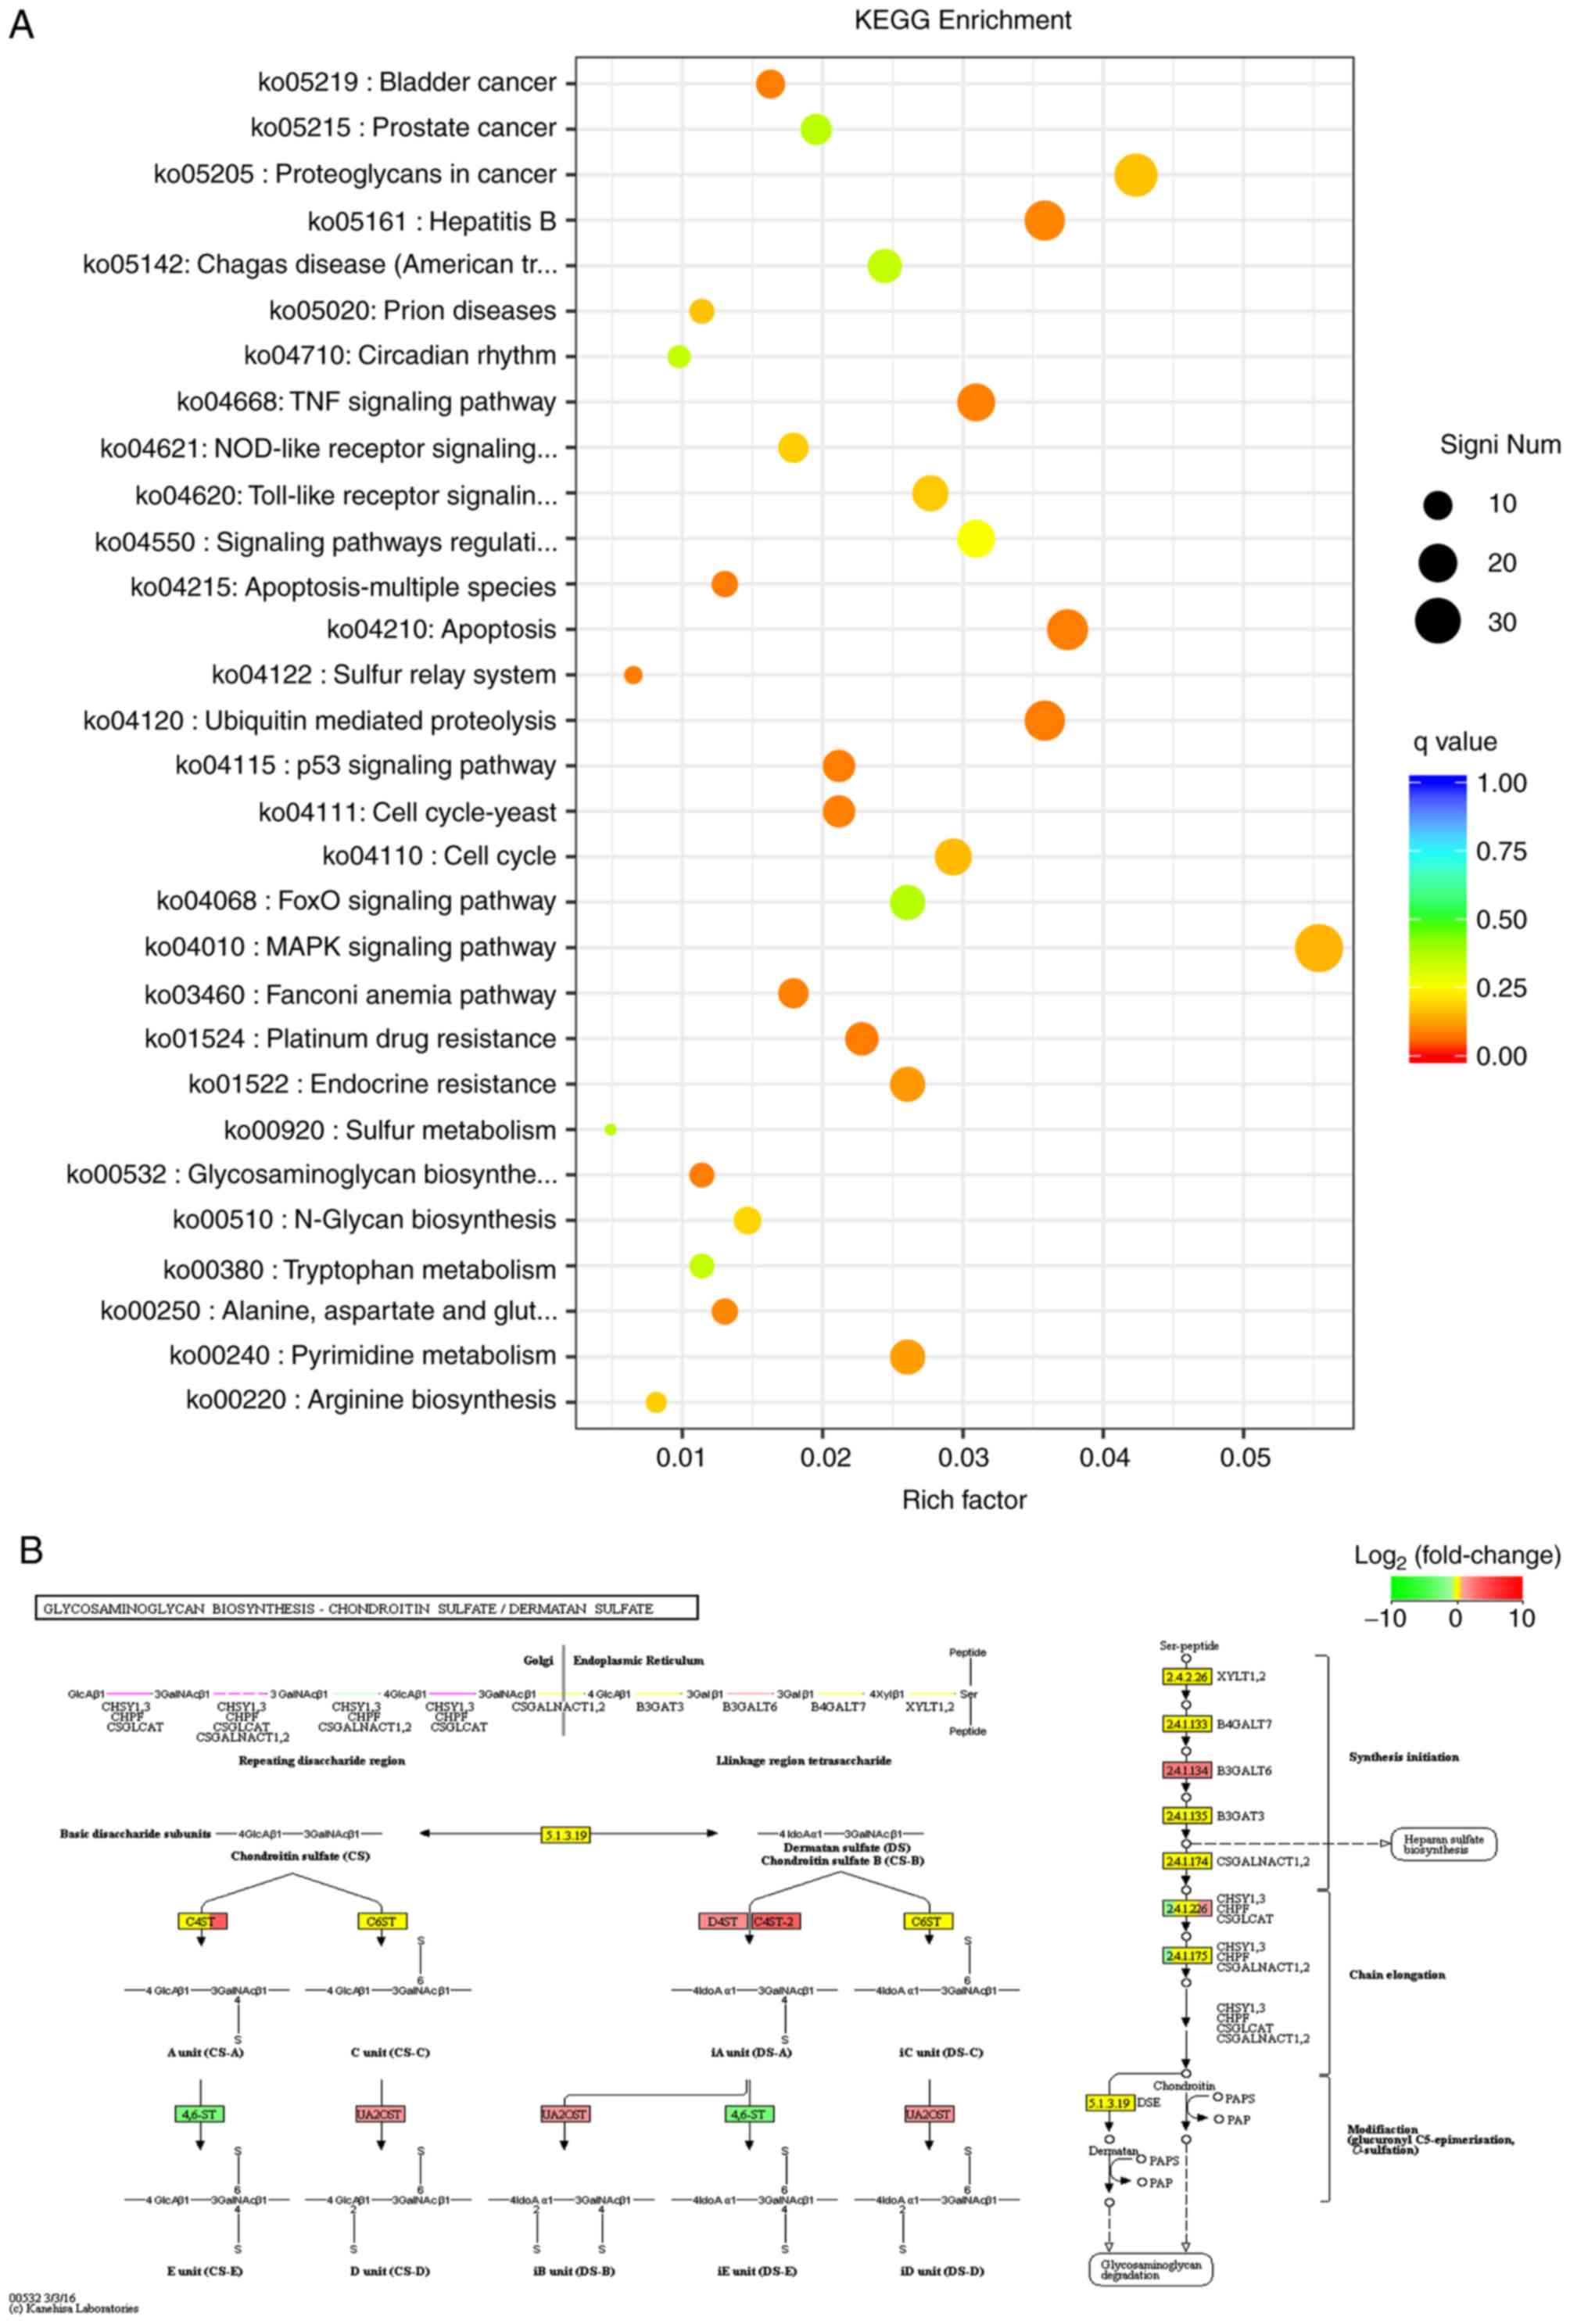
KEGG enrichment analysis
KEGG is a relatively complete database of biological
systems, integrating genomic, chemical and system functional
information. The pathway database is the most commonly used
sub-database (27). In RNA-seq,
KEGG enrichment was used to analyze the DEGs, which were shown as
scatter plots (Fig. 6A). KEGG
enrichment was measured using the Rich factor, q-value and the
number of genes enriched in this pathway. A total of 306 KEGG
pathways were identified, and the top three most significant
pathways are presented in Fig.
6B-D. These were ‘glycosaminoglycan biosynthesis-chondroitin
sulfate/dermatan sulfate’ (ko00532), ‘ubiquitin mediated
proteolysis’ (ko04120) and ‘bladder cancer’ (ko05219). Furthermore,
the levels of expression of carbohydrate sulfotransferase 14
(CHST14), chondroitin 4-sulfotransferase 2 (CHST12), uronyl
2-sulfotransferase (UST), B3GALT6, chondroitin polymerizing factor
2 (CHPF2) were upregulated, whereas CHST15 and chondroitin
polymerizing factor (CHPF) were downregulated in the
glycosaminoglycan biosynthesis-chondroitin sulfate/dermatan sulfate
pathway. RT-qPCR was used to confirm the changes in the top three
genes based on the log2FoldChange values. These were CHST12
(log2FoldChange=3.61), B3GALT6 (log2FoldChange=2.34) and CHST15
(log2FoldChange=−2.41) (P=0.0075) (Fig. S2). The RT-qPCR results were
consistent with the sequencing results. Similarly, the levels of
expression of certain genes changed significantly in the
ubiquitin-mediated proteolysis pathway and bladder cancer
pathway.
Mono-ADP-ribosylation of H3R117
affects invasion and metastasis by mediating Wnt/β-catenin
signaling in Lovo cells
To examine the function of mono-ADP-ribosylation in
invasion and metastasis in CRC, Transwell invasion and wound
healing assays were performed. The results demonstrated that
compared with the untransfected cells, the cell invasion and
metastatic capacity (P=0.0105) of the mutated cells were reduced
(Fig. S3A and B). Previous studies
have shown that the glycosaminoglycan biosynthesis-chondroitin
sulfate/dermatan sulfate pathway is associated with invasion and
metastasis. Thus, how this pathway was involved in tumor metastasis
was assessed. Previous studies have reported that chondroitin
sulfate/dermatan sulfate proteoglycans interact with Wnt, resulting
in increased accumulation of β-catenin, which regulates tumor
metastasis and other biological activities (28). In the present study, western
blotting and immunofluorescence were performed to evaluate the
expression of β-catenin, and the results showed that the expression
of β-catenin was decreased significantly in the mutation group
(P=0.0138 and P=0.0023; Fig. S3C and
D, respectively). These results suggested that
mono-ADP-ribosylation of H3R117 in Lovo cells regulates the
biosynthesis of chondroitin sulfate/dermatan sulfate, and that this
is involved in tumor metastasis by regulating Wnt/β-catenin
signaling.
Discussion
Chromatin modification can affect various biological
processes, such as the compaction and plasticity of chromatin, gene
expression, cell differentiation and apoptosis (29,30).
Histone H3 is the histone with the highest degree of
post-translational modifications, and this includes ADP
ribosylation (31).
Mono-ADP-ribosylation serves varying roles in a number of
biological processes, and its effects are dependent on the location
of the modification within the protein. Identification of
ADP-ribosylated proteins and ADP-ribose acceptor sites is important
for understanding the biological function of ADP ribosylation
(32,33). Histones are known to be targets of
ADP ribosylation; however, there is a dearth of studies identifying
specific sites (34). In a previous
study, it was shown that the H3R117 site in Lovo cells is
ADP-ribosylated using LC-MS/MS, and there are numerous studies
examining the effects of this specific ribosylation.
Mono-ADP-ribosylation may affect CRC by modulating enzyme activity
or gene expression of associated enzymes (14,35).
As CRC is very heterogeneous and has multiple potential
evolutionary paths (36), and as
mono-ADP-ribosylation of H3R117 is closely associated with CRC, it
was hypothesized that changes in the mono-ADP-ribosylation of
H3R117 in specific genes in CRC cells may affect downstream
pathways associated with the proteins encoded by these genes.
Therefore, transcriptome sequencing and bioinformatics were used to
investigate the potential biological functions of
mono-ADP-ribosylation of H3R117 in gene expression and the
associated pathways in CRC.
High quality raw data was obtained by sequencing,
and quality controls were used to ensure the accuracy of the data.
Subsequently, bioinformatics analysis was used to determine changes
in genes and the relevance of these to the development and
progression of CRC following mutation of the mono-ADP-ribosylation
site. The results showed that a total of 558,174 DEGs were
identified, of which 2,324 were considered significant. Based on
the results of the differential expression analysis, a Venn diagram
was used to visually show the number of co-expressed and uniquely
expressed genes in each sample. The protein-protein interaction
network highlighted potential interactions associated with these
DEGs. Furthermore, the sequencing results showed that the effect of
mono-ADP-ribosylation on CRC was very complex, and affected various
functions and pathways.
A large number of SNP/indel sites were screened in
both the untransfected cells and cells transfected with the mutant
construct, and it was shown that the expression patterns of the two
samples were similar, with both groups possessing a large number of
SNPs. When examining the SNPs, A>G and T>C were considered
more prominent. For AS, TSS, SKIP and TTS were the three types of
AS that occurred more frequently. The presence of SNP sites is
associated with tumor susceptibility (37). Studies have identified common SNPs
associated with long-term risk and timing of metastasis of CRC in
Caucasian patients with stage I–III low microsatellite
instability/microsatellite stable cancer (38), and the AS pattern of mRNAs differ
between the tumor and the normal tissue from which it originated
(39). Abnormal AS is a common
phenomenon associated with cancer progression, and is also a
characteristic of CRC (40). In the
present study, the types and characteristics of variations in
genetic structure prior to and following mutation of the
mono-ADP-ribosylation site was assessed in CRC cells, laying a
foundation for further analysis and research.
GO analysis showed that these DEGs were enriched in
pathways associated with molecular function, cellular component and
biological process. In the biological process category, pathways
associated with ‘metabolic process’ and ‘negative regulation of
biological process’ were most frequently observed. In the cellular
component category, pathways associated with ‘organelle’ and
‘organelle part’ and ‘membrane-enclosed lumen’ were most frequently
observed. In molecular function, pathways associated with ‘binding’
and ‘catalytic activity’ were the most frequently observed. The
mapping of DEGs using KOG annotation showed that only chromatin
structure and dynamics (q<0.05) differed significantly. A total
of 43 genes were involved in the annotation classification of KOG,
among these, upregulated genes were more common than downregulated
genes, compared with the untransfected cells. The genes with the
greatest fold change were HIST2H3PS2, HIST2H3D, HIST1H2AI and
CENPBD1.
Nuclear structure is the most important histological
feature that distinguishes cancer cells from normal cells (41). In CRC, the most common type of
genomic instability is chromosomal instability, which results in
persistent quantitative and structural chromosomal aberrations in
cancer cells, leading to intracellular heterogeneity (42), and accounts for ~85% of all sporadic
cases of CRC (43). Activation of
oncogenes and inactivation of tumor suppressor genes are caused by
various types of somatic gene mutations, including variations in
chromatin structure (44). A
previous study showed that the H3R117A mutation promoted the
transcription and expression of the ten-eleven translocation (TET)
family member TET1, as its chromatin was made more accessible by
the mutation (35). Studies have
shown that lipopolysaccharide stimulation induces histone
ADP-ribosylation at transcriptionally active and accessible
chromatin regions in macrophages (45). Both mono-ADP-ribosylation and
poly-ADP-ribosylation directly affects chromatin structure
(46). Therefore
mono-ADP-ribosylation of H3R117 may be involved in the development
of CRC by affecting the structure and dynamics of chromatin. Based
on this, it was shown that the histone variants HIST2H3PS2,
HIST2H3D, HIST1H2AI and CENPBD1 were significantly differentially
expressed In eukaryotes, the existence of histone variants is based
on differences in the primary amino acid sequences, and these
variants have different regulatory mechanisms of expression,
deposition and genome occupancy (33). Histone variants can alter the
structure of nucleosomes and participate in the transcription,
replication and repair of DNA (47). CENPBD1 contributes to the formation
of the centromere, and may be associated with the prognosis of head
and neck squamous cell carcinoma (48). However, their role in CRC has not
been determined. Therefore, further experimental studies are
required to determine their relevance.
KEGG enrichment analysis screened 306 pathways;
among these, the glycosaminoglycan biosynthesis-chondroitin
sulfate/dermatan sulfate pathway was the most significantly
different. In addition, there were other pathways which were
significantly different which were investigated in previous
studies, including ‘cell cycle progression’ and ‘apoptosis’
(14,49). In the present study, a focus was
placed on glycosaminoglycan biosynthesis-chondroitin
sulfate/dermatan sulfate. Glycosaminoglycan is an important
component of the extracellular matrix. There are four types of
glycosaminoglycans: Hyaluronan, heparin/heparan sulfate,
chondroitin sulfate/dermatan sulfate and keratin sulfate.
Furthermore, chondroitin sulfate is divided into four different
classes: Chondroitin sulfate A, C, D and E. Chondroitin sulfate B
is the old name for dermatan sulfate, but it is no longer
classified a chondroitin sulfate (50).
Chondroitin sulfate/dermatan sulfate proteoglycans
exert their functions by interacting with specific proteins, such
as growth factors, matrix proteins and cell surface receptors, and
they serve an important role in cancer (28). Dermatan sulfate epimerase catalyzes
the conversion of chondroitin sulfate to dermatan sulfate, and is
considered an important mediator of the development of malignant
characteristics in hepatocellular carcinoma (51). The metabolism of chondroitin
sulfate/dermatan sulfate in tumor stroma is strongly altered. In
certain types of cancer, including CRC, the stromal content of
dermatan sulfate is increased, and the stromal accumulation of
chondroitin-6-sulfate affects the progression and metastasis of the
tumor (52). Similarly, chondroitin
sulfate serves an important role in the metastasis of breast cancer
(53). Increased chondroitin
sulfate chain length promotes chemoresistance and
epithelial-mesenchymal transition during the progression of CRC
(22), and the structure of
chondroitin sulfate/dermatan sulfate is significantly altered
compared with normal tissue in colon cancer (18). A variety of glycosyltransferases and
sulfotransferases are involved in the biosynthesis of chondroitin
sulfate, and alterations of the qualitative and quantitative terms
of glycosaminoglycans are attributed to changes in enzymes
(18). Additionally, it has been
reported that chondroitin sulfate/dermatan sulfate proteoglycans
present at the cell surface interact with Wnt, resulting in
increased accumulation of β-catenin, thus affecting tumor
metastasis (28). In CRC, it has
been hypothesized that the Wnt pathway interacts with the
chondroitin sulfate/dermatan sulfate components of the CRC stroma
(54). Metastasis is the leading
cause of mortality in CRC, and aberrant activation of the Wnt
signaling serves a crucial role in all stages of CRC development
and progression, including metastasis (55). In the present study, 7 genes were
enriched in the glycosaminoglycan biosynthesis-chondroitin
sulfate/dermatan sulfate pathway. These were CHPF (−1.2367585245),
B3GALT6 (2.33805834947), CHPF2 (1.10174702944), CHST12
(3.60850410389), CHST14 (1.60630204961), UST (1.34378885046) and
CHST15 (−2.4063182915). Among these, B3GALT6, CHPF2, CHST12, CHST14
and UST were upregulated, and CHPF and CHST15 were downregulated.
RT-qPCR was used to verify the top three DEGs based on fold change.
The experimental results were consistent with the sequencing
results. Furthermore, western blotting and immunofluorescence
experiments showed that β-catenin expression was significantly
reduced in the mutant group. Based on these results, it was
hypothesized that mono-ADP-ribosylation of histone regulated the
structure or expression of chondroitin sulfate by regulating the
synthesis of glycosaminoglycan-related enzymes, and subsequently
interfering with Wnt/β-catenin signaling to affect CRC metastasis.
However, the specific alterations in chondroitin sulfate/dermatan
sulfate chains were not determined. Therefore, the role of this
pathway in the development of tumors requires further study, and
the data show that mono-ADP-ribosylation may affect this pathway
via an unknown mechanism.
The second significant pathway was the
ubiquitin-mediated proteolysis pathway. One of the proteolytic
systems of eukaryotic cells is the ubiquitin-proteasome system
(USP). USP is a selective proteolytic system in which substrates
are identified and labeled with ubiquitin to mark them for
degradation by the protease system (56). The estrogen receptor (ER) is
considered the most successful molecular target of cancer drug
discovery; however, ERα is not detected in >60% of breast and
ovarian cancers. A possible reason for its deletion may be the
coupling of ER target gene transcription with receptor proteolysis.
ER is rapidly ubiquitinated and degraded after estrogen binding
(57). Studies have identified 40
support vector machine-classified signature genes in metastatic
CRC, and when KEGG enrichment was performed on these genes, one of
the most significantly enriched pathways was the ubiquitin-mediated
proteolysis pathway (58). The USP also serves an important role in
trans-criptional regulation (57).
The results of the present study showed that the ubiquitin-mediated
proteolysis pathway was the second most significantly enriched
pathway based on differential gene expression data, suggesting that
mono-ADP-ribosylation may serve a role in CRC in this pathway, and
thus the detailed mechanisms of the involvement of
mono-ADP-ribosylation in ubiquitin-mediated degradation require
further study.
The third significant pathway was the bladder cancer
pathway. This suggested that mono-ADP-ribosylation may affect the
expression of genes involved in a variety of tumors, which will not
be discussed in depth here.
Mono-ADP-ribosylation serves an important role in
CRC, the exact mechanisms of which are being discovered. In the
present study, transcriptome sequencing technology was used to
analyze the DEGs following the alteration of mono-ADP-ribosylation
modifications at specific sites. A series of structural variations
were determined to be associated with functional differences and
pathway alterations, providing a theoretical basis for studying the
effect of mono-ADP-ribosylation in CRC. Identifying potential
targets for the treatment of CRC from the perspective of
epigenetics may result in novel therapeutic options for the
treatment of patients.
Supplementary Material
Supporting Data
Acknowledgements
We are very grateful to Dr Yi Tang and Dr Ming Li of
the Department of Pathology, Molecular Medicine and Cancer Research
Center (Chongqing Medical University, China) for their work in
writing and modifying the manuscript.
Funding
The research was supported by Innovation Project of
Graduate Student in Chongqing (grant no. CYB17100); Scientific
Research Foundation of Chongqing Medical University (grant no.
201413); National Nature Science Foundation of China (grant no.
30870946); Science and Technology Plan Project of Yuzhong District
in Chongqing (grant no. 20140106); and The National High Technology
Research and Development Program of China (grant no.
2012AA02A201).
Availability of data and materials
The datasets used and/or analyzed during the present
study are available from the corresponding author on reasonable
request.
Authors' contributions
NNZ and TL performed the cell culture and RNA
extraction. YLW designed and conducted the experiments. MX, QSL,
LY, XL and CLW participated in analyzing the sequencing
results.
Ethics approval and consent to
participate
Not applicable.
Patient consent for publication
Not applicable.
Competing interests
The authors declare that they have no competing
interests.
Glossary
Abbreviations
Abbreviations:
|
CRC
|
colorectal cancer
|
|
KOG
|
eukaryotic orthologous group
|
|
DEGs
|
differentially expressed genes
|
|
RNA-seq
|
RNA sequencing
|
|
AE
|
alternative exon ends
|
|
SKIP
|
exon skipping
|
|
TSS
|
alternative transcription start
site
|
|
MIR
|
multiple introns
|
|
TTS
|
alternative transcription termination
site
|
|
GO
|
Gene Ontology
|
|
SNP
|
single nucleotide polymorphism
|
|
KEGG
|
Kyoto Encyclopedia of Genes and
Genomes
|
|
MSKIP
|
cassette exons
|
|
IR
|
retention of single
|
|
TET
|
ten-eleven translocation
|
|
STRING
|
Search Tool for the Retrieval of
Interacting Genes/Proteins
|
|
CENPBD1
|
CENPB DNA-binding domain containing
1
|
|
HIST2H3D
|
histone cluster 2 H3 family member
D
|
|
CHST14
|
carbohydrate sulfotransferase 14
|
|
UST
|
uronyl 2-sulfotransferase
|
|
CHST15
|
N-acetyl galactosamine 4-sulfate
6-O-sulfotransferase
|
|
HIST2H3PS2
|
histone cluster 2 H3 pseudogene 2
|
|
HIST1H2AI
|
histone cluster 1 H2A family member
I
|
|
B3GALT6
|
galactosylxylosyl protein
3-β-galactosyltransferase
|
|
CHPF
|
chondroitin polymerizing factor
|
|
CHPF2
|
chondroitin poly-merizing factor
2
|
References
|
1
|
Araghi M, Soerjomataram I, Jenkins M,
Brierley J, Morris E, Bray F and Arnold M: Global trends in
colorectal cancer mortality: Projections to the year 2035. Int J
Cancer. 144:2992–3000. 2019. View Article : Google Scholar : PubMed/NCBI
|
|
2
|
Schreuders EH, Ruco A, Rabeneck L, Schoen
RE, Sung JJ, Young GP and Kuipers EJ: Colorectal cancer screening:
A global overview of existing programmes. Gut. 64:1637–1649. 2015.
View Article : Google Scholar : PubMed/NCBI
|
|
3
|
Li XX, Peng JJ, Liang L, Huang LY, Li DW,
Shi DB, Zheng HT and Cai SJ: RNA-seq identifies determinants of
oxaliplatin sensitivity in colorectal cancer cell lines. Int J Clin
Exp Pathol. 7:3763–3770. 2014.PubMed/NCBI
|
|
4
|
Cohen MS and Chang P: Insights into the
biogenesis, function, and regulation of ADP-ribosylation. Nat Chem
Biol. 14:236–243. 2018. View Article : Google Scholar : PubMed/NCBI
|
|
5
|
Luscher B, Butepage M, Eckei L, Krieg S,
Verheugd P and Shilton BH: ADP-ribosylation, a multifaceted
posttranslational modification involved in the control of cell
physiology in health and disease. Chem Rev. 118:1092–1136. 2018.
View Article : Google Scholar : PubMed/NCBI
|
|
6
|
Jain PG and Patel BD: Medicinal chemistry
approaches of poly ADP-Ribose polymerase 1 (PARP1) inhibitors as
anticancer agents-A recent update. Eur J Med Chem. 165:198–215.
2019. View Article : Google Scholar : PubMed/NCBI
|
|
7
|
Kunze FA and Hottiger MO: Regulating
immunity via ADP-ribosylation: Therapeutic implications and beyond.
Trends Immunol. 40:159–173. 2019. View Article : Google Scholar : PubMed/NCBI
|
|
8
|
Hendriks IA, Larsen SC and Nielsen ML: An
advanced strategy for comprehensive profiling of ADP-ribosylation
sites using mass spectrometry-based proteomics. Mol Cell
Proteomics. 18:1010–1026. 2019. View Article : Google Scholar : PubMed/NCBI
|
|
9
|
Sakthianandeswaren A, Parsons MJ, Mouradov
D, MacKinnon RN, Catimel B, Liu S, Palmieri M, Love C, Jorissen RN,
Li S, et al: MACROD2 haploinsufficiency impairs catalytic activity
of PARP1 and promotes chromosome instability and growth of
intestinal tumors. Cancer Discov. 8:988–1005. 2018. View Article : Google Scholar : PubMed/NCBI
|
|
10
|
Rajaram M, Zhang J, Wang T, Li J, Kuscu C,
Qi H, Kato M, Grubor V, Weil RJ, Helland A, et al: Two distinct
categories of focal deletions in cancer genomes. PLoS One.
8:e662642013. View Article : Google Scholar : PubMed/NCBI
|
|
11
|
Zhang Y, Wang J, Ding M and Yu Y:
Site-specific characterization of the Asp- and Glu-ADP-ribosylated
proteome. Nat Methods. 10:981–984. 2013. View Article : Google Scholar : PubMed/NCBI
|
|
12
|
Bonfiglio JJ, Fontana P, Zhang Q, Colby T,
Gibbs-Seymour I, Atanassov I, Bartlett E, Zaja R, Ahel I and Matic
I: Serine ADP-ribosylation depends on HPF1. Mol Cell. 65:932–940
e6. 2017. View Article : Google Scholar : PubMed/NCBI
|
|
13
|
Paone G, Wada A, Stevens LA, Matin A,
Hirayama T, Levine RL and Moss J: ADP ribosylation of human
neutrophil peptide-1 regulates its biological properties. Proc Natl
Acad Sci USA. 99:8231–8235. 2002. View Article : Google Scholar : PubMed/NCBI
|
|
14
|
Ling F, Tang Y, Li M, Li QS, Li X, Yang L,
Zhao W, Jin CC, Zeng Z, Liu C, et al: Mono-ADP-ribosylation of
histone 3 at arginine-117 promotes proliferation through its
interaction with P300. Oncotarget. 8:72773–72787. 2017. View Article : Google Scholar : PubMed/NCBI
|
|
15
|
Jing C, Ma R, Cao H, Wang Z, Liu S, Chen
D, Wu Y, Zhang J and Wu J: Long noncoding RNA and mRNA profiling in
cetuximab-resistant colorectal cancer cells by RNA sequencing
analysis. Cancer Med. 8:1641–1651. 2019. View Article : Google Scholar : PubMed/NCBI
|
|
16
|
Vacchelli E, Ma Y, Baracco EE, Sistigu A,
Enot DP, Pietrocola F, Yang H, Adjemian S, Chaba K, Semeraro M, et
al: Chemotherapy-induced antitumor immunity requires formyl peptide
receptor 1. Science. 350:972–978. 2015. View Article : Google Scholar : PubMed/NCBI
|
|
17
|
Lin KT, Shann YJ, Chau GY, Hsu CN and
Huang CY: Identification of latent biomarkers in hepatocellular
carcinoma by ultra-deep whole-transcriptome sequencing. Oncogene.
33:4786–4794. 2014. View Article : Google Scholar : PubMed/NCBI
|
|
18
|
Kalathas D, Theocharis DA, Bounias D,
Kyriakopoulou D, Papageorgakopoulou N, Stavropoulos MS and Vynios
DH: Chondroitin synthases I, II, III and chondroitin sulfate
glucuronyltransferase expression in colorectal cancer. Mol Med Rep.
4:363–368. 2011.PubMed/NCBI
|
|
19
|
Kalathas D, Theocharis DA, Bounias D,
Kyriakopoulou D, Papageorgakopoulou N, Stavropoulos MS and Vynios
DH: Alterations of glycosaminoglycan disaccharide content and
composition in colorectal cancer: Structural and expressional
studies. Oncol Rep. 22:369–375. 2009.PubMed/NCBI
|
|
20
|
Jayson GC, Lyon M, Paraskeva C, Turnbull
JE, Deakin JA and Gallagher JT: Heparan sulfate undergoes specific
structural changes during the progression from human colon adenoma
to carcinoma in vitro. J Biol Chem. 273:51–57. 1998. View Article : Google Scholar : PubMed/NCBI
|
|
21
|
Zeng L, Qian J, Luo X, Zhou A, Zhang Z and
Fang Q: CHSY1 promoted proliferation and suppressed apoptosis in
colorectal cancer through regulation of the NFκB and/or caspase-3/7
signaling pathway. Oncol Lett. 16:6140–6146. 2018.PubMed/NCBI
|
|
22
|
Hoshiba T: An extracellular matrix (ECM)
model at high malignant colorectal tumor increases chondroitin
sulfate chains to promote epithelial-mesenchymal transition and
chemoresistance acquisition. Exp Cell Res. 370:571–578. 2018.
View Article : Google Scholar : PubMed/NCBI
|
|
23
|
Bolger AM, Lohse M and Usadel B:
Trimmomatic: A flexible trimmer for Illumina sequence data.
Bioinformatics. 30:2114–2120. 2014. View Article : Google Scholar : PubMed/NCBI
|
|
24
|
Pertea M, Pertea GM, Antonescu CM, Chang
TC, Mendell JT and Salzberg SL: StringTie enables improved
reconstruction of a transcriptome from RNA-seq reads. Nat
Biotechnol. 33:290–295. 2015. View Article : Google Scholar : PubMed/NCBI
|
|
25
|
Livak KJ and Schmittgen TD: Analysis of
relative gene expression data using real-time quantitative PCR and
the 2(-Delta Delta C(T)) method. Methods. 25:402–408. 2001.
View Article : Google Scholar : PubMed/NCBI
|
|
26
|
Okonechnikov K, Conesa A and
García-Alcalde F: Qualimap 2: Advanced multi-sample quality control
for high-throughput sequencing data. Bioinformatics. 32:292–294.
2016.PubMed/NCBI
|
|
27
|
Kanehisa M, Furumichi M, Tanabe M, Sato Y
and Morishima K: KEGG: New perspectives on genomes, pathways,
diseases and drugs. Nucleic Acids Res. 45(D1): D353–D361. 2017.
View Article : Google Scholar : PubMed/NCBI
|
|
28
|
Mizumoto S, Yamada S and Sugahara K:
Molecular interactions between chondroitin-dermatan sulfate and
growth factors/receptors/matrix proteins. Curr Opin Struct Biol.
34:35–42. 2015. View Article : Google Scholar : PubMed/NCBI
|
|
29
|
Yoon YS, Kim JW, Kang KW, Kim YS, Choi KH
and Joe CO: Poly(ADP-ribosyl)ation of histone H1 correlates with
internucleosomal DNA fragmentation during apoptosis. J Biol Chem.
271:9129–9134. 1996. View Article : Google Scholar : PubMed/NCBI
|
|
30
|
Voigt P, Tee WW and Reinberg D: A double
take on bivalent promoters. Genes Dev. 27:1318–1338. 2013.
View Article : Google Scholar : PubMed/NCBI
|
|
31
|
Gupte R, Liu Z and Kraus WL: PARPs and
ADP-ribosylation: Recent advances linking molecular functions to
biological outcomes. Genes Dev. 31:101–126. 2017. View Article : Google Scholar : PubMed/NCBI
|
|
32
|
Hottiger MO: Nuclear ADP-ribosylation and
its role in chromatin plasticity, cell differentiation, and
epigenetics. Annu Rev Biochem. 84:227–263. 2015. View Article : Google Scholar : PubMed/NCBI
|
|
33
|
Xu YM, Du JY and Lau AT: Posttranslational
modifications of human histone H3: An update. Proteomics.
14:2047–2060. 2014. View Article : Google Scholar : PubMed/NCBI
|
|
34
|
Rakhimova A, Ura S, Hsu DW, Wang HY, Pears
CJ and Lakin ND: Site-specific ADP-ribosylation of histone H2B in
response to DNA double strand breaks. Sci Rep. 7:437502017.
View Article : Google Scholar : PubMed/NCBI
|
|
35
|
Li M, Tang Y, Li Q, Xiao M, Yang Y and
Wang Y: Mono-ADP-ribosylation of H3R117 traps 5mC hydroxylase TET1
to impair demethylation of tumor suppressor gene TFPI2. Oncogene.
38:3488–3503. 2019.
Castle JC, Loewer M, Boegel S, de Graaf J,
Bender C, Tadmor AD, Boisguerin V, Bukur T, Sorn P, Paret C, et
al: Immunomic, genomic and transcriptomic characterization of
CT26 colorectal carcinoma. BMC Genomics 15: 190, 2014. View Article : Google Scholar : PubMed/NCBI
|
|
36
|
Simonian M, Mosallaei M, Khosravi S and
Salehi R: rs12904 polymorphism in the 3′-untranslated region of
ephrin A1 ligand and the risk of sporadic colorectal cancer in the
Iranian population. J Cancer Res Ther. 15:15–19. 2019.PubMed/NCBI
|
|
37
|
Penney ME, Parfrey PS, Savas S and Yilmaz
YE: A genome-wide association study identifies single nucleotide
polymorphisms associated with time-to-metastasis in colorectal
cancer. BMC Cancer. 19:1332019. View Article : Google Scholar : PubMed/NCBI
|
|
38
|
Sveen A, Kilpinen S, Ruusulehto A, Lothe
RA and Skotheim RI: Aberrant RNA splicing in cancer; expression
changes and driver mutations of splicing factor genes. Oncogene.
35:2413–2427. 2016. View Article : Google Scholar : PubMed/NCBI
|
|
39
|
Liu J, Li H, Shen S, Sun L, Yuan Y and
Xing C: Alternative splicing events implicated in carcinogenesis
and prognosis of colorectal cancer. J Cancer. 9:1754–1764. 2018.
View Article : Google Scholar : PubMed/NCBI
|
|
40
|
Resar L, Chia L and Xian L: Lessons from
the Crypt: HMGA1-Amping up Wnt for stem cells and tumor
progression. Cancer Res. 78:1890–1897. 2018. View Article : Google Scholar : PubMed/NCBI
|
|
41
|
Lee AJ, Endesfelder D, Rowan AJ, Walther
A, Birkbak NJ, Futreal PA, Downward J, Szallasi Z, Tomlinson IP,
Howell M, et al: Chromosomal instability confers intrinsic
multidrug resistance. Cancer Res. 71:1858–1870. 2011. View Article : Google Scholar : PubMed/NCBI
|
|
42
|
Ahmed D, Eide PW, Eilertsen IA, Danielsen
SA, Eknæs M, Hektoen M, Lind GE and Lothe RA: Epigenetic and
genetic features of 24 colon cancer cell lines. Oncogenesis.
2:e712013. View Article : Google Scholar : PubMed/NCBI
|
|
43
|
van den Broek E, Dijkstra MJ, Krijgsman O,
Sie D, Haan JC, Traets JJ, van de Wiel MA, Nagtegaal ID, Punt CJ,
Carvalho B, et al: High prevalence and clinical relevance of genes
affected by chromosomal breaks in colorectal cancer. PLoS One.
10:e01381412015. View Article : Google Scholar : PubMed/NCBI
|
|
44
|
Martinez-Zamudio R and Ha HC: Histone
ADP-ribosylation facilitates gene transcription by directly
remodeling nucleosomes. Mol Cell Biol. 32:2490–2502. 2012.
View Article : Google Scholar : PubMed/NCBI
|
|
45
|
Abplanalp J and Hottiger MO: Cell fate
regulation by chromatin ADP-ribosylation. Semin Cell Dev Biol.
63:114–122. 2017. View Article : Google Scholar : PubMed/NCBI
|
|
46
|
Clouaire T and Legube G: A snapshot on the
Cis chromatin response to DNA double-strand breaks. Trends Genet.
35:330–345. 2019. View Article : Google Scholar : PubMed/NCBI
|
|
47
|
Wintergerst L, Selmansberger M, Maihoefer
C, Schüttrumpf L, Walch A, Wilke C, Pitea A, Woischke C, Baumeister
P, Kirchner T, et al: A prognostic mRNA expression signature of
four 16q24.3 genes in radio(chemo)therapy-treated head and neck
squamous cell carcinoma (HNSCC). Mol Oncol. 12:2085–2101. 2018.
View Article : Google Scholar : PubMed/NCBI
|
|
48
|
Zhen Z: Effects of Histone H3
Arginine-specific Mono-ADP-ribosylation on proliferation and
apoptosis of human colon cancer cell and its possible mechanism.
Chongqing Med Univ; 2016
|
|
49
|
Mende M, Bednarek C, Wawryszyn M, Sauter
P, Biskup MB, Schepers U and Bräse S: Chemical synthesis of
glycosaminoglycans. Chem Rev. 116:8193–8255. 2016. View Article : Google Scholar : PubMed/NCBI
|
|
50
|
Liao WC, Yen HR, Liao CK, Tseng TJ, Lan CT
and Liu CH: DSE regulates the malignant characters of
hepatocellular carcinoma cells by modulating CCL5/CCR1 axis. Am J
Cancer Res. 9:347–362. 2019.PubMed/NCBI
|
|
51
|
Pudelko A, Wisowski G, Olczyk K and Kozma
EM: The dual role of the glycosaminoglycan chondroitin-6-sulfate in
the development, progression and metastasis of cancer. FEBS J.
286:1815–1837. 2019. View Article : Google Scholar : PubMed/NCBI
|
|
52
|
Kopec M, Imiela A and Abramczyk H:
Monitoring glycosylation metabolism in brain and breast cancer by
Raman imaging. Sci Rep. 9:1662019. View Article : Google Scholar : PubMed/NCBI
|
|
53
|
Nikitovic D, Chatzinikolaou G, Tsiaoussis
J, Tsatsakis A, Karamanos NK and Tzanakakis GN: Insights into
targeting colon cancer cell fate at the level of
proteoglycans/glycosaminoglycans. Curr Med Chem. 19:4247–4258.
2012. View Article : Google Scholar : PubMed/NCBI
|
|
54
|
Qi J, Yu Y, Akilli Öztürk Ö, Holland JD,
Besser D, Fritzmann J, Wulf-Goldenberg A, Eckert K, Fichtner I and
Birchmeier W: New Wnt/β-catenin target genes promote experimental
metastasis and migration of colorectal cancer cells through
different signals. Gut. 65:1690–1701. 2016. View Article : Google Scholar : PubMed/NCBI
|
|
55
|
Ji CH and Kwon YT: Crosstalk and interplay
between the ubiquitin-proteasome system and autophagy. Mol Cells.
40:441–449. 2017.PubMed/NCBI
|
|
56
|
Zhou W and Slingerland JM: Links between
oestrogen receptor activation and proteolysis: Relevance to
hormone-regulated cancer therapy. Nat Rev Cancer. 14:26–38. 2014.
View Article : Google Scholar : PubMed/NCBI
|
|
57
|
Zhi J, Sun J, Wang Z and Ding W: Support
vector machine classifier for prediction of the metastasis of
colorectal cancer. Int J Mol Med. 41:1419–1426. 2018.PubMed/NCBI
|