Introduction
Non-small cell lung cancer (NSCLC) is the most
common malignant tumor globally and is associated with an extremely
high mortality rate (1). The
incidence of NSCLC continues to surge globally. As with other
tumors, lung adenocarcinoma which accounts for about 35–45% of all
lung malignant tumors is a heterogeneous disease characterized by
high rates of genetic mutation (2).
Despite the emergence of diverse new approaches for the treatment
of lung adenocarcinoma, such as targeted and immune therapy, long
term survival is still poor (3,4). One
of the main reasons for this is that most patients are diagnosed at
an advanced stage. Thus, it is necessary to understand the
molecular mechanisms behind lung adenocarcinoma genesis, growth and
progression, and identify biomarkers that can be detected during
the early stages of the disease.
Recently, high-throughput bioinformatic technologies
such as microarrays have been widely used to screen for
differentially expressed genes (DEGs) and identify the functional
pathways involved in the genesis and development of lung
adenocarcinoma. However, the reliable results are not easy to
obtain due to the false-positive rates that may exist in every
independent microarray analysis. Thus, we downloaded three original
mRNA data sets (GSE32863, GSE63459 and GSE75037) from the Gene
Expression Omnibus (GEO; http://www.ncbi.nlm.nih.gov/geo/) and aimed to
identify the DEGs between normal lung and lung adenocarcinoma
tissues. Next, the Kyoto Encyclopedia of Genes and Genomes (KEGG;
http://www.genome.jp/) and Gene Ontology (GO;
http://www.geneontology.org) databases
were used to identify biological processes enriched in DEGs, and
integrated protein-protein interaction (PPI) network analysis was
used to help us understand the molecular mechanisms underlying lung
adenocarcinoma genesis and development. Sixteen hub genes and 376
DEGs were identified, which could be potential target genes and
candidate biomarkers for lung adenocarcinoma. To minimize the
false-positive rate of the microarray analysis, the results were
then confirmed in cell lines and human sample tissues.
Materials and methods
Microarray data
GEO is a public functional genomics data repository
supporting MIAME-compliant data submissions. It accepts sequence
based and array data. Tools are provided to help users query and
download experiments and curated gene expression profiles (5). The GSE32863, GSE63459 and GSE75037
datasets produced by the Illumina HumanWG-6/Ref-8 v3.0 expression
beadchip platform (Illumina Inc; http://www.illumina.com) were downloaded for further
analysis. The GSE63459 dataset contains data from 33 lung
adenocarcinoma tissue samples and 32 adjacent normal tissue samples
(6). The GSE32863 dataset contains
data from 58 lung adenocarcinoma tissue samples and 58 fresh frozen
adjacent non-cancerous samples (7).
Moreover, the GSE75037 dataset contains data from 84 lung
adenocarcinoma and 84 adjacent non-cancerous lung tissue samples
(8).
Identification of DEGs
GEO2R is an online web tool (https://www.ncbi.nlm.nih.gov/geo/geo2r/) provided by
the GEO for comparing GEO series to identify DEGs across
experimental conditions. The cutoff criteria were set to P-value
<0.05 and logFC (fold change)>1. We excluded probe sets
without exact gene symbols, and genes with two or more probe sets
were averaged.
KEGG and GO enrichment analyses of
DEGs
The functional annotation tools version 6.7 of the
Database for Annotation, Integrated Discovery and Visualization
(9) (DAVID; http://david.ncifcrf.gov) were used to extract
biological information about our DEGs. KEGG is a public database
used for understanding the functions and abilities of biological
systems, such as cells, the organism and the ecosystem, from
molecular-level information, especially large-scale molecular
datasets acquired by genome sequencing (10). GO was also used to annotate genes
and further analyze their biological functions. The DAVID online
database was used to analyze the function and biological process of
the screened DEGs. P<0.05 was considered to indicate statistical
significance.
PPI network construction and
analysis
The Search Tool for the Retrieval of Interacting
Genes (STRING; http://string-db.org; version 10.0)
was used to construct the PPI network from the DEGs (11). The sources for interactions are text
mining, databases, experiments, neighborhood, co-expression, gene
co-occurrence and fusion. We set the minimum required interaction
score to 0.4. Cytoscape version 3.4.0 software (12) was used to visualize the molecular
interaction networks of the DEGs. The APP plug-in, Molecular
Complex Detection (MCODE) (13),
was used to arrange the network topology to cluster densely
connected genes. After the PPI networks was constructed, its key
modules were searched by using the MCODE application. The parameter
for inclusions are MCODE score >5, degree cutoff=2, node score
cutoff=0.2, node density cutoff=0.1, k-score=2 and Max depth=100.
Then, DAVID was used to perform the GO and KEGG analyses for these
most significant modules.
Hub gene screen and analysis
The criterion for being a hub gene selection was
degree ≥10. Further analysis was performed using the cBioPortal
online platform (http://www.cbioportal.org) to build the network of the
DEGs and co-expressing genes (14).
The mutation rates of the hub genes were also measured with the
cBioPortal platform (15).
Cytoscape's Biological Networks Gene Oncology tool (BiNGO) (version
3.0.3) was used for the biological process analysis and
visualization (16). The University
of California Santa Cruz (USCS) platform was used to analyze the
hierarchical clustering of hub genes (17). Kaplan-Meier curves for overall
survival and disease-free survival with these hub genes were
obtained from cBioPortal. The expression profiles of DNA
topoisomerase IIα (TOP2A) and aurora kinase A (AURKA)
in 20 types of malignant tumors were analyzed and displayed using
the Oncomine database (http://www.oncomine.com) (18).
Analysis of TOP2A and AURKA expression
in cell lines
To confirm our bioinformatics results, reverse
transcription and quantitative real-time PCR (RT-qPCR) were
conducted on lung adenocarcinoma (HCC827, A549 and H1975) cell
lines and a human bronchial epithelial (HBE) cell line. A549,
HCC827 and H1975 cells were purchased from the Shanghai Cell Bank
(Shanghai, China) and were cultured using Roswell Park Memorial
Institute (RPMI)-1640 medium (Gibco; Thermo Fisher Scientific,
Inc.). The medium was supplemented with 100 U/ml penicillin and 100
µg/ml streptomycin (Gibco; Thermo Fisher Scientific, Inc.), and 10%
fetal bovine serum (FBS) (Gibco; Thermo Fisher Scientific, Inc.)
under a 5% CO2-containing humidified atmosphere at 37°C.
Total RNA was extracted using TRIzol reagent (Invitrogen; Thermo
Fisher Scientific, Inc.). The isolated RNA was reverse-transcribed
into cDNA using a reverse transcription kit (Takara, Dalian,
China). RT-qPCR was performed as described in our previous
research, 2 min at 50°C, 10 min at 95°C, 40 cycles at 95°C for 15
sec, and 60°C for 30 sec (19) and
the results were normalized to glyceraldehyde 3-phosphate
dehydrogenase (GAPDH) levels. Primers were as follows:
TOP2A (forward, 5-AGGATTCCGCAGTTACGTGG-3 and reverse,
5-CATGTCTGCCGCCCTTAGAA-3) (20) and
AURKA (forward, 5-TTGGGTGGTCAGTACATGCTC-3 and reverse,
5-GTGAATTCAACCCGTGAT-3) (21) and
GAPDH sense, 5′-CAATGACCCCTTCATTGACC-3′ and reverse,
5′-TGGAAGATGGTGATGGGATT-3′. The statistical analyses were conducted
using SPSS version 21 (IBM Corp.). Results are displayed as mean ±
SEM and differences between the HBE and cancerous cell lines were
analyzed by one-way ANOVA. We further used the Tukey test to
determine the significance between each cancer cell line and HBE.
P-value <0.05 was considered to indicate statistical
significance. Each experiment was repeated three times.
Analysis of TOP2A and AURKA expression
in human samples
The Ethics Committee of the First Hospital of the
China Medical University (Shenyang, Liaoning, China) approved our
research. Written informed consent was received from all
participants. Seventy-two lung adenocarcinoma and paired
non-cancerous tissues were obtained between February 2013 and June
2014 from 35 women and 37 men, ranging in age from 38 to 75, with a
median age of 60. Patients who had received chemotherapy, target
therapy and radiotherapy or had a history of malignant tumor were
excluded. All of the diagnoses were confirmed by two experienced
pathologists. The resected samples were preserved at −80°C until
the mRNA of TOP2A and AURKA extraction were needed.
Differences between cancerous and non-cancerous tissues were
compared using the paired Student's t-test.
Results
Identification of DEGs in lung
adenocarcinoma
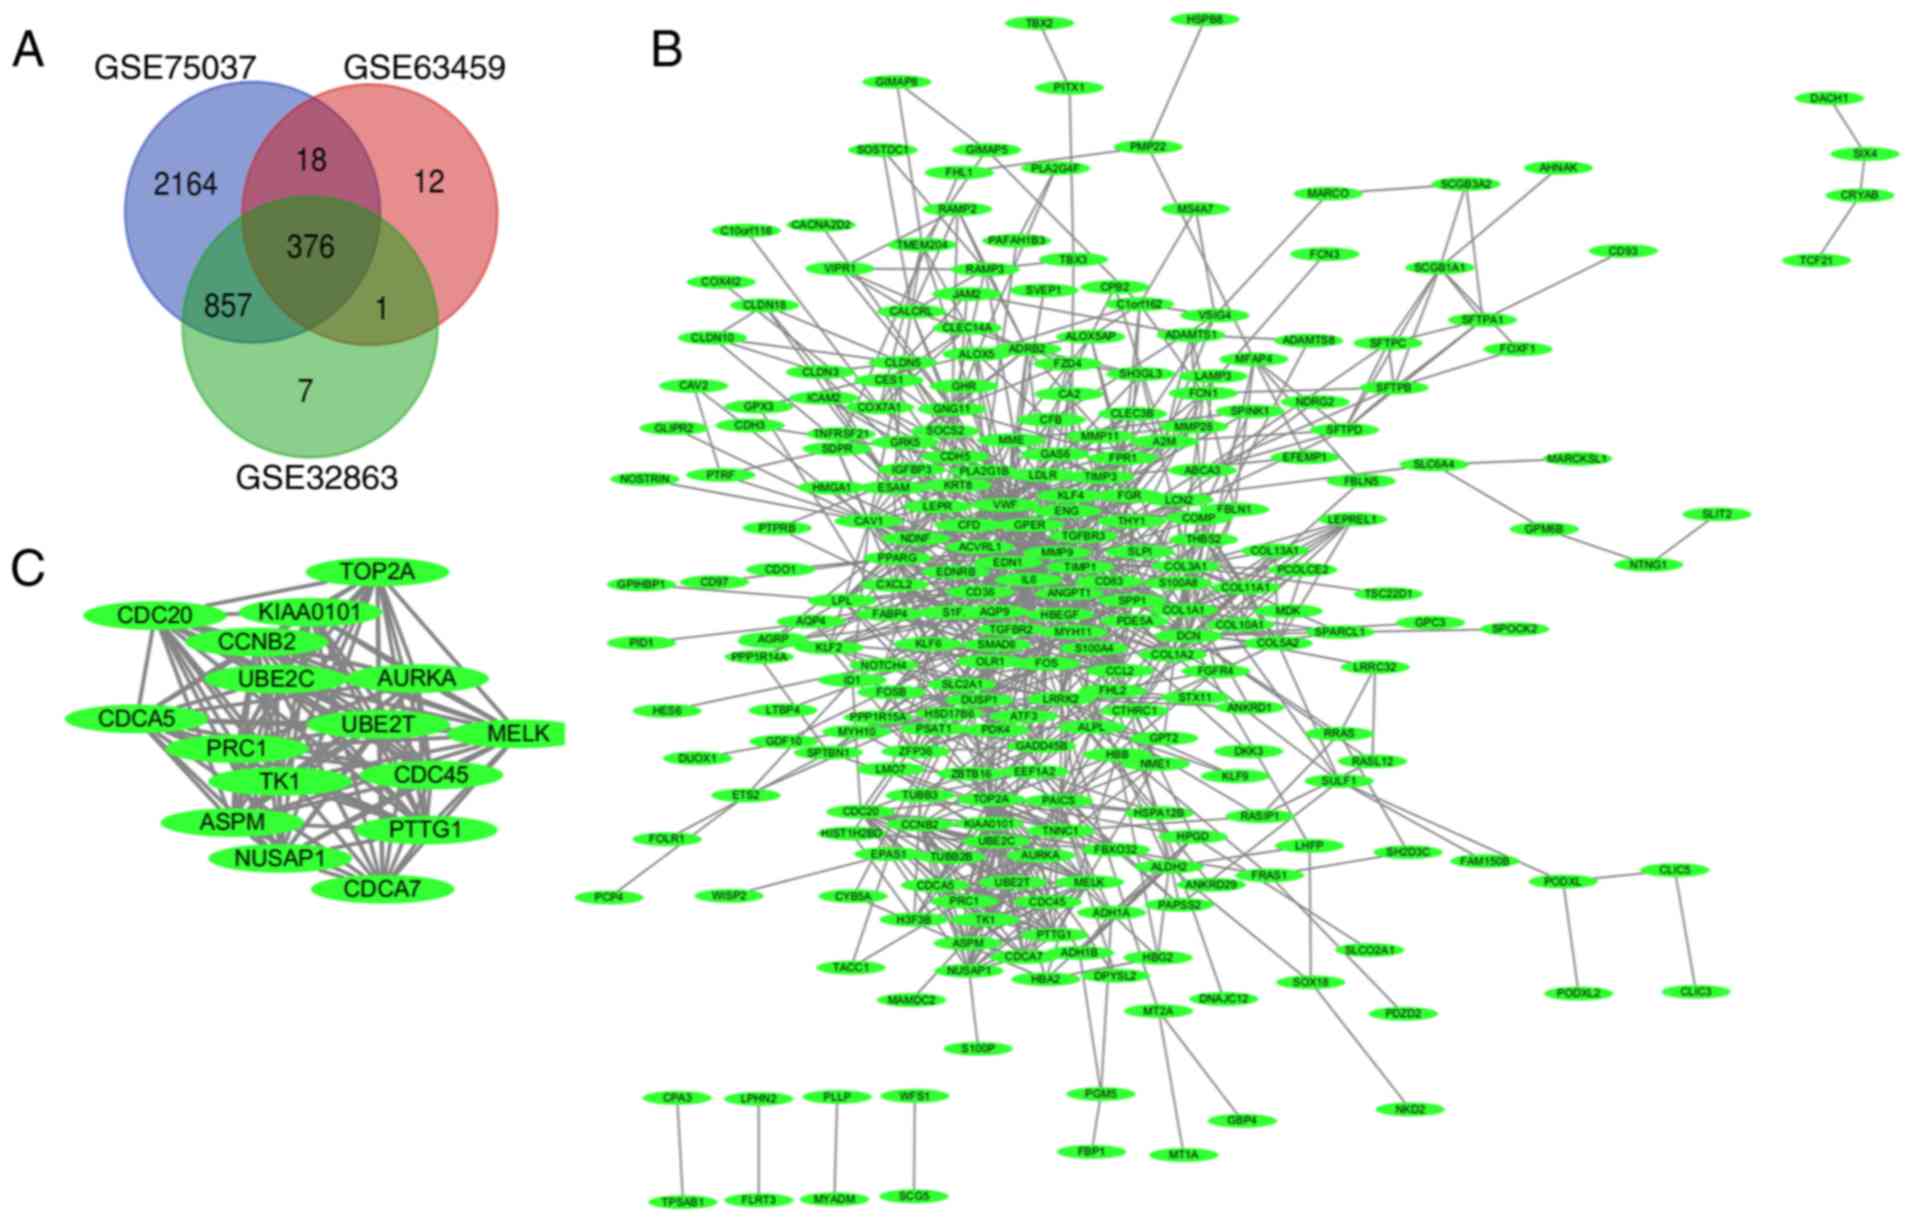
A total of 5,874 genes were found to be
differentially expressed in non-cancerous and lung adenocarcinoma
tissues (432 in GSE63459, 4,037 in GSE75037 and 1,405 in GSE32863)
after standardizing the microarray data. A total of 376 DEGs were
found in all three datasets (Venn diagram, Fig. 1A), consisting of 293 downregulated
and 83 upregulated genes.
GO and KEGG enrichment analyses of the
DEGs
The DAVID online database was used to further
analyze the biological classification, as well as functions and
pathways enriched in DEGs. GO analysis showed that the biological
processes (BP) of the DEGs were mainly involved in regulation of
cell proliferation, the transforming growth factor β receptor
signaling pathway, cell adhesion, biological adhesion and responses
to hormone stimulus (Table I).
Examination of their cell component showed that the DEGs were
mainly located in the proteinaceous extracellular matrix, cell
surface, cell-cell junction, and cell-substrate adherent junction.
KEGG pathway analysis showed that the DEGs were mainly over
represented in the TGF-β signaling pathway, cell adhesion molecules
(CAMs), complement and coagulation cascades and ECM-receptor
interaction (Table I).
 | Table I.KEGG and GO pathway enrichment
analysis of DEGs in the lung adenocarcinoma samples. |
Table I.
KEGG and GO pathway enrichment
analysis of DEGs in the lung adenocarcinoma samples.
| Term | Description | Count in gene
set | P-value |
|---|
| GO:0048545 | Response to steroid
hormone stimulus | 27 | 9.53E-14 |
| GO:0009725 | Response to hormone
stimulus | 33 | 2.60E-11 |
| GO:0009719 | Response to
endogenous stimulus | 33 | 3.31E-10 |
| GO:0042127 | Regulation of cell
proliferation | 45 | 9.09E-09 |
| GO:0001501 | Skeletal system
development | 26 | 3.68E-08 |
| GO:0010033 | Response to organic
substance | 41 | 5.71E-08 |
| GO:0007179 | TGF-β receptor
signaling pathway | 12 | 6.25E-08 |
| GO:0043627 | Response to
estrogen stimulus | 15 | 6.80E-08 |
| GO:0007155 | Cell adhesion | 40 | 7.66E-08 |
| GO:0022610 | Biological
adhesion | 40 | 7.78E-08 |
| hsa04512 | ECM-receptor
interaction | 11 | 5.33E-05 |
| hsa04670 | Leukocyte
transendothelial migration | 10 | 0.003333312 |
| hsa04514 | Cell adhesion
molecules (CAMs) | 10 | 0.006973812 |
| hsa04510 | Focal adhesion | 12 | 0.014731626 |
| hsa04350 | TGF- β signaling
pathway | 7 | 0.024809421 |
| hsa04610 | Complement and
coagulation cascades | 6 | 0.032656397 |
| hsa03320 | PPAR signaling
pathway | 6 | 0.032656397 |
PPI network construction and module
analysis
Cytoscape was used to build the DEG PPI network
(Fig. 1B) and identify the most
significant genes of the PPI network (Fig. 1C). Analysis of these genes with the
DAVID platform found that they were mainly involved in M phases,
cell cycle phase, the mitotic cell cycle and nuclear division
(Table II).
| Table II.KEGG and GO pathway enrichment
analysis of DEGs in the most significant module. |
Table II.
KEGG and GO pathway enrichment
analysis of DEGs in the most significant module.
| Pathway ID | Pathway
description | Count in gene
set | FDR |
|---|
| GO:0000279 | M phase | 9 | 3.72E-07 |
| GO:0000278 | Mitotic cell
cycle | 9 | 9.46E-07 |
| GO:0000280 | Nuclear
division | 8 | 1.07E-06 |
| GO:0007067 | Mitosis | 8 | 1.07E-06 |
| GO:0000087 | M phase of mitotic
cell cycle | 8 | 1.21E-06 |
| GO:0048285 | Organelle
fission | 8 | 1.41E-06 |
| GO:0022403 | Cell cycle
phase | 9 | 2.30E-06 |
| GO:0051301 | Cell division | 8 | 8.24E-06 |
| GO:0007049 | Cell cycle | 10 | 1.24E-05 |
| GO:0022402 | Cell cycle
process | 9 | 2.65E-05 |
| GO:0007059 | Chromosome
segregation | 4 | 0.08986 |
| GO:0030261 | Chromosome
condensation | 3 | 0.367997 |
| GO:0000226 | Microtubule
cytoskeleton organization | 4 | 0.523613 |
| GO:0007051 | Spindle
organization | 3 | 1.195525 |
| GO:0007017 | Microtubule-based
process | 4 | 2.500246 |
| hsa04114 | Oocyte meiosis | 4 | 0.096833 |
| hsa04110 | Cell cycle | 4 | 0.141584 |
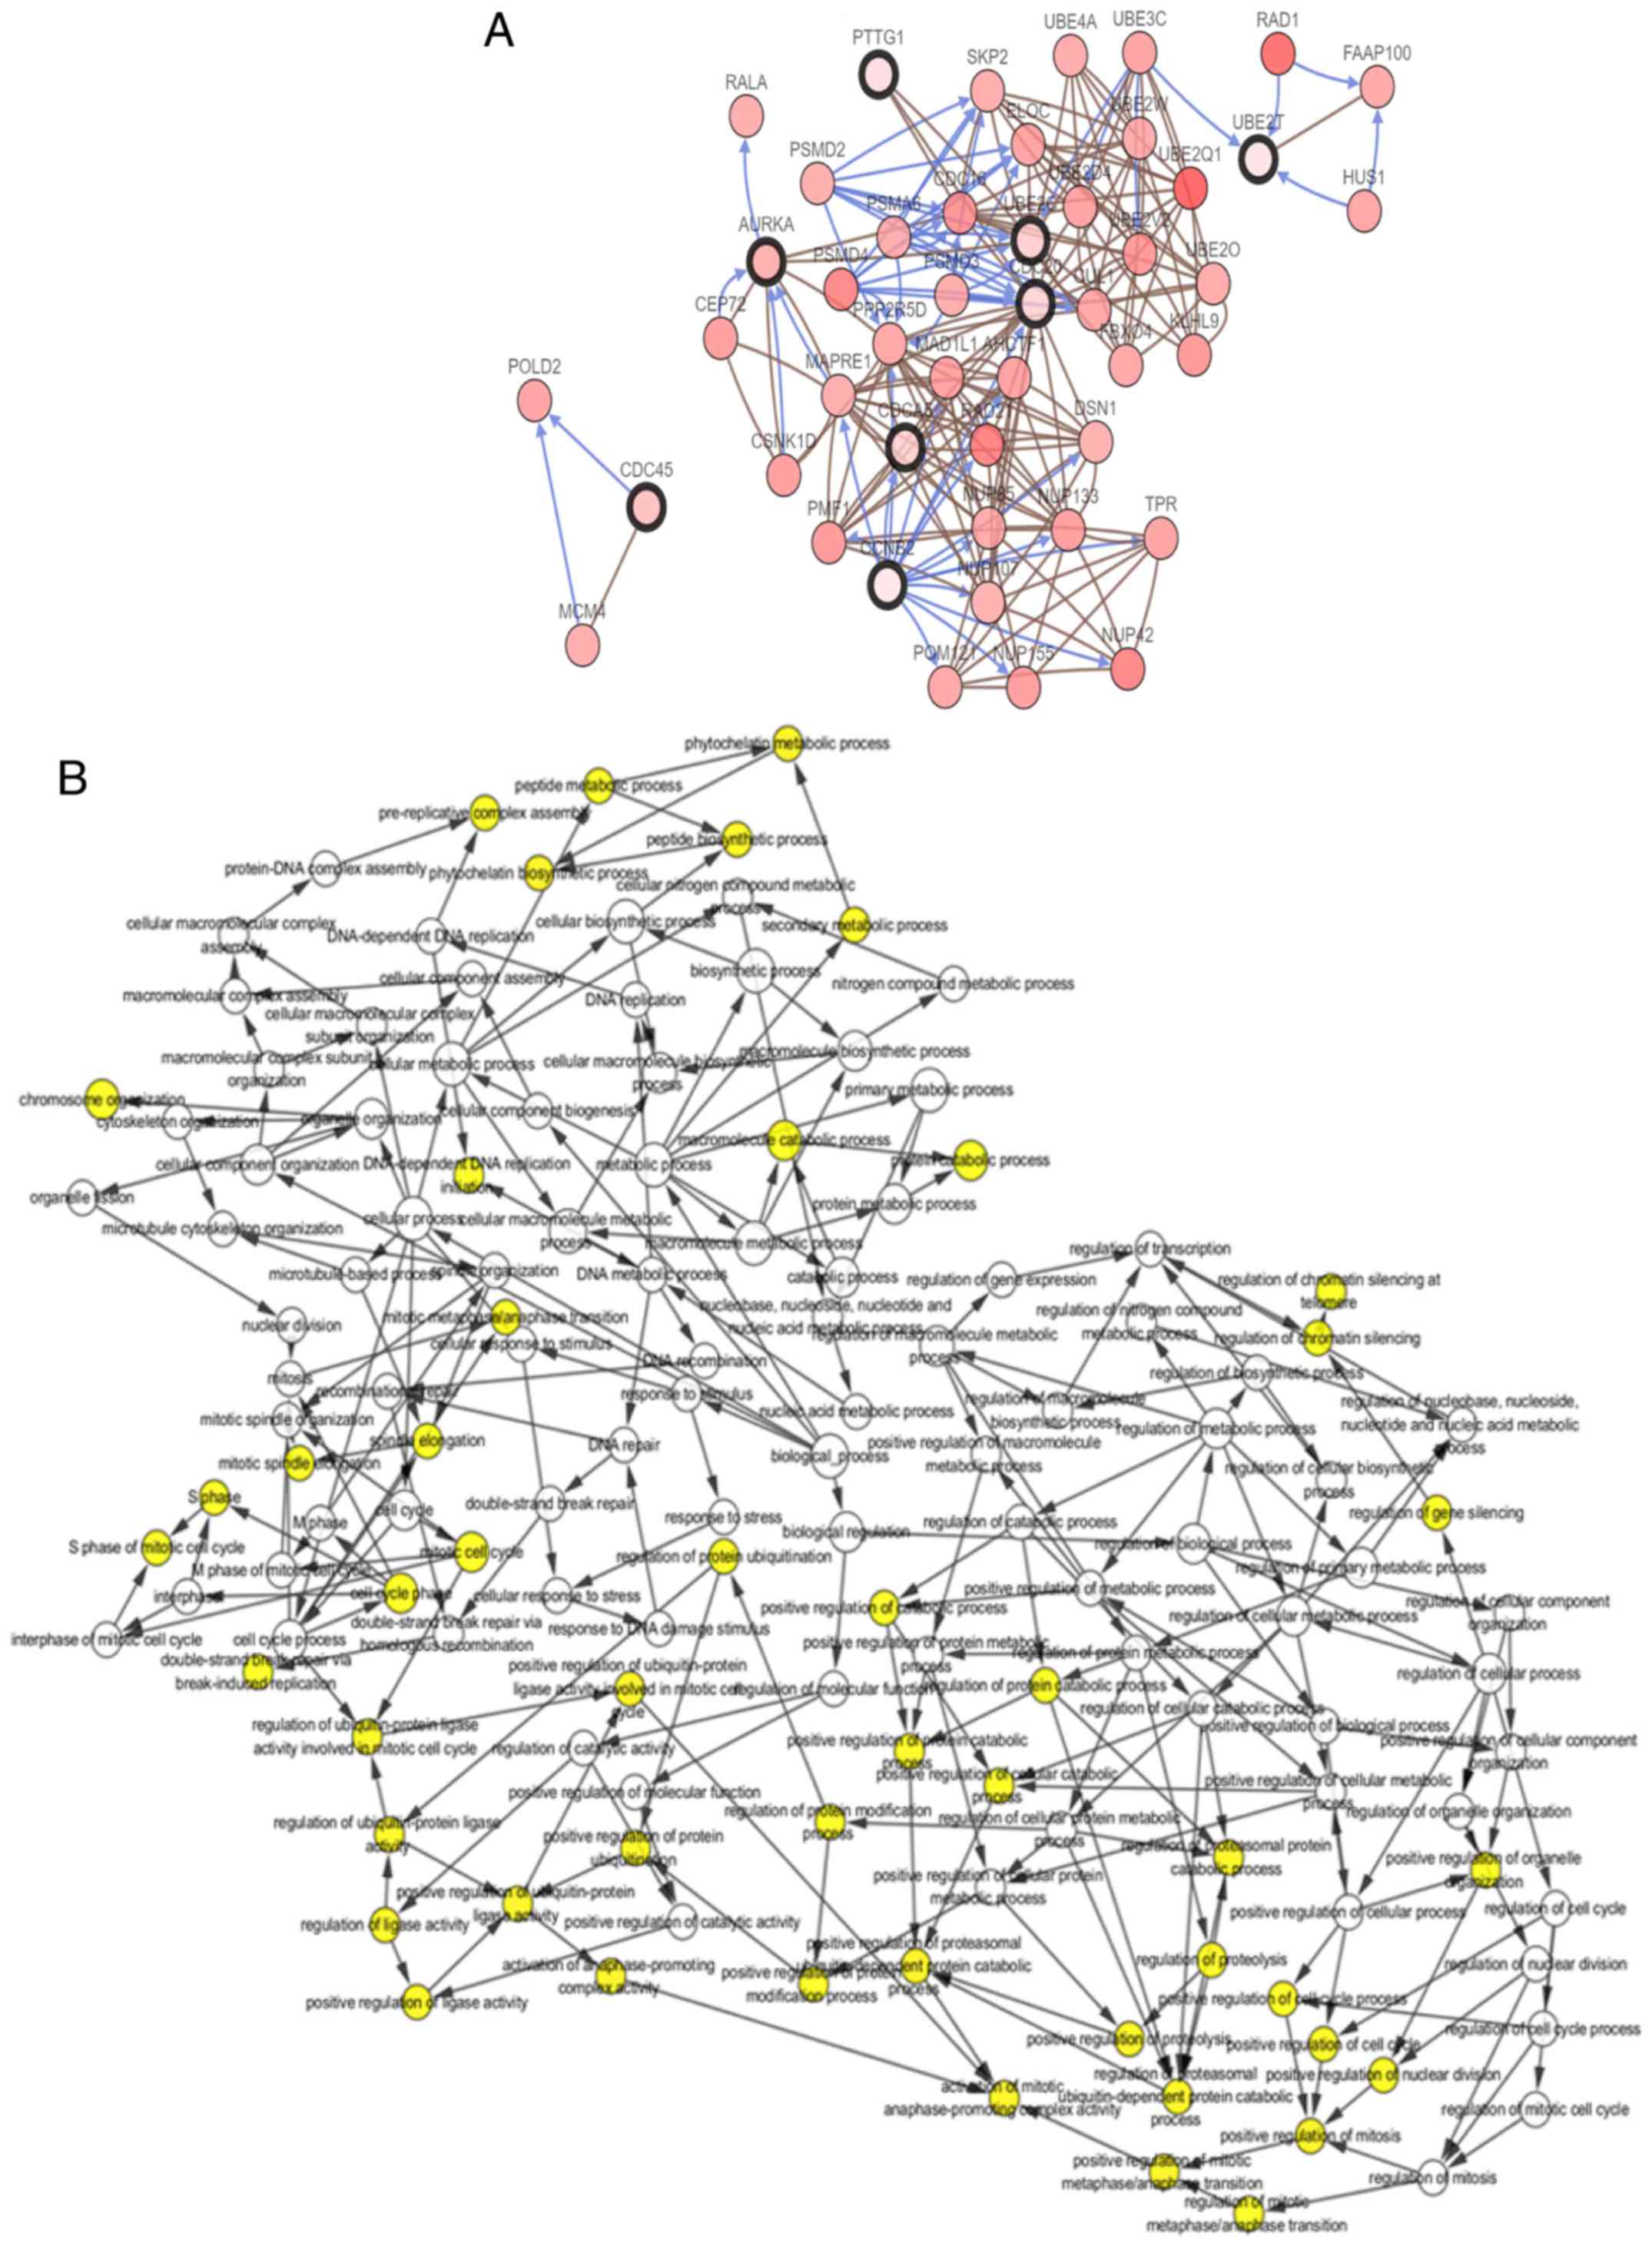
Hub gene selection and analysis
Sixteen genes were identified with a degree ≥10 and
were defined as hub genes. The degree of each gene was calculated
by the CytoScape software and represented the number of other genes
with which it was connected. The hub gene symbol, full name,
function and degree are listed in Table III. cBioPortal was then used to
construct a network of the 16 hub genes and their co-expressed
genes. The results of this and analysis of the BP are shown in
Fig. 2A and B, respectively.
oncoPrint analysis with the cBioPortal showed that TOP2A and
AURKA have the highest genetic mutation rates of the hub
genes in lung adenocarcinoma at 8 and 14%, respectively (Fig. 2C). Hierarchical clustering analysis
revealed that these 16 hub genes could generally differentiate both
primary and recurrent lung adenocarcinoma tissues from their
adjacent non-cancerous lung tissues (Fig. 2D).
| Table III.Summary of the hub gene
functions. |
Table III.
Summary of the hub gene
functions.
| No. | Gene symbol | Full name | Function | Degree |
|---|
| 1 | TOP2A | DNA topoisomerase
II α | TOP2A functions as
the target for various anticancer agents and mutations in it are
associated with drug resistance | 31 |
| 2 | AURKA | Aurora kinase
A | AUEKA plays a role
in tumor development and progression | 22 |
| 3 | UBE2C | Ubiquitin
conjugating enzyme E2 C | UBE2C is required
for the destruction of mitotic cyclins and for cell cycle
progression, and is involved in cancer progression | 20 |
| 4 | KIAA0101
(PCLAF) | PCNA clamp
associated factor | PCNA-binding
protein acts as a regulator of DNA repair during DNA
replication | 20 |
| 5 | CDC20 | Cell division cycle
20 | CDC20 is a
regulatory protein interacting with several other proteins at
multiple points in the cell cycle | 19 |
| 6 | CCNB2 | Cyclin B2 | CCNB2 is one of the
essential components of the cell cycle regulatory machinery | 18 |
| 7 | TK1 | Thymidine kinase
1 | High level of TK1
is used as a biomarker for diagnosing and categorizing many types
of cancers | 17 |
| 8 | PTTG1 | Pituitary
tumor-transforming 1 | PTTG1 product has
transforming activity in vitro and tumori genic activity in vivo,
and it is highly expressed in various tumors | 17 |
| 9 | MELK | Maternal embryonic
leucine zipper kinase | Diseases associated
with MELK include uterine corpus endometrial carcinoma. Among its
related pathways are Neuroscience | 17 |
| 10 | NUSAP1 | Nucleolar and
spindle associ ated protein 1 | NUSAP1 is a
nucleolar-spindle-associated protein that plays a role in spindle
microtubule organization | 16 |
| 11 | CDC45 | Cell division cycle
45 | The protein encoded
by CDC45 is an essential protein required for the initiation of DNA
replication | 16 |
| 12 | ASPM | Abnormal spindle
microtubule assembly | ASPM is essential
for normal mitotic spindle function in embryonic neuroblasts | 16 |
| 13 | UBE2T | Ubiquitin
conjugating enzyme E2 T | The protein encoded
by UBE2T catalyzes the covalent attachment of ubiquitin to protein
substrates. Defects in UBE2T are associated with Fanconi anemia of
complementation group T | 15 |
| 14 | CDCA5 | Cell division cycle
associated 5 | Among its related
pathways are Cell cycle, Mitotic and MicroRNAs in cancer | 15 |
| 15 | PRC1 | Protein regulator
of cytokinesis 1 | PRV1 encodes a
protein that is involved in cytokinesis which has been shown to be
a substrate of several cyclin-dependent kinases | 14 |
| 16 | CDCA7 | Cell division cycle
associated 7 | CDCA7 was
identified as a c-Myc responsive gene. Overexpression of this gene
enhances the transformation of lymphoblastoid cells | 13 |
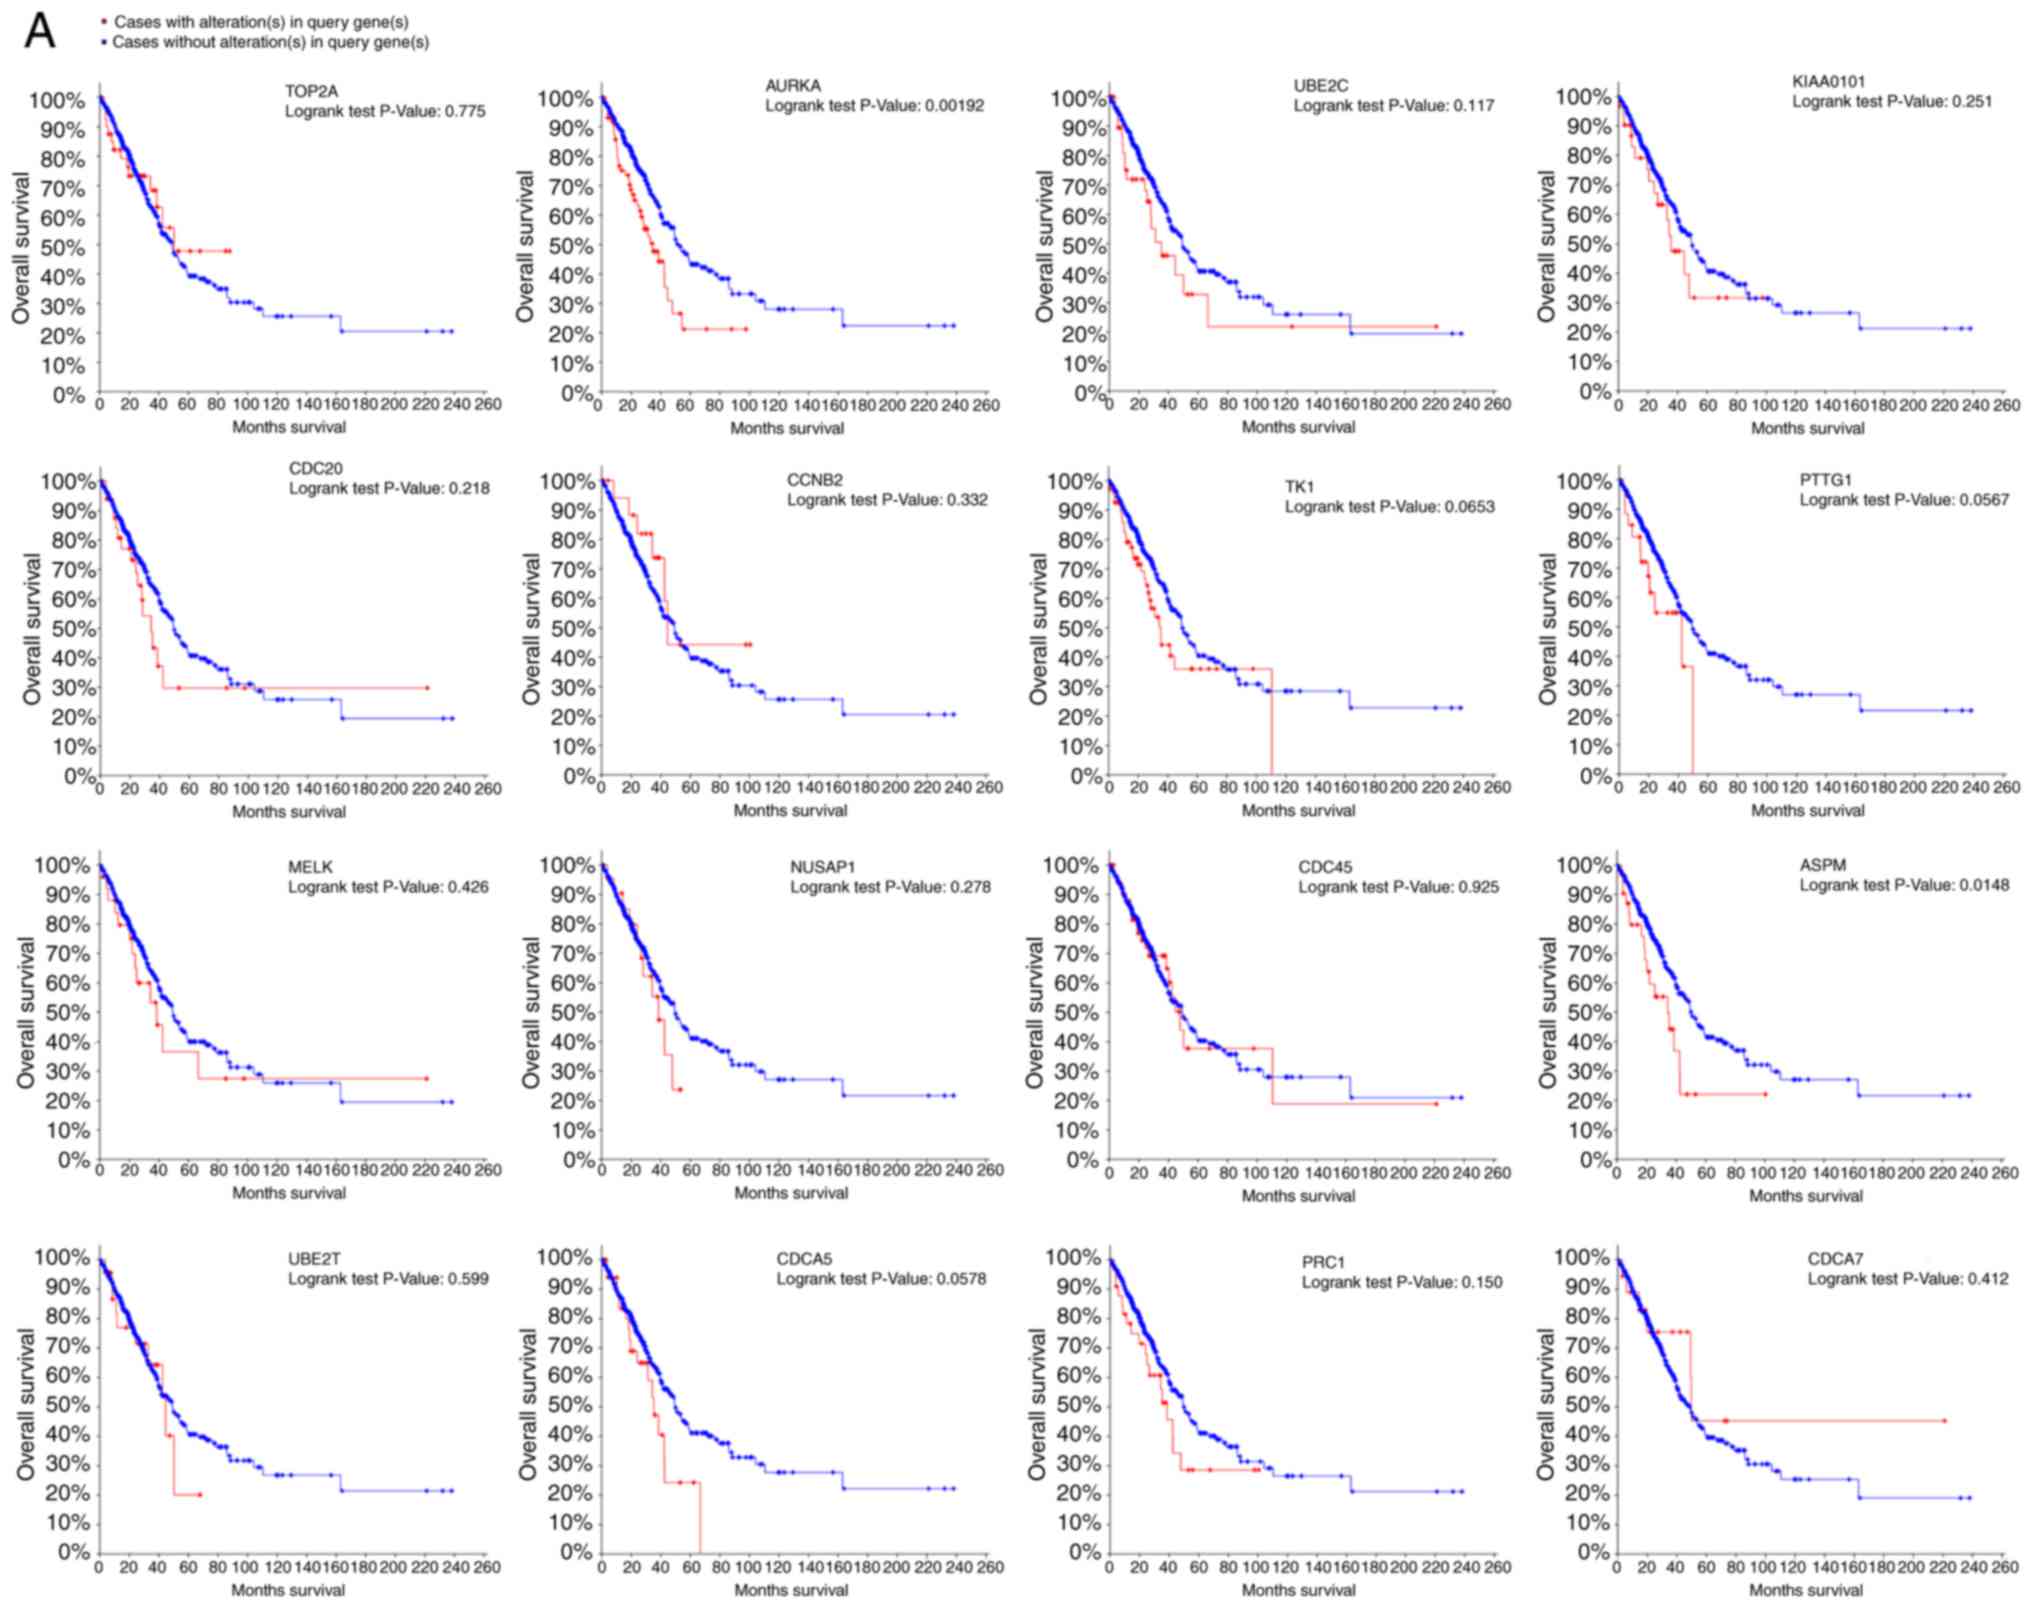
Clinical significance of TOP2A and
AURKA
Analysis of the association between these genes and
disease-free survival and overall survival analysis was conducted
using Kaplan-Meier curves in the cBioPortal platform. Lung
adenocarcinoma patients with AURKA mutation had worse
overall and disease-free survival and patients with ASPM
(abnormal spindle microtubule assembly) mutation had worse
disease-free survival (Fig. 3A and
B). Moreover, AURKA and TOP2A had the highest
node degrees at 22 and 31, respectively, implying that they may
play significant roles in the genesis and development of lung
adenocarcinoma. When analyzing the data from cBioPortal platform,
we discovered that lung adenocarcinoma patients who had an
AURKA mutation had reductions in overall survival
(P=0.00192). However, this was not true for the TOP2A gene
(P=0.775, Fig. 3A and B). The
expression profile of AURKA and TOP2A in 20 types of
human cancer tissues was displayed using the Oncomine database.
TOP2A mRNA levels in bladder, brain, breast, colorectal,
esophageal, kidney, gastric and sarcoma cancer tissues were higher
than those in matched adjacent normal tissues (Fig. 4A). The AURKA mRNA levels in
bladder, brain, breast, cervical, lung and liver cancer tissues
were higher than those in adjacent matched normal tissues (Fig. 4B). When we analyzed six different
datasets from the Oncomine database, we found that TOP2A and
AURKA were significantly overexpressed in lung
adenocarcinoma tissues compared with non-cancerous tissues
(Fig. 4C and D) (7,22–28).
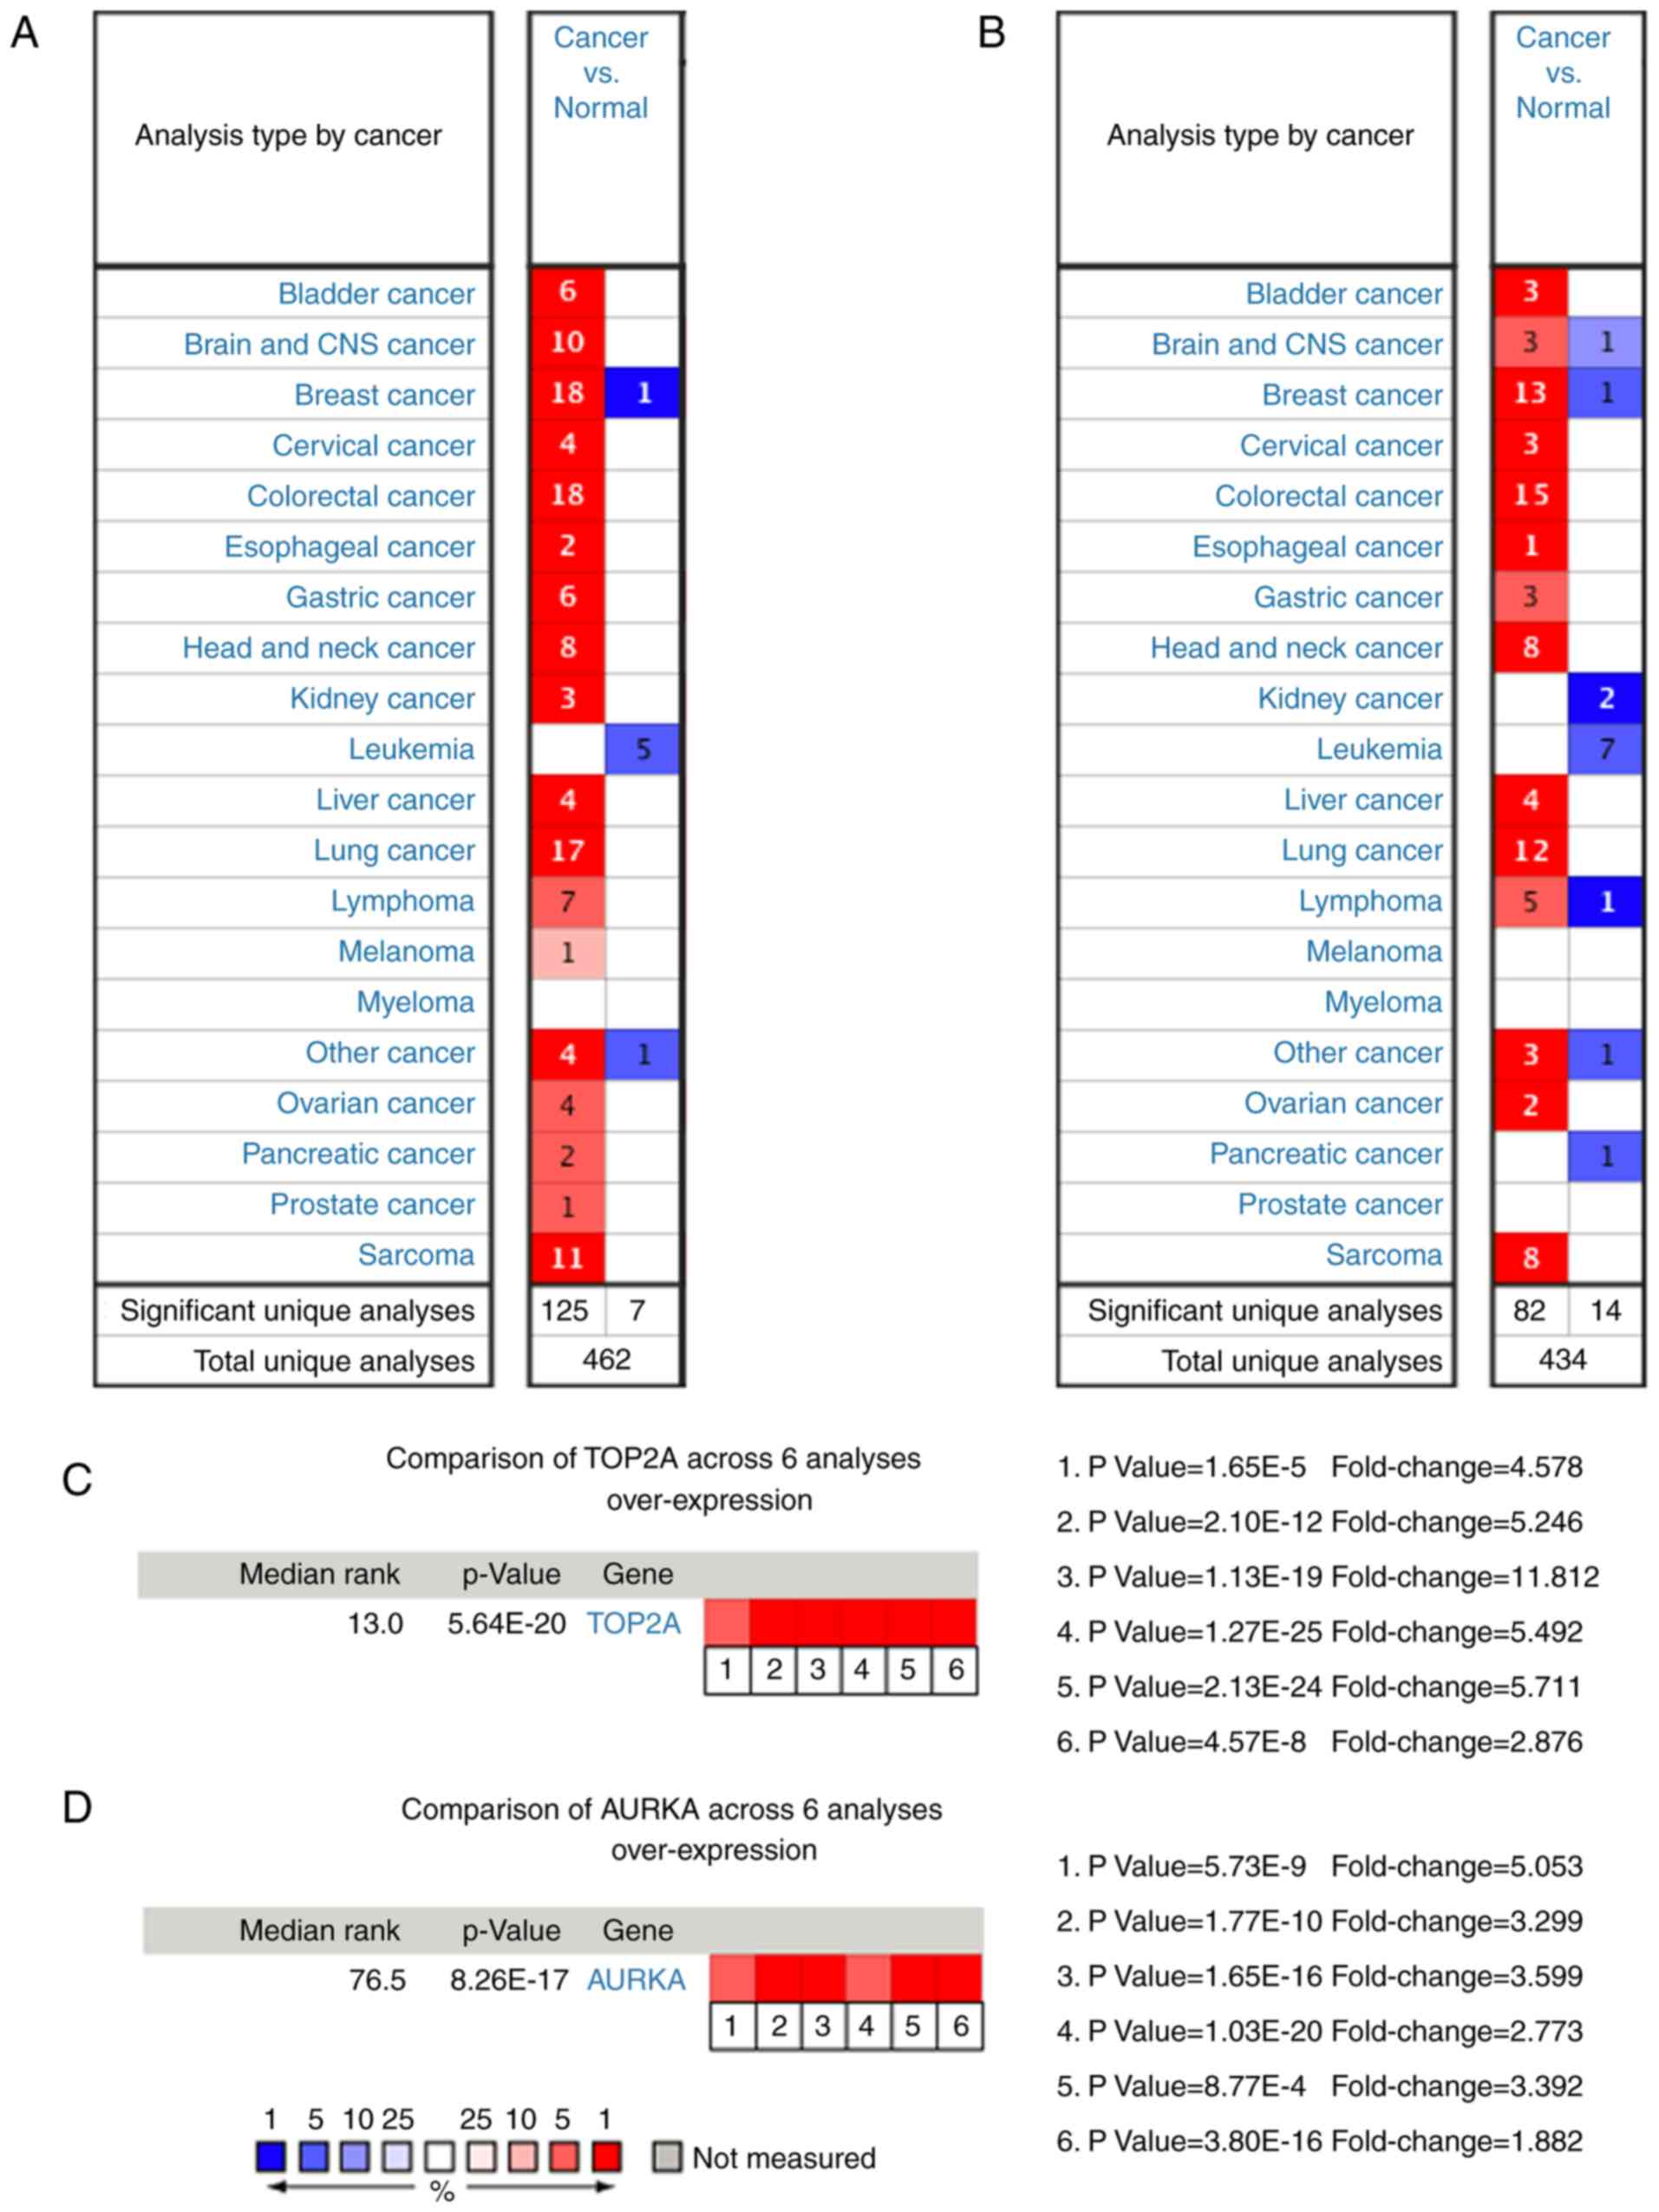 | Figure 4.Expression profiles of (A)
TOP2A and (B) AURKA in 20 malignant tumor types are
represented using the Oncomine database. The number represent the
cases meeting the threshold for TOP2A and AURKA. Heat
maps of (C) TOP2A and (D) AURKA gene expression in
lung carcinoma samples vs. adjacent lung tissues in the Oncomine
database. (C) 1. Lung carcinoma vs. normal lung, Beer et al
(2002) (22). 2. Lung carcinoma vs.
normal lung, Hou et al (2010) (23). 3. Lung carcinoma vs. normal lung,
Landi et al (2008) (24). 4.
Lung carcinoma vs. normal lung, Selamat et al (2012)
(7). 5. Lung carcinoma vs. normal
lung, Su et al (2007) (25).
6. Lung carcinoma vs. normal lung, Yamagata et al (2003)
(26). (D) 1. Lung carcinoma vs.
normal lung, Bhattacharjee et al (2001) (27). 2. Lung carcinoma vs. normal lung,
Garber et al (2001) (28).
3. Lung carcinoma vs. normal lung, Hou et al (2010)
(23). 4. Lung carcinoma vs. normal
lung, Landi et al (2008) (24). 5. Lung carcinoma vs. normal lung,
Selamat et al (2012) (7). 6.
Lung carcinoma vs. normal lung, Su et al (2007) (25). The P-value for a gene is its P-value
for the median-ranked analysis. The fold change represents the
relative expression of the tumor tissue compared with the normal
tissue. AURKA, aurora kinase A; TOP2A, DNA topoisomerase II
α. |
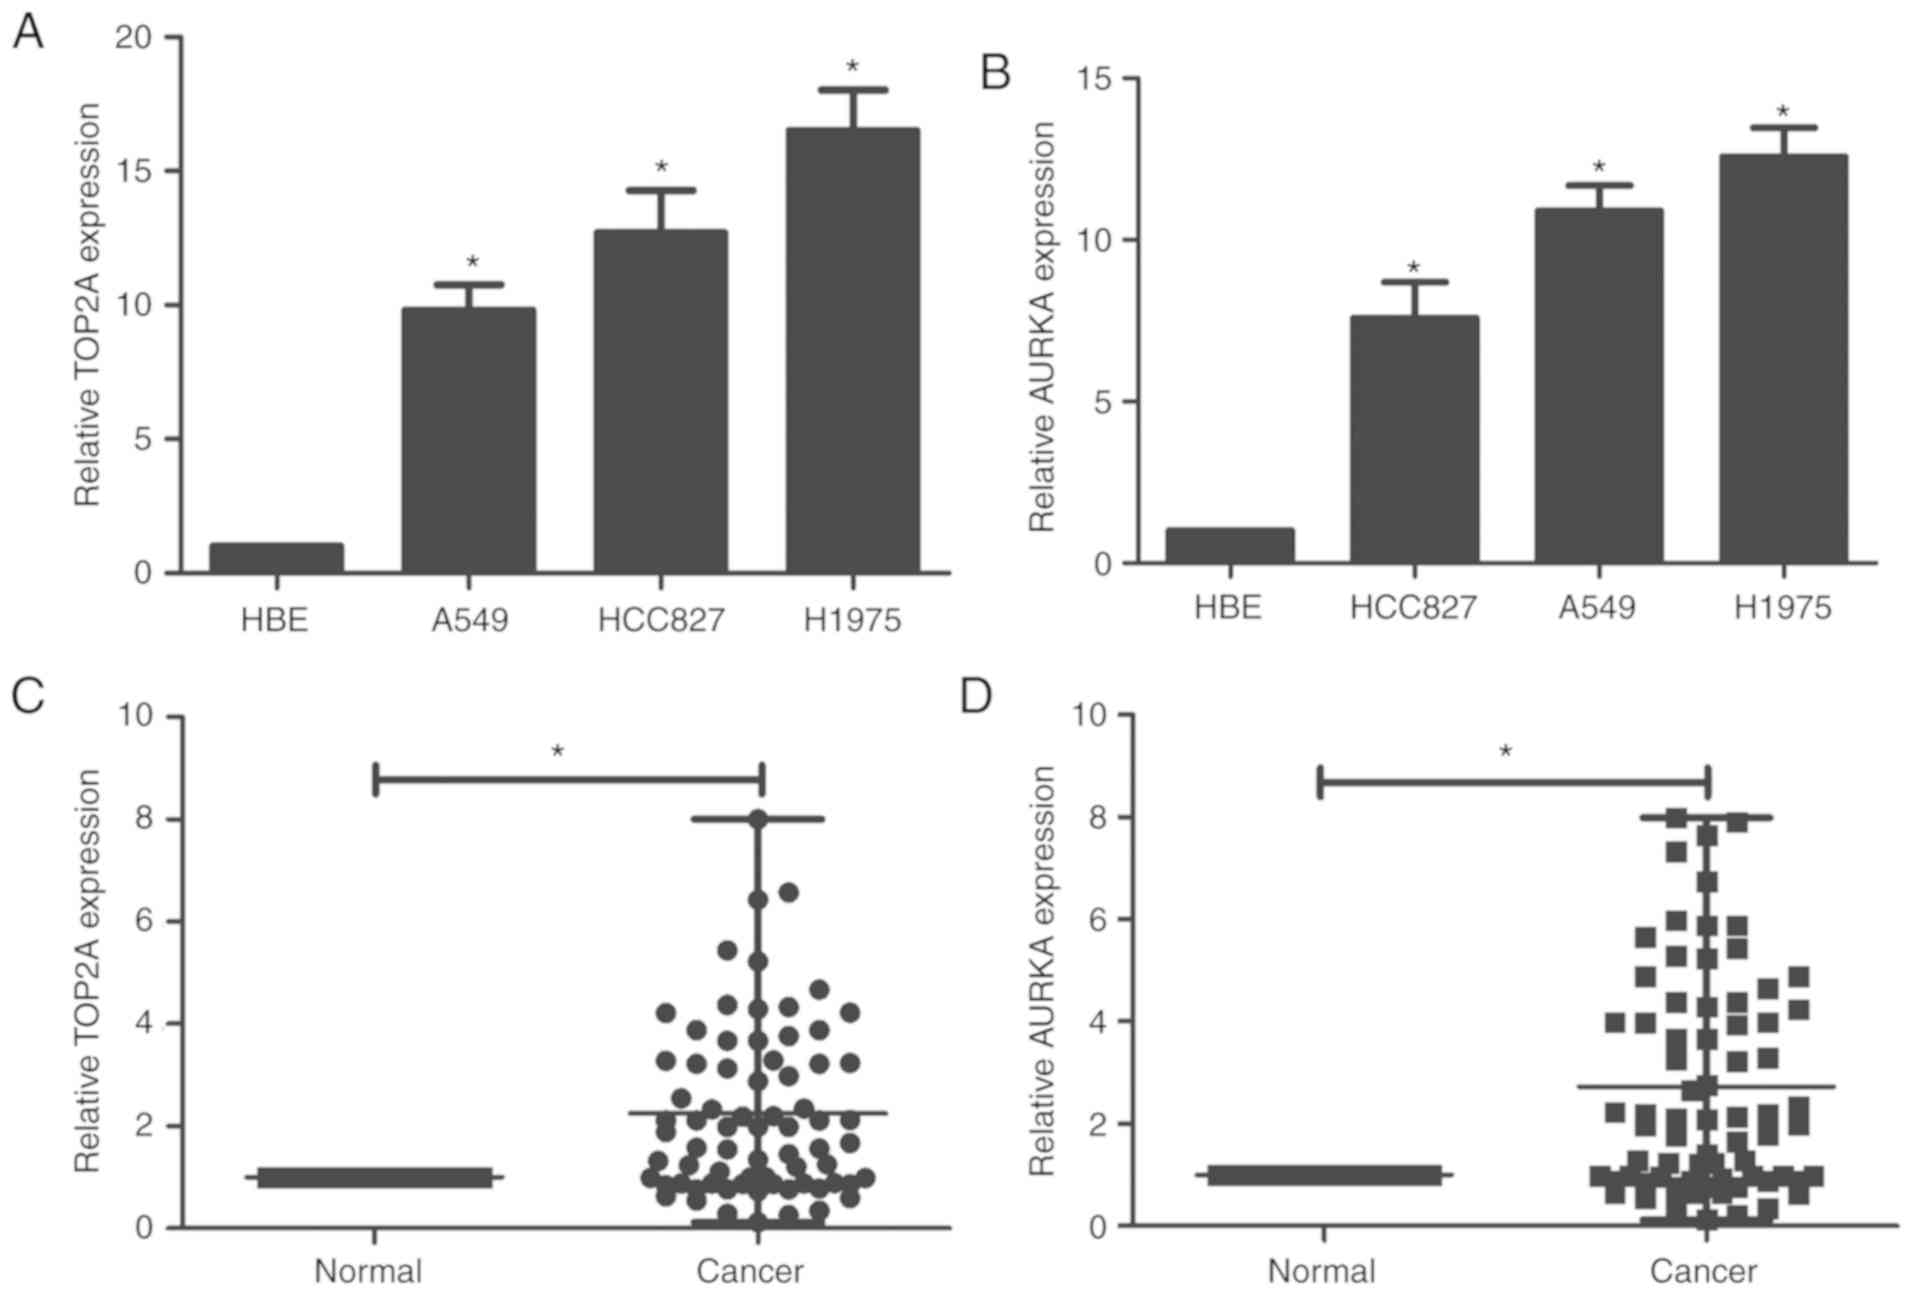
Expression of TOP2A and AURKA in lung
adenocarcinoma cell lines
To confirm the bioinformatics results, the
expression of these two genes in lung adenocarcinoma cell lines and
HBE cells were assessed by RT-qPCR. The mRNA levels of both
TOP2A and AURKA were significantly higher in the lung
adenocarcinoma cell lines than the HBE cells (Fig. 5A and B).
Expression of TOP2A and AURKA in human
lung adenocarcinoma and adjacent normal lung tissues
Table IV shows the
clinicopathological characteristics of all the lung adenocarcinoma
patients. TOP2A and AURKA were found to have 2.25- and 2.73-times
higher expression levels in the cancer tissues than in the normal
tissues, respectively (Fig. 5C and
D). The 72 samples were then classified into two groups based
on the relative expression levels of these two genes: The
relatively high TOP2A and AURKA group (n=36, the
first 36 cases having relative high TOP2A and AURKA were defined as
the high-expression group; the remaining 36 cases were defined as
the low-expression group) and the relatively low TOP2A and AURKA
group (n=36). χ2 analysis was used to analyze the
results. Analysis revealed that increased TOP2A expression
was observed in tumors with a larger diameter. Increased
AURKA expression was observed in tumors with a larger size
and in lymphatic metastatic tumors (Tables IV and V).
| Table IV.Clinicopathologic associations of
TOP2A expression in lung adenocarcinoma (N=72). |
Table IV.
Clinicopathologic associations of
TOP2A expression in lung adenocarcinoma (N=72).
|
|
| Relative TOP2A
expression |
|
|---|
|
|
|
|
|
|---|
| Clinical
parameters | No. of cases | Low | High | P-value |
|---|
| Age (years) |
|
|
| 0.237 |
|
>60 | 39 | 22 | 17 |
|
|
≤60 | 33 | 14 | 19 |
|
| Sex |
|
|
| 0.099 |
|
Male | 37 | 15 | 22 |
|
|
Female | 35 | 21 | 14 |
|
| Smoking |
|
|
| 1 |
|
Smoker | 42 | 21 | 21 |
|
|
Non-smoker | 30 | 15 | 15 |
|
| Maximum diameter
(cm) |
|
|
| 0.003 |
|
<3 | 26 | 19 | 7 |
|
| ≥3 | 46 | 17 | 29 |
|
| Lymphatic
metastasis |
|
|
| 0.812 |
|
Positive | 41 | 21 | 20 |
|
|
Negative | 31 | 15 | 16 |
|
| Metastasis |
|
|
| 0.607 |
| M0 | 68 | 33 | 35 |
|
| M1 | 4 | 3 | 1 |
|
| Table V.Clinicopathologic associations of
AURKA expression in lung adenocarcinoma (N=72). |
Table V.
Clinicopathologic associations of
AURKA expression in lung adenocarcinoma (N=72).
|
|
| Relative AURKA
expression |
|
|---|
|
|
|
|
|
|---|
| Clinical
parameters | No. of cases | Low | High | P-value |
|---|
| Age (years) |
|
|
| 0.813 |
|
>60 | 39 | 20 | 19 |
|
|
≤60 | 33 | 16 | 17 |
|
| Sex |
|
|
| 0.099 |
|
Male | 37 | 22 | 15 |
|
|
Female | 35 | 14 | 21 |
|
| Smoking |
|
|
| 0.633 |
|
Smoker | 42 | 20 | 22 |
|
|
Non-smoker | 20 | 16 | 14 |
|
| Maximum diameter
(cm) |
|
|
| 0.003 |
|
<3 | 26 | 19 | 7 |
|
| ≥3 | 46 | 17 | 29 |
|
| Lymphatic
metastasis |
|
|
| 0.002 |
|
Positive | 41 | 14 | 27 |
|
|
Negative | 31 | 22 | 9 |
|
| Metastasis |
|
|
| 1 |
| M0 | 68 | 34 | 34 |
|
| M1 | 4 | 2 | 2 |
|
Discussion
Recent statistics on cancer globally revealed that
lung cancer is the most commonly diagnosed malignant tumor and is
the leading cause of cancer-related mortality accounting for 11.6%
of all malignant tumors and 18.4% of cancer-related deaths. Lung
adenocarcinoma is the most common subtype of malignant lung cancer,
and its incidence is increasing rapidly (29). Air pollution and smoking are the two
main etiological factors for lung adenocarcinoma (30,31).
The microarray data of Sekine et al revealed that a human
lung mucoepidermoid carcinoma cell line exposed to smoke with a
charcoal filter had a total of 1,582 genetic mutations (32). Still, the molecular mechanisms
underlying the genesis of lung adenocarcinoma remain unclear.
Without an early diagnosis most patients are not candidates for
curative therapies leading to the deeply unsatisfactory prognosis
for the disease. Therefore, biological markers with satisfactory
efficiency for early diagnosis and therapy are desperately needed.
With the development of microarray technology, we are able to
efficiently screen for changes in gene expression in lung
adenocarcinoma, and this approach has been proven to be a very
useful method for screening early stage biomarkers in both
malignant and benign diseases (33–35).
In the present research, three mRNA microarray
datasets were downloaded from the GEO database and subsequently
analyzed to acquire differentially expressed genes (DEGs) between
lung adenocarcinoma and adjacent non-cancerous lung tissues. In
addition, a total of 376 DEGs were identified in the three
datasets, consisting of 293 upregulated genes and 83 downregulated
genes. The biological roles of the identified DEGs were then
studied using KEGG and GO enrichment analyses. The downregulated
genes were mainly overrepresented in cell division, nuclear
division, DNA replication and second-messenger-mediated signaling,
and the upregulated genes were mainly involved in cell cycle
process, DNA metabolic process, the transforming growth factor
(TGF)-β signaling pathway and angiogenesis. Previous articles have
revealed that dysregulation of angiogenesis and activation of the
TGF-β signaling pathway are associated with the carcinogenesis and
progression of lung adenocarcinoma (36–38).
In addition, DNA damage and metabolic process abnormalities often
play a significant role in cell cycle regulation dysfunction and
are associated with malignant tumors (39). In summary, our results are
consistent with these previous reports and theories. KEGG
enrichment analysis showed differences mainly in the TGF-β
signaling pathway, complement and coagulation cascades, Cell
adhesion molecules (CAMs), and ECM-receptor interaction, while
changes identified by GO terms were mainly in regulation of cell
adhesion, proliferation, the TGF-β receptor signaling pathway,
biological adhesion and response to hormone stimulus.
Sixteen genes with degrees ≥10 were defined as hub
genes (40). Two of these hub
genes, TOP2A and AURKA, had the highest node degrees
at 31 and 22, respectively. Gene mutation can promote
tumorigenesis, thus the mutation rates of these 16 lung
adenocarcinoma hub genes were screened with the cBioPortal
platform. The four genes with the highest mutation rates were
AURKA, TK1, CDC45 and TOP2A with mutation rates of
14, 13, 10 and 8% respectively, which indicates that these genes
may play a significant role in tumorigenesis.
DNA topoisomerase II α (TOP2A) that encodes the DNA
topoisomerase, an enzyme that alters and controls the topological
state of DNA during transcription, has been shown to be correlated
with an increased risk of developing brain metastases, drug
resistance and an abnormal cell cycle (41–43).
It is regarded as a target for several anticancer agents, such as
etoposide and topotecan (44). In
our research, the protein-protein interaction network (PPI) network
revealed that TOP2A directly interacts with maternal embryonic
leucine zipper kinase (MELK), CDC20, CCNB2, UBE2T, KIAA0101 and
TK1, indicating that TOP2A plays a key role in lung adenocarcinoma.
Two of these genes, CDC20 and MELK, are closely involved in
tumorigenesis and the cell cycle. Cell division cycle 20 (CDC20)
appears to function as a regulatory protein interacting with other
proteins at several important phases in the cell cycle. CDC20 is
activated in lung adenocarcinoma and overexpression is correlated
with poor prognosis (45). MELK
plays a key role in the proliferation and self-renewal of
progenitor and tumor stem cells, and is overexpressed in lung
adenocarcinoma, contributing to carcinogenesis. MELK is an
effective target for kinase drugs (46). Moreover, the expression of TOP2A is
upregulated in various tumors, such as colon and ovarian malignant
tumors, and may be considered a sensitive biomarker for early
detection and therapy of these tumors (47,48).
Aurora kinase A (AURKA) is a putative oncogene,
associated with cell cycle-regulated kinase (49). GO annotations associated with this
gene include protein tyrosine kinase activity, transferring
phosphorus-containing groups and transferase activity.
Overexpression of this gene is associated with several common
features of malignant tumor cells, such as chromosomal instability,
aneuploidy in mammalian cells and centrosomal duplication
abnormalities (50,51). It has also been found to be
overexpressed in several types of malignant tumors and has been
associated with poor prognosis (52,53).
The aurora kinase A inhibitor, alisertib, has been approved for
therapy for solid tumors especially non-small cell lung cancer
(NSCLC) and breast cancer, and has achieved satisfactory results
(54). In addition, Chen et
al revealed that AURKA antagonists can enhance the cytotoxicity
of epidermal growth factor receptor-tyrosine kinase inhibitors
(EGFR-TKIs) (55).
The relationships between TOP2A and
AURKA expression and survival were further assessed with the
cBioPortal platform. We found that changes in TOP2A
expression were associated with a decrease in both disease-free and
overall survival, although they were not statistically significant.
While changes in AURKA expression were associated with
significantly worse overall survival rates, but no significant
change in disease-free survival rate. This may be explained by our
study of 72 paired human samples which found that upregulation of
AURKA was associated with lymphatic metastasis and that
upregulation of TOP2A was only associated with tumor size.
One of the underlying molecular reason may be that the
overexpression of TOP2A arises from amplification and
mutation, while the survival analysis using the cBioPortal platform
was only based on the mutation of TOP2A. Thus, amplification
but not mutation may result in overexpression of TOP2A, not
related to changes in prognosis, although further study is needed
to prove this hypothesis. Oncomine analysis revealed that higher
AURKA mRNA levels were observed in colorectal cancer, breast
cancer, lung cancer and sarcoma. Additionally, higher TOP2A
mRNA levels were observed in colorectal cancer, breast cancer, lung
cancer and brain cancer, indicating important roles of these two
genes in the carcinogenesis and development of malignant tumors.
However, these results also indicate that these two genes can only
be used as broad-spectrum tumor markers as they cannot
differentiate lung adenocarcinoma from other malignant tumors.
The UCSC (University of California Santa Cruz)
cancer platform was used to hierarchically cluster the hub genes.
Their expression levels in both the primary and recurrent tumors
were upregulated compared with the normal tissues. The expression
levels of these hub genes in recurrent tumors were higher than in
the primary tumor. TOP2A in particular was found to have the
highest expression in the recurrent tumors. We therefore infer that
TOP2A and other hub genes may be regarded as early biomarkers for
monitoring tumor recurrence.
To confirm our results, we detected the expression
of TOP2A and AURKA in lung adenocarcinoma and human
bronchial epithelial (HBE) cell lines. Both of these genes were
downregulated in the lung adenocarcinoma cell lines. TOP2A
and AURKA had their highest expression levels in H1975 cells
with approximately 15 times higher expression than that in HBEs
cells. Further experiments in human samples found that TOP2A
and AURKA were both upregulated in lung adenocarcinoma
tissues compared with non-cancerous tissues. The upregulation of
TOP2A was found to be associated with larger tumor size, and
AURKA was found to be associated with both larger tumor size
and positive lymphatic metastasis. Thus, we demonstrated that
TOP2A and AURKA are closely involved in lung
adenocarcinoma using both bioinformatics and cell experiments. The
cell lines we selected have varying levels of EMT. The H1975 cell
line (56) has the highest relative
level of EMT and also has higher levels of AURKA and
TOP2A in our study. We also showed that higher AURKA
expression is correlated with poor prognosis. Thus, the higher
expression of AURKA may be correlated with higher levels of
EMT, which result in metastasis and lead to poor prognosis.
In conclusion, our research aimed to identify DEGs,
which may be involved in the genesis and development of lung
adenocarcinoma. Two of the 16 hub genes were further studied in
cell lines and human samples and may be regarded as biomarkers for
the diagnosis of lung adenocarcinoma. Further research is needed to
elucidate the mechanisms behind their changes in expression and
their biological function in lung adenocarcinoma.
Acknowledgements
Not applicable.
Funding
This research was supported by a grant (no.
81702242) from the National Science Foundation of China and
Doctoral Scientific Research Foundation of Liaoning Province (no.
20170520441).
Availability of data and materials
The data used in this study are available from the
corresponding author on reasonable request.
Authors' contribution
SD and SX designed the research. WM carried out the
data collection and analysis. SY conducted the experiments. SD
wrote the manuscript. All authors read and approved the manuscript
and agree to be accountable for all aspects of the research in
ensuring that the accuracy or integrity of any part of the work are
appropriately investigated and resolved.
Ethics approval and consent to
participate
The Ethics Committee of the First Hospital of the
China Medical University (Shenyang, Liaoning, China) approved our
research. Written informed consent was received from all of the
included patients.
Patient consent for publication
Not applicable.
Competing interests
The authors declare that they have no competing
interests.
References
|
1
|
Siegel RL, Miller KD and Jemal A: Cancer
statistics, 2018. CA Cancer J Clin. 68:7–30. 2018. View Article : Google Scholar : PubMed/NCBI
|
|
2
|
Lawrence MS, Stojanov P, Polak P, Kryukov
GV, Cibulskis K, Sivachenko A, Carter SL, Stewart C, Mermel CH,
Roberts SA, et al: Mutational heterogeneity in cancer and the
search for new cancer-associated genes. Nature. 499:214–218. 2013.
View Article : Google Scholar : PubMed/NCBI
|
|
3
|
Ferrara R, Mezquita L, Texier M, Lahmar J,
Audigier-Valette C, Tessonnier L, Mazieres J, Zalcman G, Brosseau
S, Le Moulec S, et al: Hyperprogressive disease in patients with
advanced non-small cell lung cancer treated With PD-1/PD-L1
inhibitors or with single-agent chemotherapy. JAMA Oncol.
4:1543–1552. 2018. View Article : Google Scholar : PubMed/NCBI
|
|
4
|
Park CK, Cho HJ, Choi YD, Oh IJ and Kim
YC: A phase II trial of osimertinib in the second-line treatment of
non-small cell lung cancer with the EGFR T790M mutation, detected
from circulating tumor DNA: LiquidLung-O-Cohort 2. Cancer Res
Treat. 51:777–787. 2019. View Article : Google Scholar : PubMed/NCBI
|
|
5
|
Barrett T, Wilhite SE, Ledoux P,
Evangelista C, Kim IF, Tomashevsky M, Marshall KA, Phillippy KH,
Sherman PM, Holko M, et al: NCBI GEO: Archive for functional
genomics data sets-update. Nucleic Acids Res. 41((Database Issue)):
D991–D995. 2013.PubMed/NCBI
|
|
6
|
Robles AI, Arai E, Mathé EA, Okayama H,
Schetter AJ, Brown D, Petersen D, Bowman ED, Noro R, Welsh JA, et
al: An Integrated prognostic classifier for stage I lung
adenocarcinoma based on mRNA, microRNA, and DNA methylation
biomarkers. J Thorac Oncol. 10:1037–1048. 2015. View Article : Google Scholar : PubMed/NCBI
|
|
7
|
Selamat SA, Chung BS, Girard L, Zhang W,
Zhang Y, Campan M, Siegmund KD, Koss MN, Hagen JA, Lam WL, et al:
Genome-scale analysis of DNA methylation in lung adenocarcinoma and
integration with mRNA expression. Genome Res. 22:1197–1211. 2012.
View Article : Google Scholar : PubMed/NCBI
|
|
8
|
Girard L, Rodriguez-Canales J, Behrens C,
Thompson DM, Botros IW, Tang H, Xie Y, Rekhtman N, Travis WD,
Wistuba II, et al: An expression signature as an aid to the
histologic classification of non-small cell lung cancer. Clin
Cancer Res. 22:4880–4889. 2016. View Article : Google Scholar : PubMed/NCBI
|
|
9
|
Huang DW, Sherman BT, Tan Q, Collins JR,
Alvord WG, Roayaei J, Stephens R, Baseler MW, Lane HC and Lempicki
RA: The DAVID Gene Functional Classification Tool: A novel
biological module-centric algorithm to functionally analyze large
gene lists. Genome Biol. 8:R1832007. View Article : Google Scholar : PubMed/NCBI
|
|
10
|
Tanabe M and Kanehisa M: Using the KEGG
database resource. Curr Protoc Bioinformatics Chapter 1. Unit 1.12.
2012. View Article : Google Scholar
|
|
11
|
Szklarczyk D, Morris JH, Cook H, Kuhn M,
Wyder S, Simonovic M, Santos A, Doncheva NT, Roth A, Bork P, et al:
The STRING database in 2017: Quality-controlled protein-protein
association networks, made broadly accessible. Nucleic Acids Res.
45:D362–D368. 2017. View Article : Google Scholar : PubMed/NCBI
|
|
12
|
Shannon P, Markiel A, Ozier O, Baliga NS,
Wang JT, Ramage D, Amin N, Schwikowski B and Ideker T: Cytoscape: A
software environment for integrated models of biomolecular
interaction networks. Genome Res. 13:2498–2504. 2003. View Article : Google Scholar : PubMed/NCBI
|
|
13
|
Kwon S, Kim H and Kim HS: Identification
of pharmacologically tractable protein complexes in cancer using
the R-based network clustering and visualization program MCODER.
BioMed Res Int. 2017:10163052017. View Article : Google Scholar : PubMed/NCBI
|
|
14
|
Demchak B, Hull T, Reich M, Liefeld T,
Smoot M, Ideker T and Mesirov JP: Cytoscape: The network
visualization tool for GenomeSpace workflows. Version 2. F1000Res.
3:1512014. View Article : Google Scholar : PubMed/NCBI
|
|
15
|
Cerami E, Gao J, Dogrusoz U, Gross BE,
Sumer SO, Aksoy BA, Jacobsen A, Byrne CJ, Heuer ML, Larsson E, et
al: The cBio cancer genomics portal: An open platform for exploring
multidimensional cancer genomics data. Cancer Discov. 2:401–404.
2012. View Article : Google Scholar : PubMed/NCBI
|
|
16
|
Maere S, Heymans K and Kuiper M: BiNGO: A
Cytoscape plugin to assess overrepresentation of gene ontology
categories in biological networks. Bioinformatics. 21:3448–3449.
2005. View Article : Google Scholar : PubMed/NCBI
|
|
17
|
Casper J, Zweig AS, Villarreal C, Tyner C,
Speir ML, Rosenbloom KR, Raney BJ, Lee CM, Lee BT, Karolchik D, et
al: The UCSC Genome Browser database: 2018 update. Nucleic Acids
Res. 46:D762–D769. 2018.PubMed/NCBI
|
|
18
|
Rhodes DR, Kalyana-Sundaram S, Mahavisno
V, Varambally R, Yu J, Briggs BB, Barrette TR, Anstet MJ,
Kincead-Beal C, Kulkarni P, et al: Oncomine 3.0: Genes, pathways,
and networks in a collection of 18,000 cancer gene expression
profiles. Neoplasia. 9:166–180. 2007. View Article : Google Scholar : PubMed/NCBI
|
|
19
|
Dong S, Qu X, Li W, Zhong X, Li P, Yang S,
Chen X, Shao M and Zhang L: The long non-coding RNA, GAS5, enhances
gefitinib-induced cell death in innate EGFR tyrosine kinase
inhibitor-resistant lung adenocarcinoma cells with wide-type EGFR
via downregulation of the IGF-1R expression. J Hematol Oncol.
8:432015. View Article : Google Scholar : PubMed/NCBI
|
|
20
|
Labbé DP, Sweeney CJ, Brown M, Galbo P,
Rosario S, Wadosky KM, Ku SY, Sjöström M, Alshalalfa M, Erho N, et
al: TOP2A and EZH2 provide early detection of an aggressive
prostate cancer subgroup. Clin Cancer Res. 23:7072–7083. 2017.
View Article : Google Scholar : PubMed/NCBI
|
|
21
|
Rouquier S, Pillaire MJ, Cazaux C and
Giorgi D: Expression of the microtubule-associated protein
MAP9/ASAP and its partners AURKA and PLK1 in colorectal and breast
cancers. Dis Markers. 2014:7981702014. View Article : Google Scholar : PubMed/NCBI
|
|
22
|
Beer DG, Kardia SL, Huang CC, Giordano TJ,
Levin AM, Misek DE, Lin L, Chen G, Gharib TG, Thomas DG, et al:
Gene-expression profiles predict survival of patients with lung
adenocarcinoma. Nat Med. 8:816–824. 2002. View Article : Google Scholar : PubMed/NCBI
|
|
23
|
Hou J, Aerts J, den Hamer B, van Ijcken W,
den Bakker M, Riegman P, van der Leest C, van der Spek P, Foekens
JA, Hoogsteden HC, et al: Gene expression-based classification of
non-small cell lung carcinomas and survival prediction. PLoS One.
5:e103122010. View Article : Google Scholar : PubMed/NCBI
|
|
24
|
Landi MT, Dracheva T, Rotunno M, Figueroa
JD, Liu H, Dasgupta A, Mann FE, Fukuoka J, Hames M, Bergen AW, et
al: Gene expression signature of cigarette smoking and its role in
lung adenocarcinoma development and survival. PLoS One.
3:e16512008. View Article : Google Scholar : PubMed/NCBI
|
|
25
|
Su LJ, Chang CW, Wu YC, Chen KC, Lin CJ,
Liang SC, Lin CH, Whang-Peng J, Hsu SL, Chen CH and Huang CY:
Selection of DDX5 as a novel internal control for Q-RT-PCR from
microarray data using a block bootstrap re-sampling scheme. BMC
Genomics. 8:1402007. View Article : Google Scholar : PubMed/NCBI
|
|
26
|
Yamagata N, Shyr Y, Yanagisawa K, Edgerton
M, Dang TP, Gonzalez A, Nadaf S, Larsen P, Roberts JR, Nesbitt JC,
et al: A training-testing approach to the molecular classification
of resected non-small cell lung cancer. Clin Cancer Res.
9:4695–4704. 2003.PubMed/NCBI
|
|
27
|
Bhattacharjee A, Richards WG, Staunton J,
Li C, Monti S, Vasa P, Ladd C, Beheshti J, Bueno R, Gillette M, et
al: Classification of human lung carcinomas by mRNA expression
profiling reveals distinct adenocarcinoma subclasses. Proc Natl
Acad Sci USA. 98:13790–13795. 2001. View Article : Google Scholar : PubMed/NCBI
|
|
28
|
Garber ME, Troyanskaya OG, Schluens K,
Petersen S, Thaesler Z, Pacyna-Gengelbach M, van de Rijn M, Rosen
GD, Perou CM, Whyte RI, et al: Diversity of gene expression in
adenocarcinoma of the lung. Proc Natl Acad Sci USA. 98:13784–13789.
2001. View Article : Google Scholar : PubMed/NCBI
|
|
29
|
Bray F, Ferlay J, Soerjomataram I, Siegel
RL, Torre LA and Jemal A: Global cancer statistics 2018: GLOBOCAN
estimates of incidence and mortality worldwide for 36 cancers in
185 countries. CA Cancer J Clin. 68:394–424. 2018. View Article : Google Scholar : PubMed/NCBI
|
|
30
|
Li Y, Juhasz AL, Ma LQ and Cui X:
Inhalation bioaccessibility of PAHs in PM2.5:
Implications for risk assessment and toxicity prediction. Sci Total
Environ. 650:56–64. 2019. View Article : Google Scholar : PubMed/NCBI
|
|
31
|
Papadopoulos A, Guida F, Cénée S, Cyr D,
Schmaus A, Radoï L, Paget-Bailly S, Carton M, Tarnaud C, Menvielle
G, et al: Cigarette smoking and lung cancer in women: Results of
the French ICARE case-control study. Lung Cancer. 74:369–377. 2011.
View Article : Google Scholar : PubMed/NCBI
|
|
32
|
Sekine T, Sakaguchi C and Fukano Y:
Investigation by microarray analysis of effects of cigarette design
characteristics on gene expression in human lung mucoepidermoid
cancer cells NCI-H292 exposed to cigarette smoke. Exp Toxicol
Pathol. 67:143–151. 2015. View Article : Google Scholar : PubMed/NCBI
|
|
33
|
Huang Z, Su R, Qing C, Peng Y, Luo Q and
Li J: Plasma circular RNAs hsa_circ_0001953 and hsa_circ_0009024 as
diagnostic biomarkers for active tuberculosis. Front Microbiol.
9:20102018. View Article : Google Scholar : PubMed/NCBI
|
|
34
|
Tan TZ, Rouanne M, Tan KT, Huang RY and
Thiery JP: Molecular subtypes of urothelial bladder cancer: Results
from a meta-cohort analysis of 2411 tumors. Eur Urol. 75:423–432.
2019. View Article : Google Scholar : PubMed/NCBI
|
|
35
|
Li SY, Wu HC, Mai HF, Zhen JX, Li GS and
Chen SJ: Microarray-based analysis of whole-genome DNA methylation
profiling in early detection of breast cancer. J Cell Biochem.
120:658–670. 2019. View Article : Google Scholar : PubMed/NCBI
|
|
36
|
Miao S, Qiu T, Zhao Y, Wang H, Sun X, Wang
Y, Xuan Y, Qin Y and Jiao W: Overexpression of S100A13 protein is
associated with tumor angiogenesis and poor survival in patients
with early-stage non-small cell lung cancer. Thorac Cancer.
9:1136–1144. 2018. View Article : Google Scholar : PubMed/NCBI
|
|
37
|
Eser PO and Jänne PA: TGFβ pathway
inhibition in the treatment of non-small cell lung cancer.
Pharmacol Ther. 184:112–130. 2018. View Article : Google Scholar : PubMed/NCBI
|
|
38
|
Basu AK: DNA damage, mutagenesis and
cancer. Int J Mol Sci. 19:E9702018. View Article : Google Scholar : PubMed/NCBI
|
|
39
|
Park CW, Bak Y, Kim MJ, Srinivasrao G,
Hwang J, Sung NK, Kim BY, Yu JH, Hong JT and Yoon DY: The novel
small molecule STK899704 promotes senescence of the human A549
NSCLC cells by inducing DNA damage responses and cell cycle arrest.
Front Pharmacol. 9:1632018. View Article : Google Scholar : PubMed/NCBI
|
|
40
|
Li L, Lei Q, Zhang S, Kong L and Qin B:
Screening and identification of key biomarkers in hepatocellular
carcinoma: Evidence from bioinformatic analysis. Oncol Rep.
38:2607–2618. 2017. View Article : Google Scholar : PubMed/NCBI
|
|
41
|
Knez L, Sodja E, Kern I, Košnik M and
Cufer T: Predictive value of multidrug resistance proteins,
topoisomerases II and ERCC1 in small cell lung cancer: A systematic
review. Lung Cancer. 72:271–279. 2011. View Article : Google Scholar : PubMed/NCBI
|
|
42
|
Huang H, Liu J, Meng Q and Niu G:
Multidrug resistance protein and topoisomerase 2 alpha expression
in non-small cell lung cancer are related with brain metastasis
postoperatively. Int J Clin Exp Pathol. 8:11537–11542.
2015.PubMed/NCBI
|
|
43
|
Sudan S and Rupasinghe HP:
Quercetin-3-O-glucoside induces human DNA topoisomerase II
inhibition, cell cycle arrest and apoptosis in hepatocellular
carcinoma cells. Anticancer Res. 34:1691–1699. 2014.PubMed/NCBI
|
|
44
|
Kaur G, Reinhart RA, Monks A, Evans D,
Morris J, Polley E and Teicher BA: Bromodomain and hedgehog pathway
targets in small cell lung cancer. Cancer Lett. 371:225–239. 2016.
View Article : Google Scholar : PubMed/NCBI
|
|
45
|
Shi R, Sun Q, Sun J, Wang X, Xia W, Dong
G, Wang A, Jiang F and Xu L: Cell division cycle 20 overexpression
predicts poor prognosis for patients with lung adenocarcinoma.
Tumour Biol. 39:10104283176922332017. View Article : Google Scholar : PubMed/NCBI
|
|
46
|
Klaeger S, Heinzlmeir S, Wilhelm M, Polzer
H, Vick B, Koenig PA, Reinecke M, Ruprecht B, Petzoldt S, Meng C,
et al: The target landscape of clinical kinase drugs. Science.
358:eaan43682017. View Article : Google Scholar : PubMed/NCBI
|
|
47
|
Lazaris AC, Kavantzas NG, Zorzos HS,
Tsavaris NV and Davaris PS: Markers of drug resistance in relapsing
colon cancer. J Cancer Res Clin Oncol. 128:114–118. 2002.
View Article : Google Scholar : PubMed/NCBI
|
|
48
|
Costa MJ, Hansen CL, Holden JA and Guinee
D Jr: Topoisomerase II alpha: Prognostic predictor and cell cycle
marker in surface epithelial neoplasms of the ovary and peritoneum.
Int J Gynecol Pathol. 19:248–257. 2000. View Article : Google Scholar : PubMed/NCBI
|
|
49
|
Taylor NJ, Bensen JT, Poole C, Troester
MA, Gammon MD, Luo J, Millikan RC and Olshan AF: Genetic variation
in cell cycle regulatory gene AURKA and association with intrinsic
breast cancer subtype. Mol Carcinog. 54:1668–1677. 2015. View Article : Google Scholar : PubMed/NCBI
|
|
50
|
Hoque A, Carter J, Xia W, Hung MC, Sahin
AA, Sen S and Lippman SM: Loss of aurora A/STK15/BTAK
overexpression correlates with transition of in situ to invasive
ductal carcinoma of the breast. Cancer Epidemiol Biomarkers Prev.
12:1518–1522. 2003.PubMed/NCBI
|
|
51
|
Zhou H, Kuang J, Zhong L, Kuo WL, Gray JW,
Sahin A, Brinkley BR and Sen S: Tumour amplified kinase STK15/BTAK
induces centrosome amplification, aneuploidy and transformation.
Nat Genet. 20:189–193. 1998. View
Article : Google Scholar : PubMed/NCBI
|
|
52
|
Staff S, Isola J, Jumppanen M and Tanner
M: Aurora-A gene is frequently amplified in basal-like breast
cancer. Oncol Rep. 23:307–312. 2010.PubMed/NCBI
|
|
53
|
Lukasiewicz KB and Lingle WL: Aurora A,
centrosome structure, and the centrosome cycle. Environ Mol
Mutagen. 50:602–619. 2009. View Article : Google Scholar : PubMed/NCBI
|
|
54
|
Melichar B, Adenis A, Lockhart AC,
Bennouna J, Dees EC, Kayaleh O, Obermannova R, DeMichele A,
Zatloukal P, Zhang B, et al: Safety and activity of alisertib, an
investigational aurora kinase A inhibitor, in patients with breast
cancer, small-cell lung cancer, non-small-cell lung cancer, head
and neck squamous-cell carcinoma, and gastro-oesophageal
adenocarcinoma: A five-arm phase 2 study. Lancet Oncol. 16:395–405.
2015. View Article : Google Scholar : PubMed/NCBI
|
|
55
|
Chen J, Lu H, Zhou W, Yin H, Zhu L, Liu C,
Zhang P, Hu H, Yang Y and Han H: AURKA upregulation plays a role in
fibroblast-reduced gefitinib sensitivity in the NSCLC cell line
HCC827. Oncol Rep. 33:1860–1866. 2015. View Article : Google Scholar : PubMed/NCBI
|
|
56
|
Duan L, Ye L, Zhuang L, Zou X, Liu S,
Zhang Y, Zhang L, Jin C and Huang Y: VEGFC/VEGFR3 axis mediates
TGFβ1-induced epithelial-to-mesenchymal transition in non-small
cell lung cancer cells. PLoS One. 13:e02004522018. View Article : Google Scholar : PubMed/NCBI
|