Introduction
CCM proteins have been demonstrated to play major
roles in microvascular angiogenesis in human and animal models
(1–6), which is an essential step for cancer
growth during tumorigenesis (5,6). Three
genes have been identified as causes of CCMs: cerebral cavernous
malformations 1 [(CCM1) also termed Krev interaction trapped 1
(KRIT1)], cerebral cavernous malformation 2 [(CCM2) also
termed MGC4607] and cerebral cavernous malformation 3
[(CCM3) also termed programmed cell death 10 (PDCD10)]. It
has been demonstrated that both CCM1 and CCM3 bind to CCM2 to form
a CCM signaling complex (CSC) with which to modulate multiple
signaling cascades. As one of three key components of the CSC, CCM3
was initially identified as a tumor-associated apoptotic protein
(7) which directly interacts with
CCM2 within the CSC complex (8,9),
suggesting that the CSC complex may be involved in tumorigenesis.
CCM1 is ubiquitously expressed in various cells and tissues
(5,10); likewise, almost all expressed
isoforms of CCM2 are ubiquitously expressed in various cells and
tissues (11), providing additional
evidence for the potential involvement of the CSC in diverse
cellular events in health and diseases, including cancer.
Previous data have shown much higher relative RNA
expression levels of the CCM1 gene in all cancer cell lines,
compared to normal primary cell lines (5). In fact, CCM1 was found to act as a
potential tumor suppressor inhibited in several cultured cancer
cell lines by miR-21 (12), one of
the most overexpressed small RNAs in a variety of solid cancers,
including breast, colon, melanoma, cervix, ovarian, lung, pancreas,
prostate and stomach cancers (13).
Likewise, deficiency of Ccm1 in a mouse model showed an increased
appearance of adenoma associated with increased β-catenin-mediated
signaling (14), further supporting
the potential role of CCM1 in tumorigenesis. As a docking protein
for both CCM1 and CCM3, CCM2 (isoform-100) has been reported to be
upregulated in various cardiovascular conditions, indicating its
role as a possible potent angiogenic factor (15). Furthermore, higher relative RNA
expression levels of multiple CCM2 isoforms were also
observed in all cancer cell lines, compared to normal primary cell
lines (11), reinforcing the
phenomena observed in CCM1 (5).
CCM2 was found to be a key mediator of TrkA-dependent cell death in
tumors, by coupling among TrkA signaling, caspase activation, and
cell death. Depletion of CCM2 in medulloblastoma or neuroblastoma
cells was found to attenuate TrkA-dependent death (16), suggesting that CCM2 is a distinctive
type of tumor suppressor that modulates tyrosine kinase signaling
(17). These data suggest that both
CCM1 and CCM2 act as tumor suppressors during
tumorigenesis. CCM3, initially identified as a tumor
suppressor (7), has been
extensively studied for its role in tumorigenesis. Downregulation
of CCM3 is associated with the activation of Akt signaling protein
in glioblastoma (GBM), implicating its role in tumor proliferation
and apoptosis, hyperangiogenesis and peritumoral edema in GBM
(18). Knockdown of CCM3 in
GBM cells was found to promote tumor growth and increased tumor
mass and led to a chemo-resistance of mice treated with
temozolomide (19). In co-cultured
human endothelial cells (ECs) and GBM cell lines (U87 and LN229),
silencing of CCM3 in ECs significantly promoted tumor cell
proliferation, migration, adhesion, invasion and inhibited
apoptosis; this suggests that loss of endothelial CCM3
intercellularly activates neighboring GBM cells and promotes tumor
growth, likely via a paracrine mechanism (20). It has been demonstrated that CCM3 is
a direct target of multiple microRNAs during tumorigenesis. CCM3 is
a direct target of miR-103 which downregulates CCM3 expression by
binding the CCM3 3′UTR (21);
miR-103 can play dual roles as either an oncogene or a
tumor-suppressor in various types of cancers. As an oncogene, it
promotes colorectal cancer by inhibiting tumor suppressors
(22), and promoting
triple-negative breast cancer cells to migrate and invade by
targeting OLFM4 (23). As a tumor
suppressor, miR-103 targets the c-Myc activators c-Myb and DVL1
resulting in reduced c-Myc expression in leukemia. Enhancement of
miR-103 inhibits proliferation and sensitizes hemopoietic tumor
cells for glucocorticoid-induced apoptosis, suggesting miR-103 as a
hopeful therapeutic target and a useful prognostic biomarker for
hemopoietic tumor cells (24), as
well as to identify primary lung tumors with metastatic capacity
(25). Interestingly, since miR-103
inhibits CCM3 expression, CCM3 usually plays an opposing role as
miR-103 in this dual regulatory relationship. In non-small cell
lung cancer (NSCLC) cell line, A549, CCM3 expression was found to
be increased while miR-103 expression was decreased, demonstrating
that miR-103 acts as a tumor suppressor while CCM3 acts as an
oncogene in NSCLC (26). A similar
relationship between miR-103 and CCM3 was also observed in prostate
cancer (21). These data suggest
the existence of an opposing relationship between miR-103 and CCM3
as either an oncogene or tumor suppressor during tumorigenesis.
In summary, previous data suggest that all three CCM
proteins are likely involved in tumorigenesis in various stages of
different cancers with distinctive roles; however, lack of
systematic study of the CSC complex in tumorigenesis hinders our
understanding in this aspect. In this report, we firstly performed
a systemic analysis of expression patterns of three CCM proteins in
multiple human cancers at both transcriptional and translational
levels, using real-time quantitative polymerase chain reaction
(qPCR), RNA-fluorescence in situ hybridization (RNA-FISH),
western blot analysis, immunohistochemistry (IHC) and multicolor
immunofluorescence (IF) imaging technologies. Our data demonstrate
a complicated role of the CSC complex observed in multiple human
cancers, with promising data for potential biomarker applications
of CCM genes for clinical oncology.
Materials and methods
Real-time quantitative PCR analysis
(qPCR) and fluorescence in situ hybridization (FISH)
Real-time quantitative PCR analysis (qPCR).
Expression of CCM genes at both the transcriptional and
translational levels was confirmed through both qPCR and western
blot analysis. Allele-specific real-time quantitative PCR (qPCR)
assays were designed using boundary-spanning primer sets as
previously described (11) and
applied to quantify the RNA levels of the endogenously expressed
CCM2 isoforms using Power SYBR Green Master Mix with ViiA 7
Real-Time PCR aystem (Applied Biosystems). TissueScan™ Real-Time
PCR panels (HMRT100, 103, CSRT502) with Human β-actin control
primer set (Origene) were used to determine the endogenous
expression levels of CCM2 isoforms among the different tissues at
the transcriptional level. The qPCR data were analyzed with
DataAssist™ (ABI; Thermo Fisher Scientific, Inc.) and Rest 2009
software (Qiagen). The relative expression level (2−ΔCT)
was calculated from all samples and normalized to reference gene
(β-actin); fold change (2−ΔΔCT) comparison was conducted
by being further normalized to control groups (27). All experiments were performed with
triplicates as described previously (11).
RNA fluorescence in situ hybridization
(RNA-FISH)
For FISH assay, DIG-labelled antisense CCM2 isoform
RNA probes (DIG-RNA) were synthesized with our CCM2 isoform
constructs, using Riboprobe in-vitro Transcription Systems
(Promega) in combination with DIG RNA Labeling kit (Roche).
Purified DIG-RNA probes were diluted to 20 µg/ml in hybridization
buffer. Multiple tumor and corresponding normal frozen tissue
microarrays (BioChain, Biomax) were fixed in 4% PFA followed by
dehydration in 20% sucrose and permeabilized with proteinase K (2
µg/ml). It was then pre-hybridized, and subsequently hybridized
with 100–200 ng/ml DIG-RNA antisense probes from various CCM2
isoforms at 65°C overnight with the sense probes being used as
negative controls; and mounted for IF analysis according to the
manufacturer's instructions (BioChain, Biomax). The images were
analyzed with NIS-Elements software (Nikon).
Immunohistochemistry (IHC) and
immunofluorescence (IF) of paired normal-tumor tissue sections and
western blot analysis
Deparaffinization of paraffin-embedded
tissue sections
Slides (individual sections as well as microarrays)
purchased from various suppliers [(T6234700-5, T6235086-PP,
T8235086-PP, T8235149-PP; BioChain), (BCN962a, CM481, LV8011a,
EMC1021, UT243, T233, TE242; LM482, US Biomax) and (T8235086-PP,
Amsbio)] were baked at 60°C for 2 h. Once cooled, the sections were
washed in 3 changes of xylene for 5 min each, followed by 3-min
sequential washes in 100, 95, 90, 80 and 70% ethanol and then
soaked in water before an antigen retrieval step.
Antigen retrieval
Tissue sections were submerged in 10 mM sodium
citrate buffer
(Na3C6H5O7, pH 6.0)
containing 0.01% Triton X-100 and were maintained at 95–98°C using
a hotplate. The solution was carefully monitored to ensure boiling
did not occur, which could have dislodged the tissue sections from
the slide. Tissues were kept in citrate buffer at 95–98°C for 30
min and then allowed to cool down to room temperature (RT) in
buffer. After being cooled, the slides were incubated at 37°C in a
0.05% Pronase solution in PBS. The combined heat-induced and
enzyme-induced antigen retrieval methods were combined to increase
staining with multiple conjugated antibodies.
Blocking and antibody incubation
After antigen retrieval: a) [for horseradish
peroxidase (HRP)/3,3′-diaminobenzidine (DAB) detection system], the
slides were briefly incubated in hydrogen peroxide block (supplied
with the AB 64261 HRP/DAB detection kit; Abcam) for 10 min and
washed 2 times in buffer (PBS+0.2% Triton X-100). Protein block was
added (supplied with the AB 64261 HRP/DAB detection kit) for 10 min
at RT followed by 1 wash. The primary antibody was added (dilution,
1:200) and incubated overnight (O/N) at 4°C. The tissue was then
washed 4 times in buffer. Biotinylated goat anti-polyvalent
(supplied with the AB 64261 HRP/DAB detection kit) was added to the
tissue and incubated for 10 min at RT followed by 4 washes.
Streptavidin peroxidase (supplied with the AB 64261 HRP/DAB
detection kit) was then added and incubated at RT for 10 min,
followed by 4 washes. One drop of DAB chromogen was added to 50
drops of DAB substrate (supplied with the AB 64261 HRP/DAB
detection kit) immediately prior to applying on the tissue and
incubation was carried out for 10 min followed by 4 rinses. Primary
antibodies were purchased and included anti-CCM2 (Novus
Biologicals; cat. no. NBP1-86730), CCM1 (Santa Cruz Biotechnology;
cat. no. sc-514371), CCM3 (Santa Cruz Biotechnology; cat. no.
sc-514371), PAQR7 (Aviva Systems Biology; cat. no. OASG04641),
α-actin (Santa Cruz Biotechnology; cat. no. sc-17829) and β-actin
(Santa Cruz Biotechnology; cat. no. sc-8432) antibodies. b) (for
the IF detection system) The slides were briefly incubated in PBS
containing 0.2% Triton X-100 for 10 min at RT to permeabilize the
sections after antigen retrieval. Following permeabilization, the
sections were blocked with PBS buffer containing 5.0% BSA with 0.2%
Triton X-100 for 2 h at RT. Tissue sections were restricted using a
hydrophobic pen which allows for conservation of antibodies.
CCM1-Alexafluor® 488 (dilution, 1:1,000) (Santa Cruz
Biotechnology; cat. no. sc-514371) and CCM3-Alexa Fluor®
647 (dilution, 1:500) (Santa Cruz Biotechnology; cat. no.
sc-514371) antibodies were combined into PBS buffer containing 2.0%
BSA and 0.2% Triton X-100 and initial 500 µl was placed directly
above the tissue for incubation for 1 h at RT in the dark.
Following the 1-h incubation at RT, fresh 500 µl of antibody
solution was placed directly above the tissue for incubation O/N at
4°C in the dark.
Counterstaining with hematoxylin for
IHC and mounting/sealing
Cell nuclei were counterstained (useful for
visualizing and normalizing HRP/DAB quantification) using Harris
Hematoxylin solution (Sigma-Aldrich; Merck KGaA). Briefly, the
slides were soaked in solution for 2 min and rinsed under running
tap water for 5 min. Tissue sections were further blued using
Scott's tap water (Sigma-Aldrich; Merck KGaA) for 3 min. Slides
were then dehydrated ending in xylene and ready to be mounted and
sealed. The tissue was then mounted using xylene-based mounting
media and allowed to sit for 1 h, before sealing with nail polish
to cure O/N. Immunofluorescence slides were DAPI stained during the
mounting/sealing process as the UltraCruz mounting media (Santa
Cruz Biotechnology) used for IF slides contain DAPI. To allow
efficient staining of DAPI, the slides should be allowed to rest
O/N at 4°C in the dark before sealing with nail polish to cure
O/N.
Imaging and quantification
Imaging was carried out using either a Nikon
EclipseTi microscope with a color camera for IHC or a Nikon Eclipse
Ti confocal microscope for IF images. Images were acquired using a
10X objective lens to ensure coverage of tissue rather than
in-depth visualization of a small region. Quantification was
conducted automatically using Elements Analysis software provided
with a Nikon microscope for both applications. Threshold was
defined and maintained throughout all images for each application
to ensure no bias was applied to the data. Thresholds were applied
to exclude low and high outliers. The red/brown color from the
HRP/DAB reactivity with the CCM2 antibody was quantified and
averaged between the red and green channel quantification, and the
fluorescent images were quantified for CCM1 and CCM3 using
wavelength channels 488 and 647 nm, respectively.
Western blot analysis and
quantification
The relative expression levels of CCM proteins were
measured using western blot (WB) analysis. Equal amounts, (20 µg)
determined through BCA assay (Bio-Rad), of protein lysates of
paired tumors and adjacent normal tissues from liver (CP565477,
CP520741, CP520759, CP565745, OriGene; P8235149-PP, BioChain) and
endometrial tissues (CP565394, CP565528, CP565532, CP565549;
OriGene) in modified RIPA buffer (150 mM NaCl, 1% NP-40, 0.5%
sodium deoxycholate, 50 mM Tris-HCl, pH 8.0, and protease
inhibitors) were separated on 4–15% Criterion Precast TGX (Bio-Rad)
SDS-PAGE (sodium dodecyl sulphate-polyacrylamide gel
electrophoresis) gels, then transferred to PVDF membranes, and
probed with corresponding antibodies. All WB antibodies are listed
in the Tissue-staining and immunohistochemistry (IHC) section
above, which were conjugated with either chemiluminescence
fluorescence for protein band imaging. WB images were acquired and
analyzed using a GE imager analyzer LAS-4000 (GE Healthcare Life
Sciences).
Statistical analysis
One-way analysis of variance (ANOVA) was used to
detect the differences in the mean values among the treatment
groups. All pairwise multiple comparison procedures were analyzed
using Tukey and Student's un-paired t-test to test the difference
between each treatment. Plots and charts were constructed and
produced by SigmaPlot 12.0 (Systat Software, Inc.) and GraphPad
Prism 8 (GraphPad Software, Inc.).
Results
Altered transcription expression of
CCM2 isoforms in tumorigenesis
In our previous research, the RNA expression levels
of CCM1 were examined in different human tissues by northern
blot analysis (10) and
multi-tissue panels with qPCR (5).
CCM1 was found to be nearly ubiquitously expressed in all
major tissues, indicating the potentially diverse functions of
CCM1. The relative expression of the CCM1 gene in homogenous
cell populations from selected cell lines was also examined by qPCR
(5). We found that compared to
other cell lines, there was a much higher relative RNA expression
level of the CCM1 gene in all cancer cell lines (5) and likewise, the same phenomena were
also observed in the relative RNA expression levels of CCM2
isoforms (11). These data lead us
to propose a potential role of the CSC in tumorigenesis in various
tissues (5,11). To validate our in vitro
findings, we screened TissueScan Real-Time cDNA sets for human
tumor panels which covered all major types of cancer by qPCR, and
found that while endometrial tumors had significantly decreased RNA
expression levels of CCM1, both liver and testis tumors had
significantly increased RNA expression levels of CCM1
compared to their normal controls (5), suggesting that CCM1 might have
opposing roles in certain types of cancer during tumorigenesis. To
further strengthen our findings, in the present study, we examined
the expression levels of multiple CCM2 isoforms by screening the
same human major-tumor tissue panels with qPCR analysis.
Intriguingly, our data showed a similar pattern of altered
expression in all newly identified CCM2 isoforms. Our data
demonstrated that multiple isoforms had altered gene expression in
major cancer tissues at the RNA level in comparison to their
adjacent normal tissues, as representatively illustrated in
Fig. 1A, proposing the potential
role of CCM2 isoforms in tumorigenesis. Furthermore, almost half of
the screened tumors with altered RNA expression of CCM2 isoforms
(44%) were found to be cancers in the reproductive system
(endometrium, breast and testis) (Fig.
1A), suggesting a major role of CCM2 isoforms in reproductive
cancer. Our qPCR data of CCM2 isoforms in major types of cancers
were also visualized with RNA fluorescent in situ
hybridization (RNA-FISH). We utilized RNA-FISH technology with a
specific CCM2 isoform, CCM2-212, as a representative probe to
screen cancer tissues; our data showed that an altered RNA
expression level of the CCM2-212 isoform was associated with
tumorigenesis of various types of cancers (left panel, Fig. 1B). The relative expression changes
were significantly different between normal and tumor tissues and
the overall difference was also highly statistically significant
(P<0.001) (right panel, Fig.
1B). FISH data further validated our qPCR results indicating
the involvement of CCM2 isoforms during tumorigenesis.
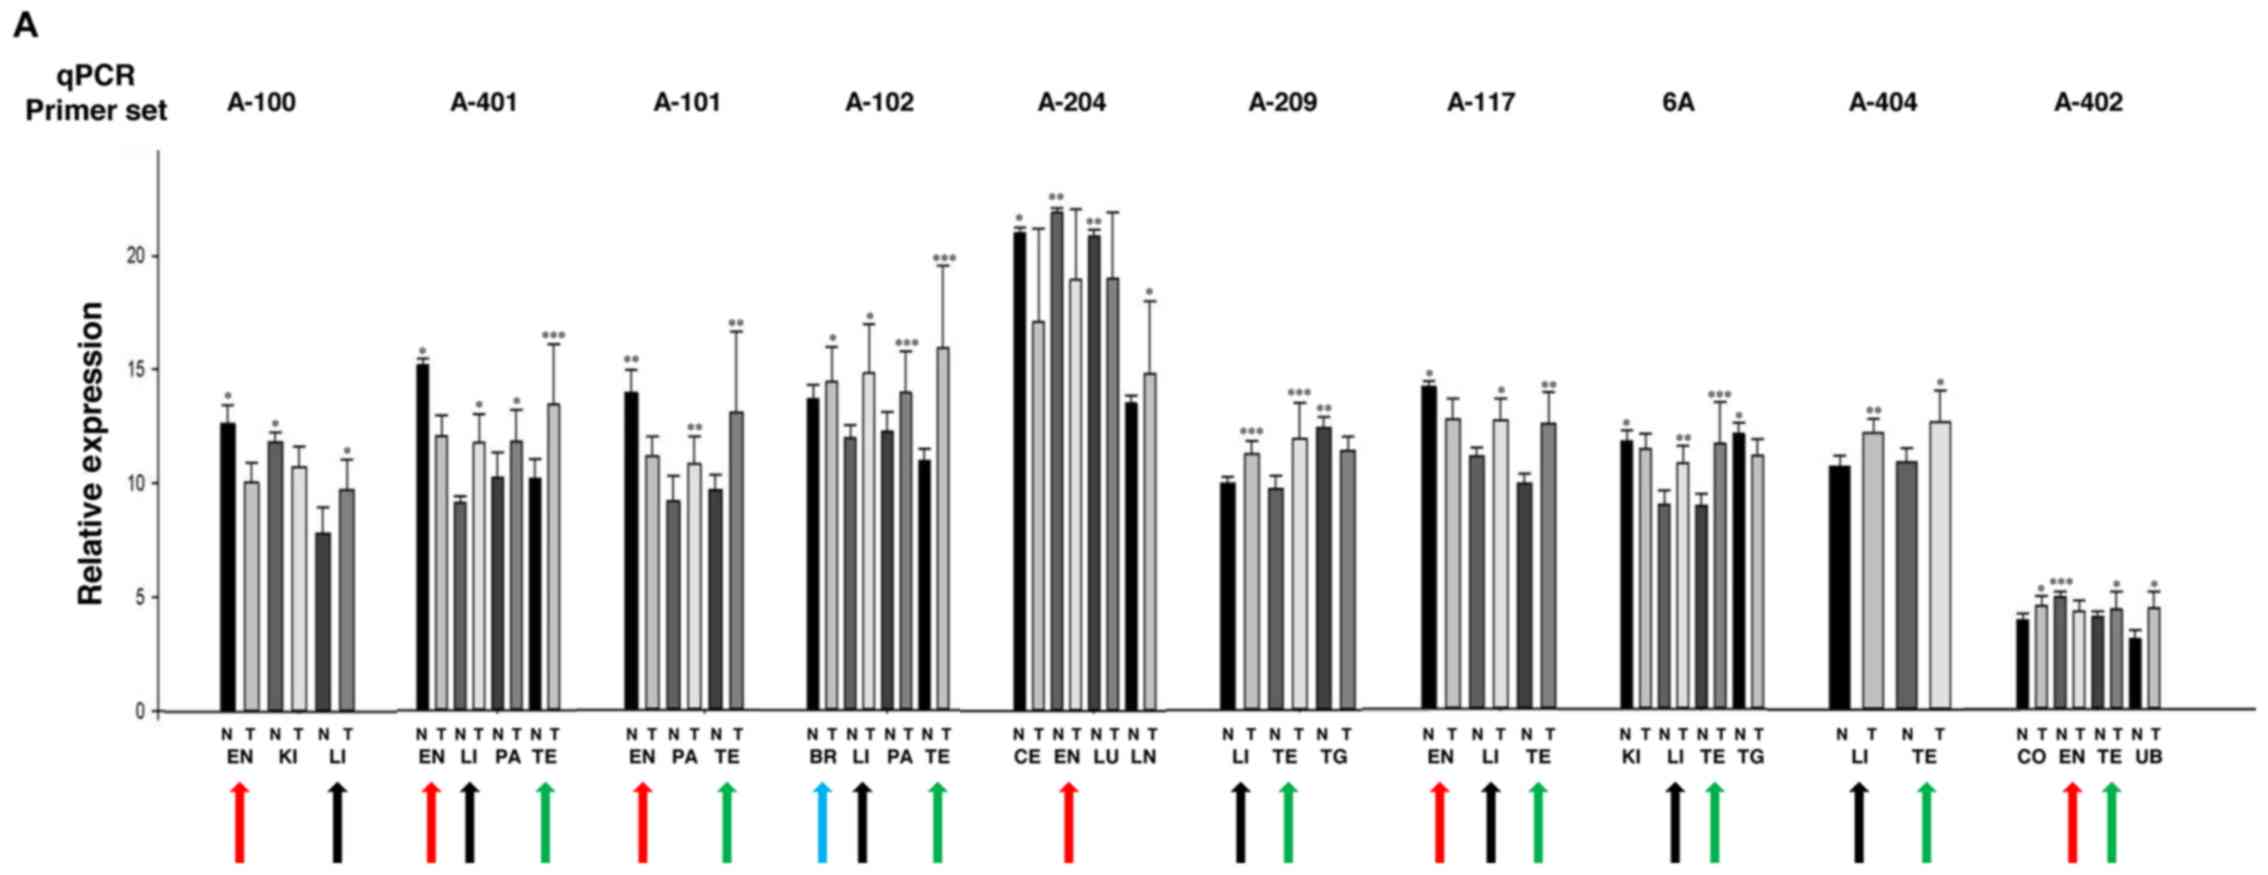 | Figure 1.Altered RNA expression of CCM2
isoforms in major types of cancer. (A) Relative RNA expression
levels of endogenous CCM2 isoforms in tumor tissues as measured by
qPCR are presented as bar plots where the dark bars represent
normal tissues (N) and light bars represent tumor tissues (T),
among each tissue pair. Endometrium (EN) (red arrow), breast (BR)
(blue arrow), testis (TE) (green arrow), and liver (LI) (black
arrow) were observed as the most common tumor tissues with altered
RNA expression among the CCM2 isoforms. Other tumor tissues tested
included kidney (KI), pancreas (PA), cervix (CE), lung (LU), colon
(CO), lymph node (LN), thyroid gland (TG) and urinary bladder (UB).
The relative expression levels of endogenous CCM2 isoforms
(2−ΔCt) were calculated for each tissue pair.
(***P≤0.001, **P≤0.01 and *P≤0.05, respectively, for paired t-test,
n=3). (B) Significant expression changes of the CCM2 isoform,
CCM2-212, in major tumor tissues. RNA expression changes of CCM2
isoform, CCM2-212, in certain tumor tissues were defined by RNA
fluorescence in situ hybridization (RNA-FISH). Adjacent
serial sections of normal (N) and tumor tissues (T) were hybridized
with antisense probes from the CCM2-212 isoform. Five paired
normal-tumor tissue panels, ovary (OV), breast (BR), skin (SK),
liver (LI) and skeletal muscle (SM), demonstrated significant
antisense FISH staining with the CCM2-212 isoform (left panel). The
visual differences were further validated with quantitative
comparison between normal and tumor tissues. The staining
differences in the CCM2-212 isoform were quantified by
densitometry, measured as mean density and normalized with
background probe and adjacent normal tissues (right panel). One-way
ANOVA was also performed for the comparison between normal and
tumor tissues and it was found that there was a very significant
difference for the expression levels of the CCM2-212 isoform in
these five pairs of normal and tumor tissues (bars represent mean ±
SD, ***P≤0.001 for paired t-test, n=3). CCM2, cerebral cavernous
malformation 2. |
Screening the altered expression of
CCM2 protein among major cancers
To correlate our RNA expression profiling data of
the CCM2 gene in cancers, we next examined the protein
expression levels of total CCM2 protein in paired cancer-normal
tissue sections from 16 major tissues (triplicates with each cancer
tissue pair) utilizing immunohistochemistry (IHC) applications with
horseradish peroxidase (HRP), 3,3′-diaminobenzidine (DAB) detection
system. Based on the expression patterns of total CCM2 proteins, we
classified these cancers into three groups: i) CCM2 proteins were
uniformly expressed in both tumor and normal tissues, with no
difference detected between cancer and normal sections (Table I and Fig. 2A). ii) CCM2 proteins were uniformly
expressed in tumor and normal tissue pairs, but there were
significant differences in the CCM2 protein expression levels
between tumor and normal tissues. In this group, we identified
several cancers defined with significantly altered expression of
total CCM2 protein (Table I and
Fig. 2B-a-d). iii) CCM2 protein was
not uniformly expressed in tumor and normal tissue pairs, in which
tumor samples usually had larger than usual variation
(statistically larger standard deviations, SD) leading to no
significant expression differences between tumor and normal
tissues, classified here as a heterogeneous nature in this group of
cancers (Table I and Fig. 2C-a-c).
 | Figure 2.Major human cancer is classified into
three classes based on their expression patterns of total CCM2
protein. The relative expression of total CCM2 protein in various
types of tumors (tumor) comparing to adjacent normal tissue
(normal) in the format of paired-tissue samples were examined.
Tumors derived from 16 different major human tissues were probed on
a single tumor array (BCN962a, Biomax) with the CCM2 antibody
utilizing immunohistochemistry (IHC) applications with horseradish
peroxidase (HRP), 3,3′-diaminobenzidine (DAB) detection system and
quantified with Elements Analysis software. The red/brown color
from HRP/DAB reactivity with the CCM2 antibody was quantified and
averaged between the red and green channel quantification and cell
nuclei were quantified with the blue channel. Data were normalized
against the respective internal controls using the blue channel for
cell nuclei and background staining. Relative densitometry and
relative expression of total CCM2 proteins are presented as bar
plots where the light bars represent normal tissues and dark bars
represent tumor tissues among each tissue pair. Three groups were
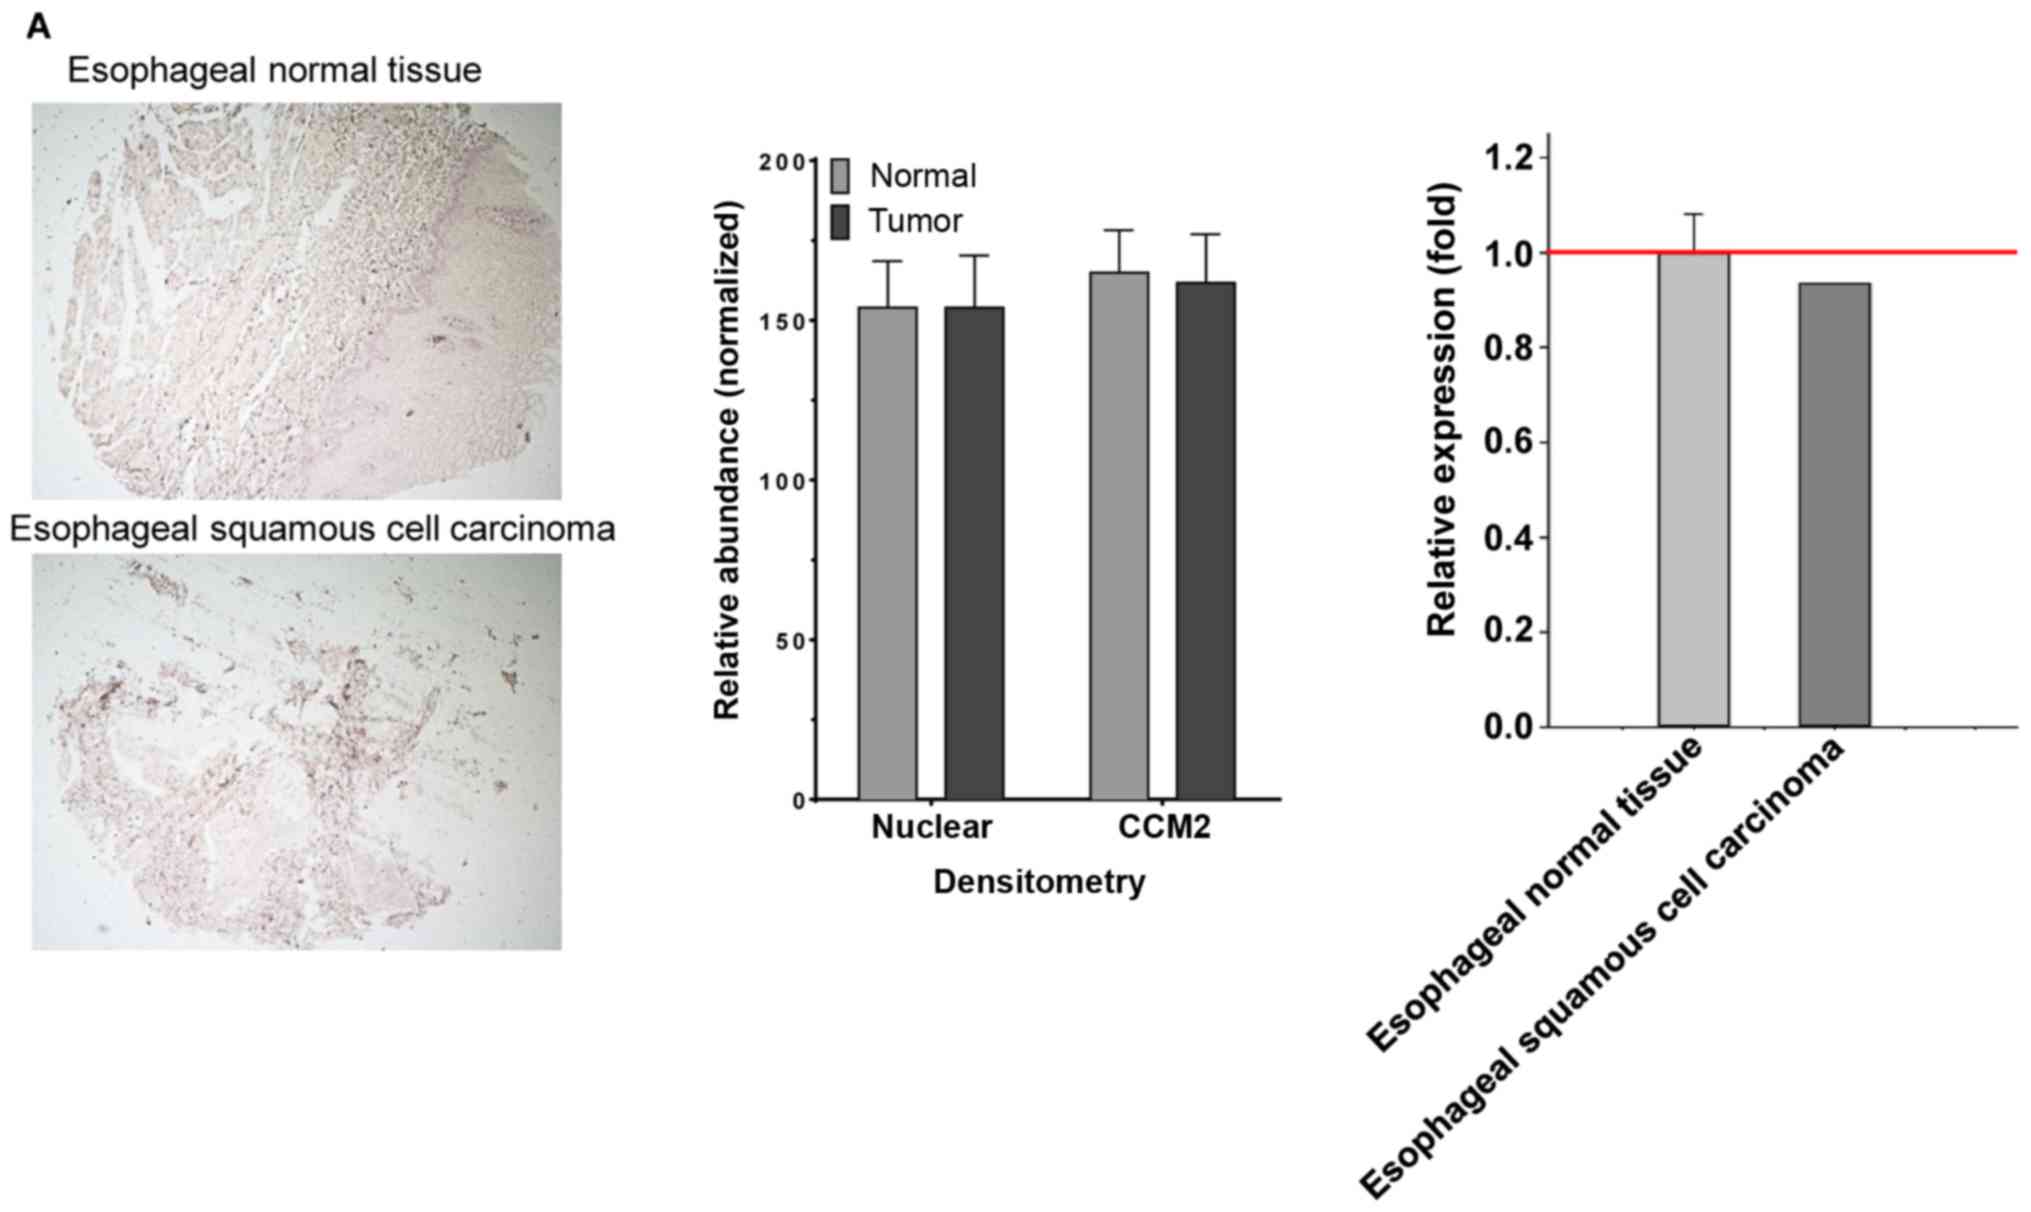
defined among these tumor-normal pairs (Table I). (A) The tissue-pair is uniform,
and no statistical difference was found for CCM2 expression. In the
representative esophageal section, although there may be some
subtle morphological changes observed, no visual difference in the
relative intensity of CCM2 staining was identified between the
tumor (squamous cell carcinoma) and normal tissues in the
esophageal tissues-pair from DAB staining (left panel); no
statistical difference was found through the quantification of the
relative expression level of CCM2 for the representative pair (ROI,
normal=5,641, tumor=2,500) (middle panel), and no statistical
difference was found through the overall quantification of the
relative expression level of CCM2 between tumor (carcinoma) and
normal esophageal tissues (n=3) (right panel). (B) The tissue-pair
was uniform but with different expression levels of CCM2 protein.
In the representative sections from four locations, compared to
their adjacent normal control tissues, there were significant
visual decreases in the relative intensity of CCM2 staining in the
representative sections of (a) stomach adenocarcinoma (ROI,
normal=8,715, tumor=5,308) and (b) diffuse large B-cell lymphoma
(ROI, normal=15,168, tumor=7,605), while significant visual
increases in the relative intensity of CCM2 staining in the
representative sections of (c) cervical squamous cell carcinoma
(ROI, normal=8,674, tumor=8,672) and (d) breast invasive ductal
carcinoma (ROI, normal=9,739, tumor=5,913) were observed (middle
panels). (B) The tissue-pair was uniform but with different
expression levels of CCM2 protein. In the representative sections
from four locations, compared to their adjacent normal control
tissues, there were significant visual decreases in the relative
intensity of CCM2 staining in the representative sections of (a)
stomach adenocarcinoma (ROI, normal=8,715, tumor=5,308) and (b)
diffuse large B-cell lymphoma (ROI, normal=15,168, tumor=7,605),
while significant visual increases in the relative intensity of
CCM2 staining in the representative sections of (c) cervical
squamous cell carcinoma (ROI, normal=8,674, tumor=8,672) and (d)
breast invasive ductal carcinoma (ROI, normal=9,739, tumor=5,913)
were observed (middle panels). These significant differences were
confirmed through the quantification of the relative expression
levels of CCM2 between tumor and normal tissues (n=3) (right
panels) (***P≤0.001 for unpaired t-test depending on tissue sample
being quantified). (C) The tissue-pair is not uniform. Significant
variation was found among tissue-pairs. In the representative
sections from three locations, compared to their adjacent normal
control tissues, contradictive and significant increase and
decrease (upper and lower left panels) were simultaneously observed
in the relative intensity of CCM2 staining in either (a)
hepatocellular carcinoma (ROI in increased expression,
normal=13,782, tumor=5,765; ROI in decreased expression,
normal=9,961, tumor=9,555) (middle panels), (b) ovarian serous
papillary adenocarcinoma (ROI in increased expression,
normal=10,460, tumor=7,750; ROI in decreased expression,
normal=9,056, tumor=10,806) (middle panels) or (c) testicular
anaplasia seminoma (ROI in increased expression, normal=6,752,
tumor=10,288; ROI in decreased expression, normal=8,219,
tumor=8,503) (middle panels), which resulted in no differences
detected in the quantification of the relative expression level of
CCM2 between tumor and normal tissues (n=3,4) (right panels).
Automated quantification of regions of interest (ROI) intensities
of CCM2 protein was accomplished with Elements Analysis software.
Graph for the representative sections is determined by the
quantification obtained of the >2,500 observations (ROI). The
relative expression levels of endogenous CCM2 protein are presented
with bar plots which was normalized against normal tissue cell
nuclear staining among each tissue pair (middle panels) and further
normalized against normal tissue for the entire collection (right
panels). Red line on quantification graphs represents baseline for
the normalized control. CCM2, cerebral cavernous malformation 2;
ROI, regions of interest. |
 | Table I.Classification of the major human
cancers based on the expression level of the CCM2 protein. |
Table I.
Classification of the major human
cancers based on the expression level of the CCM2 protein.
| Group | Tumor type | N | Mean | SD | Uniform | P-value |
|---|
| A | Esophageal squamous
cell carcinoma |
|
|
| Y |
|
|
| Normal |
| 0.9998 | 0.0803 |
|
|
|
| Tumor | 3 | 0.9349 | 0.0004 |
|
|
|
| t-test |
|
|
|
| 0.1170 |
|
| Prostate
adenocarcinoma |
|
|
| Y |
|
|
| Normal | 3 | 1.0000 | 0.0004 |
|
|
|
| Tumor | 3 | 0.9510 | 0.0461 |
|
|
|
| t-test |
|
|
|
| 0.0694 |
| B | Stomach
adenocarcinoma |
|
|
| Y |
|
|
| Normal | 3 | 1.0000 | 0.0001 |
|
|
|
| Tumor | 3 | 0.8630 | 0.0570 |
|
|
|
| t-test |
|
|
|
| 0.0070b |
|
| Lung
adenocarcinoma |
|
|
| Y |
|
|
| Normal | 3 | 1.0000 | 0.0005 |
|
|
|
| Tumor | 3 | 1.0590 | 0.0353 |
|
|
|
| t-test |
|
|
|
| 0.0221a |
|
| Kidney clear cell
carcinoma |
|
|
| Y |
|
|
| Normal | 3 | 1.0000 | 0.0003 |
|
|
|
| Tumor | 3 | 0.9030 | 0.0736 |
|
|
|
| t-test |
|
|
|
| 0.0418a |
|
| Invasive ductal
carcinoma (breast) |
|
|
| Y |
|
|
| Normal | 3 | 0.9990 | 0.0002 |
|
|
|
| Tumor | 3 | 1.2060 | 0.0275 |
|
|
|
| t-test |
|
|
|
|
0.0001v |
|
| Cervical squamous
cell carcinoma |
|
|
| Y |
|
|
| Normal | 3 | 1.0000 | 0.0003 |
|
|
|
| Tumor | 3 | 1.1580 | 0.0981 |
|
|
|
| t-test |
|
|
|
| 0.0243a |
|
| Diffuse large
B-cell lymphoma |
|
|
| Y |
|
|
| Normal | 3 | 1.0000 | 0.0013 |
|
|
|
| Tumor | 3 | 0.8760 | 0.0521 |
|
|
|
| t-test |
|
|
|
|
0.0074v |
| C | Colon mucinous
adenocarcinoma |
|
|
| N |
|
|
| Normal | 3 | 0.9990 | 0.0003 |
|
|
|
| Tumor | 3 | 0.9460 | 0.2110 |
|
|
|
| t-test |
|
|
|
| 0.3400 |
|
| Hepatocellular
carcinoma |
|
|
| N |
|
|
| Normal | 3 | 1.0000 | 0.0002 |
|
|
|
| Tumor | 3 | 0.9180 | 0.1780 |
|
|
|
| t-test |
|
|
|
| 0.2350 |
|
| Ovarian serous
papillary adenocarcinoma |
|
|
| N |
|
|
| Normal | 3 | 1.0000 | 0.0016 |
|
|
|
| Tumor | 3 | 1.0250 | 0.1050 |
|
|
|
| t-test |
|
|
|
| 0.3470 |
|
| Urothelial
carcinoma |
|
|
| N |
|
|
| Normal | 3 | 1.0000 | 0.0002 |
|
|
|
| Tumor | 3 | 1.1410 | 0.1380 |
|
|
|
| t-test |
|
|
|
| 0.0756 |
|
| Squamous cell
carcinoma (skin) |
|
|
| N |
|
|
| Normal | 3 | 1.0000 | 0.0003 |
|
|
|
| Tumor | 3 | 1.1930 | 0.1820 |
|
|
|
| t-test |
|
|
|
| 0.0694 |
|
| Pancreatic
adenocarcinoma |
|
|
| N |
|
|
| Normal | 3 | 1.0000 | 0.0005 |
|
|
|
| Tumor | 3 | 0.8960 | 0.1330 |
|
|
|
| t-test |
|
|
|
| 0.1240 |
|
| Testicular
anaplasia seminoma |
|
|
| N |
|
|
| Normal | 4 | 1.0010 | 0.0024 |
|
|
|
| Tumor | 4 | 1.0190 | 0.1060 |
|
|
|
| t-test |
|
|
|
| 0.3700 |
Validation of the identified cancers
with altered expression of CCM2 protein
To duplicate these findings (Table I and Fig. 2), we further investigated four major
cancer tissue-pairs using different tissue panels with a much
larger sample size (n≥10); one from group B (Table I, endometrium) and two from group C
(Table I, testes and liver) with
possible heterogeneous nature. No obvious differences were observed
in testis paired-tumor tissues, which is represented by the section
(left panel) and primary quantification of the specific tumor-pair
(middle panel) and overall quantification of the entire collection
(right panel) (Fig. 3A). This
result may eliminate the possible involvement of CCM2 in the testes
during tumorigenesis. In agreement with our preliminary data
(Table I and Fig. 2Bc), significant increases in total
CCM2 protein were consistently observed in endometrial tumors,
which is represented by sections (left panel) and primary
quantification of the specific tumor-pair (middle panel) and
overall quantification of the entire collection (right panel)
(Fig. 3B). Notably, our preliminary
data showed two contradicting expression patterns of CCM2 proteins
in liver tumors (Table I and
Fig. 2C-a), suggesting the
heterogeneity of liver tumors. The larger cohort of liver cancer
screening indicated that statistically significant increases in
total CCM2 protein were predominately observed in liver tumors,
which is represented by the section (left panel) and primary
quantification of the specific tumor-pair (middle panel) and
overall quantification of the entire collection (right panel)
(Fig. 3C).
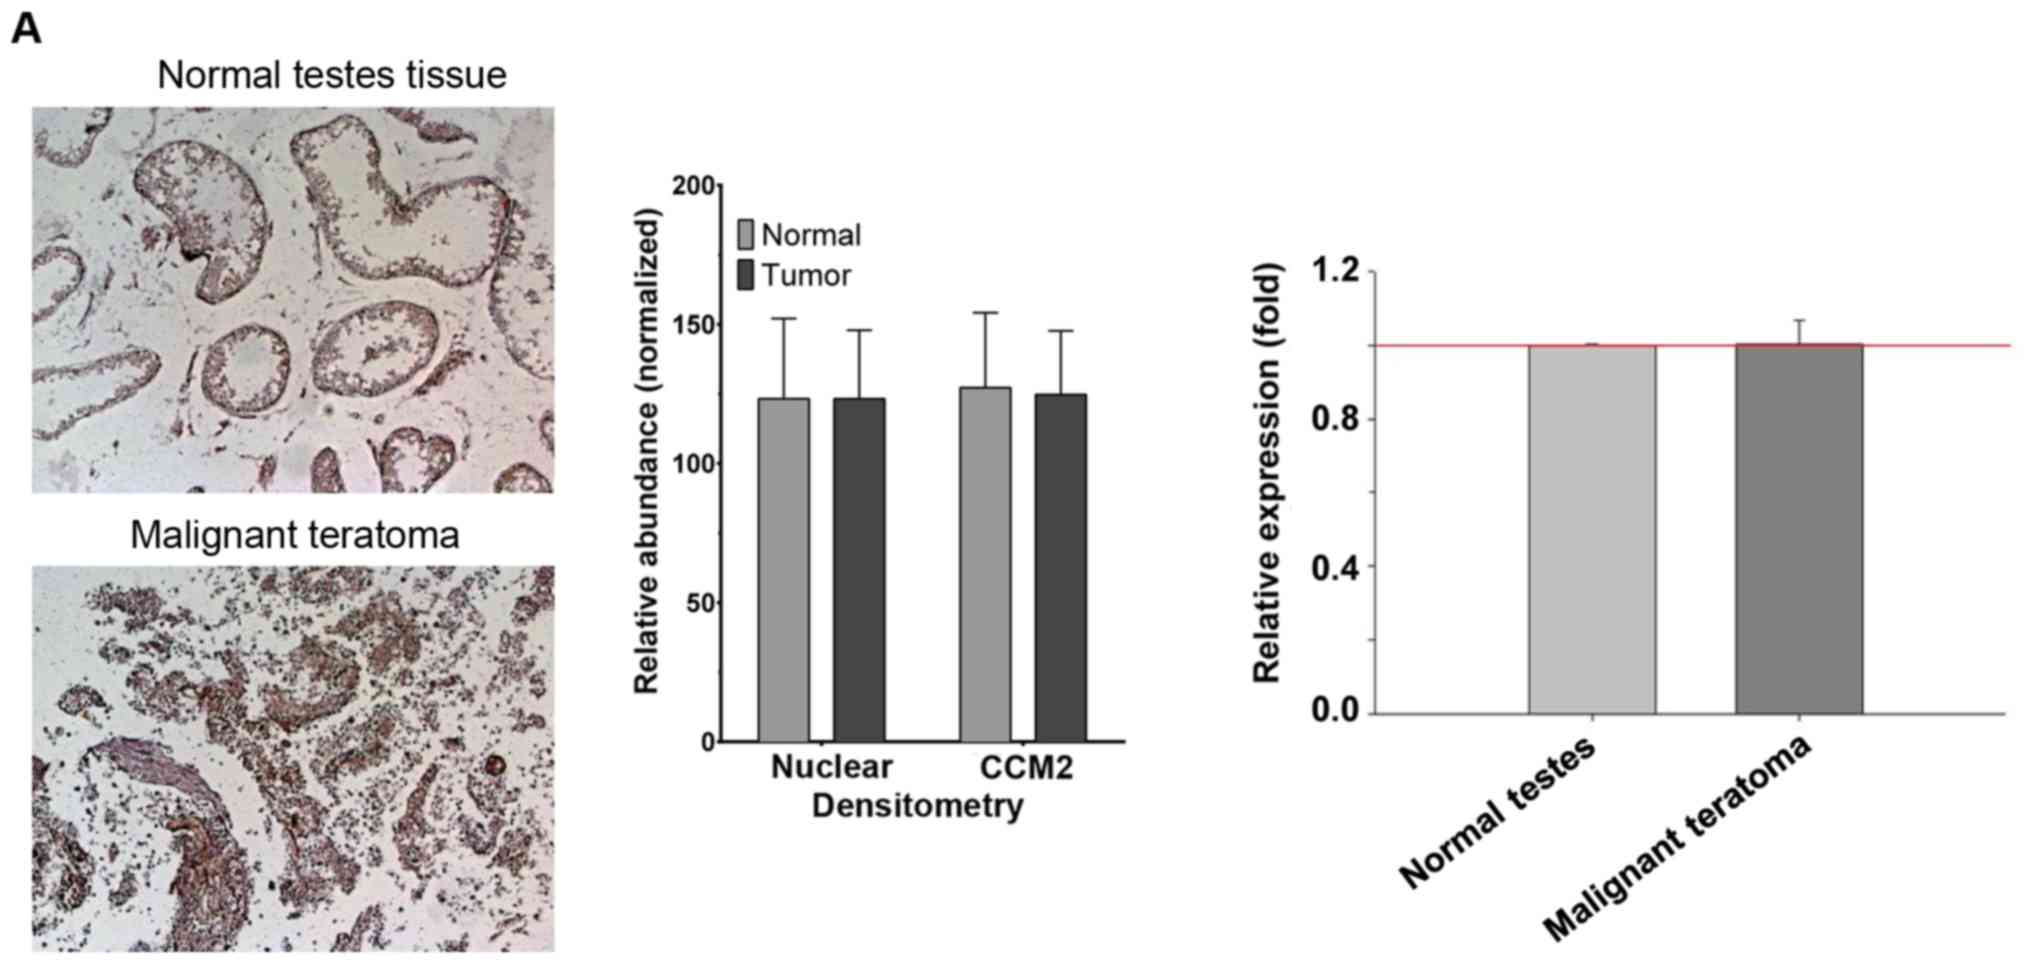 | Figure 3.Altered expression of CCM2 protein
associated with major human cancers. Additional paired-tissue
samples, selected from testis, endometrium and liver, were acquired
from different sources and vendors and further examined for
comparative CCM2 protein expression with the CCM2 antibody
utilizing immunohistochemistry (IHC) applications with horseradish
peroxidase (HRP), 3,3′-diaminobenzidine (DAB) detection system and
quantified with Elements Analysis software. The red/brown color
from HRP/DAB reactivity with the CCM2 antibody was quantified and
averaged between the red and green channel quantification and cell
nuclei were quantified with the blue channel. Data were normalized
against the respective internal controls using the blue channel for
cell nuclei and background staining. Relative densitometry and
relative expression of total CCM2 proteins are presented with bar
plots where the light bars represent normal tissues (normal) and
dark bars represent tumor tissues (tumor), among each tissue pair.
(A) In testis paired-tissues, no statistical difference in the
relative expression level of CCM2 between tumor (teratoma) and
normal testis tissue for this pair was observed as shown in one
selected tissue-pair (left panel) further confirmed with the
quantification data (ROI, tumor=9,444; normal=16,306) (middle
panel). The entire collection of paired samples was summarized as
having no statistical difference (n=14, ROI
range=7,362-18,137/sample) (right panel). (B) In the endometrial
paired-tissues, a distinguishable difference in the relative
intensity of CCM2 staining between tumor (endometrial
adenocarcinoma) and normal endometrial tissues is presented by a
selected tissue-pair (left panel), and the quantification of the
relative expression level of CCM2 between the tumor
(adenocarcinoma) and normal endometrial tissue for this pair showed
marked differences (ROI, tumor=12,643; normal=12,114) (middle
panel). Statistically significant increase in CCM2 proteins in the
endometrial tumor were found from the entire collection of paired
samples (n=12, ROI range=9,384-14,425/sample) (right panel)
(***P≤0.001, for unpaired t-test). (C) In liver paired-tissues, a
marked difference in the relative intensity of CCM2 staining
between tumor (hepatocellular carcinoma) and normal liver tissues
was visualized by a selected tissue-pair (left panel), and the
quantification of the relative expression level of CCM2 between
tumor (carcinoma) and normal liver tissue for this pair showed
marked differences (ROI, tumor=11,078; normal=7,059, middle panel).
Statistically significant increase of CCM2 proteins in liver tumor
were found from the entire collection of paired samples (n=10, ROI
range=3920-13319/sample) (right panel). The relative expression
levels of endogenous CCM2 protein are presented with bar plots
which was normalized against normal tissue cell nuclear staining
among each tissue pair (middle panels) and further normalized
against normal tissue for the entire collection (right panels)
(***P≤0.001, for unpaired t-test). Red line on the quantification
graphs represents baseline for the normalized control. CCM2,
cerebral cavernous malformation 2; ROI, regions of interest. |
Evaluation of the co-expression levels
of CCM1 and CCM3 proteins among the identified cancers associated
with altered CCM2 expression
To further elucidate the coordinated relationship
among the three CCM proteins within the CSC complex in
tumorigenesis, we next examined the protein co-expression levels of
CCM1 and CCM3 proteins in identified human cancers associated with
altered CCM2 expression. Using endometrial tumor tissues consisting
of three different stages of endometrial tumor (adenocarcinoma, T),
grade 1 (T G1), grade 2 (T G2), grade 3 (T G3), and normal tissue
(N), we examined the protein expression levels of CCM1 and CCM3
using multicolor immunofluorescence (IF) imaging among these stages
of cancers. The coordinated increase in both CCM1 and CCM3 proteins
were found in the different stages of endometrial tumor
(adenocarcinoma, T), compared to normal tissue (N) with significant
differences and peak expression of CCM1 and CCM3 in grade 2 and
grade 3 respectively (Fig. 4A-a and
-b). The general consent is that the increased protein levels
of CCM1 and CCM3 are associated with increased clinical severity of
endometrial tumors, indicating a potential application of CCM
proteins as diagnostic and prognostic biomarkers for endometrial
cancers. Western blot analysis further validated our IF imaging
data; significantly increased protein levels of CCM1 and CCM3 were
found in the endometrial tumors (T) when compared to that noted in
the normal tissues (N) (Figs. 4A-c,
S2A and B).
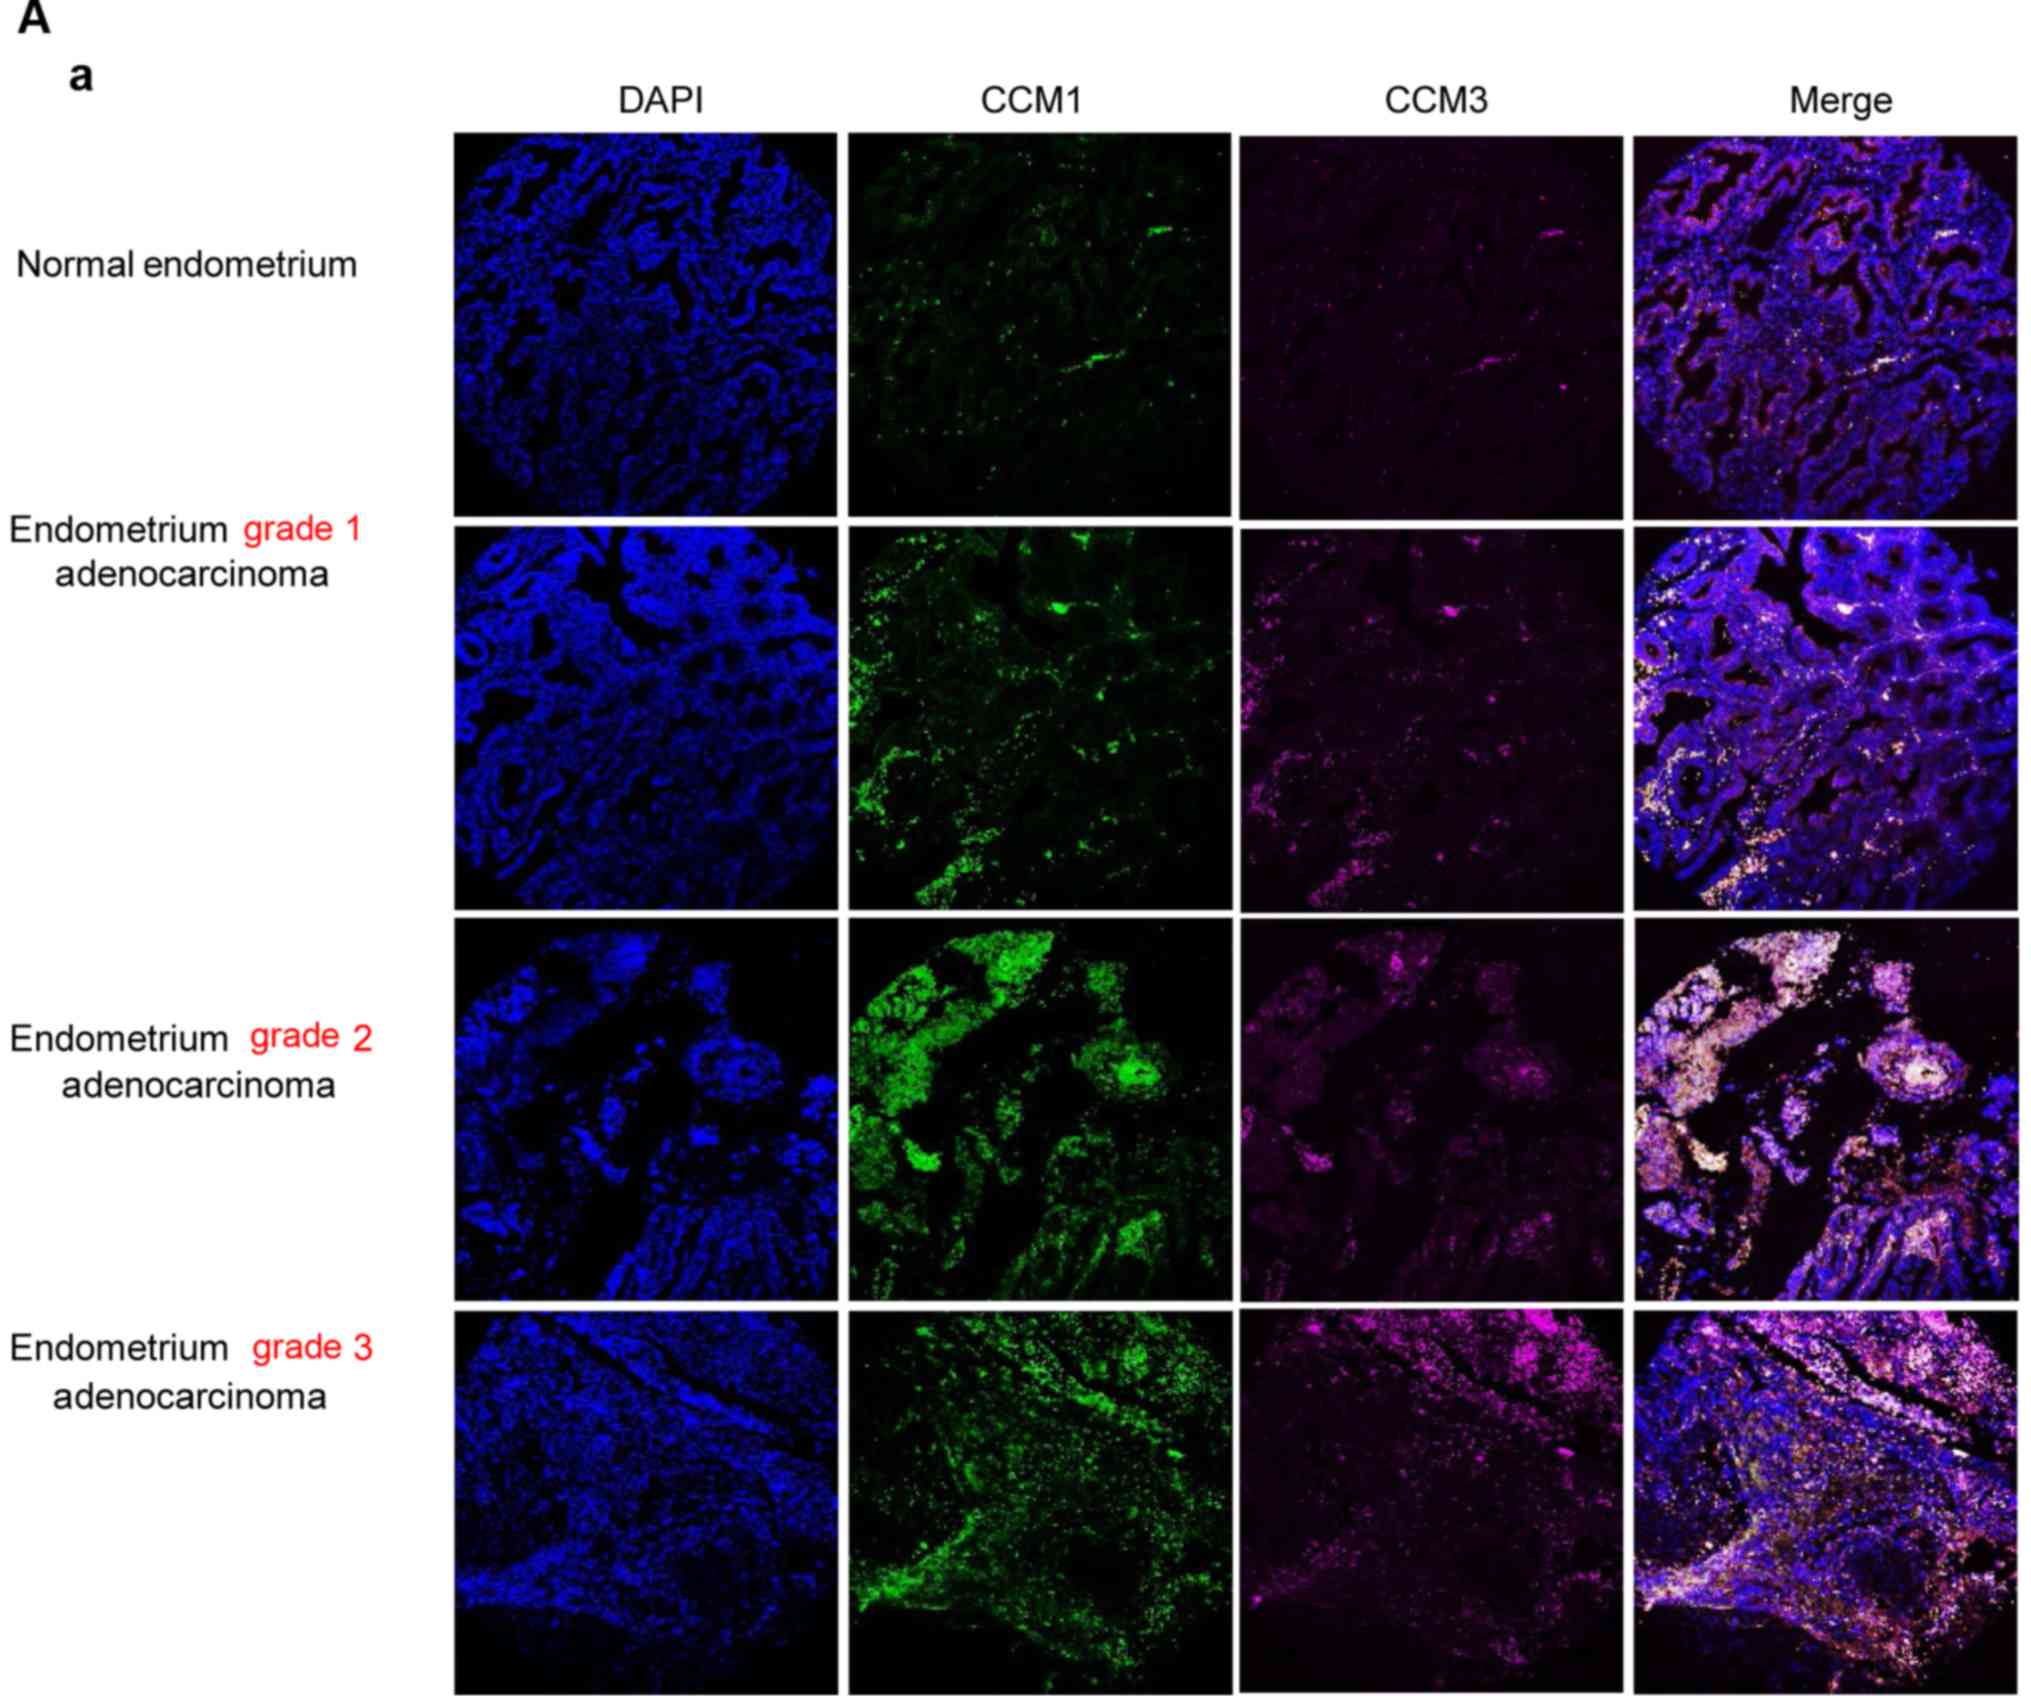 | Figure 4.Significantly altered expression of
CCM1 and CCM3 proteins in endometrial and liver cancers. The
comparative CCM1 and CCM3 protein expression pattern was measured
with immunofluorescence-labeled CCM1 and CCM3 antibodies,
normalized against nuclear staining (DAPI), and quantified with
Elements Analysis software. (A-a) The differential expression
levels of CCM1 and CCM3 proteins in three different stages of
endometrial tumor (adenocarcinoma, T), grade 1 (T G1), grade 2 (T
G2), and grade 3 (T G3), compared to normal tissue (N) from paired
endometrium samples, were visualized by multicolor
immunofluorescence imaging. The correlation between the expression
levels of CCM proteins and the specific stage of endometrial tumors
was demonstrated through automated quantification of ROI
intensities of CCM proteins and normalized against nuclear staining
(DAPI). (b) Significant differences were observed through the
quantification of the relative expression levels of CCM1 and CCM3
among the different stages of endometrial tumors (T, T G1, T G2,
and T G3), compared to normal tissue (N). (c) Western blot analysis
demonstrated increased expression levels of both CCM1 and CCM3
protein in endometrial (EN) tumor tissue (T) compared to normal
tissue (N). (B-a) Similarly, the differential expression levels of
CCM1 and CCM3 proteins in different liver condition stages during
tumorigenesis, hepatitis, cirrhosis and grade 1 stage 2 liver tumor
tissue, compared to normal liver tissue from paired liver samples
were visualized by multicolor immunofluorescence imaging. (b) The
correlation between the expression levels of CCM proteins and the
different liver conditions was demonstrated through automated
quantification of ROI intensities of CCM proteins and normalized
against nuclear staining (DAPI). The significant differences were
observed through the quantification of the relative expression
levels of CCM1 and CCM3 among different liver conditions
(hepatitis, cirrhosis, and T G1), compared to normal tissue (N).
(c) Western blot analysis demonstrated increased expression levels
of both CCM1 and CCM3 proteins in liver (LV) tumor (T) compared to
normal tissue (N). Automated quantification of ROI intensities of
CCM proteins in IF images was accomplished with Elements Analysis
software accompanying Nikon EclipseTi confocal microscope. The
graph is a representative quantification obtained of the three
different experiments among 97 paired samples. For statistical
analysis, ***P≤0.001, **P≤0.01 and *P≤0.05, respectively, for
unpaired t-test, ROI=5-148,256, depending on tissue sample and
fluorescence channel being quantified. The quantification of the
relative expression levels of CCM1 and CCM3 proteins in the western
blot analysis was measured through quantification of band
intensities of CCM1 and CCM3 proteins from four different
experiments and normalized against β-actin (ACTB). For statistical
analysis, ***P≤0.001 indicates the significant increase in CCM1 and
CCM3 proteins. Red line on the quantification graphs represents
baseline for the normalized control. CCM, cerebral cavernous
malformation; ROI, regions of interest. |
The expression levels of CCM1 and CCM3 proteins
among various liver conditions [hepatitis, cirrhosis, grade1 liver
tumor (T G1)], were also examined (Fig.
4B-a). Our IF imaging data indicated that altered expression
patterns of both CCM1 and CCM3 proteins were observed in the three
different stages of liver disease (Fig.
4B-a). However, the expression patterns of both CCM1 and CCM3
proteins were more complicated than that noted in endometrial
cancers. Increased expression levels of CCM3 proteins at the
earlier stages of liver tumorigenesis (cirrhosis and hepatitis)
were observed, while increased expression levels of CCM1 were seen
only in cirrhosis tissue. Interestingly, CCM1 and CCM3 were
significantly decreased in stage-1 liver tumors when compared to
that found in the normal tissue (Fig.
4B-b). These data suggest that expression patterns of both CCM1
and CCM3 proteins are very heterogeneous. Interestingly, western
blot analysis with protein lysates from different suppliers showed
significantly increased protein levels of both CCM1 and CCM3 in
liver tumors (T), compared to that in normal tissues (N) (Figs. 4B-c and S2A and B), validating the heterogeneous
nature of CCM1 and CCM3 expression in various liver conditions.
Confirmation of CCM protein-associated
cancers with a validated tumor marker
The progestin and adipoQ receptor 7 (PAQR7) has been
found to be highly expressed in mammalian reproductive tissues,
especially in female ovaries (28).
Evidence has shown that PAQR7 is abundantly expressed in ovarian
cancer cells (29), and altered
expression of PAQR7 has been observed in ovarian tumors at both the
messenger RNA and protein levels (30), making it a valuable candidate as a
positive control to examine gene expression levels in endometrial
tumors. Therefore, we firstly examined the protein expression
levels of PAQR7 in paired endometrial tumor (adenocarcinoma) (T)
and normal (N) tissues. In accordance with previous research
(30), significant increased
expression levels of PAQR7 protein were observed in endometrial
tumors (Fig. 5A, left panel). The
expression difference between endometrial tumors and normal
adjacent endometrium showed marked differences in both the
representative quantification of the specific tumor-pair (Fig. 5A, middle panel) and overall
quantification of the entire collection (Fig. 5A, right panel). However, the
significantly high variations noted among the entire collection
suggest the heterogeneity of endometrial tumors (Fig. 5A, right panel). To resolve this
issue, we further stratified this endometrial tumor collection into
two categories: grade 1 and grade 2–2/3. Upon this
reclassification, a significantly increased expression level of
PAQR7 protein was observed in grade 1 endometrial tumors, which is
represented by the tissue section (Fig.
5B, left panel) and both the representative quantification of
the specific tumor-tissue pair (Fig.
5B, middle panel) and overall quantification of the entire
grade 1 tumors (Fig. 5B, right
panel). Further significantly increased expression levels of PAQR7
protein were observed in grade 2–2/3 endometrial tumors, which is
represented by the tissue section (Fig.
5C, left panel) and both the representative quantification of
the specific tumor-tissue pair (Fig.
5C, middle panel) and overall quantification of this category
(Fig. 5C, right panel).
Interestingly, this increased expression pattern of PAQR7 protein
observed for grade 1 and 2–2/3 is somewhat in parallel to the
similar trend of the expression levels of CCM1 and CCM3 proteins
observed in endometrial cancers (Fig.
4A), suggesting a possible correlation of expression among CCM
proteins and PAQR7 in endometrial cancers. We then examined the
expression pattern of PAQR7 protein in liver tumors, revealing an
opposite trend of PAQR7 expression observed in endometrial cancers.
PAQR7 expression was markedly downregulated in the liver tumor
tissue, which is represented by the tissue section (Fig. 5D, left panel) and both the
representative quantification of the specific tumor-tissue pair
(Fig. 5D, middle panel) and overall
quantification of the entire collection (Fig. 5D, right panel).
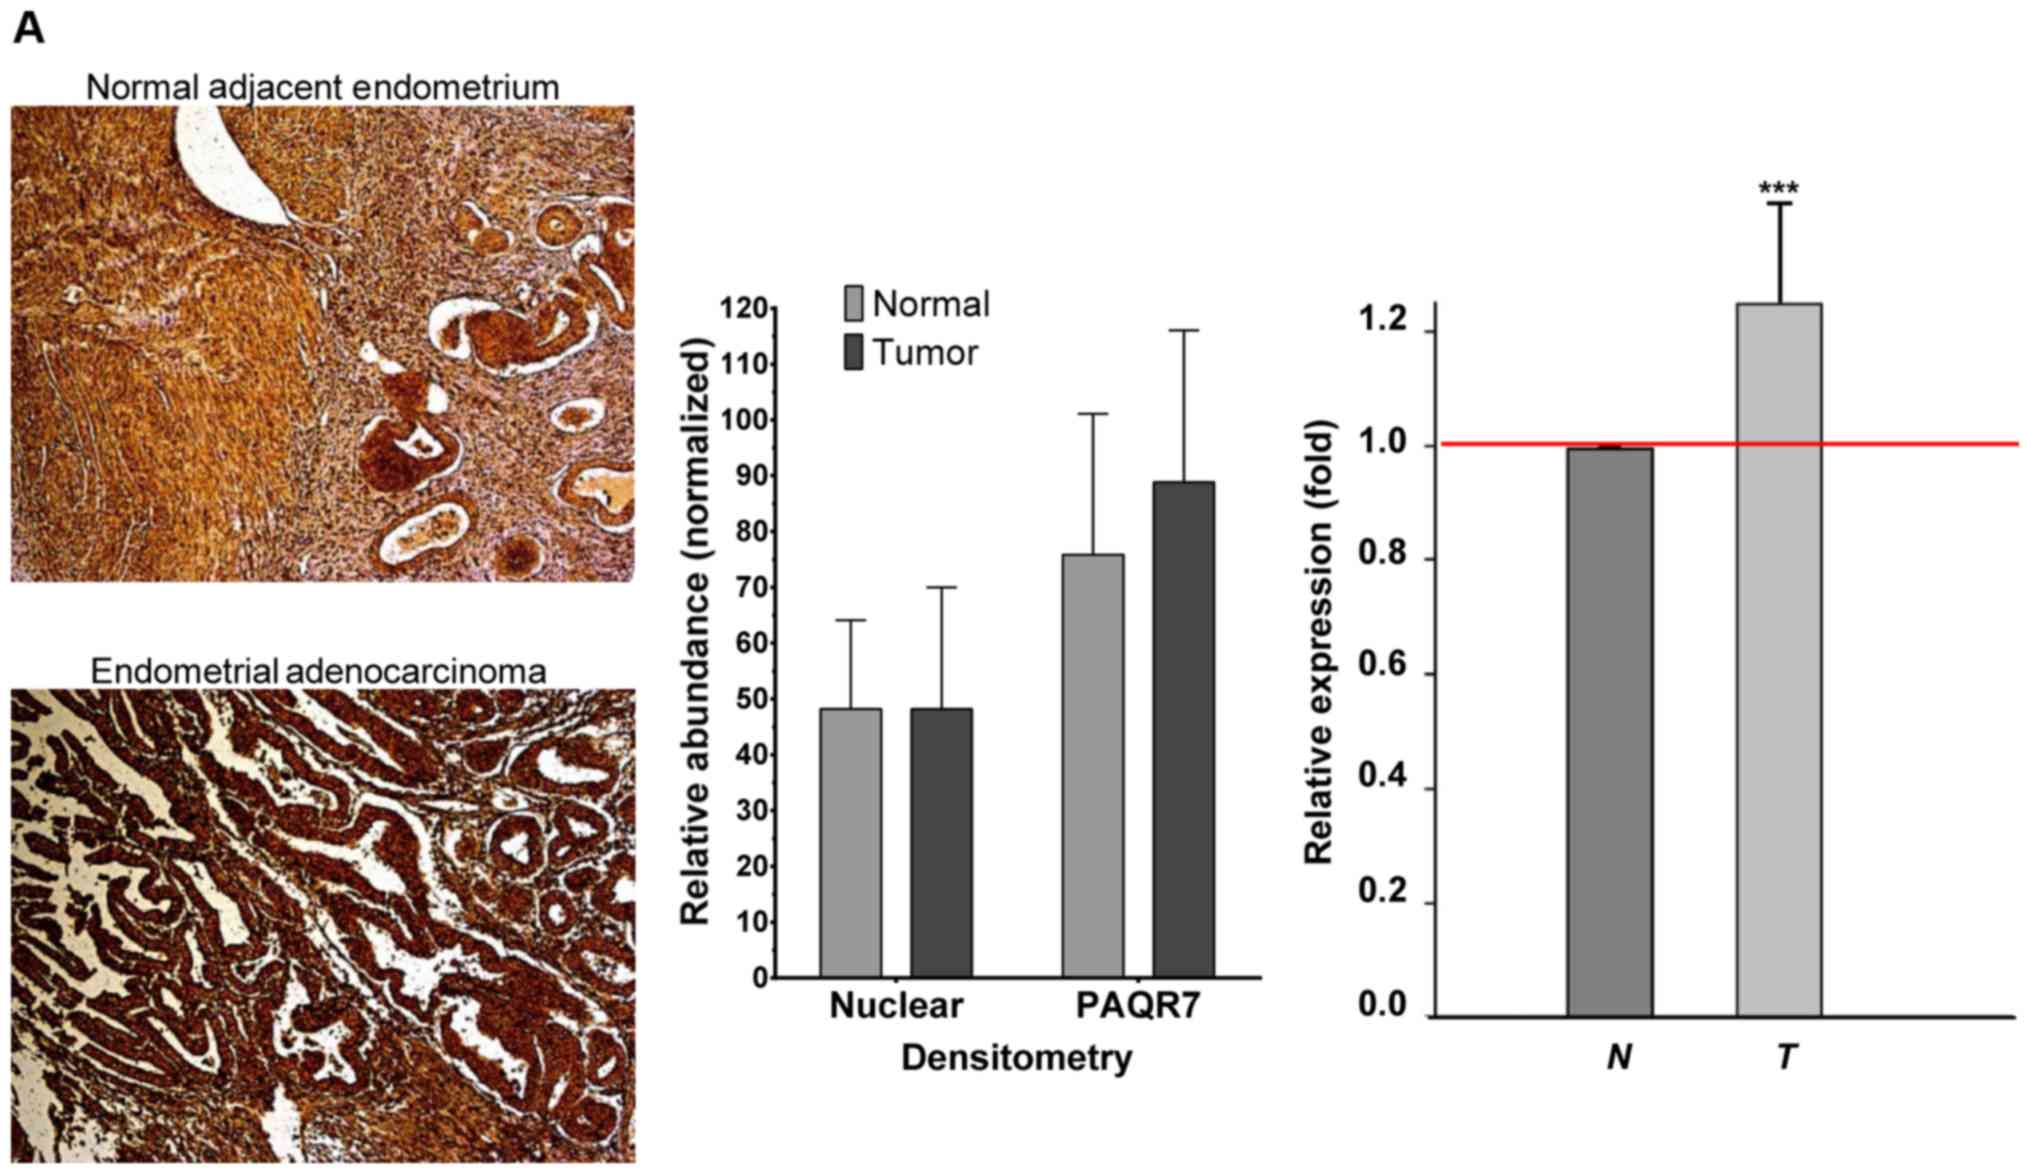 | Figure 5.Altered expression of PAQR7 protein
in endometrial and liver cancers. Additional paired-tissue samples
from both endometrium and liver were acquired and further examined
for comparative PAQR7 protein expression patterns with PAQR7
antibody utilizing immunohistochemistry (IHC) applications with
horseradish peroxidase (HRP), 3,3′-diaminobenzidine (DAB) detection
system and quantified with Elements Analysis software. The
red/brown color from HRP/DAB reactivity with the PAQR7 antibody was
quantified and averaged between the red and green channel
quantification and cell nuclei were quantified with the blue
channel. Data were normalized against the respective internal
controls using the blue channel for cell nuclei and background
staining. Relative densitometry and relative expression of total
PAQR7 proteins are presented with bar plots where the dark bars
represent normal tissues (N) and light bars represented tumor
tissues (T), among each tissue pair. (A) In the endometrial
paired-tissues, a distinguishable difference in the relative
intensity of PAQR7 staining between tumor (endometrial
adenocarcinoma) and normal endometrial tissues is presented from a
selected tissue-pair (left panel), and the quantification of the
relative expression level of PAQR7 for this tissue-pair showed
marked differences (ROI, tumor=50,451; normal=21,400) (middle
panel). Statistically significant increase in PAQR7 protein in
endometrial tumors was found from the entire collection of paired
samples (n=12, ROI range=12,305-77,227/sample) (right panel). (B)
Among the different grades of endometrial adenocarcinoma, a visual
enhancement in the relative intensity of PAQR7 staining in grade 1
endometrial adenocarcinoma is presented from a selected tissue-pair
(left panel), and the quantification of the relative expression
level of PAQR7 for this tissue-pair showed vast differences (ROI,
tumor=18,266; normal= 21,158) (middle panel). Statistically
significant increase in PAQR7 protein in the endometrial tumor was
found from the entire collection of grade 1 paired samples (n=6,
ROI range=12,305-77,227/sample) (right panel). (C) A significant
increase in the relative intensity of PAQR7 staining in grade 2–2/3
endometrial adenocarcinoma is presented in a selected tissue-pair
(left panel), and the quantification of the relative expression
level of PAQR7 for this tissue-pair showed major differences (ROI,
tumor=77,227; normal= 35,832) (middle panel). Statistically
significant increase in PAQR7 protein in the endometrial tumor was
found in the entire collection of grade 2–2/3 paired samples (n=4,
ROI range=29,095-77,227/sample) (right panel). (D) In liver
paired-tissues, the relative intensity of PAQR7 staining between
tumor (hepatocellular carcinoma) and normal liver tissues is
visualized in a selected tissue-pair (left panel), and the
quantification of the relative expression level of PAQR7 between
tumor (carcinoma) and normal liver tissue for this pair showed a
marked decrease (ROI, tumor=10,219; normal=16,166) (middle panel).
Statistically significant decrease in the PAQR7 protein in liver
tumor was found in the entire collection of paired samples (n=16,
ROI=10,219-16,166/sample) (right panel). All data from the entire
collections (n>10) were normalized by normal tissue among each
tissue pair (***P≤0.001 for unpaired t-test). Red line on the
quantification graphs represents baseline for the normalized
control. PAQR7, progestin and adipoQ receptor 7; ROI, regions of
interest. |
Consistently increased expression of
CCM2 protein in heterogeneous lymphoma
Although a quite homogenous expression pattern was
observed in diffuse large B-cell lymphoma (Table I and Fig. 2), generally, lymphomas are
collections of a heterogeneous group of tumors in lymph nodes
located in various tissues. We explored the expression pattern of
CCM2 proteins in a collective group of lymphomas from 43 tissue
sections at various body locations (Figs. 6 and S1A-D); notably, an apparent trend of
increased expression levels of CCM2 proteins were observed in
various lymphomas in the neck (Figs.
6A and S1C and groin (Fig. 6B), suggesting that CCM2 potentially
is a novel biomarker across various lymphomas in the neck and
groin.
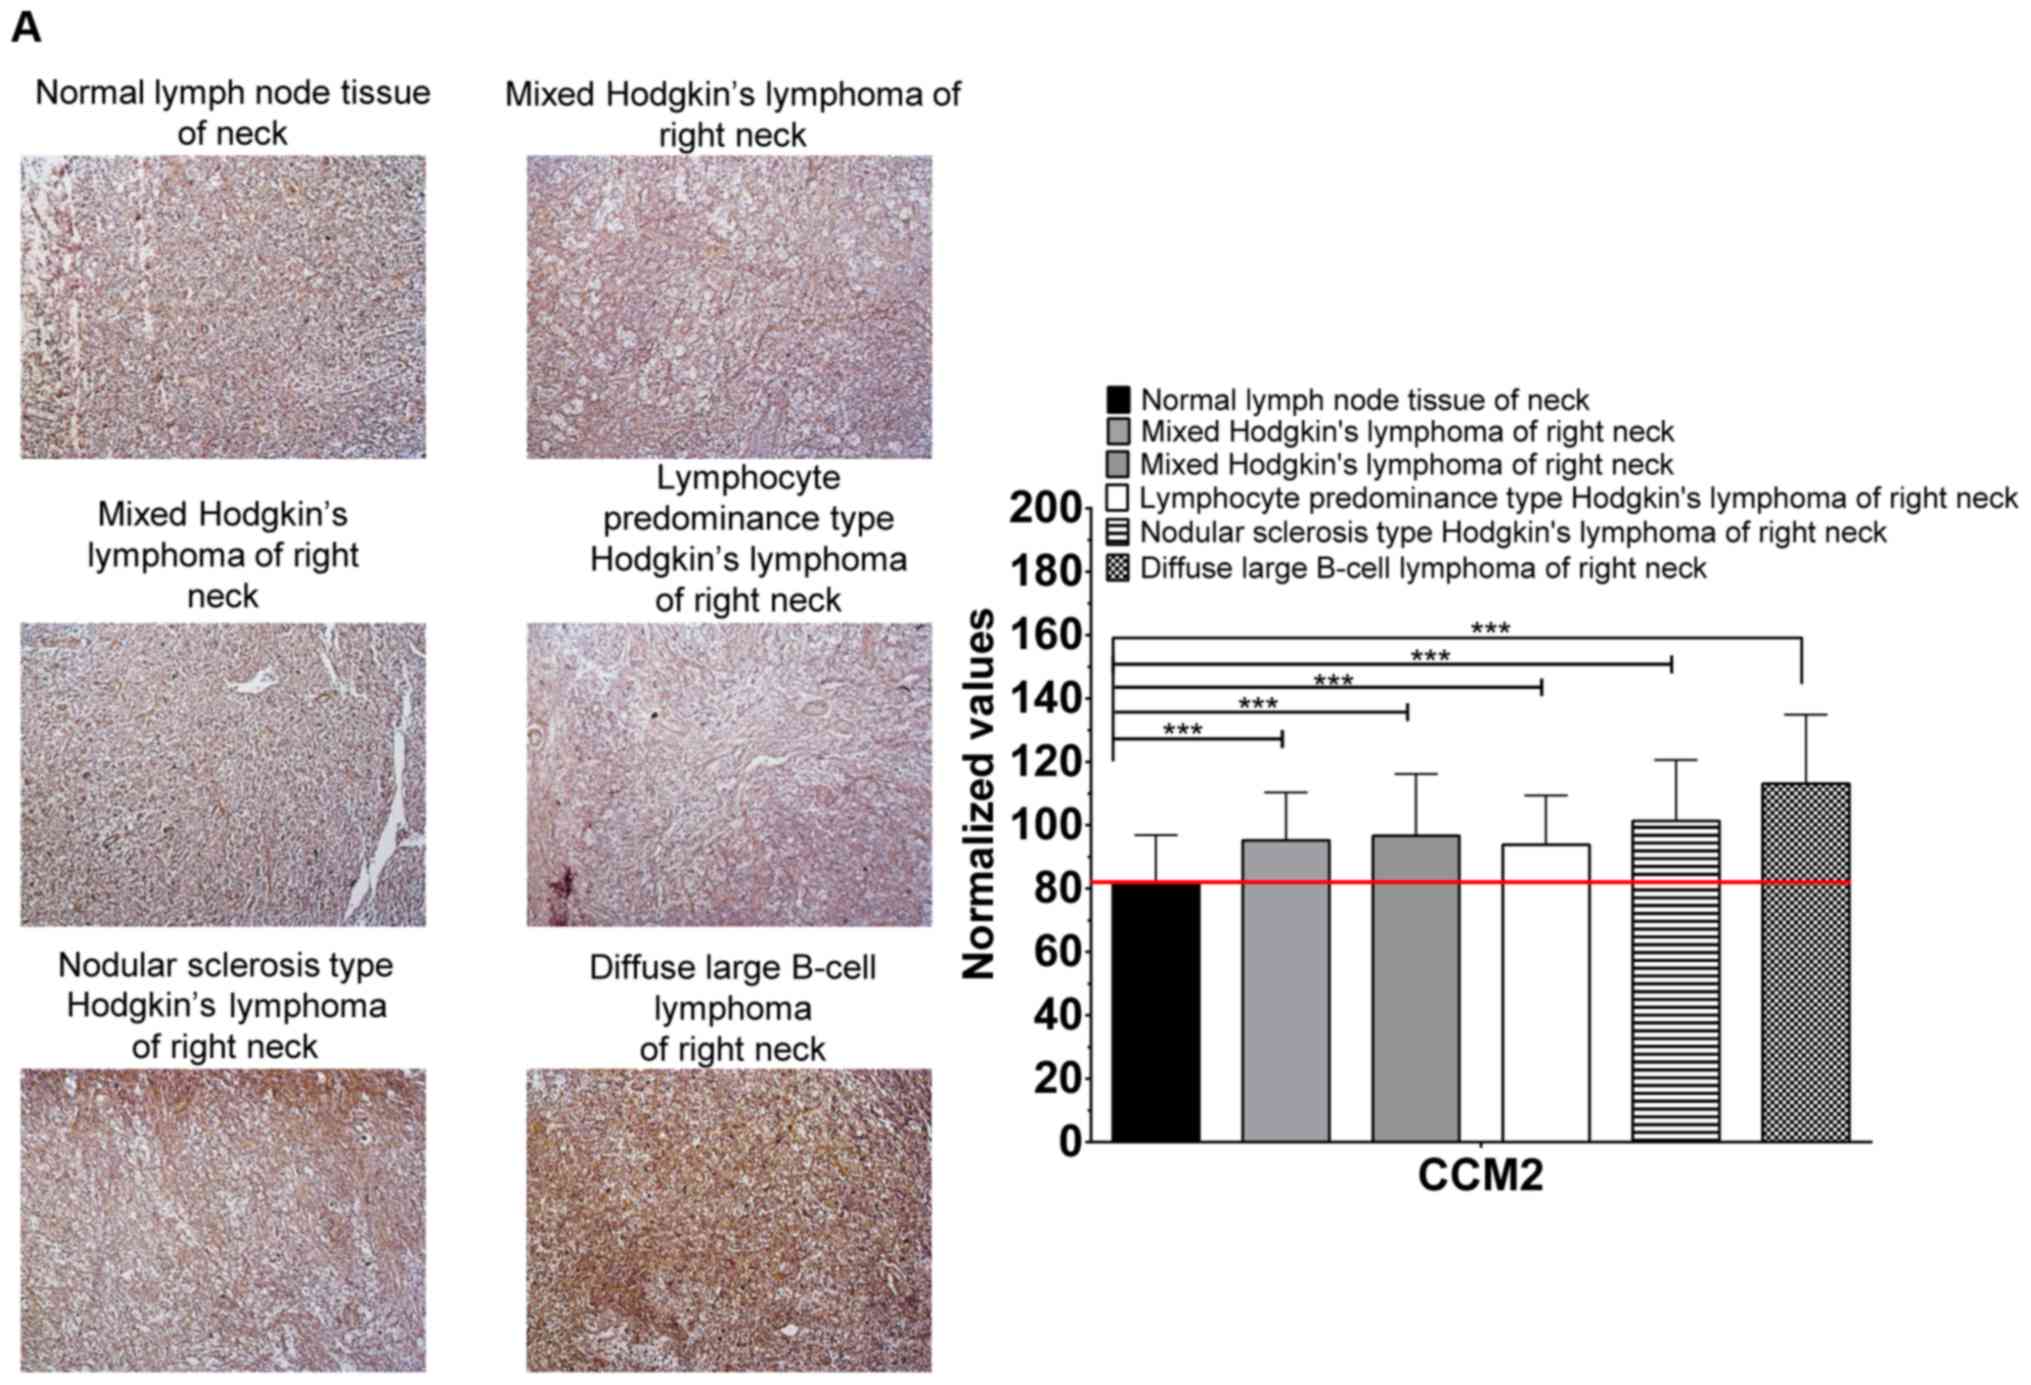 | Figure 6.Significantly increased protein
expression of CCM2 in heterogeneous lymphatic cancers. The
significantly increased expression of CCM2 protein in tumor tissue
(myeloma or lymphoma) (detailed in each panel), compared to
adjacent normal lymph node from tumor tissue sections, from the (A)
neck, (B) groin, (C) clavicle and sternum, (D) B-cell lymphoma of
various organs and (E) T-cell lymphoma of various organs was
assessed utilizing immunohistochemistry (IHC) applications with
horseradish peroxidase (HRP), 3,3′-diaminobenzidine (DAB) detection
system and quantified with Elements Analysis software. The
significantly increased expression of CCM2 protein in tumor tissue
(myeloma or lymphoma) (detailed in each panel), compared to
adjacent normal lymph node from tumor tissue sections, from the (A)
neck, (B) groin, (C) clavicle and sternum, (D) B-cell lymphoma of
various organs and (E) T-cell lymphoma of various organs was
assessed utilizing immunohistochemistry (IHC) applications with
horseradish peroxidase (HRP), 3,3′-diaminobenzidine (DAB) detection
system and quantified with Elements Analysis software. (F)
Collectively, all lymphomas were quantified demonstrating
statistically increased expression of CCM2 among various lymphomas.
(A) The visual difference in the relative intensity of CCM2
staining, among various lymphomas and normal lymph node in the neck
was observed with DAB staining (left panel); significant
differences were confirmed through the quantification of the
relative expression level of CCM2 between each lymphoma and normal
lymph node (right panel). (B) A significant difference in the
relative intensity of CCM2 staining was observed among various
lymphomas and normal lymph node in the groin (left panel); and
significant differences were observed through the quantification of
the relative expression level of CCM2 between each lymphoma and
normal lymph node (right panel). (C) Significant visual differences
in the relative intensity of CCM2 staining among plasma cell
myeloma and normal lymph node was observed in the clavicle and
sternum (left panel); and significant differences were determined
through the quantification of the relative expression level of CCM2
between each myeloma and normal lymph node (right panel). (D)
Significant differences in the relative intensity of CCM2 staining
among B-cell lymphomas and normal lymph node can be generalized in
various tissues (left panel); and significant differences were
assessed through the quantification of the relative expression
level of CCM2 between each lymphoma and normal lymph node (right
panel). (E) Significant visual differences in the relative
intensity of CCM2 staining among T-cell lymphomas, in the knee,
nasal cavity and mediastinum, and normal lymph node were observed
(left panel); and significant differences were confirmed through
the quantification of the relative expression level of CCM2 between
each T-cell lymphoma and normal lymph node (right panel). (F)
Statistically significant increases in CCM2 proteins were found
among almost all lymphomas examined and generalized with the entire
collection of lymphoma samples (n=43). The red/brown color from
HRP/DAB reactivity with the CCM2 antibody was quantified and
averaged between the red and green channel quantification and cell
nuclei were quantified with the blue channel. Data were normalized
against the respective control using the blue channel for cell
nuclei and background staining. Automated quantification of ROI
intensities of CCM2 proteins was accomplished with Elements
Analysis software. The graph is a representative quantification
obtained of the different experiments (***P≤0.001 for unpaired t-
test, ROI=6,443-16,587, depending on tissue sample). The red line
on the quantification graphs represents baseline for the normalized
control. CCM2, cerebral cavernous malformation 2. |
Expression patterns of CCM2 among plasma cell
myeloma in the clavicle, sternum, thoracic vertebrae and pubis
(Figs. 6C and S1A) also demonstrated increased
expression regardless of location. We also observed a similar trend
of increased CCM2 expression among plasma cell myeloma in various
ribs, while plasma cell myeloma of the third rib was the only
sample to display a slight decrease compared to normal tissue
(Fig. S1B). A similar trend of
increased CCM2 expression patterns was noted in diffuse large
B-cell lymphomas of various organs (Figs. 6D and S1C) and in follicular non-Hodgkin's
lymphoma in various locations (Fig.
S1D). Finally, we also observed a similar trend in CCM2
expression among diffuse T-cell lymphoma in the knee and nose,
while interestingly, a very slight decrease was observed for T-cell
lymphoma of the mediastinum, which was the only lymph cancer tissue
sample in this group to display a slight decrease in CCM2
expression (Fig. 6E, left and right
panels). In summary, upon combination of the 43 tissue sections of
various lymphomas at various body locations (Figs. 6A-E and S1A-D), a pattern of increased expression
levels of CCM2 proteins were clearly demonstrated for various
lymphomas, even with the two samples that displayed decreased CCM2
expression (Fig. 6F), suggesting
CCM2 protein as a potential biomarker for lymphoma diagnostic and
prognostic applications. Further efforts will be made to elucidate
the underlying relationship and mechanisms among CCM1 and CCM3 to
further understand the role of the CSC during tumorigenesis.
Discussion
This is the first report to systematically examine
the altered expression patterns of cerebral cavernous malformation
(CCM) proteins in various human cancers and delineate certain
expression patterns of CCMs associated with specific cancer types
and the severity of certain cancers. Our results implicate the
future potential application of CCM proteins for clinical diagnosis
and prognosis. In oncology, biomarkers can be used for risk
assessment of treatment, prediction of response to treatment, drug
screening, determination of differential diagnosis and prognosis,
and monitoring of the progression of disease. For patients
diagnosed with a cancer, biomarkers can help determine the
likelihood of disease recurrence independent of treatment,
suggesting the use of biomarkers as one of the most valuable tools
for cancer therapy.
Our recent research demonstrated the existence of
multiple isoforms of the CCM2 protein, further indicating the
complexity of the CCM signaling complex (CSC) (11). However, we found that almost all
expressed CCM2 isoforms are ubiquitously expressed in various cells
and tissues, indicating their potential involvement in diverse
cellular events during biogenesis. Furthermore, our findings that
CCM2 isoforms were differentially expressed among various tissues
and cells, at both the transcriptional and translational levels,
suggest an important role of CCM2 in various cancers during
tumorigenesis, and widen our current view concerning the cellular
functions played by CCM2 (11).
CCM2 (isoform 100) has been suggested for its role as a possible
potent angiogenic factor (15) and
was observed to have increased RNA expression in liver cancer
tissues, while displaying the opposite trend in endometrial
cancers, suggesting various roles of this isoform in tumorigenesis.
This observation was further supported with altered expression of
another CCM2 isoform (CCM2-212) in various types of cancer. Despite
the heterogeneity among various lymphomas, a clear increased
expression of total CCM2 was observed for more than 43 lymphoma
samples from various locations and cancer subtypes. Based on our
findings, we propose that the differential expression pattern of
CCM2 has great potential in aiding the diagnosis of various types
of cancer.
Our data also suggest that expression patterns of
CCM1 and CCM3 can also be used to delineate various stages of
endometrial cancers and early stages of tumorigenesis in liver
cancers. To validate CCM1 and CCM3 as biomarker candidates, we were
able to demonstrate a parallel trend of increased expression of the
traditional endometrial cancer marker, PAQR7, with increasing
grades of endometrial cancer, but observed the opposite trend of
PAQR7 in liver cancers, suggesting multiple coordinated roles of
the CSC complex and PAQR7 across various cancers. In conclusion,
the tumor-specific CCM expression patterns, we defined in this
investigation, may have great potential clinical applications in
future cancer diagnosis and prognosis. This project also provides
new insights into the CSC-mediated signaling pathways in
tumorigenesis, which may revolutionize the current concepts of the
CSC-mediated signaling and molecular mechanisms of tumorigenesis,
leading to new therapeutic strategies.
Supplementary Material
Supporting Data
Acknowledgements
We wish to thank Kamran Falahati, Akhil Padarti,
Nancy Jiang, Khalid Shoukat, Deepak Muthyala, Shen Sheng, Ahmed
Badr, Junli Zhang, Amna Siddiqui, Saafan Malik, and Edna Lopez at
Texas Tech University Health Science Center El Paso (TTUHSCEP) for
their technical help during the experiments.
Funding
This research study was supported and funded by the
Coldwell Foundation and Texas Tech University Health Science Center
El Paso (TTUHSCEP) (JZ).
Availability of data and materials
The datasets used during the present study are
available from the corresponding author upon reasonable
request.
Authors' contributions
JZ, JAF, YQ, EMG and MS performed all of the
experiments. JZ and JAF analyzed the data; JZ. and JAF contributed
to draft materials and wrote the manuscript. All authors read and
approved the manuscript and agree to be accountable for all aspects
of the research in ensuring that the accuracy or integrity of any
part of the work are appropriately investigated and resolved.
Ethics approval and consent to
participate
All tissue slides were purchased and collected under
the highest ethical standards with the donor being informed
completely and with their consent. The vendors guarantee to follow
standard medical care and protect the donors' privacy. All human
tissues were collected under HIPPA approved protocols. All samples
were tested negative for HIV and hepatitis B or their counterparts
in animals, and approved for commercial product development. IRB
ethical approval was waived since IRB review is not required for
laboratory research on de-identified human cell lines or human
tissue obtained from commercial or governmental entities, as the
release of these samples to investigators does not meet the
regulatory definition of human subject research.
Patient consent for publication
Not applicable.
Competing interests
The authors declare that no competing interests
exist.
Glossary
Abbreviations
Abbreviations:
|
CCMs
|
cerebral cavernous malformations
|
|
CSC
|
CCM signaling complex
|
|
qPCR
|
real-time quantitative polymerase
chain reaction
|
|
RNA-FISH
|
RNA-fluorescence in situ
hybridization
|
|
HRP
|
horseradish peroxidase
|
|
DAB
|
3,3′-diaminobenzidine detection
system
|
|
IHC
|
immunohistochemistry
|
|
IF
|
immunofluorescence
|
|
ROI
|
regions of interest
|
|
GBM
|
glioblastoma
|
References
|
1
|
Zhang J, Clatterbuck RE, Rigamonti D,
Chang DD and Dietz HC: Novel insights regarding the pathogenesis of
cerebral cavernous malformation (CCM). Am J Hum Genet.
69:1782001.
|
|
2
|
Zhang J, Basu S, Rigamonti D, Dietz HC and
Clatterbuck RE: Krit1 modulates beta 1-integrin-mediated
endothelial cell proliferation. Neurosurgery. 63:571–578;
discussion 578. 2008. View Article : Google Scholar
|
|
3
|
Zhang J: Molecular biology of cerebral
cavernous malformation. Cavernous Malformations of the Nervous
System. Rigamonti D: Cambridge University Press; New York, NY: pp.
31–40. 2011, View Article : Google Scholar
|
|
4
|
Zhang J, Carr C and Badr A: The
cardiovascular triad of dysfunctional angiogenesis. Transl Stroke
Res. 2:339–345. 2011. View Article : Google Scholar :
|
|
5
|
Zhang J, Dubey P, Padarti A, Zhang A,
Patel R, Patel V, Cistola D and Badr A: Novel functions of CCM1
delimit the relationship of PTB/PH domains. Biochim Biophys Acta
Proteins Proteomics. 1865:1274–1286. 2017. View Article : Google Scholar
|
|
6
|
Padarti A and Zhang J: Recent advances in
cerebral cavernous malformation research. Vessel Plus. 2:212018.
View Article : Google Scholar :
|
|
7
|
Ma X, Zhao H, Shan J, Long F, Chen Y, Chen
Y, Zhang Y, Han X and Ma D: PDCD10 interacts with Ste20-related
kinase MST4 to promote cell growth and transformation via
modulation of the ERK pathway. Mol Biol Cell. 18:1965–1978. 2007.
View Article : Google Scholar :
|
|
8
|
Hilder TL, Malone MH, Bencharit S,
Colicelli J, Haystead TA, Johnson GL and Wu CC: Proteomic
identification of the cerebral cavernous malformation signaling
complex. J Proteome Res. 6:4343–4355. 2007. View Article : Google Scholar
|
|
9
|
Voss K, Stahl S, Schleider E, Ullrich S,
Nickel J, Mueller TD and Felbor U: CCM3 interacts with CCM2
indicating common pathogenesis for cerebral cavernous
malformations. Neurogenetics. 8:249–256. 2007. View Article : Google Scholar
|
|
10
|
Zhang J, Clatterbuck RE, Rigamonti D and
Dietz HC: Cloning of the murine Krit1 cDNA reveals novel mammalian
5′ coding exons. Genomics. 70:392–395. 2000. View Article : Google Scholar
|
|
11
|
Jiang X, Padarti A, Qu Y, Sheng S,
Abou-Fadel J, Badr A and Zhang J: Alternatively spliced isoforms
reveal a novel type of PTB domain in CCM2 protein. Sci Rep.
9:158082019. View Article : Google Scholar :
|
|
12
|
Orso F, Balzac F, Marino M, Lembo A, Retta
SF and Taverna D: miR-21 coordinates tumor growth and modulates
KRIT1 levels. Biochem Biophys Res Commun. 438:90–96. 2013.
View Article : Google Scholar :
|
|
13
|
Pan X, Wang ZX and Wang R: MicroRNA-21: A
novel therapeutic target in human cancer. Cancer Biol Ther.
10:1224–1232. 2010. View Article : Google Scholar
|
|
14
|
Glading AJ and Ginsberg MH: Rap1 and its
effector KRIT1/CCM1 regulate beta-catenin signaling. Dis Model
Mech. 3:73–83. 2010. View Article : Google Scholar
|
|
15
|
Chan AC, Li DY, Berg MJ and Whitehead KJ:
Recent insights into cerebral cavernous malformations: Animal
models of CCM and the human phenotype. FEBS J. 277:1076–1083. 2010.
View Article : Google Scholar :
|
|
16
|
Harel L, Costa B, Tcherpakov M, Zapatka M,
Oberthuer A, Hansford LM, Vojvodic M, Levy Z, Chen ZY, Lee FS, et
al: CCM2 mediates death signaling by the TrkA receptor tyrosine
kinase. Neuron. 63:585–591. 2009. View Article : Google Scholar
|
|
17
|
Gruber-Olipitz M and Segal RA: Live or let
die: CCM2 provides the link. Neuron. 63:559–560. 2009. View Article : Google Scholar
|
|
18
|
Lambertz N, El Hindy N,
Kreitschmann-Andermahr I, Stein KP, Dammann P, Oezkan N, Mueller O,
Sure U and Zhu Y: Downregulation of programmed cell death 10 is
associated with tumor cell proliferation, hyperangiogenesis and
peritumoral edema in human glioblastoma. BMC Cancer. 15:7592015.
View Article : Google Scholar :
|
|
19
|
Nickel AC, Wan XY, Saban DV, Weng YL,
Zhang S, Keyvani K, Sure U and Zhu Y: Loss of programmed cell death
10 activates tumor cells and leads to temozolomide-resistance in
glioblastoma. J Neurooncol. 141:31–41. 2019. View Article : Google Scholar
|
|
20
|
Zhu Y, Zhao K, Prinz A, Keyvani K,
Lambertz N, Kreitschmann-Andermahr I, Lei T and Sure U: Loss of
endothelial programmed cell death 10 activates glioblastoma cells
and promotes tumor growth. Neuro-oncol. 18:538–548. 2016.
View Article : Google Scholar
|
|
21
|
Fu X, Zhang W, Su Y, Lu L, Wang D and Wang
H: MicroRNA-103 suppresses tumor cell proliferation by targeting
PDCD10 in prostate cancer. Prostate. 76:543–551. 2016. View Article : Google Scholar
|
|
22
|
Geng L, Sun B, Gao B, Wang Z, Quan C, Wei
F and Fang XD: MicroRNA-103 promotes colorectal cancer by targeting
tumor suppressor DICER and PTEN. Int J Mol Sci. 15:8458–8472. 2014.
View Article : Google Scholar :
|
|
23
|
Xiong B, Lei X, Zhang L and Fu J: miR-103
regulates triple negative breast cancer cells migration and
invasion through targeting olfactomedin 4. Biomed Pharmacother.
89:1401–1408. 2017. View Article : Google Scholar
|
|
24
|
Kfir-Erenfeld S, Haggiag N, Biton M,
Stepensky P, Assayag-Asherie N and Yefenof E: miR-103 inhibits
proliferation and sensitizes hemopoietic tumor cells for
glucocorticoid-induced apoptosis. Oncotarget. 8:472–489. 2017.
View Article : Google Scholar
|
|
25
|
Garofalo M, Romano G, Di Leva G, Nuovo G,
Jeon YJ, Ngankeu A, Sun J, Lovat F, Alder H, Condorelli G, et al:
EGFR and MET receptor tyrosine kinase-altered microRNA expression
induces tumorigenesis and gefitinib resistance in lung cancers. Nat
Med. 18:74–82. 2011. View Article : Google Scholar :
|
|
26
|
Yang D, Wang JJ, Li JS and Xu QY: miR-103
functions as a tumor suppressor by directly targeting programmed
cell death 10 in NSCLC. Oncol Res. 26:519–528. 2018. View Article : Google Scholar
|
|
27
|
Livak KJ and Schmittgen TD: Analysis of
relative gene expression data using real-time quantitative PCR and
the 2(-Delta Delta C(T)) Method. Methods. 25:402–408. 2001.
View Article : Google Scholar
|
|
28
|
Dressing GE, Goldberg JE, Charles NJ,
Schwertfeger KL and Lange CA: Membrane progesterone receptor
expression in mammalian tissues: A review of regulation and
physiological implications. Steroids. 76:11–17. 2011. View Article : Google Scholar
|
|
29
|
Charles NJ, Thomas P and Lange CA:
Expression of membrane progesterone receptors (mPR/PAQR) in ovarian
cancer cells: Implications for progesterone-induced signaling
events. Horm Cancer. 1:167–176. 2010. View Article : Google Scholar :
|
|
30
|
Romero-Sánchez M, Peiper SC, Evans B, Wang
Z, Catasús L, Ribe A, Prat J and Giri JG: Expression profile of
heptahelical putative membrane progesterone receptors in epithelial
ovarian tumors. Hum Pathol. 39:1026–1033. 2008. View Article : Google Scholar
|


