Introduction
Neuroblastoma (NB) is the most common extracranial
solid tumor of childhood, accounting for 8% of childhood cancers
and 15% of childhood cancer deaths. It arises from sympathoadrenal
precursors and generally occurs in the adrenal medulla or along the
sympathetic chain. NBs demonstrate clinical heterogeneity, from
spontaneous regression to relentless progression (1,2). We
and others have identified different patterns of genetic change
that underlie these disparate clinical behaviors (3,4), and
that receptor tyrosine kinase (RTK) expression likely contributes
to this (5,6). Several RTKs have been implicated in
the pathogenesis or clinical behavior of NBs including TRK genes,
ALK and RET. The TRK family of neurotrophin receptors plays
critical roles in the development and maintenance of the central
and peripheral nervous system (5).
Neurotrophic receptor tyrosine kinase 1 (NTRK1, also known as
TrkA), neurotrophic receptor tyrosine kinase 2 (NTRK2, also known
as TrkB) and neurotrophic receptor tyrosine kinase 3 (NTRK3, also
known as TrkC) are the cognate receptors for nerve growth factor
(NGF), brain-derived neurotrophic factor (BDNF) and neurotrophin-3
(NT3), respectively. TrkB also binds to NT4, and all three can be
activated by NT3. TrkA (and TrkC) are important for the development
of sensory and sympathetic neurons, whereas TrkB is important for
motoneuron development (7).
RET is an RTK that is expressed in many NB tumors
and tumor-derived cell lines (8–10). RET
is essential for the migration, growth, axon formation, and
differentiation of normal sympathetic neurons during development
(11–13). RET is one of few RTKs that requires
a co-receptor for ligand binding, rather than direct ligand binding
(14). Most studies of RET in NB
have not investigated co-receptor expression, or the correlation
between co-receptor expression and ligand-specific activation. The
four RET ligands are glial-cell line derived neurotrophic factor
(GDNF), neurturin (NRTN), artemin (ARTN), and persephin (PSPN).
They associate with GDNF co-receptors GFRα1-GFRα4, respectively. A
ligand homodimer must bind to a co-receptor (GFRα1-GFRα4) to induce
co-receptor homodimerization (15).
The ligand/co-receptor complex then recruits RET into lipid rafts,
leading to homodimerization and autophosphorylation of the RET
tyrosine kinase domain (11,16–18).
RET phosphorylation leads to the activation of
specific post-receptor signaling pathways. Of the 16 RET
autophosphorylation sites, the three most important for signaling
are Y905, Y1015 and Y1062 (11,17,18).
RET is further regulated by posttranslational modifications and
exists in the cell in three forms: Unglycosylated (~120 kDa),
partially glycosylated (~150 kDa)-present only at the endoplasmic
reticulum, and fully glycosylated (~170 kDa)-present on the cell
surface (11). Besides differences
in glycosylation, RET also exists as two main transcriptional
isoforms-RET9 and RET51-which have different signaling properties
(19,20).
RET is expressed in most NB tumors and cell lines,
although it has not been associated with patient outcome
(8-10,19,21-23). Thus far, no mutations or genomic alterations have
been identified leading to activation (or inactivation) of RET in
NB (22–25). Higher RET mRNA and protein
expression levels have been associated with differentiation of NB
cells (9,26–33),
but other studies have suggested that RET may play a role in
proliferation or metastasis in NBs (31,34–36).
The pattern of TRK family gene expression clearly contributes to
the survival, growth, and differentiation of NBs, and it has been
suggested that RET can cooperate with TrkA and B to cause neuronal
differentiation in response to ligands or to 13-cis retinoic acid
(37,38). However, the direct or indirect
interaction of RET with other receptors has not been fully
explored.
Here, the expression of the RET and its co-receptors
was investigated, as well as TRKs in a panel of NB cell lines and
the correlation of their responses to GDNF, NRTN, and ARTN with
GFRα1–3 expression, respectively, was investigated. It was also
demonstrated TRK activation by ARTN, and RET activation by NGF,
suggesting a physical association between RET and TrkA receptors.
Finally, the expression of RET, GFRs and TRKs in publicly available
databases of NB mRNA expression was examined, and significant
associations were validated in additional databases. The present
data provide insights into the complex interactions of these two
receptor pathways in neuroblastoma that may contribute to NB
pathogenesis or differentiation.
Materials and methods
Cell lines, culture conditions
All cell lines used in this study were maintained in
our lab or obtained from American Type Culture Collection. The NLF
line was first isolated at Washington University (St. Louis, MΟ,
USA) in the 1970s by Dr Milton Goldstein. Both TrkA and TrkB clones
were developed in Dr Brodeurs laboratory. Cell lines were grown in
RPMI-1640 medium containing 10% fetal bovine serum, 500 U/l
penicillin and 500 µg/l streptomycin, 2 mM L-glutamine and 25 mg/l
gentamicin (all from Gibco; Thermo Fisher Scientific, Inc.). Cells
were grown at 37°C in a humidified incubator with 95% air and 5%
CO2. TRK-null SH-SY5Y cells were stably transfected with
TrkA (SY5Y-TrkA, clone P23A) or TrkB (SY5Y-TrkB, clone BR6)
(39–52). Transfected cells were maintained in
media containing 0.3 mg/ml G418 sulfate (Corning Inc.). Other NB
lines used in this study were NBLS, NBEBc1 and NLF. Cells were
harvested using 0.2% tetrasodium EDTA in phosphate buffered saline.
We tested these cell lines for endotoxins, mycoplasma, bacterial
and viral contamination, as well as genetic identity validation by
multiplex PCR techniques. These tests are performed annually at our
facility.
Prior to treatment with ligand or drug, cells were
serum-starved in RPMI-1640 with 1% fetal bovine serum (Life
Technologies; Thermo Fisher Scientific, Inc.) to minimize serum
factor signaling. Cells were treated with lestaurtinib (CEP-701,
Cephalon/TEVA Pharmaceutical Industries), a TRK-selective
inhibitor, at the indicated concentration for one hour before
ligand treatment. Cells were treated with 50 ng/ml of GDNF, NRTN,
and ARTN (R&D Systems, Inc.), or 100 ng/ml NGF and BDNF
(PeproTech, Inc.) in RPMI-1640 with 1% fetal bovine serum for 15
min before cell lysis. Control cells received either the same
volume of PBS or no treatment. For longer treatments to determine
effects on morphology, cells remained in the drug and
ligand-containing media for 24 h, 3 days or 6 days.
Antibodies and other reagents
Antibodies targeting phosphorylated (p) RET-Y905
(cat. no. 3221), TRK-Y490 (cat. no. 9141) and RET (cat. no. 14556)
were obtained from Cell Signaling Technology, Inc. Antibodies
targeting pRET-Y1015 (cat. no. ab74154) and pRET-Y1062 (cat. no.
ab51103) were purchased from Abcam. GFRα1-3 (cat. nos. MAB7141,
MAB6131 and MAB6701, respectively) antibodies were from R&D
systems, Inc. RET (isoforms 51, cat. no. sc-1290) and pan-TRK (cat.
no. sc-11) antibodies were obtained from Santa Cruz Biotechnology,
Inc. NGF and BDNF (50 ng/ml final working concentrations) were
obtained from PeproTech, Inc.
Whole cell extracts
To prepare whole cell extracts, cells were lysed and
protein collected using cell lysis buffer (Cell Signaling) with 500
ml of buffer concentrate, 50 µl of 100 mM PMSF in ethanol, 750 µl
of Protease inhibitor from cOmplete™, Mini Protease Inhibitor
Cocktail Tablets (Roche Diagnostics) and 3.75 ml of distilled
water.
RET inhibition studies
NBLS cells were induced with RET ligand ARTN (50
ng/ml) and inhibited using increasing concentrations of CEP-701
(10, 50, 100, 200 and 400 nM). Whole cell extracts were prepared as
aforementioned, and used for western blot analysis.
Western blot analysis
Whole cell extracts (100 µg) were subjected to
polyacrylamide gel electrophoresis (4-12% SDS-PAGE), using NuPAGE
Bis-Tris gels with MOPS-SDS Running Buffer (Invitrogen; Thermo
Fisher Scientific, Inc.). Proteins were transferred to
nitrocellulose membranes (GE Healthcare Life Sciences). Membranes
were blocked with 5% non-fat milk in PBS-Tween-20, and incubated
with primary antibodies (1:1,000) overnight at 4°C, either in 5%
non-fat milk or 1% BSA (for phosphorylated-specific antibodies).
After 3–4 washes with PBS-Tween-20, the membranes were incubated
with secondary antibodies (1:3,000) in similar buffers at room
temperature for 1 h. Blots were washed four time with PBS-Tween-20,
developed using chemiluminescence reagent (Invitrogen; Thermo
Fisher Scientific, Inc.) and signals were detected using
autoradiography.
RNA isolation and
reverse-transcription-quantitative PCR (RT-qPCR)
Total RNA was isolated from cell pellets using the
RNeasy Mini kit (Qiagen, Inc.) and quantified using Nanodrop
spectrometer (Thermo Fisher Scientific, Inc.). cDNA was prepared
from total RNA using the High Capacity cDNA Reverse Transcription
kit (Applied Biosystems; Thermo Fisher Scientific, Inc.). qPCR was
performed using an ABI 7900HT Fast Real-Time PCR system with TaqMan
Gene Expression Assays (Applied Biosystems; Thermo Fisher
Scientific, Inc.) for RET (RET: Hs01120032_m1), GFRα1-3 (GFRα1:
Hs00237133_m1; GFRα2: Hs00394700_m1; GFRα3: Hs00181751) and GAPDH
(GAPDH: Hs99999905_m1). All samples were run in triplicate, and
each experiment was conducted at least three times. Values were
calculated as relative rates from a standard curve, and GAPDH was
used as an internal control.
Phase contrast microscopy
Cell morphology was assessed using phase-contrast
microscopy, and captured images at 20× magnification (Leica
Microsystems Inc.). For longer treatments to examine the effects of
ligand on cell morphology, the media was changed every 3 days, and
fresh ligand was added. Various NB cell lines were plated in either
6-well or 10 cm culture dishes, and cells were treated with GDNF,
ARTN or NRTN. Ligand-induced cells were assessed for neuronal
differentiation by changes in cell shape, and by measuring neurite
outgrowth. Cells were considered differentiated when they had three
or more times the size of undifferentiated cells, with development
of euchromatin and prominent nucleoli. Neurite outgrowth was also
assessed by counting the number of cells that had neurites
extending more than the length in longest diameter of the cell, as
assessed by ocular micrometer measurement.
Statistical analysis
For analysis of gene expression, statistical
analyses were performed using GraphPad Prism and the Prism-ANOVA
method. Each experiment was performed at least three times, and
triplicate readings were used and reported for all P-values. Data
are expressed as the standard error of the mean. Values are the
mean of triplicate readings from three or more independent
experiments and P<0.05 was considered to indicate a
statistically significant difference.
Relative expression of RET and its co-receptors was
assessed by western blotting and was scored qualitatively from
‘+++’ for the highly RET positive NBLS line to ‘−’ for the NLF
line. A similar approach was used for GDNFα1-3 expression and for
RET phosphorylation. Morphologic changes, such as cell body
enlargement, flattening and neurite outgrowth, were also
quantitated on a ‘−’ to ‘+++’ scale, where ‘−’ indicated no change,
‘+’ indicated a modest change, ‘++’ indicated a moderate change,
and ‘+++’ indicated a dramatic change, based on direct inspection
of phase-contrast images.
Data from publicly available NB microarray
expression and RNA-seq studies were analyzed for the expression of
RET with its co-receptors GFRα1, −2, −3, and −4, as well as with
NTRK1 and −2, to determine if there were significant associations.
The ggplot2 package (version 2.21; http://mran.microsoft.com/snapshot/2017-04-11/web/packages/ggplot2/index.html)
was used to generate scatter plots comparing RET with GFRα1, 2, 3,
4 and NTRK1, 2 from the TARGET NB RNA-sequencing data (53). Pearsons correlation analysis was
used to estimate correlation between RET and the expression of the
GFRα1 receptors. Meta-analysis was performed using the meta package
(54). Both fixed and random
effects model for the analysis and forest plots were generated to
summarize the data. All data was analyzed using the R statistical
(version 3.43) language and framework.
Results
Expression of RET and its co-receptors
in NB cell lines
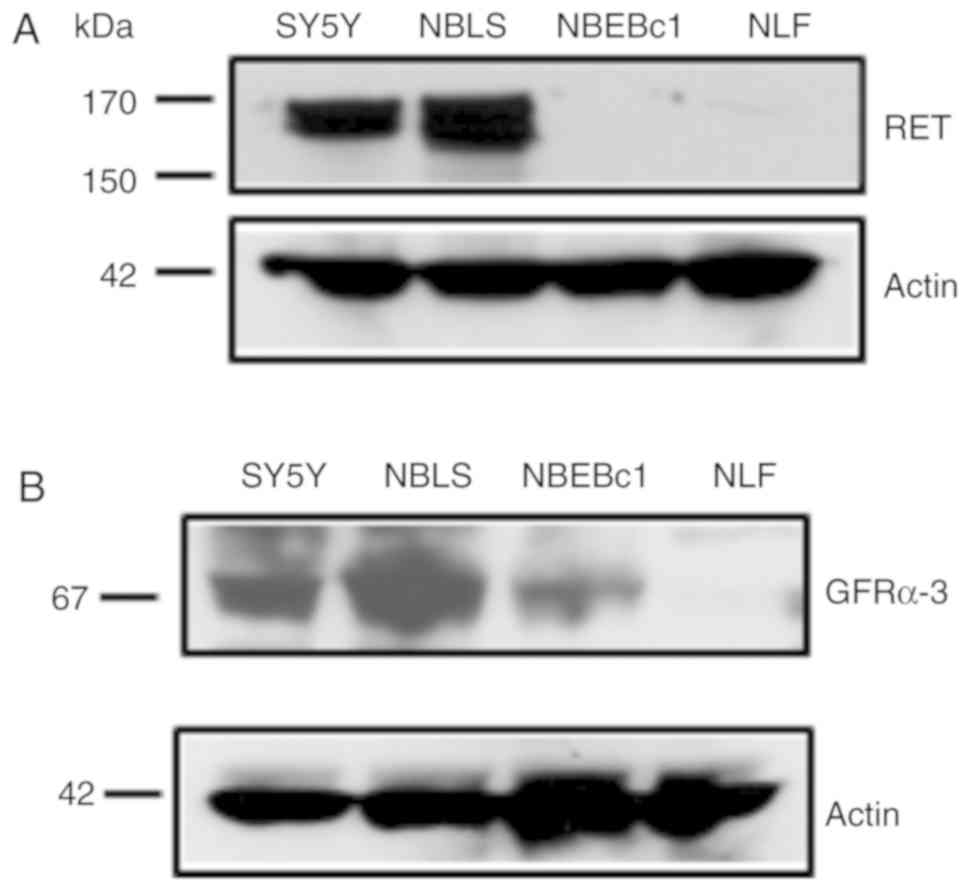
In order to determine RET expression levels in a
panel of NB cell lines (SY5Y, NBLS NBEBc1 and NLF), western blot
analysis using whole cell extracts was performed. RET was detected
at moderate to high levels in both the NBLS and SY5Y lines, but it
was low/absent in NBEBc1 and NLF cells (Fig. 1A). Next, the expression of
endogenous RET co-receptor expression was assessed. GFRα3 was
expressed at various levels, ranging from low to high in this panel
of NB cell lines, and high expression of GFRα3 was seen in NBLS,
with lower levels detected in NBEBc1 (Fig. 1B). In addition, we analyzed mRNA
expression of RET and its co-receptors GFRα1-3 in these cell lines
by quantitative RT-PCR. The results correlating RET and co-receptor
expression are summarized in Table
I. GFRα4 and PSPN expression levels were negative in all cell
lines and were excluded from further analysis.
 | Table I.RET and RET co-receptor expression in
NB cell lines. |
Table I.
RET and RET co-receptor expression in
NB cell lines.
| Ligand
treatment |
Characteristics | NBLS | SY5Y | NB-EBc1 | NLF |
|---|
| No treatment | RET
expressiona | +++ | ++ | +/- | – |
| No treatment | GFRα1
expression | ++ | – | + | + |
| No treatment | GFRα2
expression | + | – | + | ++ |
| No treatment | GFRα3
expression | +++ | +++ | + | + |
| GDNF treatment | RET
phosphorylation | ++ | + | + | – |
|
| Morphologic
changesb | + | ++ | + | – |
| NRTN treatment | RET
phosphorylation | ++ | – | + | – |
|
| Morphologic
changes | ++ | + | + | – |
| ARTN treatment | RET
phosphorylation | +++ | – | + | – |
|
| Morphologic
changes | ++ | + | + | – |
Expression of phospho-RET in NB cell
lines
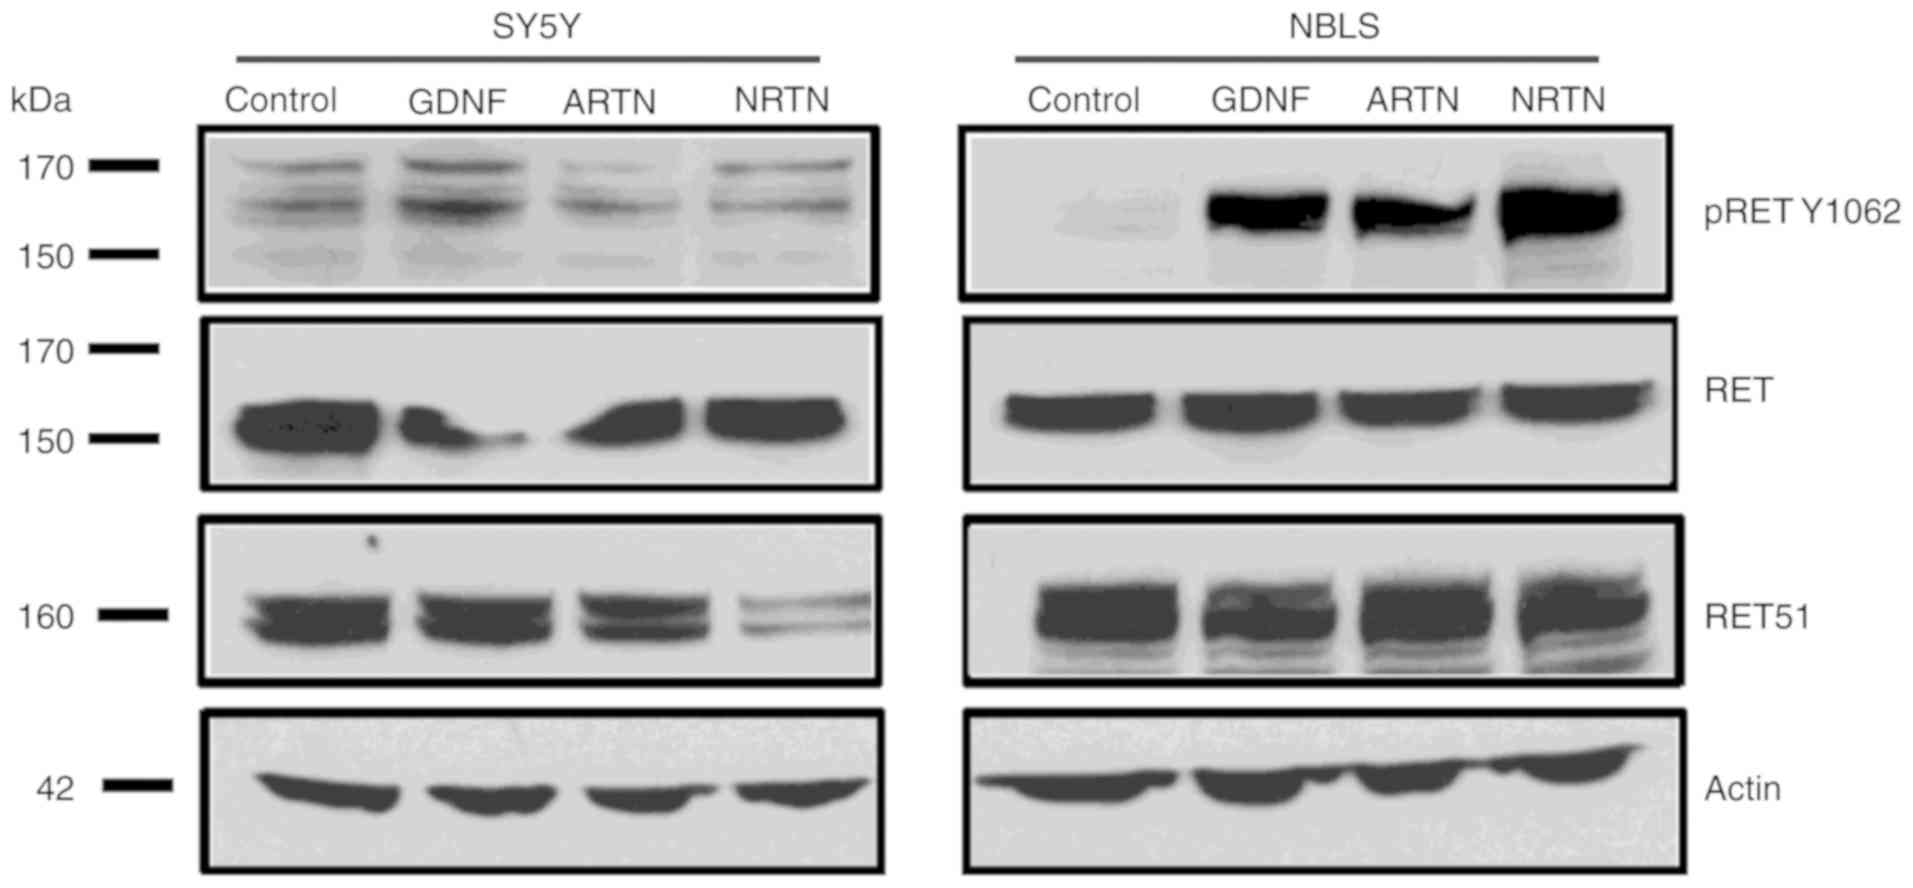
To further investigate whether ligand exposure leads
to RET phosphorylation, SY5Y and NBLS cells, which expressed both
RET and GFRα3 (Fig. 1), were
treated with 50 ng/ml of ligands GDNF, NRTN and ARTN for 15 min.
Whole cell extracts were prepared and western blotting was
performed. RET expression in response to ligands was analyzed using
a RET-Y1062 antibody. All ligands readily induced phosphorylation
of RET in NBLS cells, but there was only a modest increase in
phosphorylation of RET in respond to GDNF in SY5Y (Fig. 2). Phosphorylated RET in response to
various ligands in different cell lines is shown in Table I. These results confirm that RET
activation occurs in NB cell lines by phosphorylation in response
to ligand in the presence of their cognate co-receptors.
Morphological changes of NB cell lines
in response to RET ligands
Morphological differences in NB cell lines in
response to ligands were assessed. SY5Y, NLF, NBLS, and NB-EBc1
cells were exposed to GDNF, ARTN, or NRTN (50 ng/ml) or no ligand,
and the cells were assessed qualitatively by phase contrast
microscopy at 0, 24 h, 3 days, and 6 days. SY5Y cells showed
morphologic differentiation and neurite outgrowth in response to
GDNF and NRTN, but not ARTN after 6 days of exposure (Fig. 3). NLF cells showed a flattened shape
and neurite outgrowth compared to control cells in response to
ligand (Fig. 3). NBLS and SY5Y had
the highest levels of endogenous RET expression, and showed
morphologic changes characteristic of differentiation (Fig. 3 and Table I). Neurite outgrowth was observed in
NBLS treated with GDNF, NRTN and ARTN, and by 6 days the most
dramatic morphologic changes were seen in NRTN- and ARTN-treated
cells. NB-EBc1 cells treated with NRTN and ARTN had short neurites
at 3 days, and longer, more complex neurites in 6 days. The
morphology of the NBLS and NB-EBc1 without ligand exposure did not
change at 6 days. These results suggest that there was clear
morphological differentiation upon ligand induction in cell lines
expressing RET and the corresponding co-receptor.
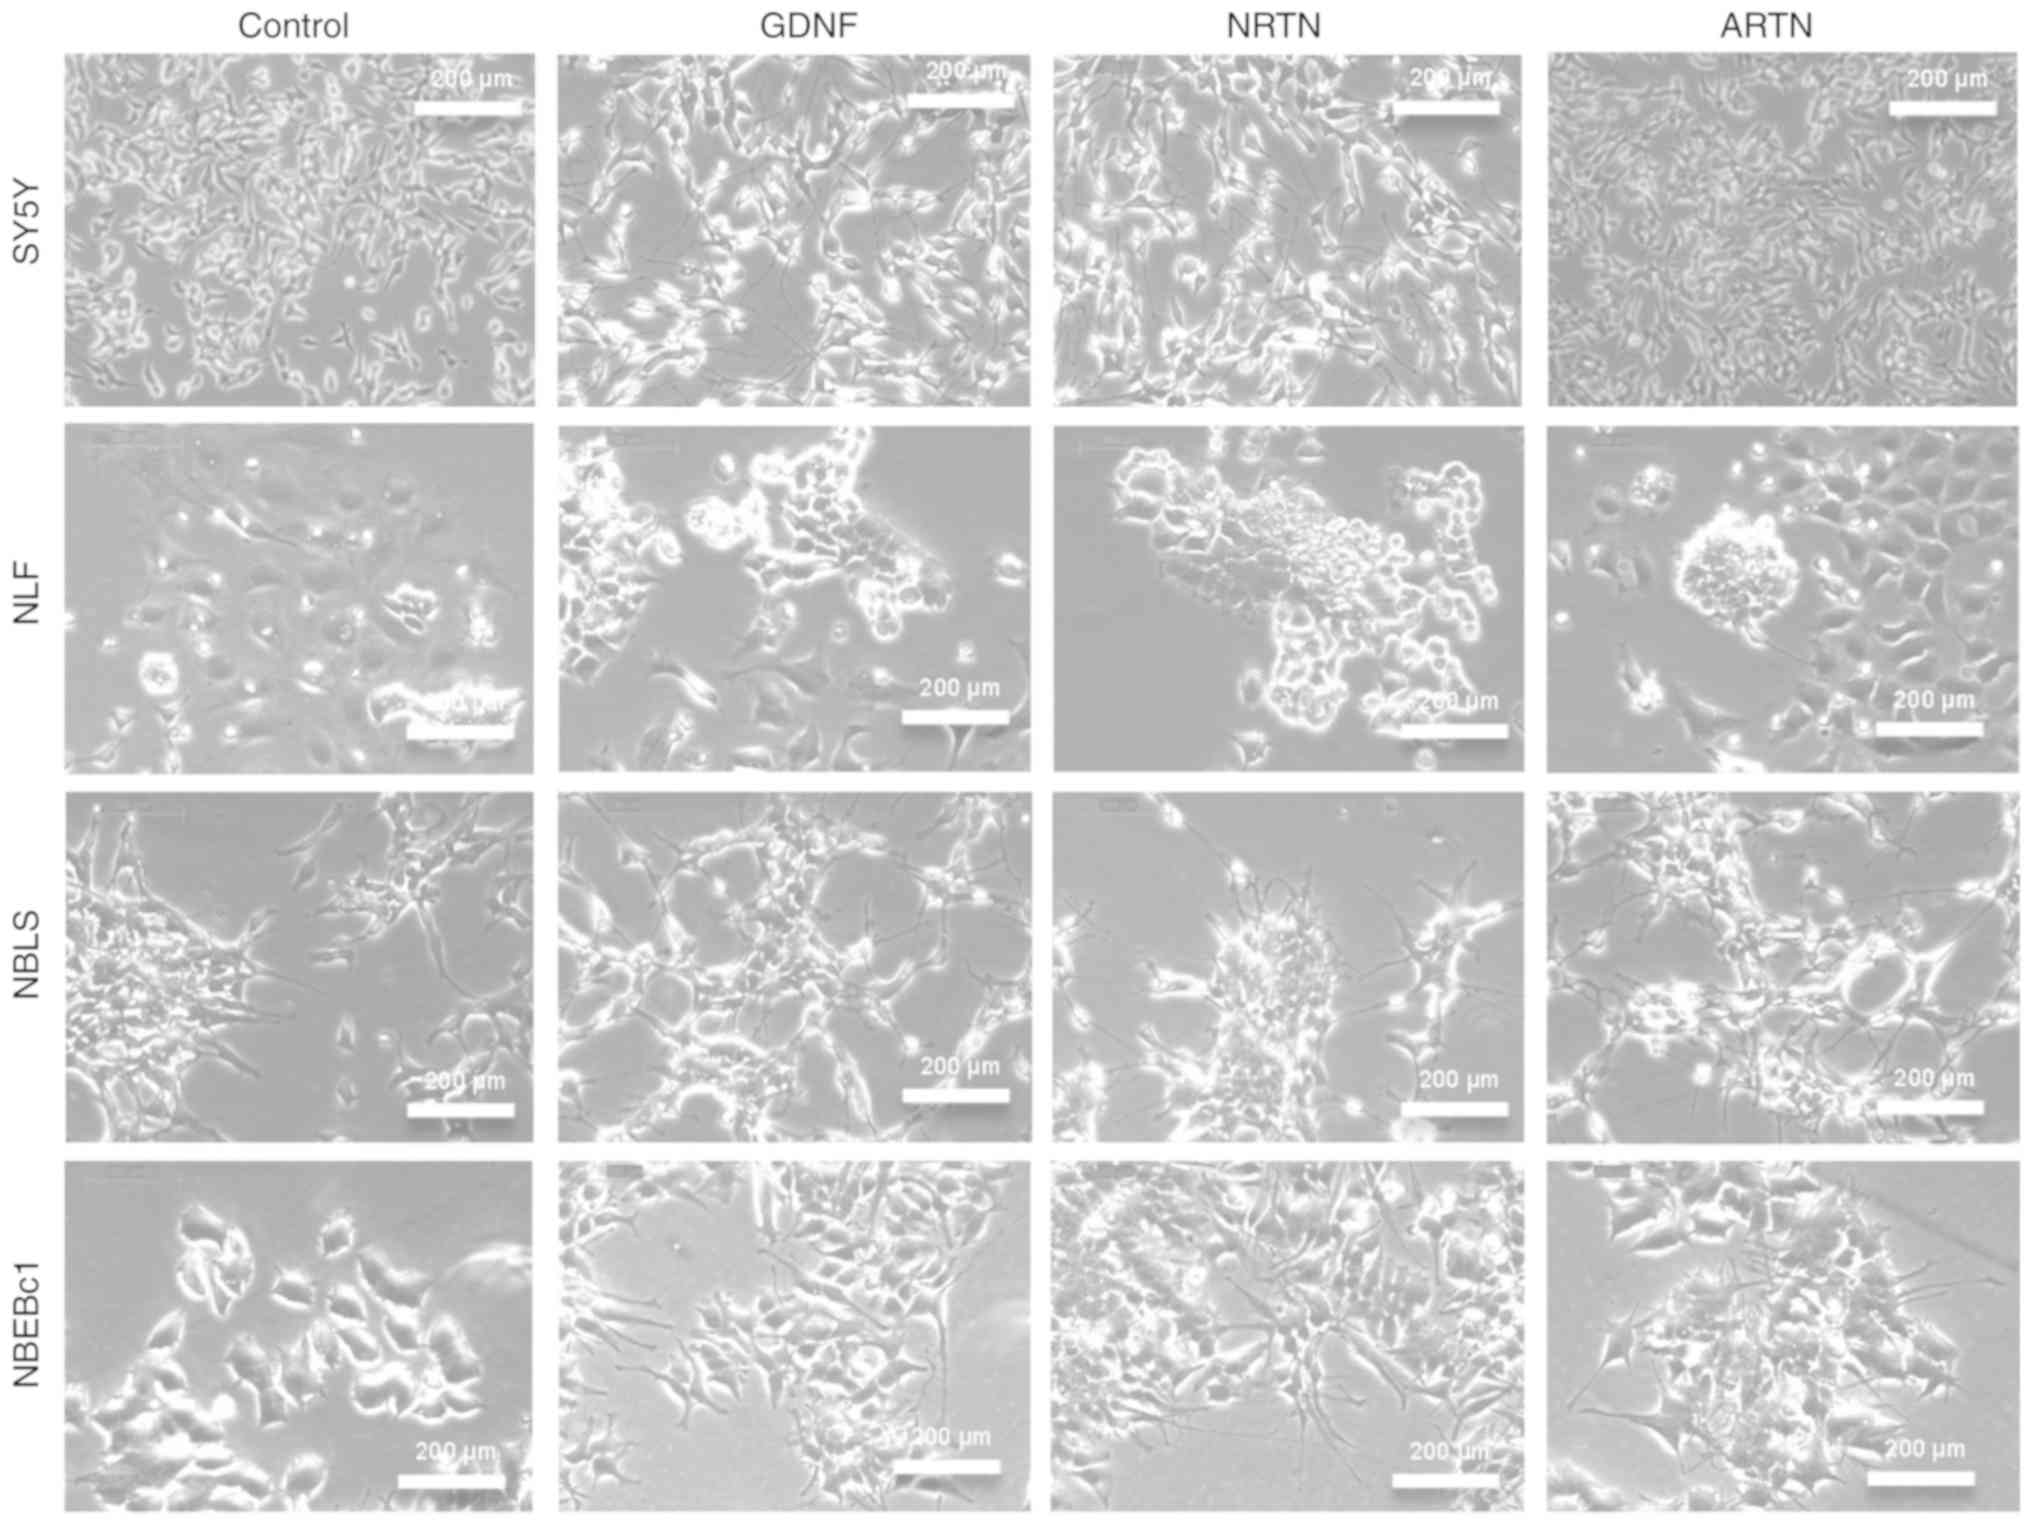 | Figure 3.Representative phase contrast images
depicting morphology change in response to GDNF, NTRN and ARTN
ligands (6 days) in SY5Y, NLF, NBLS and NBEBc1 NB cell lines. Cells
respond to ligand activation and show morphological changes, such
as cell flattening, cell enlargement and neurite outgrowth, which
is most pronounced in NBLS and SY5Y, modest in NBEBc1 and not
observed in NLF. NB, neuroblastoma; GDNF, glial cell line-derived
neurotrophic factor; ARTN, artemin; NRTN, neurturin. |
Effect of CEP-701 on RET
expression
Since differential expression of RET and TRK in SY5Y
and NBLS cells was observed, the effect of TRK inhibition with
CEP-701 was examined. SY5Y is RET positive and TRK null; and NBLS
expresses both RET and TRK. These cells were treated with 100 nM
CEP-701 for 1 h before adding ARTN (50 ng/ml). To examine possible
TRK or RET inhibition by CEP-701, western blot analysis with
phospho-specific antibodies was performed. Results indicated that
CEP-701 significantly inhibited both TRK and RET activation, and
there was reduced RET phosphorylation at all three residues (Y905,
Y1062 and Y490) in NBLS and SY5Y cells (Fig. 4A). Interestingly, ARTN treatment
activated TRK at tyrosine 490 in NBLS cells, and this was
completely inhibited by CEP-701 (Fig.
4A). However, there was no effect of RET ligands on NLF, which
is had no RET expression (Fig.
1).
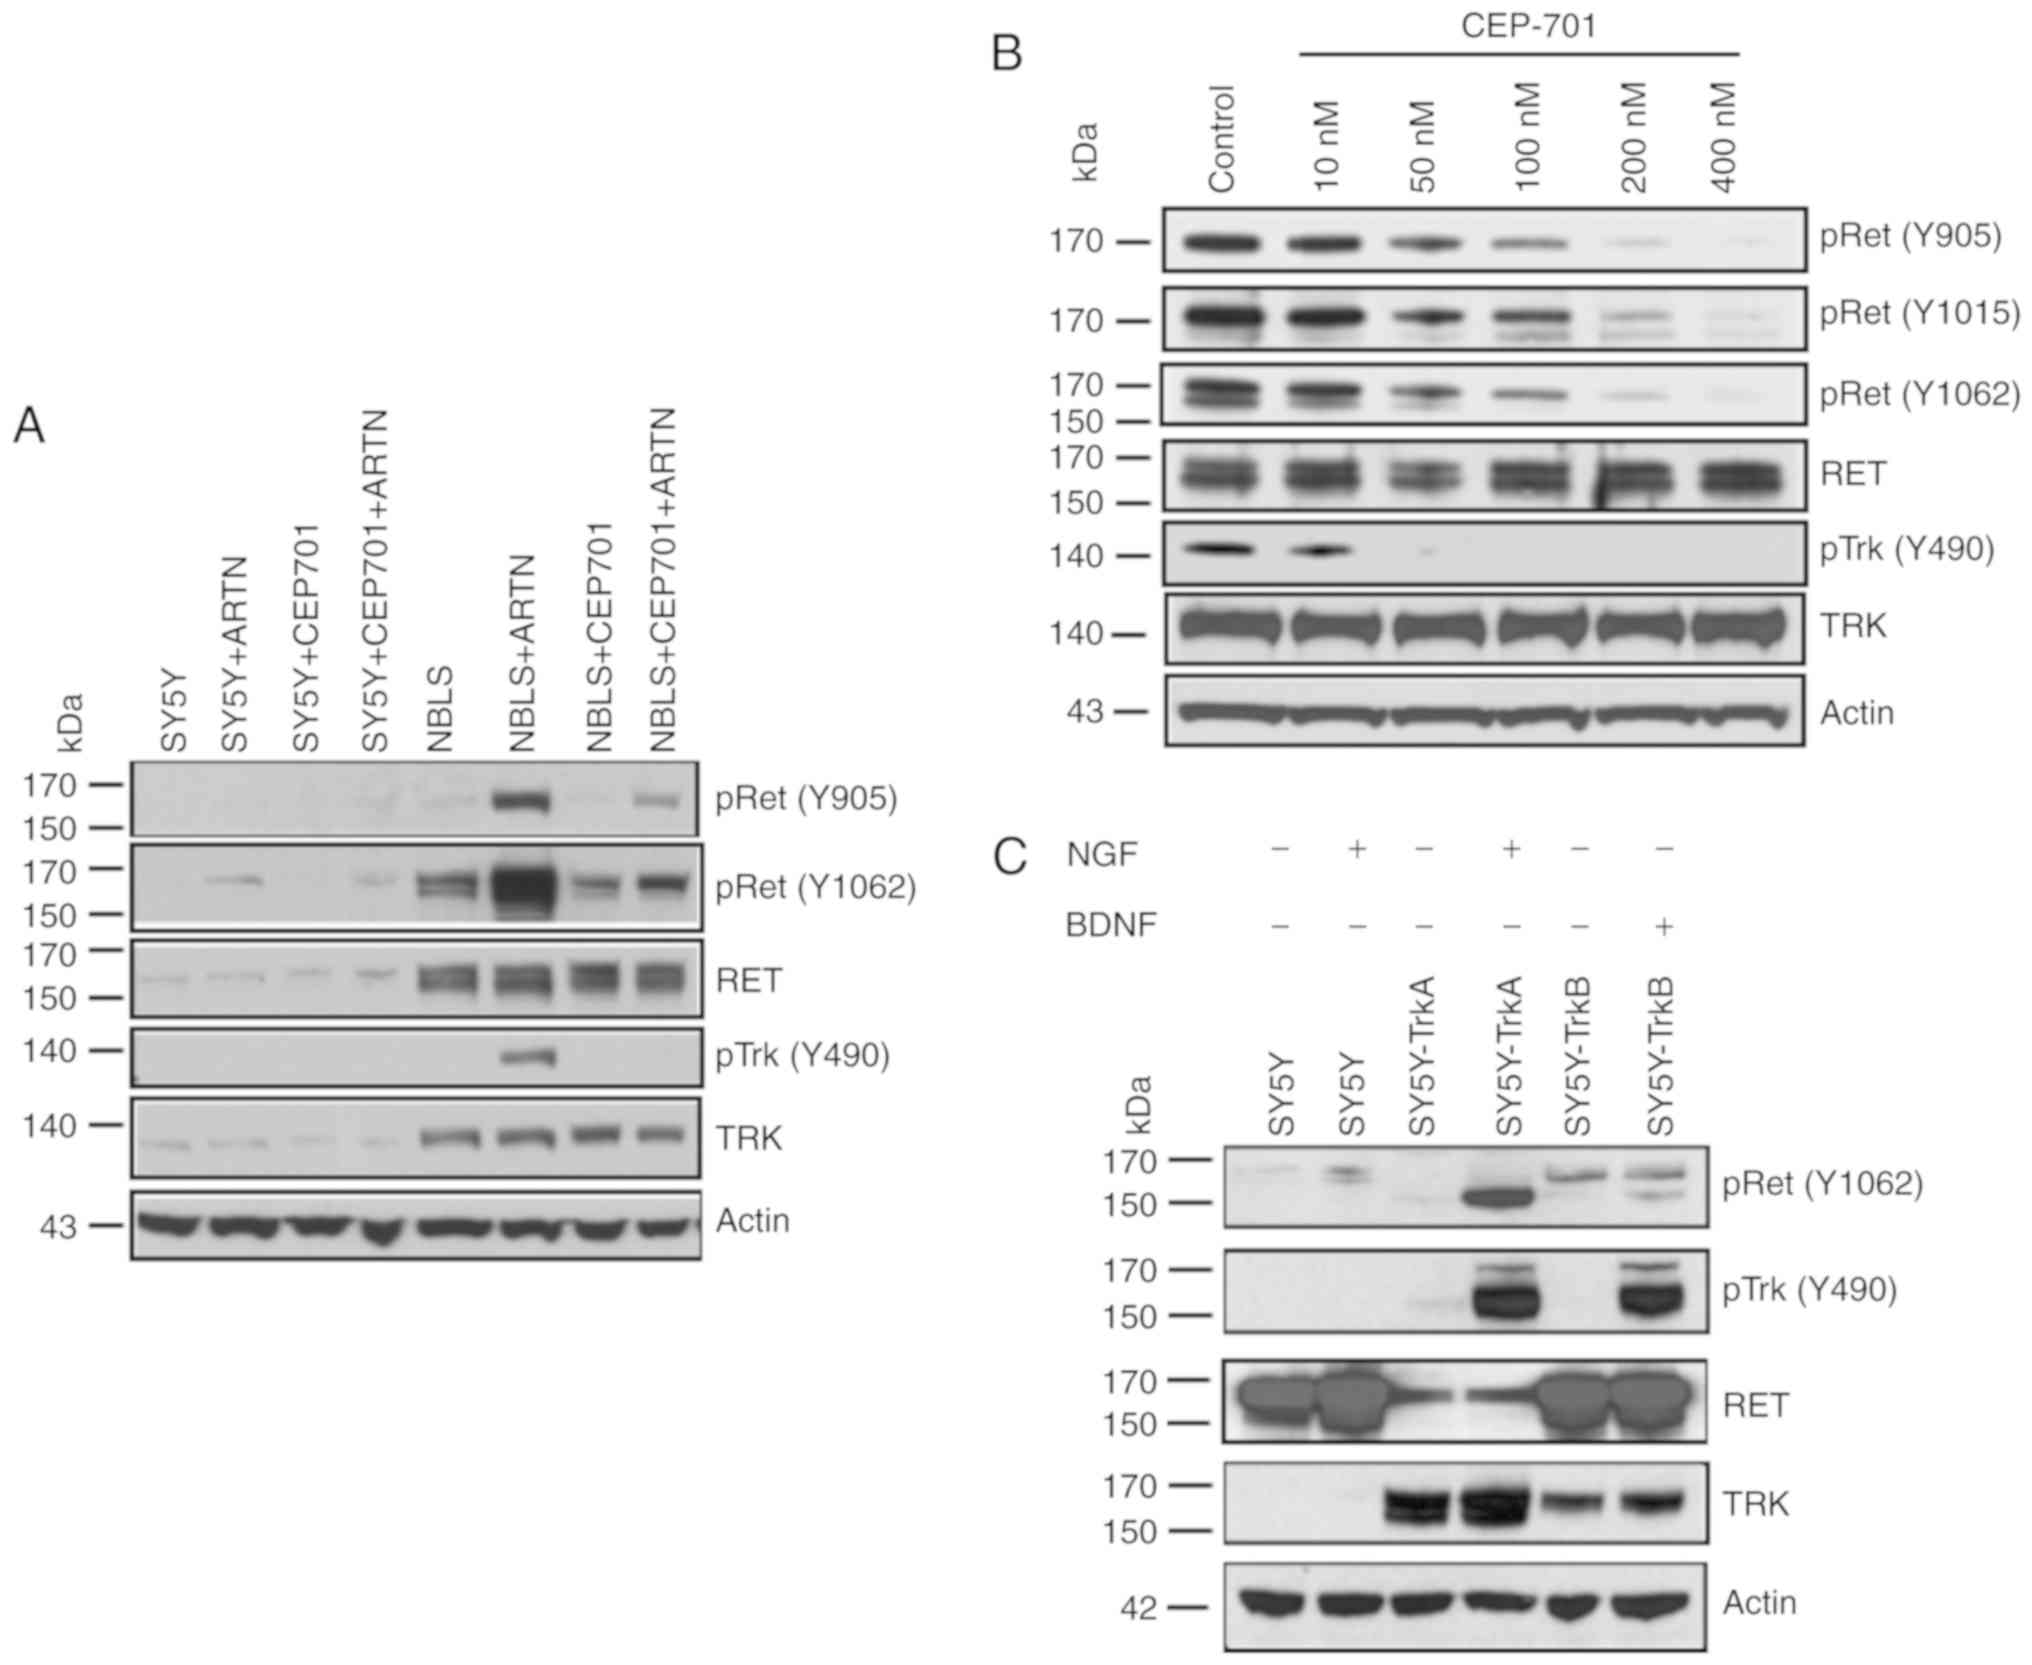 | Figure 4.Effect of RET/TRK inhibition by
lestaurtinib (CEP701). (A) Inhibition of RET expression by CEP701.
SY5Y and NBLS cells were treated with 100 nM CEP701 and/or ARTN,
and analyzed for the expression of RET, phospho-RET, TRK, and
phospho-TRK. SY5Y cells showed modest induction of phospho-RET by
ARTN compared with untreated cells, but the effect of CEP701 could
not be assessed due to the lack of TRK expression. NBLS cells
showed strong RET activation and TRK activation, and this
activation was inhibited by CEP701. (B) Dose dependent inhibition
of RET expression by CEP701. NBLS cells were induced with the RET
ligand ARTN and inhibited using increasing concentrations of
CEP701. Dose dependent inhibition of RET (and TrkA) was observed
upon CEP701 exposure. (C) RET phosphorylation in response to TRK
ligands. SY5Y (TRK-null), SY5Y-TrkA and SY5Y-TrkB cells were
exposed to their cognate ligands (NGF for TrkA, BDNF for TrkB), and
phospho-RET, total RET, phospho-TRK, and total TRK expression was
measured. RET is phosphorylated strongly by NGF exposure to
SY5Y-TrkA, and modestly by BDNF exposure to SY5Y-TrkB. |
In order to determine the most effective dose of
CEP-701 against both RET and TRK, we treated NBLS cells with
CEP-701 at 0, 10, 50, 100, 200 and 400 nM concentrations, and
performed western blot analysis. Reduced phosphorylation at all
three tyrosine residues was observed in a dose dependent manner.
CEP-701 inhibited TRK at lower concentrations compared with those
required for RET inhibition. RET phosphorylation was almost
completely inhibited at 200 nM, whereas TRK was completely
inhibited at 50 nM (Fig. 4B). These
results suggest that RET expression is inhibited by CEP-701,
presumably through inhibition of TRK activation, and TRK activation
by ARTN requires RET activation.
RET and TRK receptor interactions
Since we observed TrkA phosphorylation upon exposure
of NBLS cells to ARTN, which was inhibited by CEP-701 (Fig. 4A), if RET could be activated by
exposure of TRK-expressing cells to their cognate ligands was
investigated next. There was no effect on RET by adding NGF to
TRK-null SY5Y cells (Fig. 4C).
However, even though RET expression was lower in SY5Y-TrkA cells
compared with NBLS cells, it was strongly phosphorylated by adding
NGF, and phosphorylated less by adding BDNF to SY5Y-TrkB cells. RET
phosphorylation occurs in response to TrkA activation by NGF, and
TrkA is phosphorylated in response to RET activation by ARTN, which
suggests that RET and TrkA (and possibly TrkB) physically interact
and can induce reciprocal activation in response to ligand
activation, but this needs to be investigated further.
Association of RET expression with its
co-receptors and with TRK genes
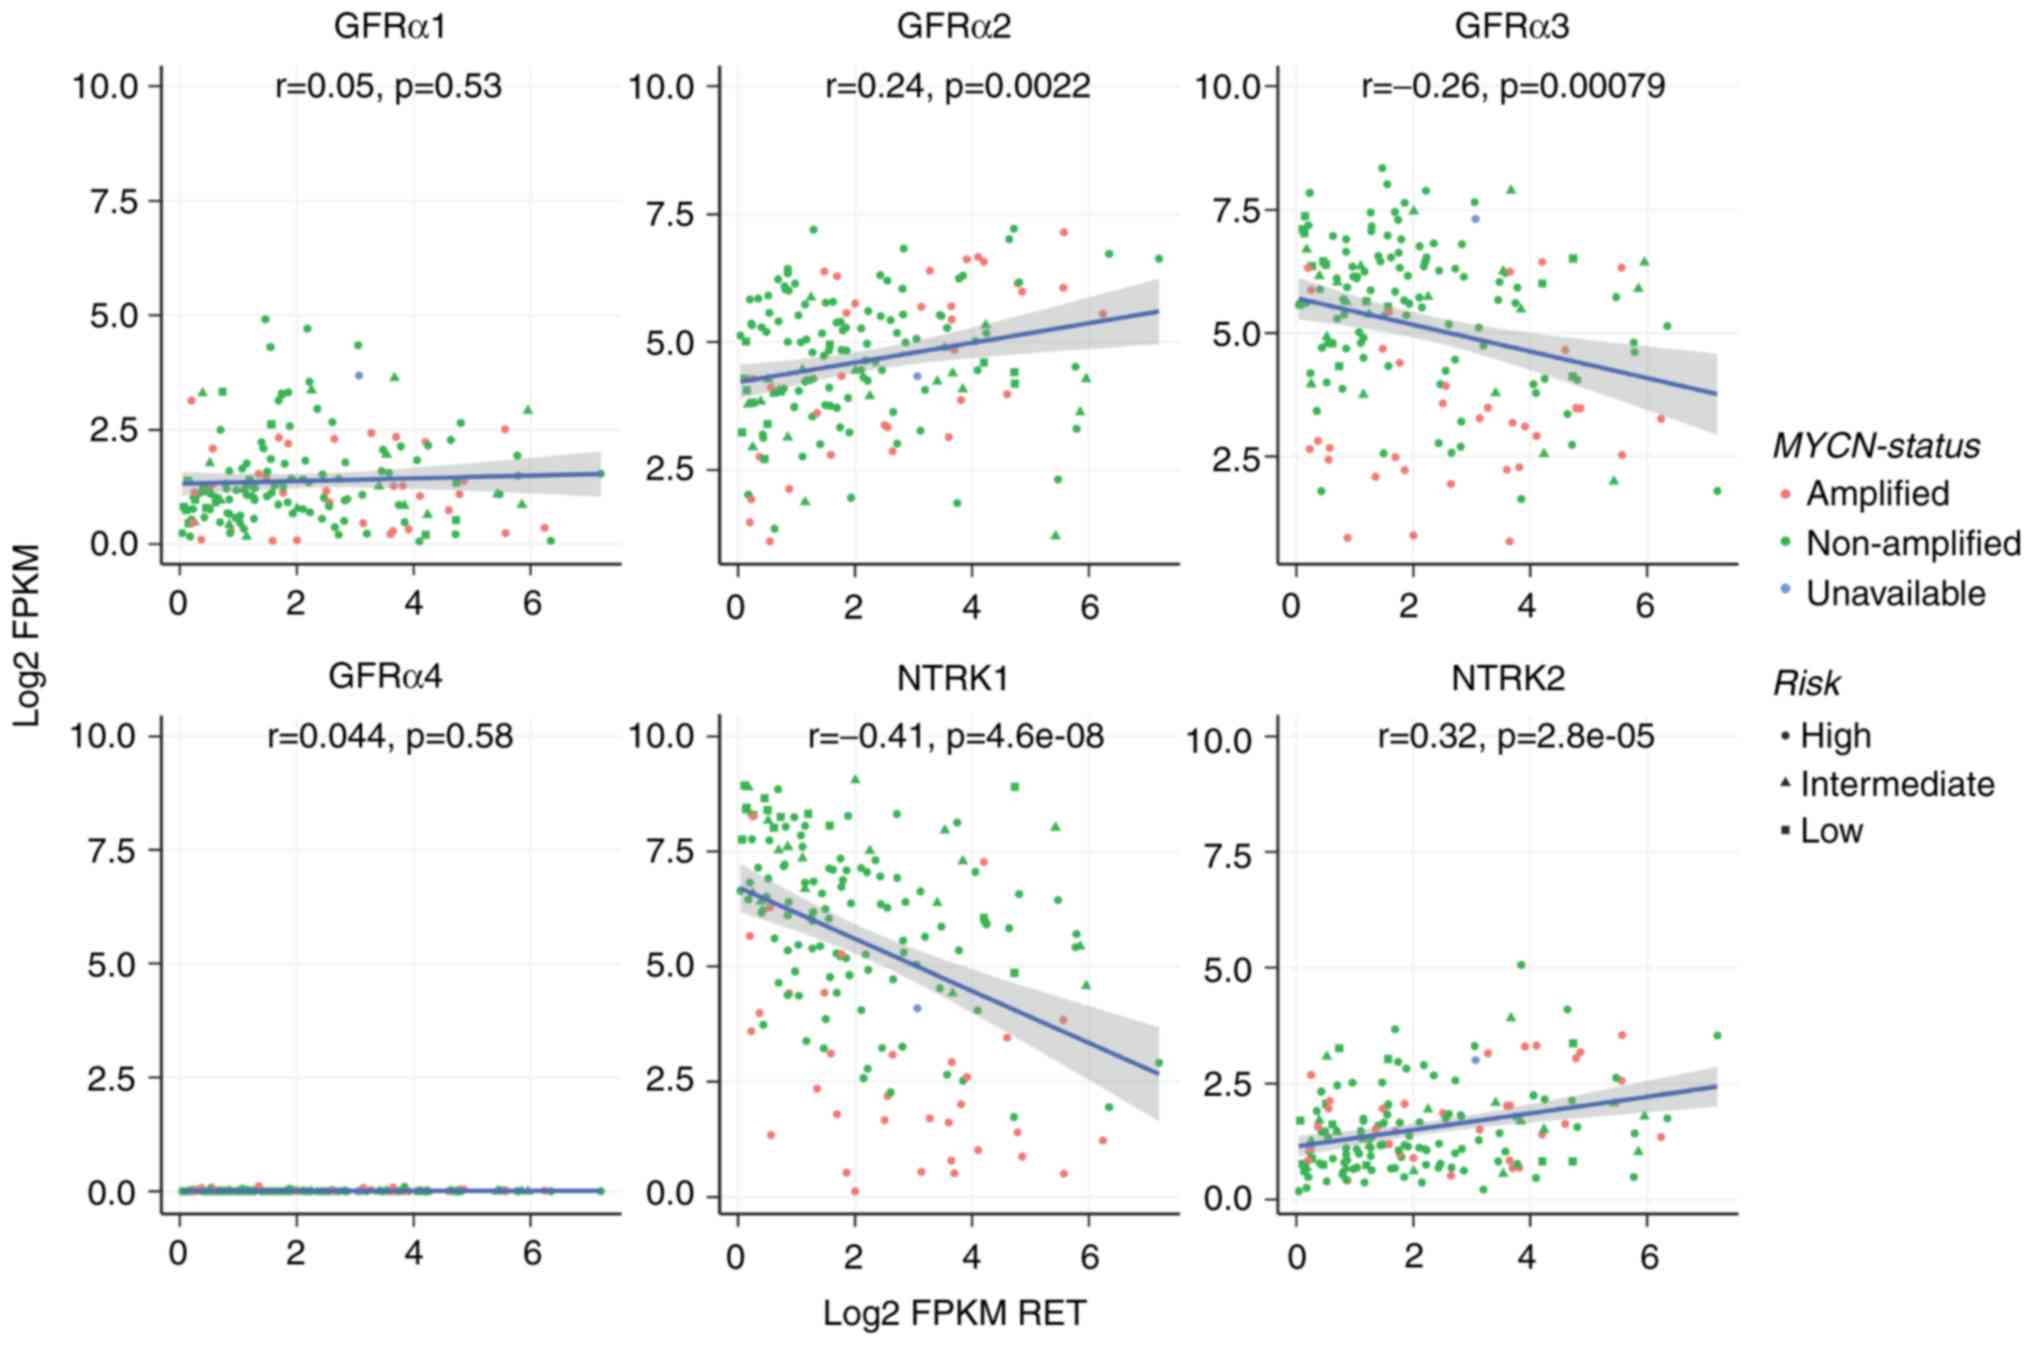
Next, mRNA expression of RET with its
co-receptors and with TRK genes (NTRK1, NTRK2) in a
large series of primary NBs was assessed. Data from 249 primary NBs
from the NB TARGET Initiative (ocg.cancer.gov/programs/target/projects/neuroblastoma)
was analyzed (Fig. 5). There was no
correlation between RET expression and GFRα1, but
there was a significant positive correlation between RET and
GFRα2, and a significant negative correlation between
RET and GFRα3; GFRα4 was expressed at very low
levels in all tumors. Interestingly, there was an inverse
correlation between RET and NTRK1 expression, but
positive correlation between RET and NTRK2. MYCN
amplification status did not correlate with GFR co-receptors, but
NTRK1 expression was significantly lower in tumors with
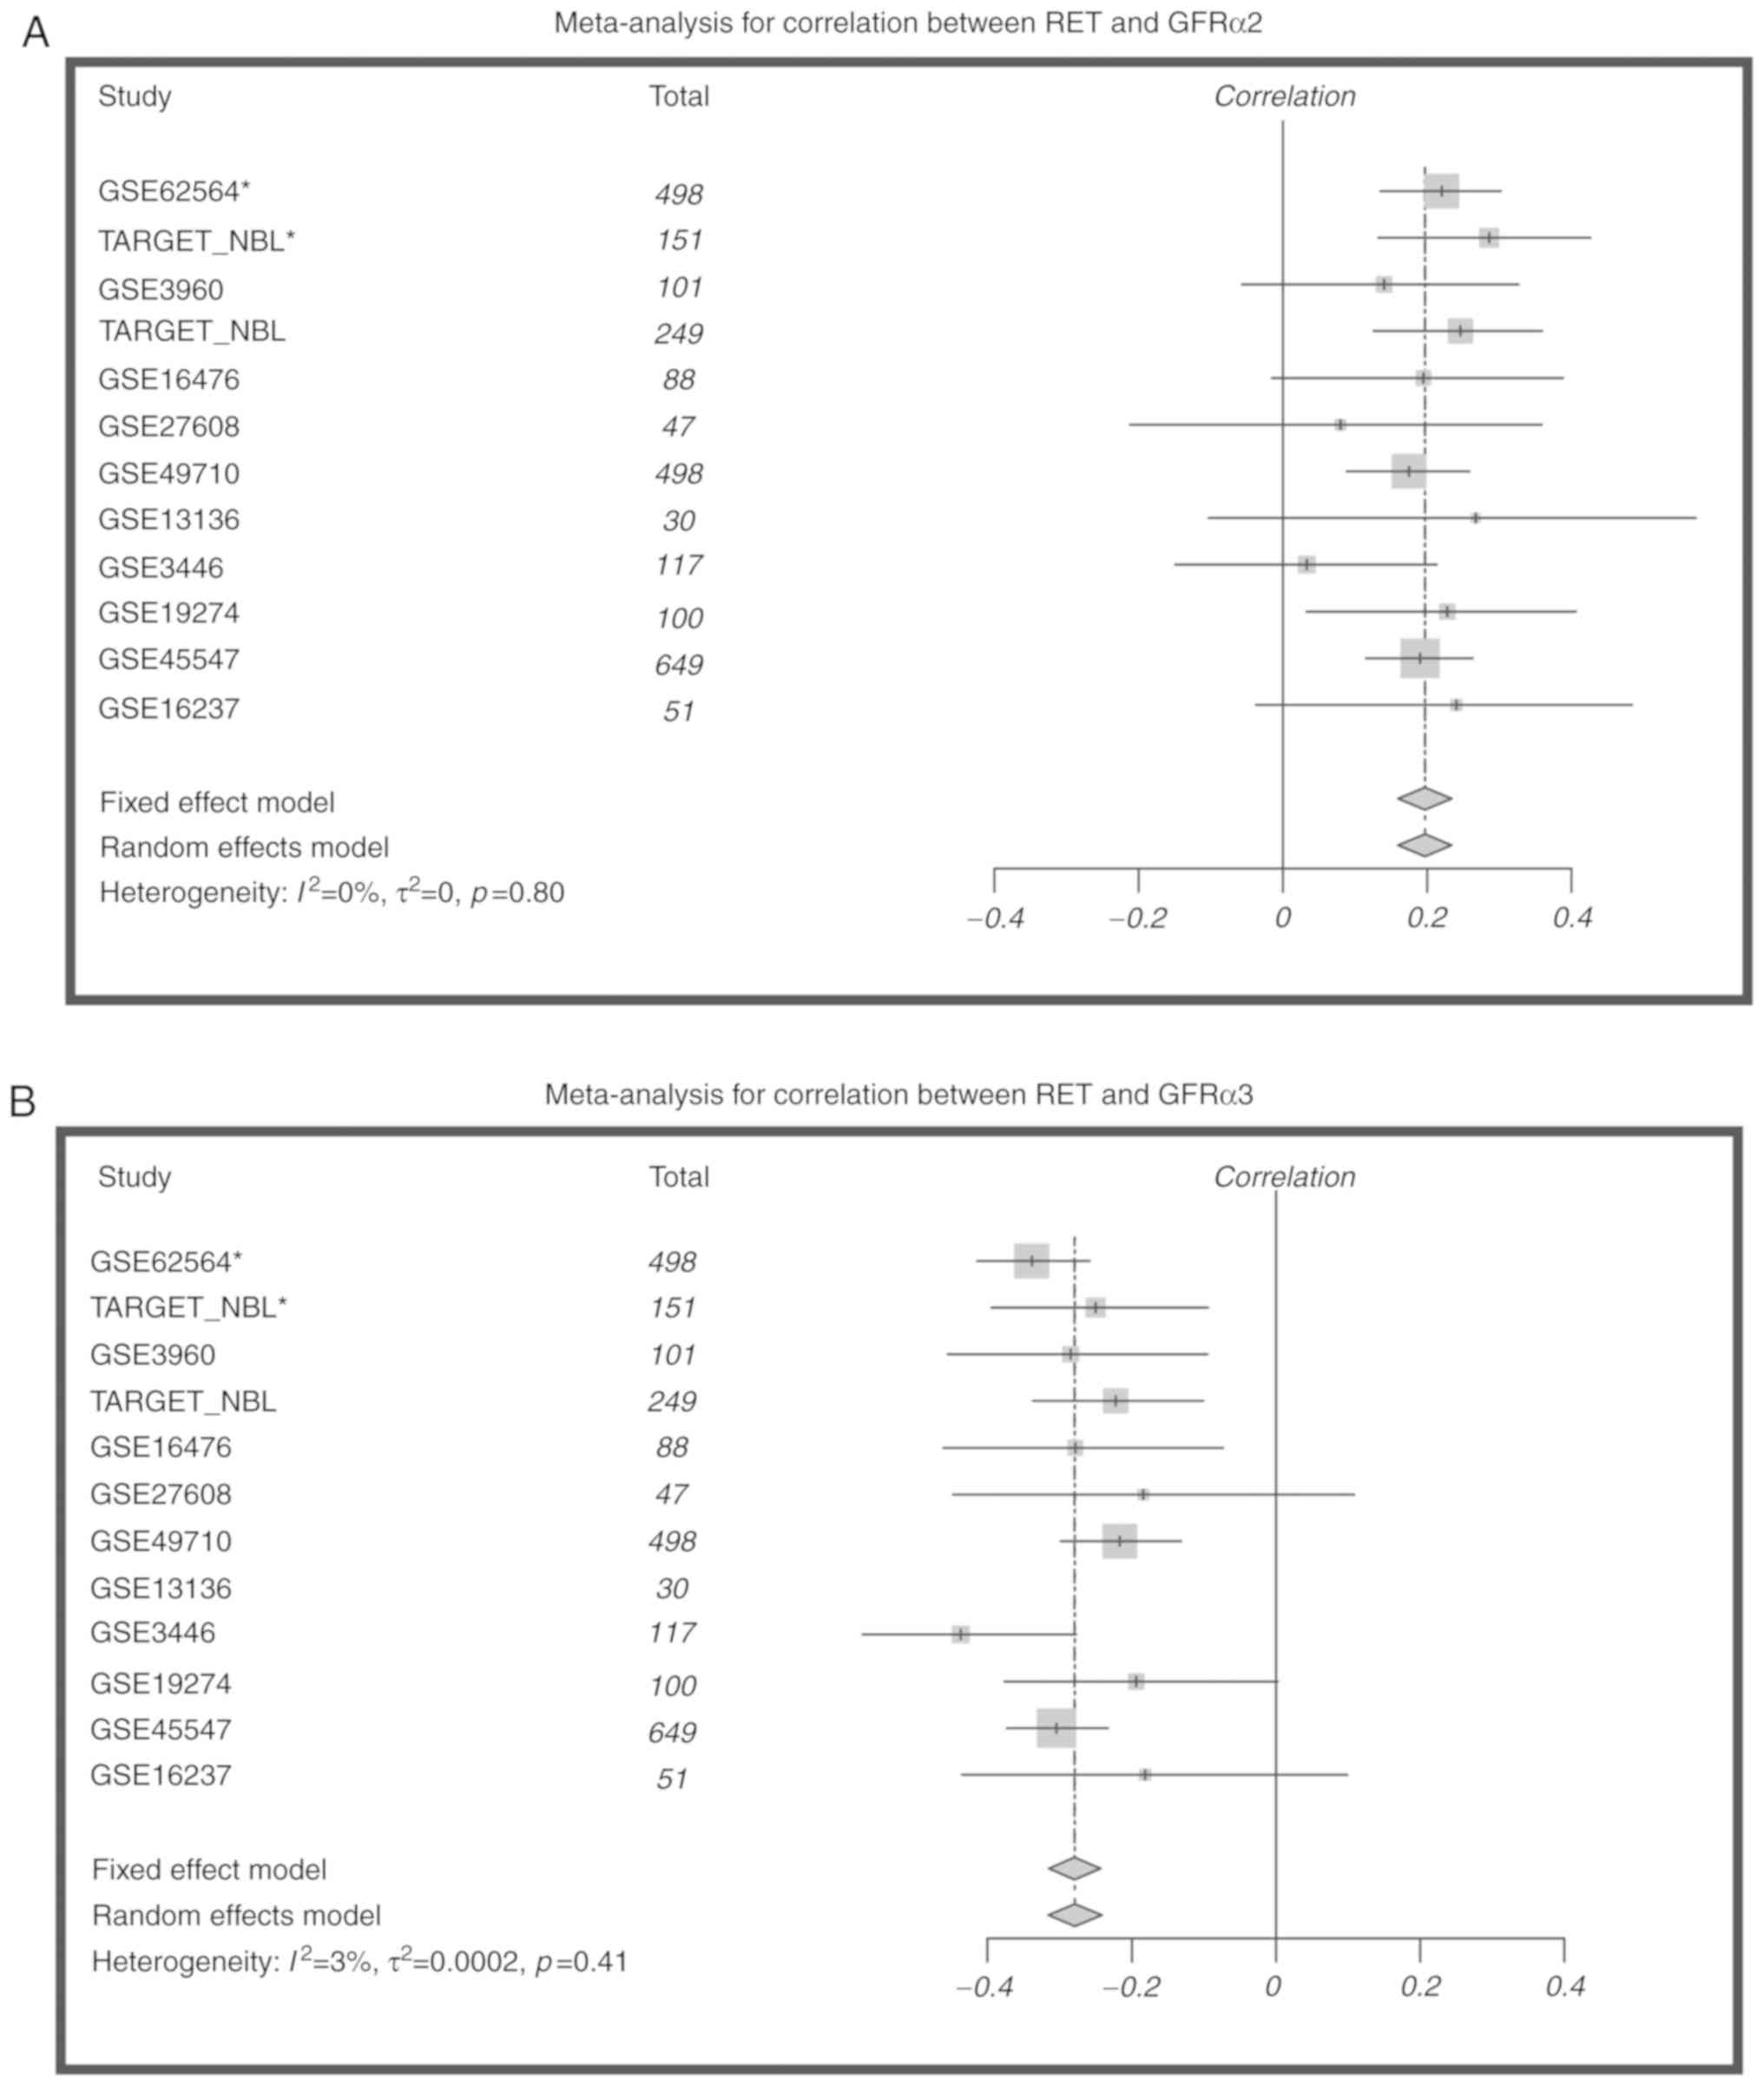
MYCN amplification. These correlations were validated in
additional expression datasets (2,579 cases total), and the same
correlations were seen in all datasets (Fig. 6). In addition, age vs candidate Log2
FPKM gene expression was compared in patients <18 months and
>18 months and identified RET, GFR α2 and NTRK1 expressions as
significant (Fig. S1).
Discussion
In the present study, it was demonstrated that RET
and its co-receptors are expressed in some but not all NB cell
lines. It was also demonstrated activation of RET with GDNF, NRTN
and/or ARTN in the RET positive cell lines examined. RET activation
by cognate ligands demonstrates intact RET function in NB cell
lines that is correlated with expression of the respective GFR
co-receptor.
Cell lines with the highest RET expression also had
the highest GFRα3 expression. NLF, a RET null line, had very low
GFRα3 expression and yet was unresponsive to ARTN. This suggests
that ARTN activation of RET is primarily through GFRα3 and requires
RET expression in NB. Baloh et al (55) first identified ARTN as a survival
factor for sympathetic, sensory and mid-brain neurons. Shortly
after this, Masure et al (56) described ARTN under a different name,
enovin or neublastin, as inducing neurite outgrowth in SY5Y cells
and rescuing them from the toxic effects of taxol. In the present
study, morphologic evidence of neuronal differentiation as well as
significant neurite outgrowth was noticed in SY5Y and NBLS when
treated with NRTN and ARTN. Several reports have also suggested a
role of GDNF, GFRα1 and RET in NB differentiation (9,26–33).
Others have shown that RET is essential for retinoic acid induced
differentiation (9,27,32).
Finally, Hishiki et al (57)
suggested a role for NRTN and GDNF in neurological
differentiation.
The intensity of phosphorylation of RET by different
ligands correlated well with co-receptor mRNA and protein
expression in the present study. In particular, the expression of
GFRα3 and RET activation by ARTN were quite consistent with what
was expected. Studies by others have shown that GFRα1 forms a
physical complex with RET upon GDNF stimulation by recruiting RET
into lipid rafts (58–61). Based on sequence and functional
homology between GFRα1 and GFRα3 and what is known about the
mechanism of interaction between GFRα1 and RET, it could be
hypothesized that GFRα3 also recruits RET into lipid rafts in a
similar manner. PSPN and GFRα4 were not examined in detail, as
their mRNA and protein expression were very low/absent in the NB
lines, and the literature suggests that PSPN does not play an
important role in the sympathetic nervous system (55).
Previous studies have shown RET activation with TRK
ligands (37,38), but there are no published studies
that show TRK activation with RET ligands. The present study
demonstrated that treatment of NBLS, a TRK and RET positive cell
line, with the RET ligand ARTN resulted in phosphorylation and
activation of TRK, as well as RET. However, RET is not activated by
NGF in the TRK-null SY5Y line, suggesting TrkA expression is
required. Inhibition of both RET and TRK activation in the presence
of a TRK inhibitor CEP-701. Was shown. Two other groups have
suggested that RET and TRK crosstalk is essential for NB
differentiation (37,38). Further studies into RET and TRK
interactions may provide a more insight into the nature of the
interaction between RET and TRK pathways.
In conclusion, the expression and function of RET
and its co-receptors in NB cell lines was investigated. RET
activation may play a role in differentiation of NB cell lines, and
uninhibited RET and TRK activation are essential for survival and
growth of NB cells in vitro. It was shown that TRK
activation by ARTN may occur through a RET-dependent mechanism, and
RET activation by TrkA in response to NGF. It has been suggested
that RET and TrkB expression are both required for differentiation
induced by retinoic acid, a compound known to induce
differentiation in NB (37). The
same study showed that RET can be activated by BDNF (37). NGF, the ligand associated with TrkA,
has been shown to induce RET phosphorylation and the activation of
RET and TrkA can also induce NB differentiation (38,62).
Understanding the importance of RET and its interactions with TRK
for differentiation and survival of NB may provide new therapeutic
avenues involving this complex signaling pathway.
Supplementary Material
Supporting Data
Acknowledgements
Not applicable.
Funding
This work was supported in part from the National
Institutes of Health (grant. no. R01-CA094194), Alex Lemonade Stand
Foundation, and the Audrey E. Evans Chair in Molecular Oncology
(GMB).
Availability of data and materials
The datasets used and/or analyzed during the present
study are available from the corresponding author on reasonable
request. The transfected lines are available from Kerafast
(https://www.kerafast.com/contactus).
Data from 249 primary NBs from the NB TARGET Project (ocg.cancer.gov/programs/target/projects/neuroblastoma)
were included in the analysis.
Authors contributions
LHT, RLG, RI, JLC, JHC, KN, PG and FN performed the
experiments. KSG, PR performed the statistical analysis. LHT, VK,
JLC, SPM and GMB designed the present study and wrote the
manuscript. All authors read and approved the final manuscript.
Ethics approval and consent to
participate
Not applicable.
Patient consent for publication
Not applicable.
Competing interests
The authors declare that they have no competing
interests.
Glossary
Abbreviations
Abbreviations:
|
RT-PCR
|
reverse transcriptase polymerase chain
reaction
|
|
GDNF
|
glial cell line-derived neurotrophic
factor
|
|
NRTN
|
neurturin
|
|
ARTN
|
artemin
|
|
PSPN
|
persephin
|
|
NGF
|
nerve growth factor
|
|
BDNF
|
brain-derived neurotrophic factor
|
|
RTK
|
receptor tyrosine kinase
|
References
|
1
|
Mueller S and Matthay KK: Neuroblastoma:
Biology and staging. Curr Oncol Rep. 11:431–438. 2009. View Article : Google Scholar : PubMed/NCBI
|
|
2
|
Brodeur GM, Hogarty MD, Bagatell R, Mosse
YP and Maris JM: Neuroblastoma. In: Principles and Practice of
Pediatric Oncology. Pizzo PA and Poplack DG: JB Lippincott Company;
Philadelphia, PA: pp. 772–797. 2016
|
|
3
|
Brodeur GM: Neuroblastoma: Biological
insights into a clinical enigma. Nat Rev Cancer. 3:203–216. 2003.
View Article : Google Scholar : PubMed/NCBI
|
|
4
|
Schwab M, Westermann F, Hero B and
Berthold F: Neuroblastoma: Biology and molecular and chromosomal
pathology. Lancet Oncol. 4:472–480. 2003. View Article : Google Scholar : PubMed/NCBI
|
|
5
|
Brodeur GM, Minturn JE, Ho R, Simpson AM,
Iyer R, Varela CR, Light JE, Kolla V and Evans AE: Trk receptor
expression and inhibition in neuroblastomas. Clin Cancer Res.
15:3244–3250. 2009. View Article : Google Scholar : PubMed/NCBI
|
|
6
|
Thiele CJ, Li Z and McKee AE: On Trk-the
TrkB signal transduction pathway is an increasingly important
target in cancer biology. Clin Cancer Res. 15:5962–5967. 2009.
View Article : Google Scholar : PubMed/NCBI
|
|
7
|
Farinas I, Wilkinson GA, Backus C,
Reichardt LF and Patapoutian A: Characterization of neurotrophin
and Trk receptor functions in developing sensory ganglia: Direct
NT-3 activation of TrkB neurons in vivo. Neuron. 21:325–334. 1998.
View Article : Google Scholar : PubMed/NCBI
|
|
8
|
Borrello MG, Bongarzone I, Pierotti MA,
Luksch R, Gasparini M, Collini P, Pilotti S, Rizzetti MG,
Mondellini P, De Bernardi B, et al: Trk and ret proto-oncogene
expression in human neuroblastoma specimens: High frequency of trk
expression in non-advanced stages. Int J Cancer. 54:540–545. 1993.
View Article : Google Scholar : PubMed/NCBI
|
|
9
|
Tahira T, Ishizaka Y, Itoh F, Nakayasu M,
Sugimura T and Nagao M: Expression of the ret proto-oncogene in
human neuroblastoma cell lines and its increase during neuronal
differentiation induced by retinoic acid. Oncogene. 6:2333–2338.
1991.PubMed/NCBI
|
|
10
|
Nagao M, Ishizaka Y, Nakagawara A, Kohno
K, Kuwano M, Tahira T, Itoh F, Ikeda I and Sugimura T: Expression
of ret proto-oncogene in human neuroblastomas. Jpn J Cancer Res.
81:309–312. 1990. View Article : Google Scholar : PubMed/NCBI
|
|
11
|
Arighi E, Borrello MG and Sariola H: RET
tyrosine kinase signaling in development and cancer. Cytokine
Growth Factor Rev. 16:441–467. 2005. View Article : Google Scholar : PubMed/NCBI
|
|
12
|
Enomoto H, Crawford PA, Gorodinsky A,
Heuckeroth RO, Johnson EM Jr and Millbrandt J: RET signaling is
essential for migration, axonal growth and axon guidance of
developing sympathetic neurons. Development. 128:3963–3974.
2001.PubMed/NCBI
|
|
13
|
Ernsberger U: The role of GDNF family
ligand signalling in the differentiation of sympathetic and dorsal
root ganglion. Cell Tissue Res. 333:353–337. 2008. View Article : Google Scholar : PubMed/NCBI
|
|
14
|
Zwick E, Bange J and Ullrich A: Receptor
tyrosine kinase signalling as a target for cancer intervention
strategies. Endocr Relat Cancer. 8:161–173. 2001. View Article : Google Scholar : PubMed/NCBI
|
|
15
|
Mulligan LM: RET revisited: Expanding the
oncogenic portfolio. Nat Rev Cancer. 14:173–186. 2014. View Article : Google Scholar : PubMed/NCBI
|
|
16
|
Airaksinen MS, Titievsky A and Saarma M:
GDNF family neurotrophic factor signaling: Four masters, one
servant? Mol Cell Neurosci. 13:313–325. 1999. View Article : Google Scholar : PubMed/NCBI
|
|
17
|
Santoro M, Carlomagno F, Melillo RM and
Fusco A: Dysfunction of the RET receptor in human cancer. Cell Mol
Life Sci. 61:2954–2964. 2004. View Article : Google Scholar : PubMed/NCBI
|
|
18
|
Santoro M, Melillo RM, Carlomagno F,
Vecchio G and Fusco A: Minireview: RET: Normal and abnormal
functions. Endocrinology. 145:5448–5451. 2004. View Article : Google Scholar : PubMed/NCBI
|
|
19
|
Tahira T, Ishizaka Y, Itoh F, Sugimura T
and Nagao M: Characterization of ret proto-oncogene mRNAs encoding
two isoforms of the protein product in a human neuroblastoma cell
line. Oncogene. 5:97–102. 1990.PubMed/NCBI
|
|
20
|
Tsui-Pierchala BA, Ahrens RC, Crowder RJ,
Milbrandt J and Johnson EM Jr: The long and short isoforms of Ret
function as independent signaling complexes. J Biol Chem.
277:34618–34625. 2002. View Article : Google Scholar : PubMed/NCBI
|
|
21
|
Takahashi M, Buma Y and Taniguchi M:
Identification of the ret proto-oncogene products in neuroblastoma
and leukemia cells. Oncogene. 6:297–301. 1991.PubMed/NCBI
|
|
22
|
Ikeda I, Ishizaka Y, Tahira T, Suzuki T,
Onda M, Sugimura T and Nagao M: Specific expression of the ret
proto-oncogene in human neuroblastoma cell lines. Oncogene.
5:1291–1296. 1990.PubMed/NCBI
|
|
23
|
Itoh F, Ishizaka Y, Tahira T, Yamamoto M,
Miya A, Imai K, Yachi A, Takai S, Sugimura T and Nagao M:
Identification and analysis of the ret proto-oncogene promoter
region in neuroblastoma cell lines and medullary thyroid carcinomas
from MEN2A patients. Oncogene. 7:1201–1206. 1992.PubMed/NCBI
|
|
24
|
Hofstra RM, Cheng NC, Hansen C, Stulp RP,
Stelwagen T, Clausen N, Tommerup N, Caron H, Westerveld A, Versteeg
R and Buys CH: No mutations found by RET mutation scanning in
sporadic and hereditary neuroblastoma. Hum Genet. 97:362–364. 1996.
View Article : Google Scholar : PubMed/NCBI
|
|
25
|
Peaston AE, Camacho ML, Norris MD, Haber
M, Marsh DJ, Robinson BG, Hyland VJ and Marshall GM: Absence of
MEN2A- or 2B-type RET mutations in primary neuroblastoma tumour
tissue. Mol Cell Probes. 12:239–242. 1998. View Article : Google Scholar : PubMed/NCBI
|
|
26
|
DAlessio A, De Vita G, Cali G, Nitsch L,
Fusco A, Vecchio G, Santelli G, Santoro M and de Franciscis V:
Expression of the RET oncogene induces differentiation of SK-N-BE
neuroblastoma cells. Cell Growth Differ. 6:1387–1394.
1995.PubMed/NCBI
|
|
27
|
Bunone G, Borrello MG, Ricetti R,
Bongarzone I, Peverali FA, de Franciscis V, Della Valle G and
Pierotti MA: Induction of RET proto-oncogene expression in
neuroblastoma cells precedes neuronal differentiation and is not
mediated by protein synthesis. Exp Cell Res. 217:92–99. 1995.
View Article : Google Scholar : PubMed/NCBI
|
|
28
|
Cerchia L, DAlessio A, Amabile G, Duconge
F, Pestourie C, Tavitian B, Libri D and de Franciscis V: An
autocrine loop involving Ret and Glial cell-derived neurotrophic
factor mediates retinoic acid-induced neuroblastoma cell
differentiation. Mol Cancer Res. 4:481–488. 2006. View Article : Google Scholar : PubMed/NCBI
|
|
29
|
Lee RHK, Wong WL, Chan CH and Chan SY:
Differential effects of glial cell line-derived neurotrophic factor
and neurturin in RET/GFRalpha1-expressing cells. J Neurosci Res.
83:80–90. 2006. View Article : Google Scholar : PubMed/NCBI
|
|
30
|
Uchida M, Enomoto A, Fukuda T, Kurokawa K,
Maeda K, Kodama Y, Asai N, Hasegawa T, Shimono Y, Jijiwa M, et al:
Dok-4 regulates GDNF-dependent neurite outgrowth through downstream
activation of Rap1 and mitogen-activated protein kinase. J Cell
Sci. 119:3067–3077. 2006. View Article : Google Scholar : PubMed/NCBI
|
|
31
|
Ishida M, Ichihara M, Mii S, Jijiwa M,
Asai N, Enomoto A, Kato T, Majima A, Ping J, Murakumo Y and
Takahashi M: Sprouty2 regulates growth and differentiation of human
neuroblastoma cells through RET tyrosine kinase. Cancer Sci.
98:815–821. 2007. View Article : Google Scholar : PubMed/NCBI
|
|
32
|
Oppenheimer O, Cheung NK and Gerald WL:
The RET oncogene is a critical componenet of transcriptional
programs associated with retinoic acid-induced differentiation in
neuroblastoma. Mol Cancer Ther. 6:1300–1309. 2007. View Article : Google Scholar : PubMed/NCBI
|
|
33
|
Yamada S, Nomura T, Uebersax L, Matsumoto
K, Fujita S, Miyake M and Miyake J: Retinoic acid induces
functional c-Ret tyroine kinase in human neuroblastoma.
Neuroreport. 18:359–363. 2007. View Article : Google Scholar : PubMed/NCBI
|
|
34
|
Iwamoto T, Taniguchi M, Wajjwalku W,
Nakashima I and Takahashi M: Neuroblastoma in a transgenic mouse
carrying a metallothionein/ret fusion gene. Br J Cancer.
67:504–507. 1993. View Article : Google Scholar : PubMed/NCBI
|
|
35
|
Takada N, Isogai E, Kawamoto T, Nakanishi
H, Todo S and Nakagawara A: Retinoic acid-induced apoptosis of the
CHP134 neuroblastoma cell line is associated with nuclear
accumulation of p53 and is rescued by the GDNF/Ret signal. Med
Pediatr Oncol. 36:122–126. 2001. View Article : Google Scholar : PubMed/NCBI
|
|
36
|
Futami H and Sakai R: RET protein promotes
non-adherent growth of NB-39-nu neuroblastoma cell line. Cancer
Sci. 100:1034–1039. 2009. View Article : Google Scholar : PubMed/NCBI
|
|
37
|
Esposito CL, DAlessio A, de Franciscis V
and Cerchia L: A cross-talk between TrkB and Ret tyrosine kindases
receptors mediates neuroblastoma cells differentiation. PLoS One.
3:e16432008. View Article : Google Scholar : PubMed/NCBI
|
|
38
|
Peterson S and Bogenmann E: The RET and
TRKA pathways collaborate to regulate neuroblastoma
differentiation. Oncogene. 23:213–225. 2004. View Article : Google Scholar : PubMed/NCBI
|
|
39
|
Azar CG, Scavarda NJ, Nakagawara A and
Brodeur GM: Expression and function of the nerve growth factor
receptor (TRK-A) in human neuroblastoma cell lines. Prog Clin Biol
Res. 385:169–175. 1994.PubMed/NCBI
|
|
40
|
Brodeur GM, Nakagawara A, Yamashiro DJ,
Ikegaki N, Liu XG, Azar CG, Lee CP and Evans AE: Expression of
TrkA, TrkB and TrkC in human neuroblastomas. J Neurooncol.
31:49–55. 1997. View Article : Google Scholar : PubMed/NCBI
|
|
41
|
Croucher JL, Iyer R, Li N, Molteni V,
Loren J, Gordon WP, Tuntland T, Liu B and Brodeur GM: TrkB
inhibition by GNF-4256 slows growth and enhances chemotherapeutic
efficacy in neuroblastoma xenografts. Cancer Chemother Pharmacol.
75:131–141. 2015. View Article : Google Scholar : PubMed/NCBI
|
|
42
|
Eggert A, Ikegaki N, Liu X, Chou TT, Lee
VM, Trojanowski JQ and Brodeur GM: Molecular dissection of TrkA
signal transduction pathways mediating differentiation in human
neuroblastoma cells. Oncogene. 19:2043–2051. 2000. View Article : Google Scholar : PubMed/NCBI
|
|
43
|
Eggert A, Ikegaki N, Liu XG and Brodeur
GM: Prognostic and biological role of neurotrophin-receptor TrkA
and TrkB in neuroblastoma. Klin Padiatr. 212:200–205. 2000.
View Article : Google Scholar : PubMed/NCBI
|
|
44
|
Evans AE, Kisselbach KD, Liu X, Eggert A,
Ikegaki N, Camoratto AM, Dionne C and Brodeur GM: Effect of CEP-751
(KT-6587) on neuroblastoma xenografts expressing TrkB. Med Pediatr
Oncol. 36:181–184. 2001. View Article : Google Scholar : PubMed/NCBI
|
|
45
|
Ho R, Eggert A, Hishiki T, Minturn JE,
Ikegaki N, Foster P, Camoratto AM, Evans AE and Brodeur GM:
Resistance to chemotherapy mediated by TrkB in neuroblastomas.
Cancer Res. 62:6462–6466. 2002.PubMed/NCBI
|
|
46
|
Ho R, Minturn JE, Simpson AM, Iyer R,
Light JE, Evans AE and Brodeur GM: The effect of P75 on Trk
receptors in neuroblastomas. Cancer Lett. 305:76–85. 2011.
View Article : Google Scholar : PubMed/NCBI
|
|
47
|
Iyer R, Evans AE, Qi X, Ho R, Minturn JE,
Zhao H, Balamuth N, Maris JM and Brodeur GM: Lestaurtinib enhances
the antitumor efficacy of chemotherapy in murine xenograft models
of neuroblastoma. Clin Cancer Res. 16:1478–1485. 2010. View Article : Google Scholar : PubMed/NCBI
|
|
48
|
Iyer R, Varela CR, Minturn JE, Ho R,
Simpson AM, Light JE, Evans AE, Zhao H, Thress K, Brown JL and
Brodeur GM: AZ64 inhibits TrkB and enhances the efficacy of
chemotherapy and local radiation in neuroblastoma xenografts.
Cancer Chemother Pharmacol. 70:477–486. 2012. View Article : Google Scholar : PubMed/NCBI
|
|
49
|
Iyer R, Wehrmann L, Golden RL, Naraparaju
K, Croucher JL, MacFarland SP, Guan P, Kolla V, Wei G, Cam N, et
al: Entrectinib is a potent inhibitor of Trk-driven neuroblastomas
in a xenograft mouse model. Cancer Lett. 372:179–186. 2016.
View Article : Google Scholar : PubMed/NCBI
|
|
50
|
Nakagawara A, Arima-Nakagawara M, Scavarda
NJ, Azar CG, Cantor AB and Brodeur GM: Association between high
levels of expression of the TRK gene and favorable outcome in human
neuroblastoma. N Engl J Med. 328:847–854. 1993. View Article : Google Scholar : PubMed/NCBI
|
|
51
|
Nakagawara A, Azar CG, Scarvarda NJ and
Brodeur GM: Expression and function of TRK-B and BDNF in human
neuroblastomas. Mol Cell Biol. 14:759–767. 1994. View Article : Google Scholar : PubMed/NCBI
|
|
52
|
Redden RA, Iyer R, Brodeur GM and Doolin
EJ: Rotary bioreactor culture can discern specific behavior
phenotypes in Trk-null and Trk-expressing neuroblastoma cell lines.
In Vitro Cell Dev Biol Anim. 50:188–193. 2014. View Article : Google Scholar : PubMed/NCBI
|
|
53
|
Wickham H: Ggplot2: Elegant Graphics for
Data Analysis. Springer-Verlag. (New York, NY). 2009.
|
|
54
|
Schwarzer G, Carpenter JR and Rucker G:
Meta-Analysis with R (Use-R!). Springer International Switzerland.
(Basel). 2015.
|
|
55
|
Baloh RH, Tansey MG, Lampe PA, Fahrner TJ,
Enomoto H, Simburger KS, Leitner ML, Araki T, Johnson EM Jr and
Milbrandt J: Artemin, a novel member of the GDNF ligand family,
supports peripheral and central neurons and signals through the
GFRalpha3-RET receptor complex. Neuron. 21:1291–1302. 1998.
View Article : Google Scholar : PubMed/NCBI
|
|
56
|
Masure S, Geerts H, Cik M, Hoefnagel E,
Van Den Kieboom G, Tuytelaars A, Harris S, Lesage AS, Leysen JE,
Van Der Helm L, et al: Enovin, a member of the glial
cell-line-derived neurotrophic factor (GDNF) family with growth
promoting activity on neuronal cells. Existence and tissue-specific
expression of different splice variants. Eur J Biochem.
266:892–902. 1999. View Article : Google Scholar : PubMed/NCBI
|
|
57
|
Hishiki T, Nimura Y, Isogai E, Kondo K,
Ichimiya S, Nakamura Y, Ozaki T, Sakiyama S, Hirose M, Seki N, et
al: Glial cell line-derived neurotrophic factor/neurturin-induced
differentiation and its enhancement by retinoic acid in primary
human neuroblastomas expressing c-Ret, GFRalpha-1 and GFRalpha-2.
Cancer Res. 58:2158–2165. 1998.PubMed/NCBI
|
|
58
|
Tansey MG, Baloh RH, Milbrandt J and
Johnson EM Jr: GFRalpha-mediated localization of RET to lipid rafts
is required for effective downstream signaling, differentiation,
and neuronal survival. Neuron. 25:611–623. 2000. View Article : Google Scholar : PubMed/NCBI
|
|
59
|
Pierchala BA, Milbrandt J and Johnson EM
Jr: Glial cell line-derived neurotrophic factor-dependent
recruitment of Ret into lipid rafts enhances signaling by
partitioning Ret from proteasome-dependent degradation. J Neurosci.
26:2777–2787. 2006. View Article : Google Scholar : PubMed/NCBI
|
|
60
|
Richardson DS, Lai AZ and Mulligan LM: RET
ligand-induced internalization and its consequences for downstream
signaling. Oncogene. 25:3206–3211. 2006. View Article : Google Scholar : PubMed/NCBI
|
|
61
|
Lundgren T, Luebke M, Stenqvist A and
Ernfors P: Differential membrane compartmentalization of Ret by
PTB-adaptor engagement. FEBS J. 275:2055–2066. 2008. View Article : Google Scholar : PubMed/NCBI
|
|
62
|
Tsui-Pierchala BA, Millbrandt J and
Johnson EM Jr: NGF utilizes c-Ret via a novel GFL-independent,
inter-RTK signaling mechanism to maintain the trophic status of
mature sympathetic neurons. Neuron. 33:261–273. 2002. View Article : Google Scholar : PubMed/NCBI
|