Introduction
Acute graft-versus-host disease (GVHD) is a serious
complication following allogeneic hematopoietic stem cell
transplantation (1); at present,
its pathogenesis remains unclear. A number of studies have
demonstrated that T lymphocyte activation is the initial factor for
the occurrence of acute GVHD (2–4).
Therefore, inhibition of T cell activation may ameliorate acute
GVHD.
Cytotoxic T lymphocyte antigen-4 (CTLA-4) is a
transmembrane protein expressed on T cells and is a major
inhibitory receptor on T cells (5).
It transfers inhibitory signals to activated T cells to reduce
their level of activation (5). A
further study revealed that during acute GVHD, expression of CTLA-4
is downregulated, leading to enhanced T cell activation (6). Yoo et al (7) demonstrated that in a mouse model of
acute GVHD, following overexpression of CTLA-4 in T cells, the
degree of T cell activation declined and the apoptosis of T cells
increased, resulting in a decreased severity of acute GVHD. These
studies indicated that CTLA-4 may play a negative role in the
regulation of acute GVHD.
It has previously been reported that the expression
of T-cell immune response cDNA 7 (TIRC7) is increased in patients
with acute GVHD and decreased following treatment, and that with
the progression of acute GVHD, there are higher expression levels
of inducible TIRC7 (8); previous
studies have reported that TIRC7 is the upstream regulatory
molecule of CTLA-4 (9–11). However, whether TIRC7 modulates the
development and progression of acute GVHD by regulating CTLA-4
remains poorly understood.
The present study demonstrated that when TIRC7
expression was downregulated, CTLA-4 levels were decreased and
STAT3 phosphorylation was reduced, with elevated activation of T
lymphocytes, and secretion of interferon (IFN)-γ and other
cytokines. In the in vivo experiment, the mice injected with
antibodies against TIRC7 and CTLA-4 had the lowest acute GVHD
scores, longest average survival time and shortest hematopoietic
reconstitution recovery time. These findings suggested that TIRC7
decreases the development and progression of acute GVHD by
regulating CTLA-4 and T cell activation.
Materials and methods
Separation and activation of
CD4+ T lymphocytes
Peripheral blood mononuclear cells were isolated
from patients with acute GVHD using Ficoll-Paque Plus (Sinopharm
Chemical Reagent Co., Ltd.). For each experiment, 1×10⁷
cells/ml were resuspended in RPMI-1640 medium (Gibco; Thermo Fisher
Scientific, Inc.) supplemented with 10% fetal calf serum (Gibco;
Thermo Fisher Scientific, Inc.). CD4+ T lymphocytes were
purified with negative selection using magnetic beads according to
the manufacturer's protocol (Miltenyi Biotec, Inc.), and then
CD4+ T cells were generated by stimulation with anti-CD3
and anti-CD28 Dynabeads (Invitrogen; Thermo Fisher Scientific,
Inc.) for 3–7 days. Written informed consent was provided by all
participants included in the present study. Ethical approval for
the present study was obtained from the Medical Ethics Committee of
the Affiliated Hospital of Xuzhou Medical University.
Construction of pGPU6-shTIRC7 and
FLAG-CTLA-4
The present study obtained the cDNA sequence of the
TIRC7 gene from GeneBank (NM_006019.3) and designed two short
hairpin (sh)RNAs for TIRC7 and one non-specific sequence (control
group) using Primer 5.0 (Premier Biosoft International). After the
oligonucleotide fragments were synthesized by Invitrogen (Thermo
Fisher Scientific, Inc.), these fragments were inserted into a
pGPU6/Neo linearized vector digested by EcoRI and
KpnI. The plasmids pGPU6-shTIRC7 and pGPU6-shcontrol were
constructed and sequenced by Invitrogen (Thermo Fisher Scientific,
Inc.) following the transformation of competenT cells. The primers
of shTIRC7-1, shTIRC7-2 and shcontrol were as follows: shTIRC7-1,
5′-CACCGGACCTGAGGGTCAACTTTGTTTCAAGAGAACAAAGTTGACCCTCAGGTCCTTTTTTG-3′
and
5′-GATCCAAAAAGGACCTGAGGGTCAACTTTGTTCTCTTGAAACAAAGTTGACCCTCAGGTCC-3′;
shTIRC7-2,
5′-CACCGCTTCCTCATTGCCAGCTTCATTCAAGAGATGAAGCTGGCAATGAGGAAGCTTTTTTG-3′
and
5′-GATCCAAAAAAGCTTCCTCATTGCCAGCTTCATCTCTTGAATGAAGCTGGCAATGAGGAAGC-3′;
shcontrol,
5′-CACCGTTCTCCGAACGTGTCACGTCAAGAGATTACGTGACACGTTCGGAGAATTTTTTG-3′
and
5′-GATCCAAAAAATTCTCCGAACGTGTCACGTAATCTCTTGACGTGACACGTTCGGAGAAC-3′.
cDNA was obtained from peripheral blood mononuclear cells of
patients with acute GVHD, and the full-length sequence of human
CTLA-4 cDNA was cloned into a CMV expression vector p3×FLAG-CMV™-14
and termed FLAG-CTLA-4. CTLA-4 primers were: Forward,
5′-GGGAATTCATGGCTTGCCTTGGATTTC-3′ and reverse,
5′-GGGGTACCCGATTGATGGGAATAAAATAAGG-3′. The sequence of FLAG-CTLA-4
was validated by Invitrogen (Thermo Fisher Scientific, Inc.). PCR
was performed using a polymerase purchased from Invitrogen (cat.
no. F531S; Thermo Fisher Scientific, Inc.). The following
conditions for PCR were set: 94°C for 2 min, followed by 35 cycles
of 94°C for 30 sec, 61°C for 30 sec and 72°C for 2 min, with a
final extension at 72°C for 10 min.
CD4+ T cells transfected by
electroporation
The activated CD4+ T cells
(2×10⁷ cells) were transfected transiently with
pGPU6-shTIRC7/FLAG-CTLA-4 (10 µg/well) by electroporation methods
using a Neon™ device according to the manufacturer's protocol
(Invitrogen; Thermo Fisher Scientific, Inc.). Cells were cultured
in RPMI-1640 medium; expression of the plasmid was selected for
using G418 (500 µg/ml; Gibco; Thermo Fisher Scientific, Inc.).
After culture for 48 h, RNA and protein were collected and
monitored by reverse transcription-quantitative PCR (RT-qPCR) and
western blotting.
Measurement of TIRC7 and CTLA-4 via
western blotting
The transfected CD4+ T cells were
collected and lysed using cell lysis buffer (cat. no. 9803; Cell
Signaling Technology, Inc.). Protein concentrations were determined
via the bicinchoninic acid method, and protein (30 µg/lane) was
separated via 5–10% SDS-PAGE. Nitrocellulose membranes were blocked
using 5% bovine serum albumin (cat. no. V900933; Sigma-Aldrich;
Merck KGaA) in TBS-0.05% Tween-20 for 1 h at room temperature, and
then underwent western blotting analysis using anti-CTLA-4
monoclonal antibody (1 µg/ml; cat. no. ab110650; Abcam) with
horseradish peroxidase (HRP)-conjugated goat anti-mouse IgG
(1:10,000; cat. no. AP124P; EMD Millipore) as the secondary
antibody. TIRC7 protein level was measured by anti-TIRC7 polyclonal
antibody (1 µg/ml; cat. no. sc-293491; Santa Cruz Biotechnology,
Inc.) with HRP-conjugated goat anti-mouse IgG (1:5,000; cat. no.
AP124P; EMD Millipore) as the secondary antibody. The temperature
and duration of primary and secondary antibody incubations were
overnight at 4°C and 2 h at room temperature, respectively. An ECL
detection system was purchased from Thermo Fisher Scientific, Inc.
(cat. no. 32106).
RT-qPCR to measure TIRC7 and
CTLA-4
RT-qPCR analysis was performed as previously
described (12). RNA was extracted
from the peripheral blood of patients using Ficoll-Paque Plus
(Sinopharm Chemical Reagent Co., Ltd.) and reverse transcribed to
cDNA using a PrimeScript RT kit (Takara Bio, Inc.) according to the
manufacturer's protocols. Then, qPCR was performed using
LightCycler480 (Roche Diagnostics). The qPCR system (20 µl) was
established in triplicate as follows: 10 µl SYBR® Green
Supermix (Bio-Rad Laboratories, Inc.), 5 µl cDNA, 4 µl
ddH2O, 0.5 µl forward primer (10 µmol/l) and 0.5 µl
reverse primer (10 µmol/l). The following conditions were used:
94°C for 2 min, followed by 35 cycles of 94°C for 30 sec, 60°C for
30 sec and 72°C for 35 sec, and a final extension at 72°C for 2
min. The quantification cycle (Cq) was calculated using the
2−ΔΔCq method (13). The
primers of TIRC7 were forward, 5′-TTTGCTGTGTTGACTGTGGC-3′ and
reverse, 5′-CACTTCGGAGAAGCAGGGATT-3′. The primers of CTLA-4 were
forward, 5′-TGTGCCACGACATTCACAGA-3′ and reverse,
5′-CATGCCCACAAAGTATGGCG-3′. Forward and reverse primers of β-actin
were 5′-ATGGAGGGGAATACAGCCC-3′ and 5′-TTCTTTGCAGCTCCTTCGTT-3′,
respectively.
Measurement of STAT3
The luciferase reporter gene pGL-3-STAT3-luciferase
(GLSTAT3-Lu) was synthesized by Beijing Yuan Ping Hao Biotechnology
Co., Ltd. pGL-3-Basic was used in the control group. After
GLSTAT3-Lu/pGL-3-Basic (10 µg/well) and FLAG-CTLA-4/FLAG (10
µg/well) were transfected into CD4+ T cells
(2×10⁷ cells) by electroporation methods using a Neon™
device according to the manufacturer's protocol (Invitrogen; Thermo
Fisher Scientific, Inc.) for 48 h, luciferase reporter gene
activity was assessed using a dual-luciferase reporter gene assay
kit, according to the manufacturer's protocol (Promega
Corporation). The luciferase detection device used was a
96-microplate luminometer (Promega Corporation) and secreted
alkaline phosphatase (cat. no. KA1362; Abnova) was used to
normalize luciferase activity. Each experiment was repeated three
times. STAT3 and phosphorylated (p)STAT3 protein levels were also
monitored via western blotting. Anti-STAT3 (1:5,000; cat. no.
ab119352) and anti-pSTAT3 (1:10,000; cat. no. ab76315) were both
obtained from Abcam.
Proliferation of CD4+ T
cells
Transfected CD4+ T cells were collected
and the concentration was adjusted to 2×10⁵ cells/ml.
Cells were added to 96-well plates with 100 µl in each well and
incubated at 37°C and 5% CO2. At 24, 48 and 72 h after
incubation, Cell Counting Kit-8 (CCK-8; Takara Bio, Inc.) was added
(10 µl/well). The optical density at 450 nm was measured using a
microplate reader (Thermo Fisher Scientific, Inc.) at 4 h after
adding CCK-8.
Flow cytometry
CD4+ T cells transfected with FLAG-CTLA-4
were collected and a total of 1×10⁷ cells were suspended
in 2 ml medium. Phycoerythrin (PE)-conjugated pSTAT antibody (1:50;
cat. no. 612569; BD Biosciences) was incubated for 1 h at room
temperature. The data were collected using FACSCalibur (BD
Biosciences) and analyzed by CellQuest software version 5.1 (BD
Biosciences).
Annexin V (eBioscience; Thermo Fisher Scientific,
Inc.) and 7-aminoactinomycin D (7-AAD; eBioscience; Thermo Fisher
Scientific, Inc.) were utilized to label apoptotic CD4+
T cells. Incubation with Annexin V was performed at room
temperature for 15 min. Analysis was performed on FACSCalibur using
CellQuest software version 5.1. Annexin V-positive and
7-AAD-negative cells were defined as apoptotic cells, and the cells
without added Annexin V and 7-AAD were used as the negative control
group.
Analysis of Th cells via flow cytometry was
performed as previously described (14). Anti-CD3-FITC (cat. no. 11-0037-42),
anti-CD8-peridinin-chlorophyll (PerCP)/cyanine 5.5 (cat. no.
45-0081-82), PE-conjugated anti-human interleukin (IL)-17 (cat. no.
12-7177-81) and IL-22 (cat. no. 12-7229-42), and allophycocyanin
(APC)-conjugated anti-human IFN-γ (cat. no. 17-7319-82) and
anti-human IL-4 (cat. no. 17-7041-82) were all purchased from
eBioscience (all 1:20; Thermo Fisher Scientific, Inc.). Cells were
fixed in 100 µl fixative solution (4% formaldehyde in PBS; cat. no.
R37602; eBioscience; Thermo Fisher Scientific, Inc.) for 15 min at
room temperature, before 100 µl permeabilization solution (0.5%
Triton X-100; cat. no. R37602) was added for 5 min at room
temperature. Phorbol myristate acetate (1 µl/ml), ionomycin (1
µl/ml) and brefeldin A (2 µl/ml) were obtained from Sigma Aldrich
(Merck KGaA) and incubated with cells at 37°C for 4–6 h. Antibody
incubations were performed at room temperature for 15 min. The
analysis was performed using FACSCalibur and these data were
analyzed by CellQuest software version 5.1.
Mice
Specific pathogen-free C57BL/6 mice
(H-2Kb; age, 8–12 weeks; 18–22 g; 20 male mice) were
selected as donor mice with BALB/c mice (H-2Kd; age,
8–12 weeks; 18–22 g; 172 male mice) as recipients. The mice were
purchased from Shanghai SLAC Laboratory Animal Co. Ltd. Mice were
housed in sterilized microisolator cages and maintained in the
individually ventilated cage room of the Experimental Animal Center
of Xuzhou Medical University. The temperature and relative humidity
of the room were 19–21°C and ~50%, respectively. Animals were
maintained on an 12:12-h light/dark cycle. Water was autoclaved,
and feed was purchased from Shanghai Pluton Biotechnology Co., Ltd.
Food and water were provided ad libitum. Then, they were
kept on autoclaved acidified water (pH 2.5) for the week before
transplantation and the first week after transplantation. The
experiments were approved by the Animal Committee of Xuzhou Medical
University and all protocols were performed in accordance with the
Institutional Animal Care and Use Committee guidelines.
Acute GVHD mice model
C57BL/6 mice were sacrificed by cervical
dislocation, immersed in iodine volts for 5 min, and the tibia and
femur were aseptically separated. After removing the attached
muscles and fascia, the metaphysis was cut open. The bone marrow
cavity was washed with PBS. Then, a single cell suspension was
produced by filtering through a 220-mesh stainless steel strainer.
The bone marrow cells were prepared following centrifugation at 4°C
and 800 × g for 5 min and suspended in PBS buffer. BALB/c mice were
given 7.5 Gy lethal total body irradiation [total body irradiation
(TBI), 60Co γ-ray source at 0.66 Gy/min] and injected
with bone marrow cells isolated from C57BL/6 mice via the tail vein
within 6 h. The mice were randomly divided into 10 groups as
follows: i) Transplantation control (control) group, normal saline;
ii) TBI group, no cell infusion; iii) A1 group, donor bone marrow
cells (5×10⁶/mouse) + splenic lymphocytes
(5×10⁵/mouse); iv) A2 group, donor bone marrow cells
(5×10⁶/mouse) + splenic lymphocytes
(5×10⁵/mouse) + CTLA-4 monoclonal antibody (40 µg/day);
v) A3 group, donor bone marrow cells (5×10⁶/mouse) +
splenic lymphocytes (5×10⁵/mouse) + TIRC7 monoclonal
antibody (25 µg/day); vi) A4 group, donor bone marrow cells
(5×10⁶/mouse) + splenic lymphocytes
(5×10⁵/mouse) + CTLA-4 monoclonal antibody (40 µg/day) +
TIRC7 monoclonal antibody (25 µg/day); vii) B1 group, donor bone
marrow cells (5×10⁶/mouse) + splenic lymphocytes
(5×10⁶/mouse); viii) B2 group, donor bone marrow cells
(5×10⁶/mouse) + splenic lymphocytes
(5×10⁶/mouse) + CTLA-4 monoclonal antibody (40 µg/day);
ix) B3 group, donor bone marrow cells (5×10⁶/mouse) +
splenic lymphocytes (5×10⁶/mouse) + TIRC7 monoclonal
antibody (25 µg/day); and x) B4 group, donor bone marrow cells
(5×10⁶/mouse) + splenic lymphocytes
(5×10⁶/mouse) + CTLA-4 monoclonal antibody (40 µg/day) +
TIRC7 monoclonal antibody (25 µg/day). There were 6 mice in the
control and TBI groups, and 20 mice in each of the last 8 groups.
CTLA-4 and TIRC7 monoclonal antibodies were custom-generated by
Wuhan GeneCreate Biological Engineering Co., Ltd., and administered
by intraperitoneal injection. The optimal dosing time of CTLA-4
antibody was day 0 post-transplantation and its optimal dose was 40
µg/mouse; the optimal dose and dosing time of TIRC7 antibody was 25
µg/mouse and day 0, 1, 2, 3, 4 and 7 post-transplantation.
Observation index
post-transplantation
The survival of mice was monitored daily and their
survival times were recorded. The degree of clinical acute GVHD was
assessed weekly using a scoring system (15) that integrates the following clinical
parameters: Weight loss, posture, activity, fur and skin integrity.
A total of 30 days after the transplantation,
FITC-anti-H-2Kd (0.1 mg/ml; cat. no. MA5-18010) and
PE-anti-H-2Kb (0.1 mg/ml; cat. no. MA5-18000) monoclonal
antibodies (eBioscience; Thermo Fisher Scientific, Inc.) were used
to detect the allogenic chimerism of transplanted mice by flow
cytometry. On days 7, 14, 21, 28 and 35 post-transplantation, 3
mice/group were sacrificed by cervical dislocation; liver, lung and
colon tissues obtained from the mice in each group were examined.
Mice with pathological changes indicative of acute GVHD were
considered as acute GVHD, and changes were scored according to the
Blazar and Kaplan acute GVHD pathological scoring system (16,17)
for the liver, lung and colon. Blood of the recipients in each
group was collected every 7 days post-transplantation. Cells were
stained with anti-mouse IFN-γ-APC and anti-mouse IL-17a-PE, or
anti-mouse IL-4-APC and anti-mouse IL-22-PE. Plasma was isolated
from blood samples prepared following centrifugation at 4°C and 800
× g for 5 min. The levels of T helper (Th) cells were monitored by
flow cytometry. TIRC7 (cat. no. 12649-1-AP; ProteinTech Group,
Inc.) and CTLA-4 (cat. no. KA3352; Abnova) plasma levels were
monitored by ELISA; the relative levels of TIRC7 and CTLA-4 in
mononuclear cells from blood samples were monitored by qPCR.
Statistical analysis
All data were statistically analyzed using SPSS 19.0
software (IBM Corp.). The mean ± standard deviation, as well as the
range and median, were calculated for each variable from three
experimental repeats. Kruskal-Wallis test and Dunn's test were
performed to compare factors, such as white blood cell counts and
GVHD scores in different groups. All P-values were two-tailed.
P<0.05 was considered to indicate a statistically significant
difference.
Results
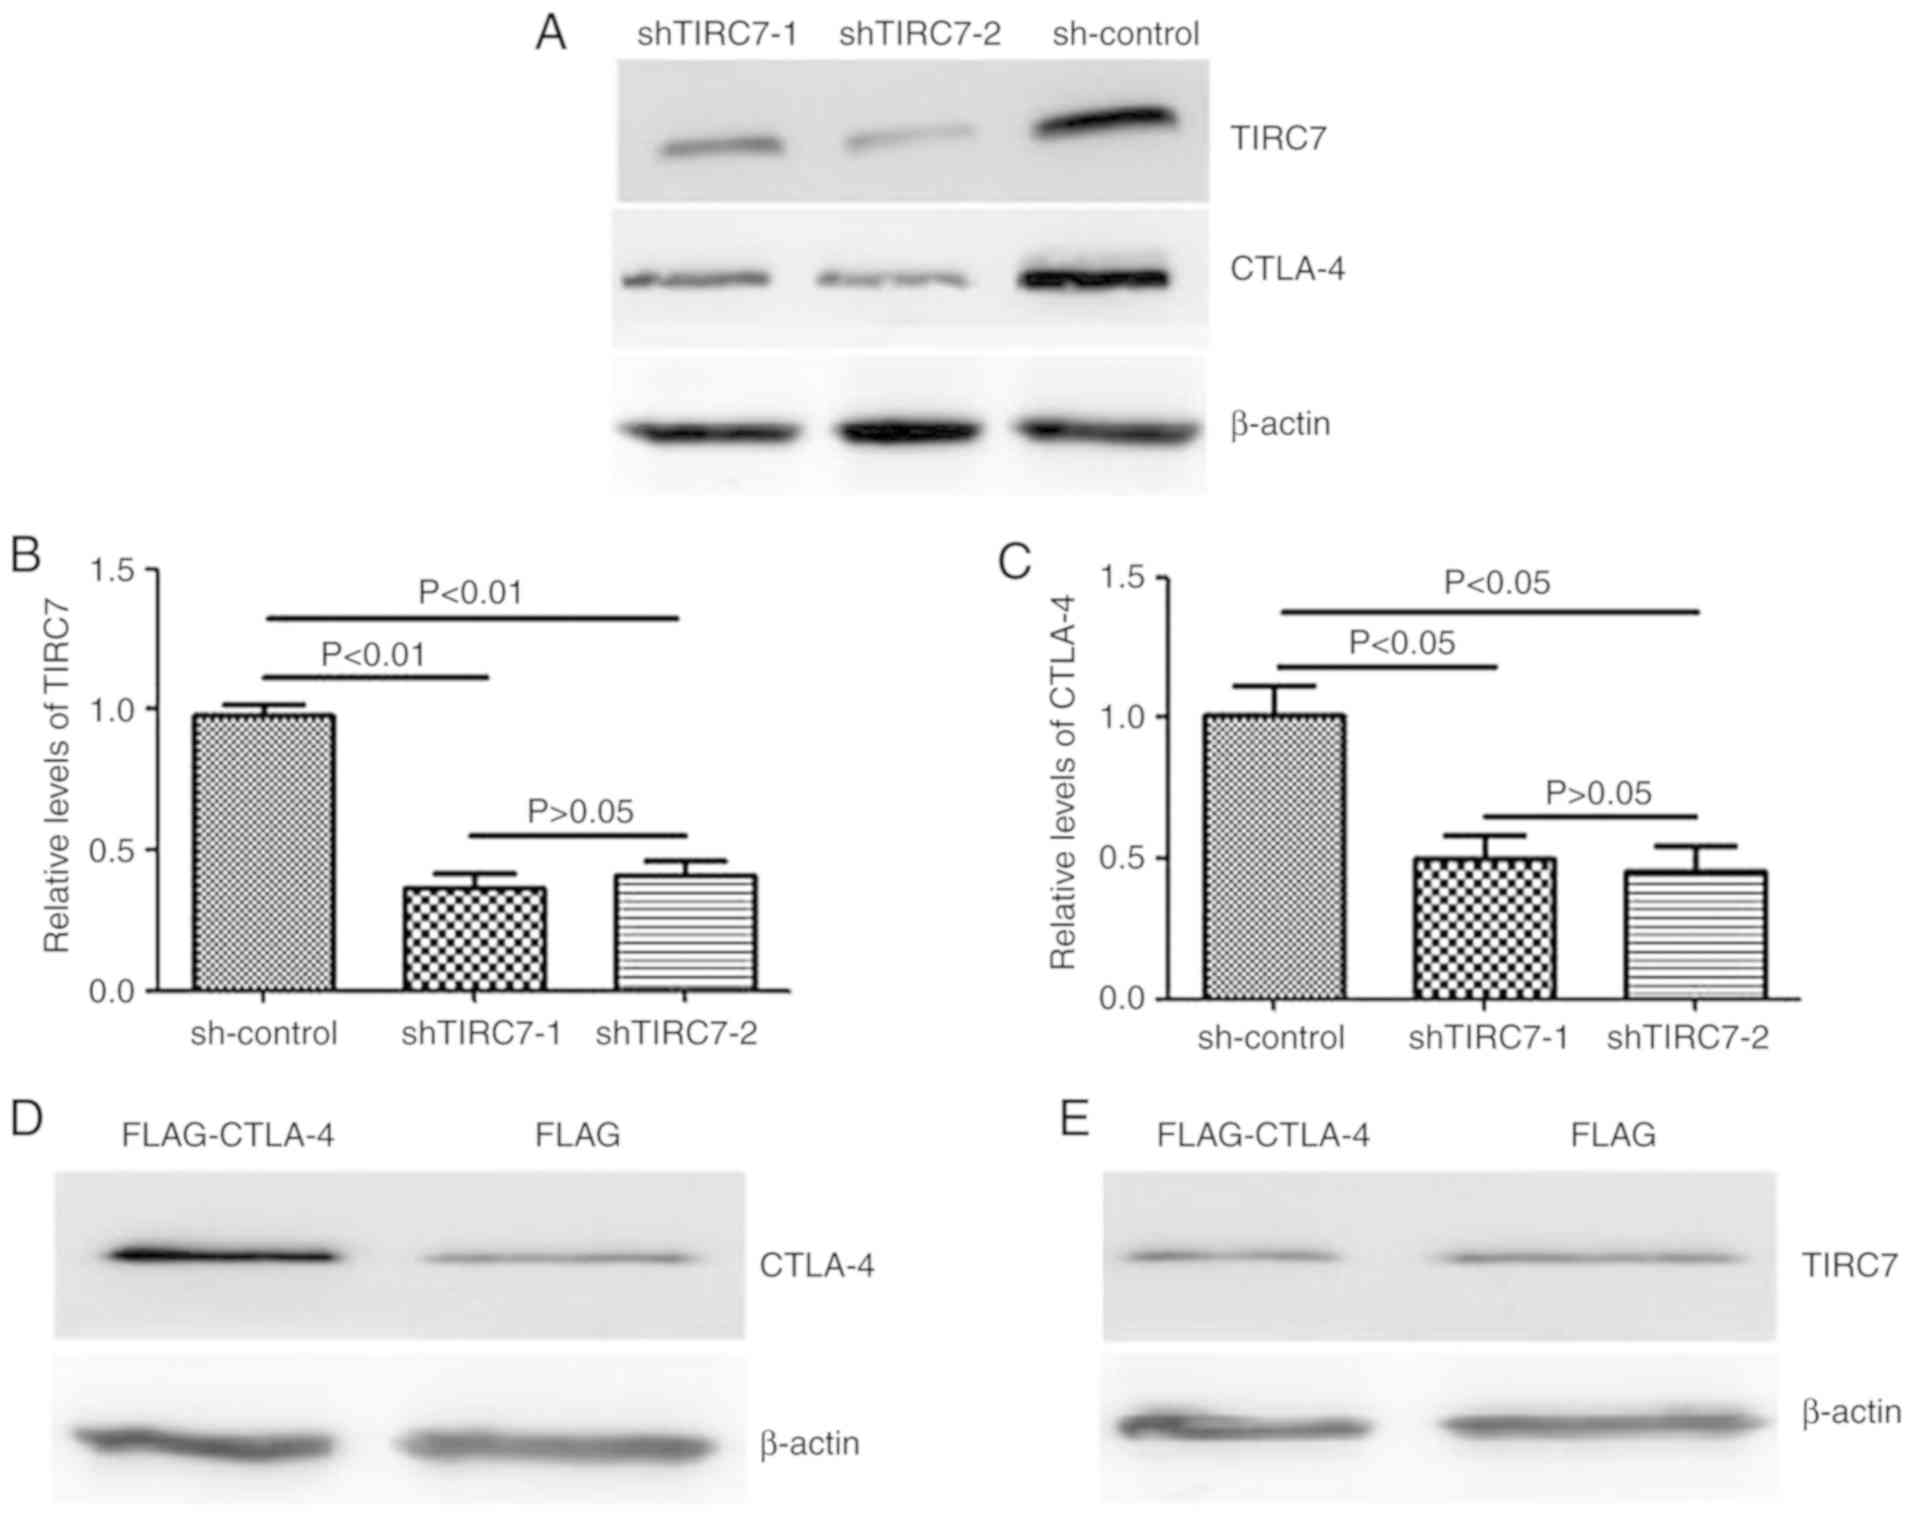
Regulation of the expression of CTLA-4
by TIRC7
pGPU6-shTIRC7 was transfected into CD4+ T
cell by electroporation in order to analyze the regulatory effects
of TIRC7 on CTLA-4 expression using western blotting and qPCR. It
was revealed that in the shTIRC7-1 and shTIRC7-2 groups, TIRC7 and
CTLA-4 protein levels were significantly reduced compared with the
sh-control group (P<0.05); however, there was no significant
difference between the shTIRC7-1 and shTIRC7-2 groups (P>0.05;
Fig. 1A-C).
In addition, CD4+ T cells from the
peripheral blood of patients with acute GVHD were transfected with
FLAG- CTLA-4 to ascertain whether the regulation of CTLA-4 was
affected by the expression of TIRC7. The present study demonstrated
that the expression of CTLA-4 in the FLAG-CTLA-4 group was markedly
higher than that in the control vector-infected group; however,
compared with the FLAG group, there was no notable difference in
the TIRC7 expression level in the FLAG-CTLA-4 group (Fig. 1D and E), suggesting that CTLA-4 had
no effect on the expression of TIRC7.
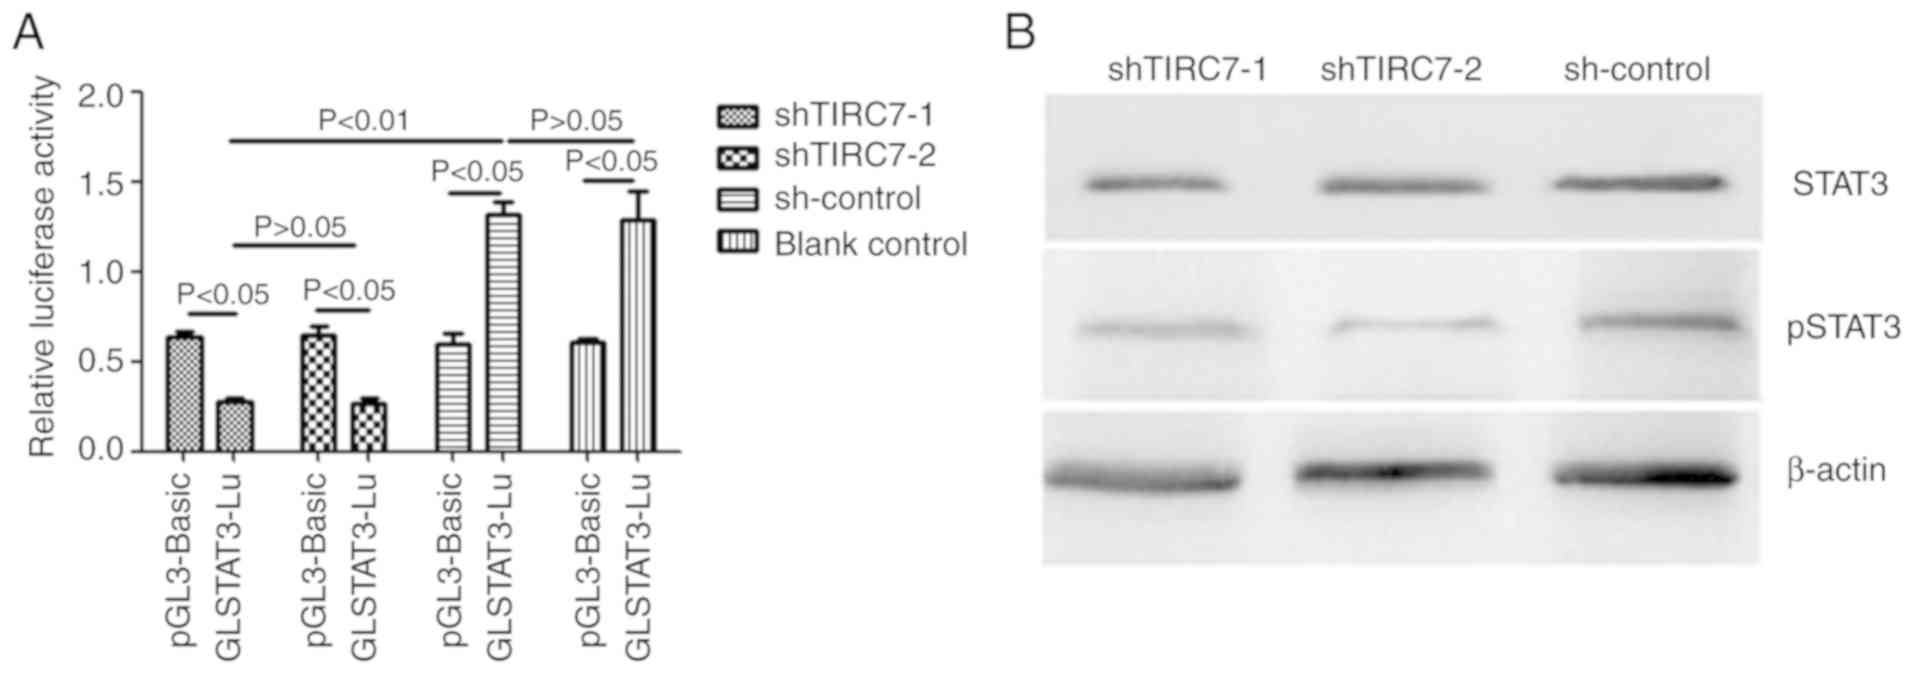
Effects of TIRC7 knockdown on STAT3
luciferase activity, and STAT3 protein expression and
phosphorylation
The luciferase reporter plasmid
GLSTAT3-Lu/pGL-3-basic and shRNA plasmids were co-transfected into
the CD4+ T cells of patients with acute GVHD via
electroporation. After 48 h of culture, the cells were collected
and analyzed using a dual-luciferase reporter gene system. As
presented in Fig. 2A, the
luciferase activity of GLSTAT3-Lu in the shTIRC7-1 and shTIRC7-2
groups were both lower than that of pGL-3-Basic in the shTIRC7-1
and shTIRC7-2 groups (P<0.05). The luciferase activity of
GLSTAT3-Lu in the shTIRC7-1 and shTIRC7-2 groups was decreased
compared with the sh-control and blank control groups (P<0.05);
there was no significant difference in the luciferase activity of
GLSTAT3-Lu between the shTIRC7-1 and shTIRC7-2 groups
(P>0.05).
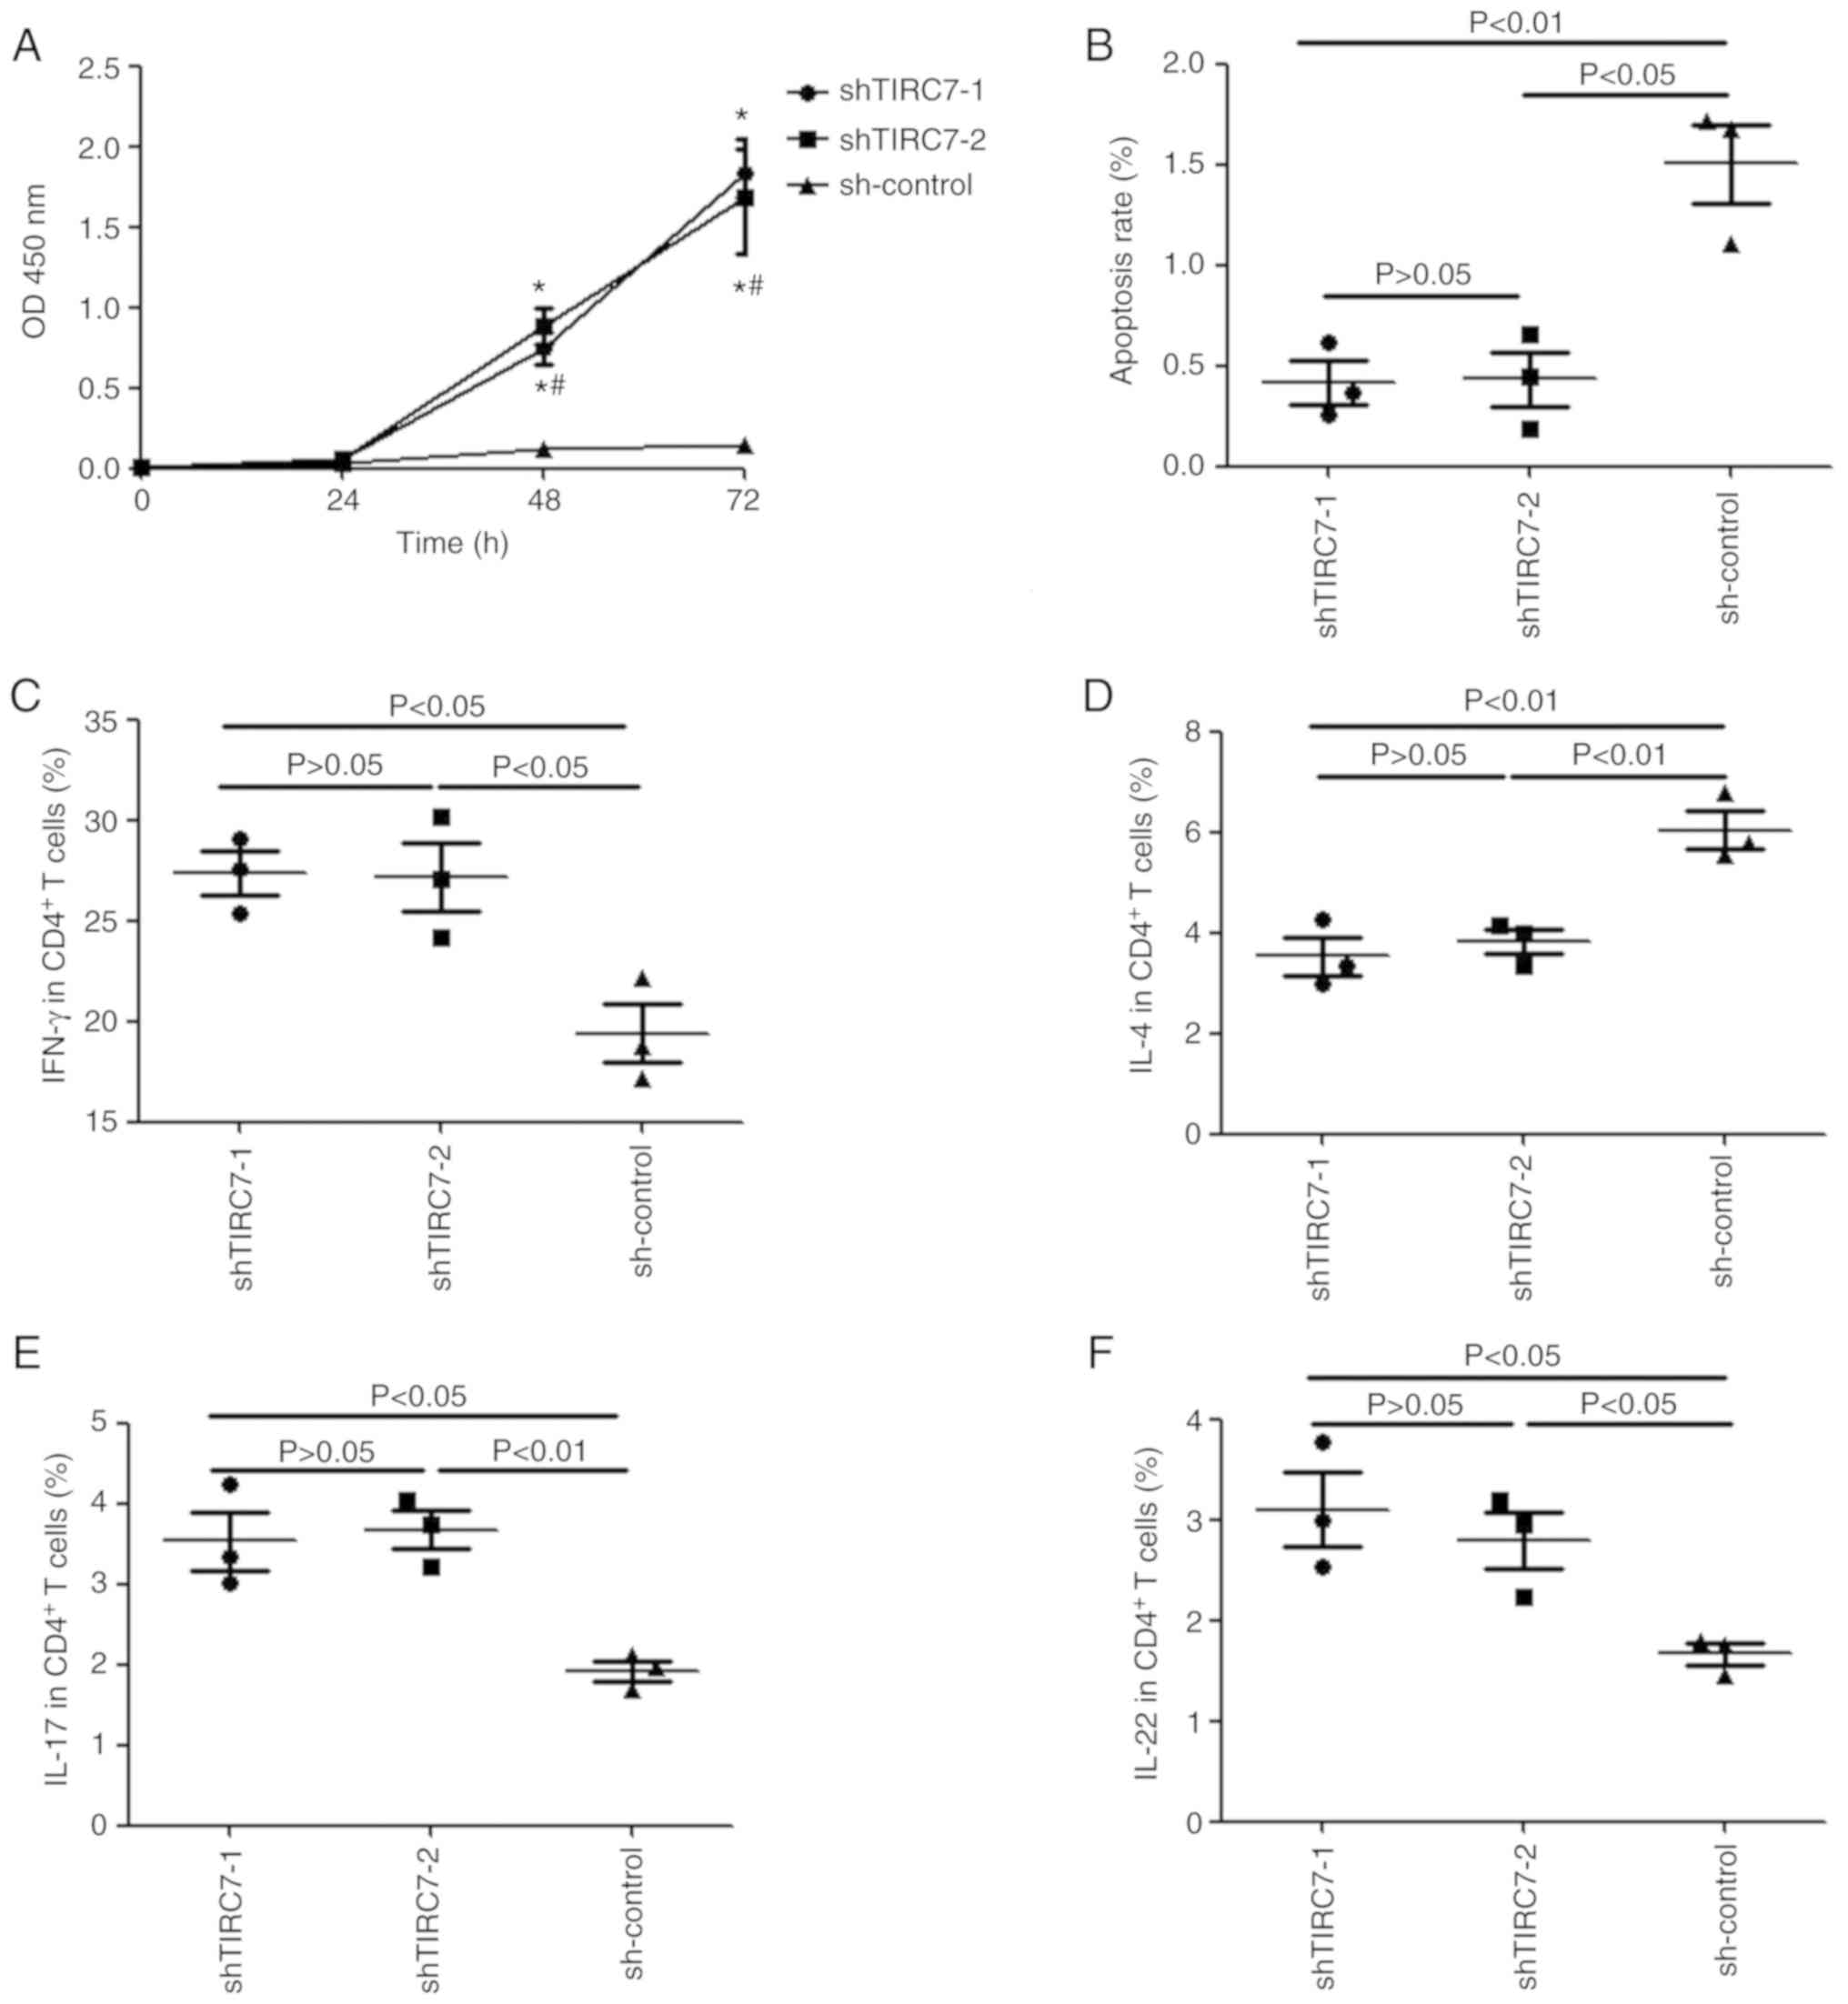
Effects of TIRC7 knockdown on the
proliferation, apoptosis and differentiation of CD4+ T
cells
A CCK-8 assay was used to monitor the proliferation
of CD4+ T cells from patients with acute GVHD. Fig. 3A indicated that there was no
significant difference in the optical density (OD)450 nm
value for the shTIRC7-1, shTIRC7-2 and sh-control groups after
CD4+ T cells were cultured for 24 h (P>0.05);
however, at 48 and 72 h, the OD450 nm value in the
shTIRC7-1 and shTIRC7-2 groups was markedly higher than that in the
sh-control group, particularly at 72 h (P<0.05). However, there
was no significant difference in the OD450 nm value for
the shTIRC7-1 and shTIRC7-2 groups at 48 and 72 h (P>0.05).
Annexin V and 7-AAD were selected to label apoptotic
CD4+ T cells. The apoptotic cell rates of
CD4+ T cells in the shTIRC7-1, shTIRC7-2 and sh-control
groups were 0.42±0.11%, 0.43±0.14% and 1.50±0.20%, respectively;
the apoptosis rates of CD4+ T cells in the shTIRC7-1 and
shTIRC7-2 groups were both significantly lower than that in the
sh-control group (P<0.01 and P<0.05, respectively; Fig. 3B).
IFN-γ, IL-4, IL-17 and IL-22 levels in the
CD4+ T cells from patients with acute GVHD were
monitored via flow cytometry after TIRC7 was downregulated. As
presented in Fig. 3C, E and F,
after TIRC7 was downregulated, compared with those in the
sh-control group, the levels of IFN-γ, IL-17 and IL-22 in
CD4+ T cells in the shTIRC7-1 and shTIRC7-2 groups were
all elevated (P<0.05); however, IL-4 levels in the shTIRC7-1 and
shTIRC7-2 groups were instead downregulated (P<0.01; Fig. 3D). No significant differences in
IFN-γ, IL-4, IL-17 and IL-22 levels were observed between the
shTIRC7-1 and shTIRC7-2 groups (P>0.05).
Survival of mice
post-transplantation
In the acute GVHD mice model, CTLA-4 and TIRC7
monoclonal antibodies were both administered via intraperitoneal
injection. The present study monitored the levels of CTLA-4 and
TIRC7 in recipient mice on day 21 after transplantation, and
revealed that compared with the control group, CTLA-4 plasma levels
and relative expression in each experimental group were decreased,
whereas TIRC7 levels were elevated. Compared with the mice that
were solely administered TIRC7 antibody post-allogeneic bone marrow
transplant (allo-BMT), the mice co-administered with CTLA-4 and
TIRC7 monoclonal antibody exhibited no significant difference in
the expression of TIRC7; nevertheless, the expression of CTLA-4 in
the CTLA-4-alone group was lower than that in the CTLA-4/TIRC7
co-administration group (data not shown). The aforementioned data
suggested successful manipulation of the expression of TIRC7 or
CTLA-4 in mice with acute GVHD after transplantation.
Overall survival of mice after transplantation was
monitored. Table I demonstrates
that the mice in the transplantation control group were all alive,
whereas the mice in the TBI group all died between 5 and 15 days
after allo-BMT, with a median survival time of 8 days. The median
survival time of the A1-A4 groups was 18.0, 27.5, 28.5 and 32.0,
and long-term survival rates were 50, 60, 60 and 70%, respectively.
The median survival time of the A4 group was significantly longer
than that of the A1, A2 and A3 groups (P<0.01, P<0.05 and
P<0.05, respectively). The median survival times of the B1-B4
groups were 14.0, 20.5, 20.5 and 25.0 days, and long-term survival
rates were 10, 20, 20 and 40%, respectively. The median survival
time of the B4 group was significantly longer than that of the B1,
B2 and B3 groups (P<0.01, P<0.05 and P<0.05,
respectively). In the experimental groups, the long-term survival
rate of the A4 group was the highest, which was higher than that of
the B4 group (P<0.01).
 | Table I.Survival of mice after allogeneic
bone marrow transplant. |
Table I.
Survival of mice after allogeneic
bone marrow transplant.
| Group | Median survival
time, days | Long-term survival
rate, % |
|---|
| TBI group | 8.00 | 0 |
| A1 group | 18.00a,d | 50 |
| A2 group | 27.50b,c | 60 |
| A3 group | 28.50b,c | 60 |
| A4 group | 32.00b | 70 |
| B1 group | 14.00a | 10 |
| B2 group | 20.50b,e | 20 |
| B3 group | 20.50b,e | 20 |
| B4 group | 25.00b | 40 |
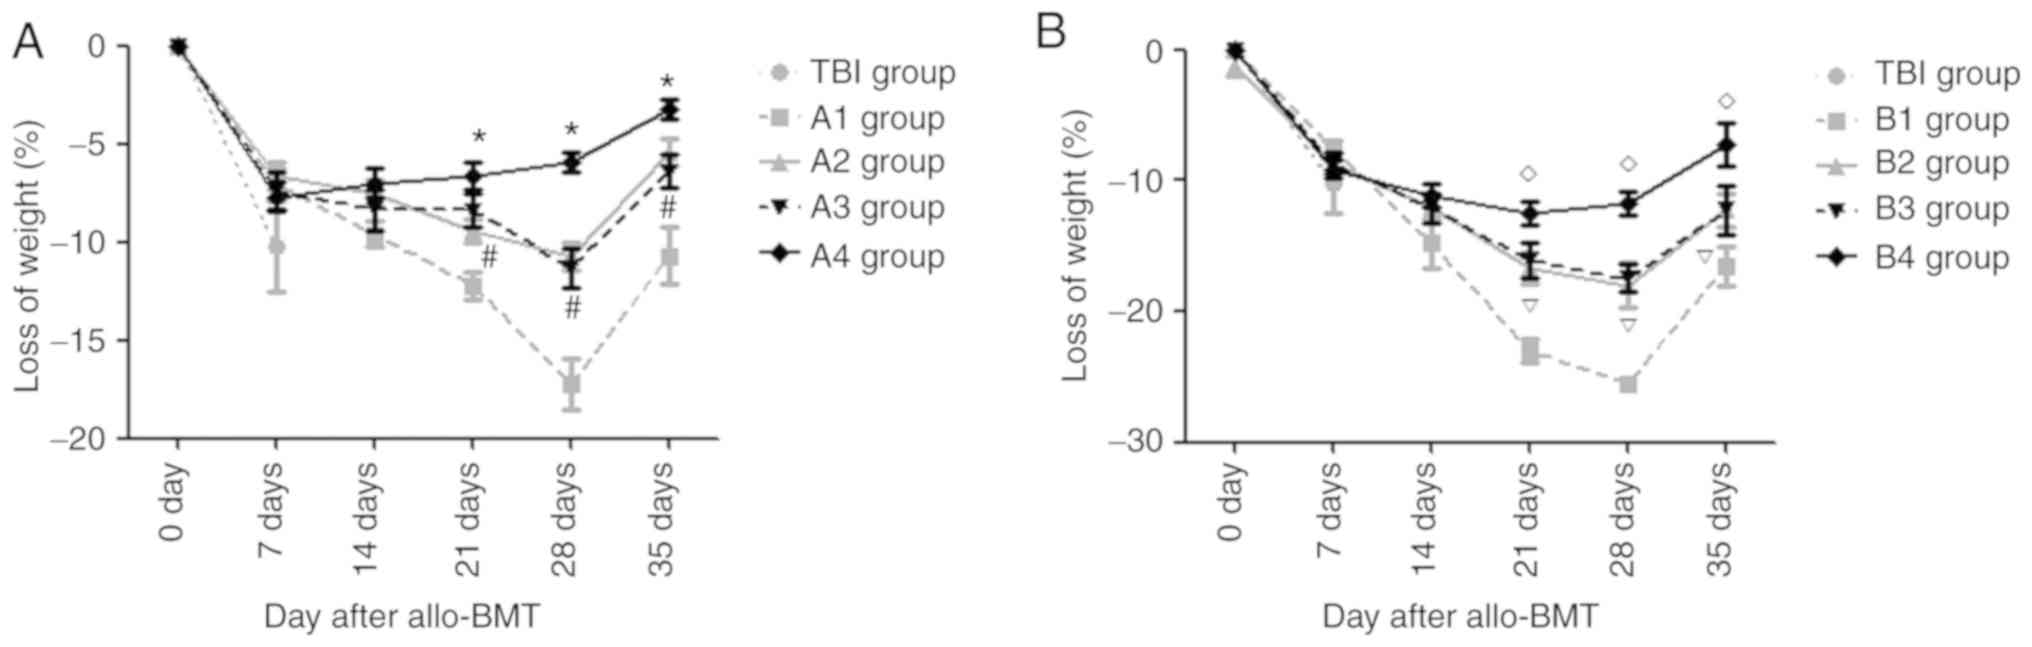
Changes in body weight of recipient
mice
From day 4 post-transplantation, the recipient mice
gradually exhibited decreased activity, ate less and exhibited
decreased body weight. On day 7 after allo-BMT, there was no
significant difference in the magnitude of weight loss between each
experimental group and the TBI group (P>0.05). However, during
the following periods, there were different degrees of improvement
in the body weights of mice in the experimental groups.
Fig. 4A demonstrates
that on day 28 post-transplantation, the mean body weights of mice
in the A1-A3 groups reached their lowest values, following which
body weights began to rise (this does not control for animals that
were sacrificed due to excessive weight loss); however, in the A4
group, the minimum body weight of mice was observed on day 14. On
days 7 and 14 post-allo-BMT, there was no significant difference in
the magnitude of weight loss in the A1-A4 groups (P>0.05). On
days 21, 28 and 35 post-allo-BMT, the magnitude of weight loss in
the A4 group was the lowest compared with that in the A1-A3 groups,
with lower weight loss in the A2 and A3 groups than that in the A1
group (all P<0.05); however, there was no significant difference
between the A2 and A3 groups (P>0.05). The body weights of mice
in the B1-B3 groups reached their lowest point on day 28
post-transplantation, then began to rise; however, in the B4 group,
the minimum body weight of mice was observed on day 14.
In the B group, on days 21, 28 and 35 post-allo-BMT,
the magnitude of weight loss in the B4 group was the lowest, but
was lower in the B2 and B3 groups compared with in the B1 group
(all P<0.05). There was no significant difference in the
magnitude of weight loss between the B2 and B3 groups (P>0.05;
Fig. 4B).
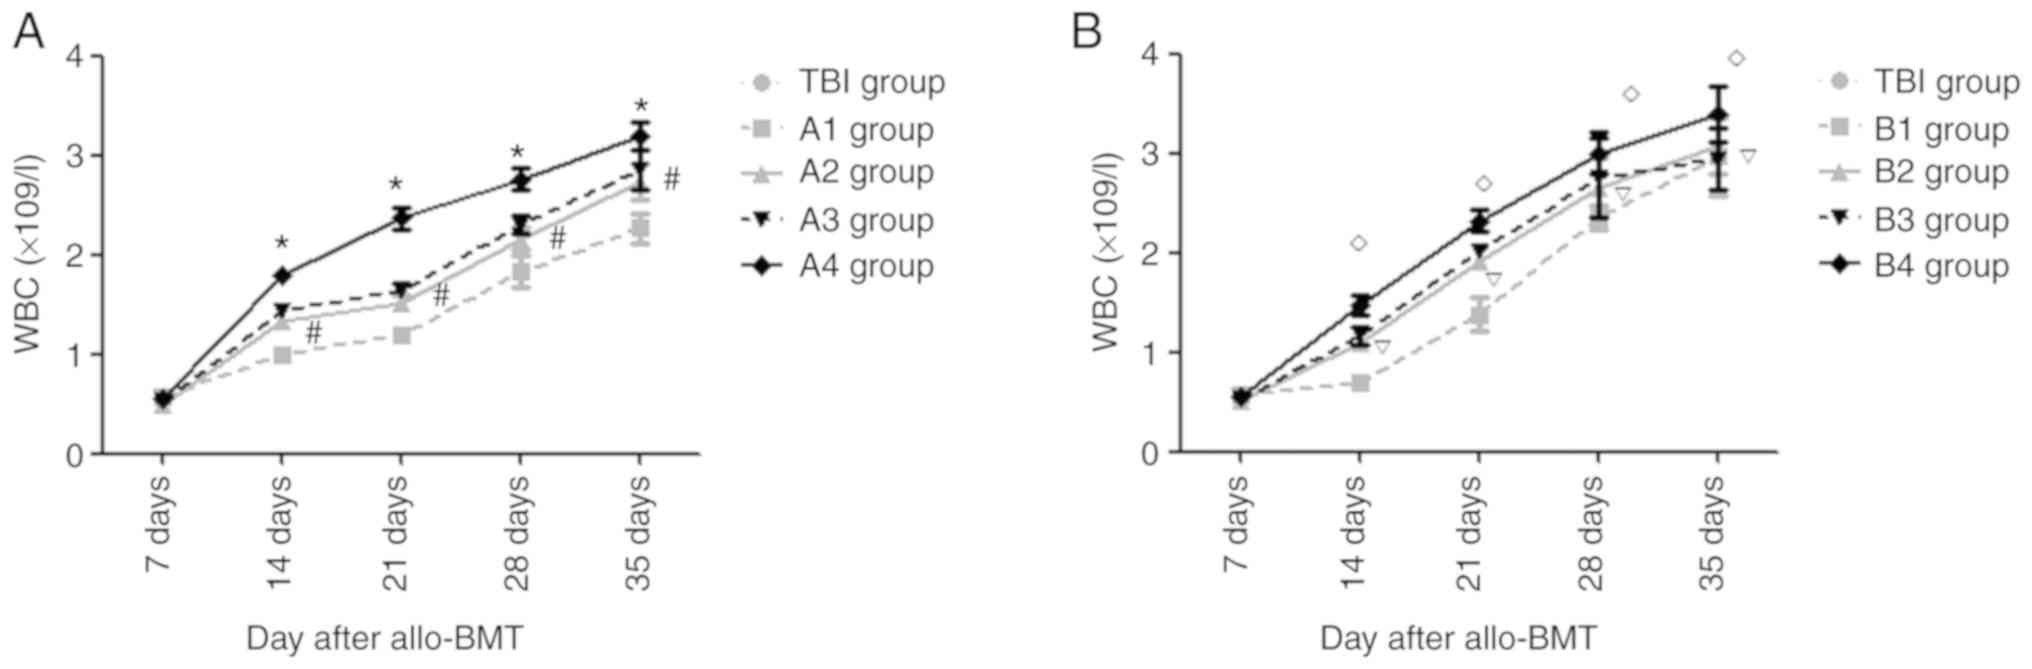
Recovery of hematopoietic
reconstitution in recipient mice
On day 7 post- transplantation, the mean leukocyte
numbers in each group were lowest, without any significant
differences compared with the other experimental groups
(P>0.05).
Fig. 5A demonstrates
that on days 14, 21, 28 and 35 post-allo-BMT, compared with the A1
group, the mean leukocyte counts in the A2-A4 groups were elevated
(P<0.05). The mean leukocyte count in the A4 group was the
highest compared with that in the A1-A3 groups; however, there was
no significant difference between the A2 and A3 groups (P>0.05).
Compared with the B1 group, the mean leukocyte levels in the B2-B4
groups were elevated on days 14, 21, 28 and 35 after
transplantation (P<0.05), with the highest mean leukocyte number
in the B4 group; however, there was no significant difference
between the B2 and B3 groups (P>0.05; Fig. 5B).
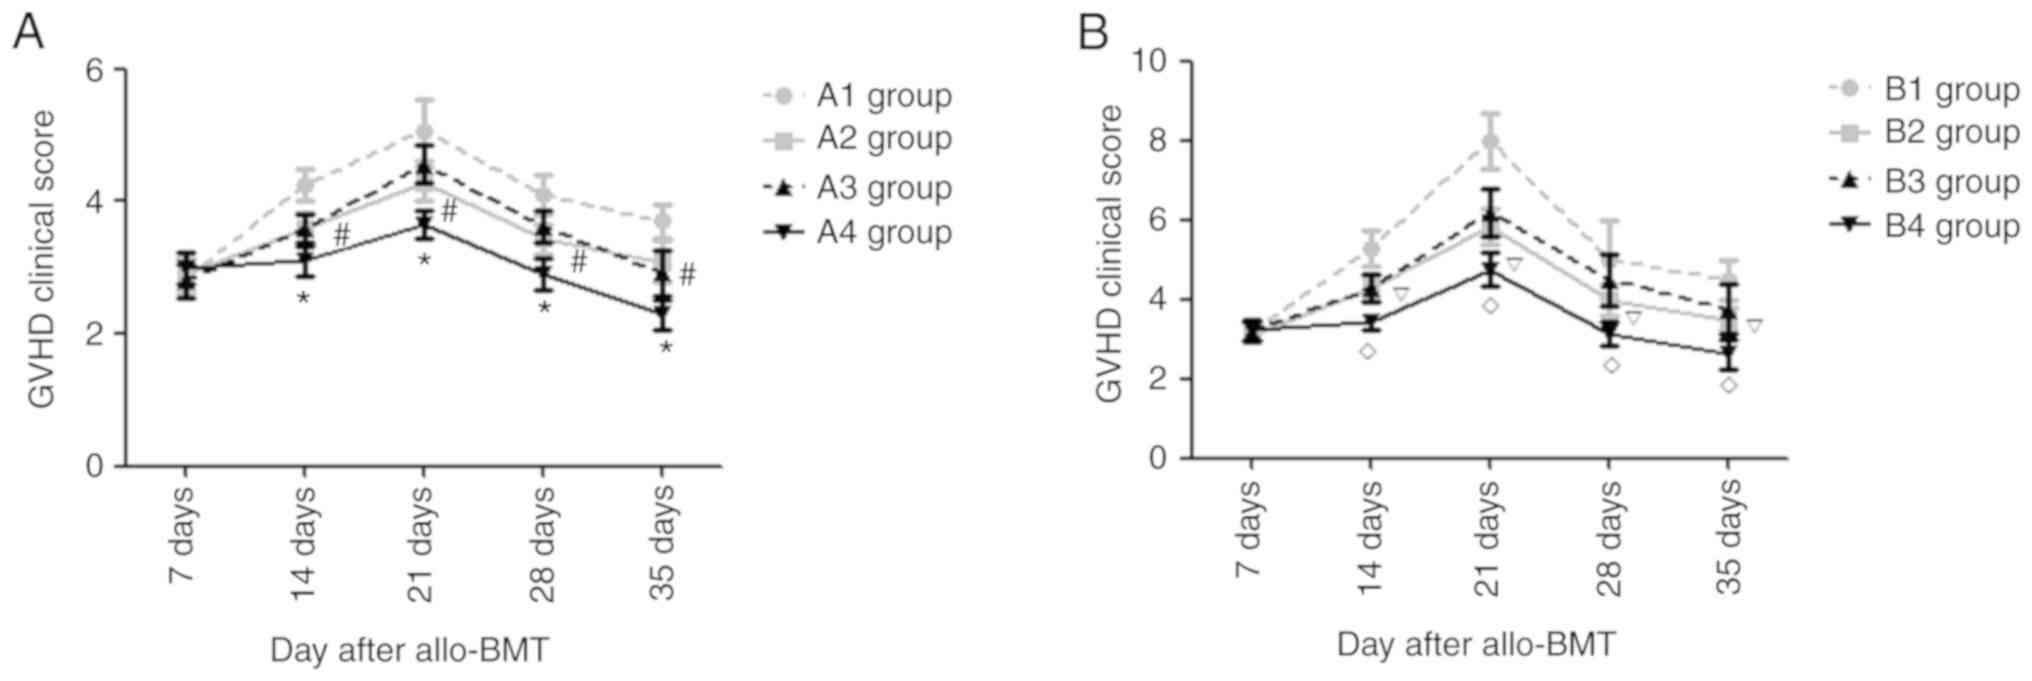
Changes in acute GVHD clinical
scores
After transplantation, the recipient mice in each
experimental group exhibited different degrees of acute GVHD
symptoms, such as anorexia, weight loss, ruffled fur and diarrhea.
At days 14, 21, 28 and 35 post-allo-BMT, there were notable
differences in the degree of diarrhea, weight loss and hunched
posture in the A and B groups. The present study
semi-quantitatively scored the clinical manifestations of recipient
mice in each experimental group after transplantation and, as
presented in Fig. 6, at the
indicated time points, the acute GVHD clinical scores in the mice
of group B were higher than those in group A (P<0.05). In the
mice from group A, the acute GVHD clinical score in the mice of the
A4 group was the lowest (P<0.05), and there was no significant
difference in acute GVHD clinical score between the A2 and A3
groups (P>0.05). At days 14, 21, 28 and 35 after
transplantation, the acute GVHD clinical scores in the B4 group
were the lowest (P<0.05) and those in the B1 group were the
highest (P<0.05), but there was no significant difference in the
acute GVHD clinical scores in the B2 and B3 groups (P>0.05).
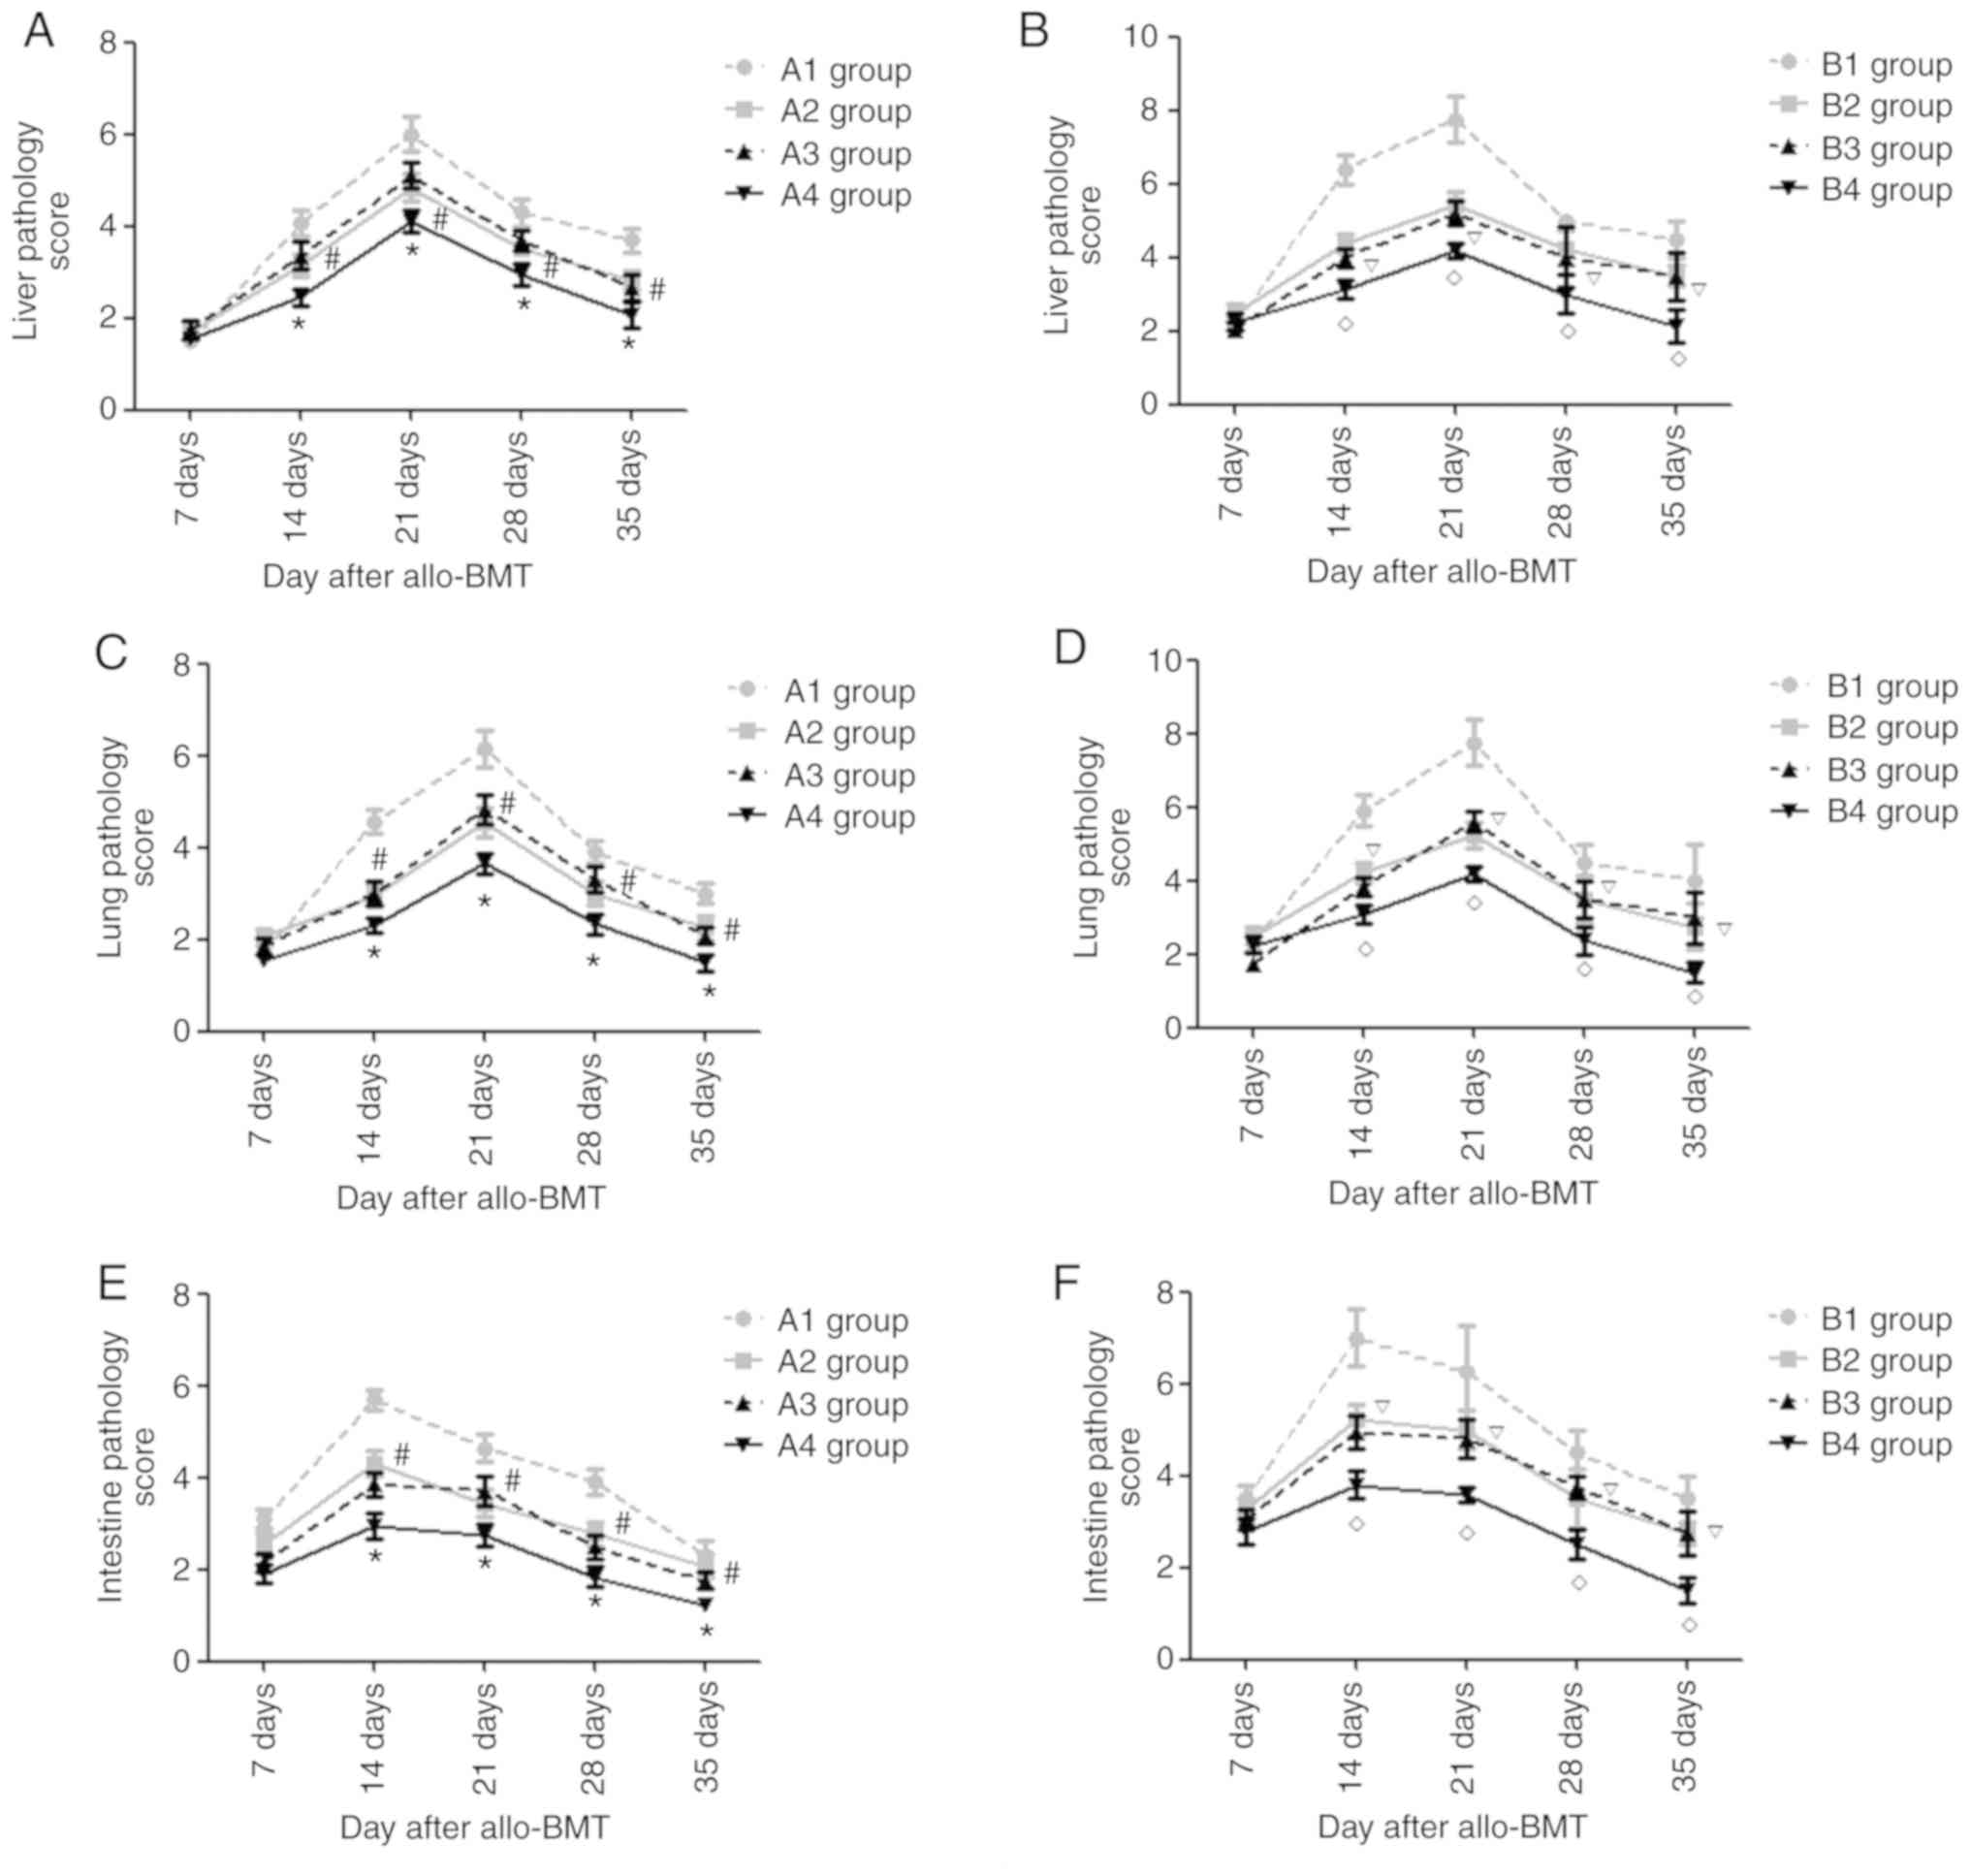
Pathological changes in targeted
organs (liver, lung, colon) after allo-BMT
Starting from day 7 post-transplantation, the
recipient mice in the experimental groups exhibited liver pathology
suggesting acute GVHD, such as liver cell edema and periportal
inflammatory cell infiltration. During the following period, the
severity of the liver pathology increased and peaked at day 21
post-allo-BMT, before gradually decreasing. As presented in
Figs. 7A and B, and S1 and S2, the present study semi-quantitatively
scored the liver pathology of recipient mice in each experimental
group and revealed that on days 14, 21, 28 and 35
post-transplantation, the acute GVHD scores of the liver in the A4
group were lowest compared with those in the A1-A3 groups
(P<0.05) and the acute GVHD scores in the A1 groups were the
highest in the A group (P<0.05). There was no significant
difference in the acute GVHD scores of the liver in the A2 and A3
groups (P>0.05). At the indicated time points, the acute GVHD
scores of the liver in the B4 group were the lowest of B groups
(P<0.05) and there was no significant difference between the B2
and B3 groups (P>0.05). In each experimental group, on day 21
post-transplantation, the acute GVHD scores of the liver in the A4
group were the lowest (P<0.05); however, there were no
significant differences in the acute GVHD scores in the A4 and B4
groups on days 14, 28 and 35 after allo-BMT (P>0.05).
Similarly, the recipient mice in the experimental
groups exhibited lung/colon pathology suggesting acute GVHD, such
as liver cell edema, periportal inflammatory cell infiltration and
necrotic cells in crypts, and infiltration of the lamina propria.
The severity of the lung pathology increased and peaked on day 21
post-allo-BMT, whereas it peaked at day 14 in the colon and then
gradually decreased. As presented in Figs. 7C-F and S3–S6, it
was revealed that at days 14, 21, 28 and 35 post-transplantation,
the acute GVHD scores of lung/colon in the A4 group were lowest
compared with those in the A1-A3 groups (P<0.05) and the acute
GVHD scores in the A1 group were highest in the A group
(P<0.05). There was no significant difference in the acute GVHD
scores of the lung/colon in the A2 and A3 groups (P>0.05). At
the indicated time points, the acute GVHD scores of the lung/colon
in the B4 group were lowest of the experimental B groups
(P<0.05) and there was no significant difference between the B2
and B3 groups (P>0.05).
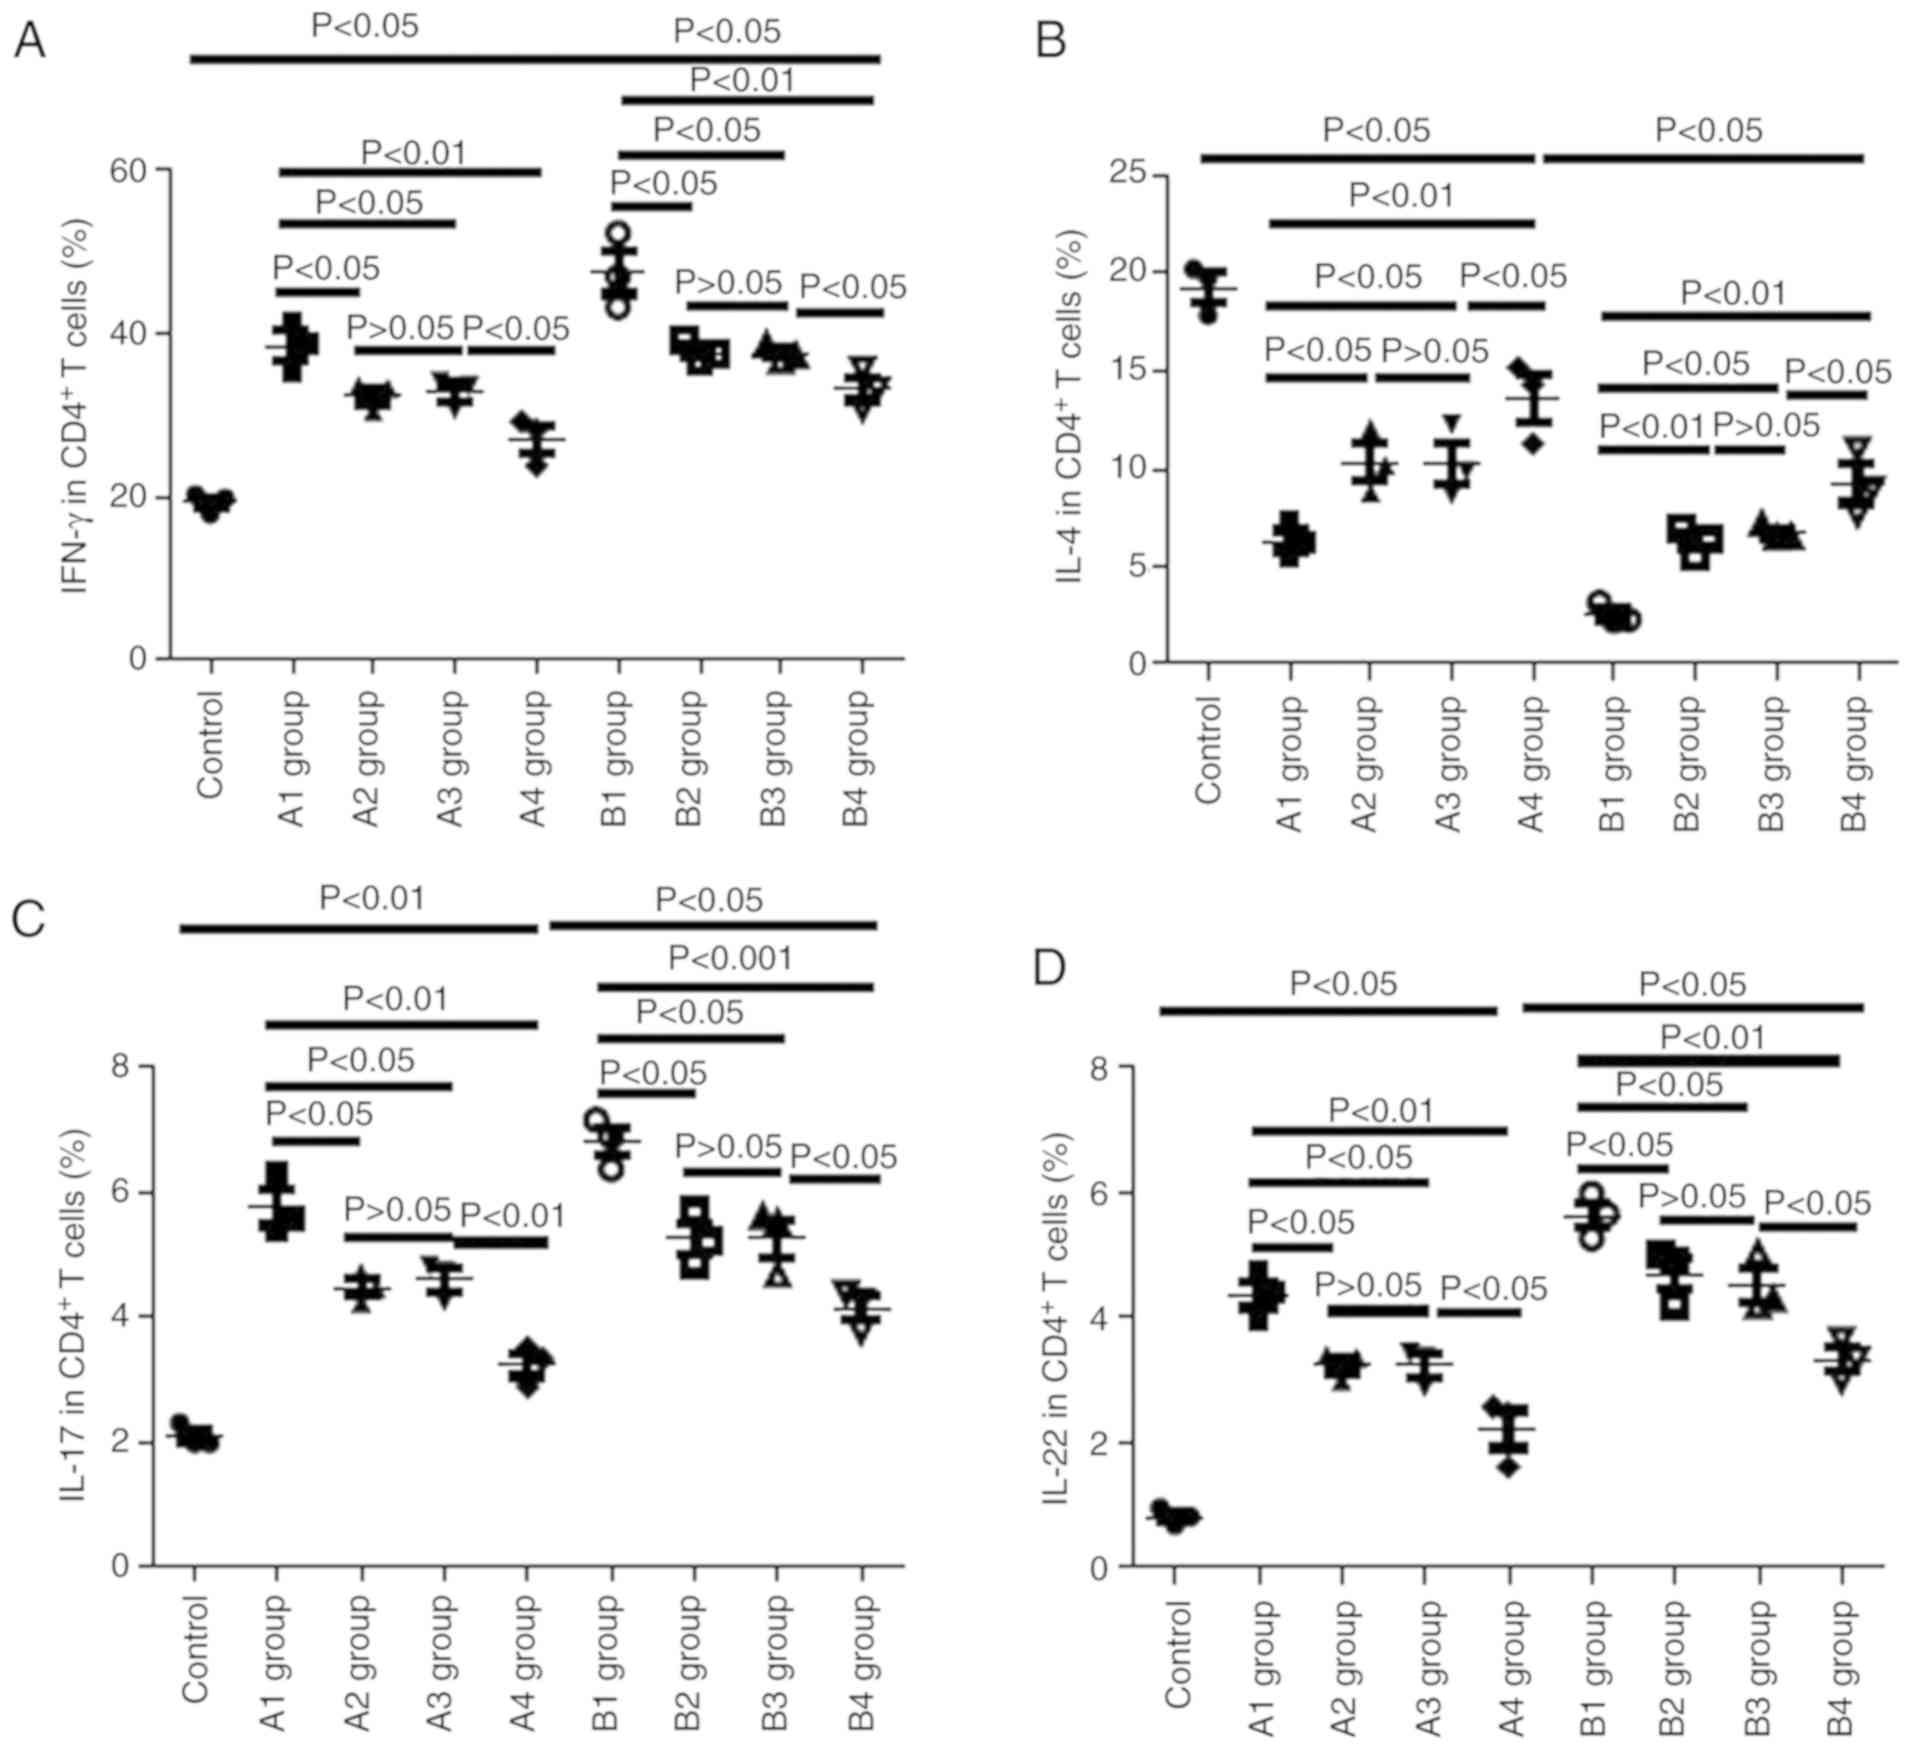
Changes in Th cells in recipient
mice
On day 21 post-allo- BMT, the present study
collected the peripheral blood of recipient mice and monitored the
levels of Th cells via flow cytometry. As presented in Fig. 8, compared with the control group,
the levels of IFN-γ in the A and B groups were markedly elevated,
and IFN-γ levels in the B group were higher than those in the
corresponding A group; for example, IFN-γ levels in the B1 group
were higher than those in the A1 group (P<0.05), IFN-γ levels in
the B2 group were higher than those in the A2 group (P<0.05),
and so on. The levels of IFN-γ in the A1 group were higher than
those in the A2-A4 groups (P<0.05, P<0.05 and P<0.01,
respectively) and there was no significant difference in the IFN-γ
levels between the A2 and A3 groups (P>0.05). In the recipient
mice of the B group, IFN-γ levels in the B4 group were the lowest
(P<0.05) and there was no significant difference in the IFN-γ
levels between the B2 and B3 groups (P>0.05).
As presented in Fig. 8C
and D, similar results were observed for IL-17 and IL-22 levels
as were observed for IFN-γ. Conversely, inverse patterns were
observed for IL-4 levels. In the recipient mice of the A group,
IL-4 levels in the A4 group were the highest (P<0.05), with
those in the A1 group lowest (P<0.05); there was no significant
difference in IL-4 levels between the A2 and A3 groups (P>0.05).
In the recipient mice of the B group, IL-4 levels in the B4 group
were the highest (P<0.05) and there was no significant
difference in IL-4 levels between the B2 and B3 groups
(P>0.05).
Discussion
TIRC7 has been identified to be critical in T cell
activation (9,18); however, the role of TIRC7 in acute
GVHD remains unclear. It has previously been demonstrated that
TIRC7 levels in patients with acute GVHD were higher than healthy
controls, and were also markedly declined following treatment,
suggesting that TIRC7 level may be an indicator to evaluate the
response of patients with acute GVHD to treatment (8). It has been demonstrated that CTLA-4
may play a negative role in the regulation of acute GVHD (6,7). The
present study also demonstrated that CTLA-4 may be involved in the
pathogenesis of acute GVHD, and that it may downregulate Th1 cell
levels by increasing the expression of STAT3 in acute GVHD
(19); meanwhile, other studies
have reported that TIRC7 is the upstream regulatory molecule of
CTLA-4 (9,11). Therefore, the present study
hypothesized that both TIRC7 and CTLA-4 play important roles in
acute GVHD, and that TIRC7 may regulate the expression of CTLA-4 in
acute GVHD. From the results of the present study, it was revealed
that after TIRC7 expression was knocked down, the expression of
CTLA-4 was decreased; however, after CTLA-4 expression was
increased, the expression of TIRC7 was not changed, which supported
the hypothesis that TIRC7 was the upstream molecule of CTLA-4.
According to the previous studies, the intracellular regions of
TIRC7 and CTLA-4 both contain immunoreceptor tyrosine-based
inhibitory motifs (ITIMs); thus, TIRC7 plays a positive role in the
regulation of CTLA-4 expression in other animal models (9,20).
This may contradict the present findings that when acute GVHD
occurred, the level of TIRC7 was elevated, but CTLA-4 levels were
decreased (data not shown). This may be because CTLA-4 is a member
of the immunoglobulin superfamily, which is mainly located on the
surface of Th cells, and the numbers of Th cells decrease after
acute GVHD occurs. Although the activity of CTLA-4 on the surface
of a single Th cell is enhanced, the overall expression of CTLA-4
was downregulated.
Numerous studies have confirmed that the JAK/STAT3
pathway plays an important role in the occurrence and development
of acute GVHD (21,22). Dendritic cells could increase STAT3
expression and decrease the severity of acute GVHD in mouse models
by inhibiting the secretion of cytokines such as IFN-α and IL-12
(23). Ma et al (21) revealed that STAT3 could affect the
secretion of IL-17 and other inflammatory cytokines, and decrease
the severity of acute GVHD by regulating the expression levels of
downstream molecules, such as NF-κB and MAPK. In the present study,
dual-luciferase reporter gene and western blot assays were utilized
to monitor the levels of STAT3 phosphorylation. After cells were
transfected with pGPU6-shTIRC7, STAT3 luciferase reporter gene
plasmid luciferase activity was markedly decreased, as were the
levels of STAT3 phosphorylation. Meanwhile, the activation of T
lymphocytes was enhanced, and the degree of apoptosis in T cells
was decreased with increased secretions of IFN-γ and other
cytokines. Increased levels of IFN-γ, IL-17 and IL-22, and
decreased IL-4 levels were observed in the A and B groups,
indicating an imbalance of Th1/17/22 and Th2 cells in the
pathogenesis of GVHD, consistent with a previous study reporting
that T cell activation was remarkably inhibited, with reduced
levels of IFN-γ, IL-17 and IL-22 (19). From the in vitro results in
the present study, it was indicated that TIRC7 upregulated the
expression of CTLA-4, increased the activation of STAT3, inhibited
the proliferation of T cells, promoted the apoptosis of T cells and
decreased the secretion of cytokines.
Establishing appropriate animal models that
effectively simulate or replicate clinical diseases can aid with
understanding the mechanisms underlying the clinical disease.
Therefore, in order to clarify the specific role of TIRC7 in acute
GVHD, the present study established a mouse model for acute GVHD
with different severities. According to previous studies (24,25),
the severity of acute GVHD is dependent on the splenic lymphocytes
from donor mice. When the splenic lymphocytes were
5×10⁶/mouse, the degree of acute GVHD was
moderate-to-severe. TIRC7 and CTLA-4 monoclonal antibodies were
administered alone or in combination into the recipient mice
post-allo-BMT, and the changes in acute GVHD severity levels were
observed by clinical scores, histopathological examination and
other indicators.
According to the results in vivo, TIRC7 or
CTLA-4 monoclonal antibody intraperitoneally injected could
effectively decrease the severity of acute GVHD and promote
hematopoietic reconstitution; the two antibodies had an additive
effect. Referring to other previous studies (9,26) and
preliminary experiments, the optimal dose of CTLA-4 antibody was
selected as 40 µg/mouse, to be administered at day 0
post-transplantation; the optimal dose of TIRC7 antibody was 25
µg/mouse administered on days 0, 1, 2, 3, 4 and 7 post-allo-BMT.
The potential basis of the additive effect of the two antibodies
was hypothesized to involve actitation of intracellular ITIM
(27) districts in both molecules
following co-administration, which then negatively regulated the
levels of T cells. Thus, the severity of acute GVHD was effectively
decreased. The average survival time of mice, acute GVHD clinical
scores and pathology scores in the experimental groups supported
this conclusion. TIRC7 and CTLA-4 antibodies also promoted
hematopoietic reconstitution; however, the mechanism was not clear
and requires further investigation.
In summary, through in vitro and in
vivo experiments, the present study revealed that TIRC7 could
positively regulate CTLA-4 expression, upregulate the activity of
STAT3, inhibit the activation of T cells and cytokine secretion,
and subsequently modulate the development and progression of acute
GVHD. The present study may deepen the understanding of the
pathogenesis of acute GVHD and provide novel approaches for
controlling acute GVHD.
Supplementary Material
Supporting Data
Acknowledgments
We acknowledge Professor Xiu-Ying Pan, Professor
Xu-Peng He, Dr De-Peng Li and Professor Yi-Hong Huang (all
Department of Hematology, The Affiliated Hospital of Xuzhou Medical
University) for their clinical assistance to patients included in
this study.
Funding
This work was supported by grants from the National
Nature Science Foundation of China (grant nos. 81300377, 81300441,
81700179 and 81600145), the Nature Science Foundation of Jiangsu
Province (grant nos. BK20160232 and BK20160226), China Postdoctoral
Science Foundation funded project (grant nos. 2015113010 and
2016M590508), the Foundation of Jiangsu Province Six Talents Peak
(grant no. 2015-WSW-058), the Foundation of Jiangsu Province
Six-one Project (grant no. LGY2018084) and the Clinical Technology
Backbone Training Program of Xuzhou City (grant no. 2018GG002).
Availability of data and materials
The datasets generated and/or analyzed during the
current study are available from the corresponding author on
reasonable request.
Authors' contributions
FZ, TQ and SZ designed the study and wrote the
manuscript. KZ, CC and JQ primarily performed the experiments,
wrote the manuscript and prepared the figures. BP, ZY, WC and QL
were involved in performing the experiments. QW, JC and WS made
substantial contributions to the acquisition and analysis of data.
LZ, HS, ZL and KX made contributions to the analysis and
interpretation of data, and revised the manuscript. All authors
read and approved the final manuscript.
Ethics approval and consent to
participate
Ethical approval for this study was obtained from
the Medical Ethics Committee of the Affiliated Hospital of Xuzhou
Medical University. Patients provided written informed consent
prior to sample collection. Animal experiments were approved by the
Animal Committee of Xuzhou Medical University and all protocols
were performed in accordance with Institutional Animal Care and Use
Committee guidelines.
Patient consent for publication
Not applicable.
Competing interest
The authors declare that they have no competing
interests.
References
|
1
|
Ammer J, Prantl L, Holler B, Landfried K,
Wolff D, Karrer S, Andreesen R and Holler E: Successful treatment
of a refractory skin ulcer in chronic cutaneous GVHD after
allogeneic HSCT with split-thickness skin allografting from the
stem cell donor. Bone Marrow Transplant. 47:1368–1369. 2012.
View Article : Google Scholar : PubMed/NCBI
|
|
2
|
Chen X, Chang CH, Stein R and Goldenberg
DM: The humanized anti-HLA-DR moAb, IMMU-114, depletes APCs and
reduces alloreactive T cells: Implications for preventing GVHD.
Bone Marrow Transplant. 47:967–980. 2012. View Article : Google Scholar : PubMed/NCBI
|
|
3
|
Ferrara JL, Levine JE, Reddy P and Holler
E: Graft-versus-host disease. Lancet. 373:1550–1561. 2009.
View Article : Google Scholar : PubMed/NCBI
|
|
4
|
Lai HY, Chou TY, Tzeng CH and Lee OK:
Cytokine profiles in various graft-versus-host disease target
organs following hematopoietic stem cell transplantation. Cell
Transplant. 21:2033–2045. 2012. View Article : Google Scholar : PubMed/NCBI
|
|
5
|
Ewing MM, Karper JC, Abdul S, de Jong RC,
Peters HA, de Vries MR, Redeker A, Kuiper J, Toes RE, Arens R, et
al: T-cell co-stimulation by CD28-CD80/86 and its negative
regulator CTLA-4 strongly influence accelerated atherosclerosis
development. Int J Cardiol. 168:1965–1974. 2013. View Article : Google Scholar : PubMed/NCBI
|
|
6
|
Cho H and Chung YH: Construction and in
vitro and in vivo analyses of tetravalent immunoadhesins. J
Microbiol Biotechnol. 22:1066–1076. 2012. View Article : Google Scholar : PubMed/NCBI
|
|
7
|
Yoo JS, Lee YJ, Yoon JW, Hyung KE and
Hwang KW: CTLA-4-Tg/CD-28-KO mice exhibit reduced T cell
proliferation in vivo compared to CD-28-KO mice in a
graft-versus-host disease model. Korean J Physiol Pharmacol.
16:349–353. 2012. View Article : Google Scholar : PubMed/NCBI
|
|
8
|
Zhu F, Qiao J, Chen W, Pan B, Wu QY, Cao
J, Sang W, Yan ZL, Zeng LY, Li ZY and Xu KL: Increased expression
of T cell immune response cDNA 7 in patients with acute
graft-versus-host disease. Ann Hematol. 94:1025–1032. 2015.
View Article : Google Scholar : PubMed/NCBI
|
|
9
|
Kumamoto Y, Tomschegg A, Bennai-Sanfourche
F, Boerner A, Kaser A, Schmidt-Knosalla I, Heinemann T, Schlawinsky
M, Blumberg RS, Volk HD and Utku N: Monoclonal antibody specific
for TIRC7 induces donor-specific anergy and prevents rejection of
cardiac allografts in mice. Am J Transplant. 4:505–514. 2004.
View Article : Google Scholar : PubMed/NCBI
|
|
10
|
Utku N, Boerner A, Tomschegg A,
Bennai-Sanfourche F, Bulwin GC, Heinemann T, Loehler J, Blumberg RS
and Volk HD: TIRC7 deficiency causes in vitro and in vivo
augmentation of T and B cell activation and cytokine response. J
Immunol. 173:2342–2352. 2004. View Article : Google Scholar : PubMed/NCBI
|
|
11
|
Kumamoto Y, Tamura A, Volk HD, Reinke P,
Löhler J, Tullius SG and Utku N: TIRC7 is induced in rejected human
kidneys and anti-TIRC7 mAb with FK506 prolongs survival of kidney
allografts in rats. Transpl Immunol. 16:238–244. 2006. View Article : Google Scholar : PubMed/NCBI
|
|
12
|
Zhu F, Qiao JL, Wu QY, Cao J, Zeng LY, Li
ZY and Xu KL: Elevated levels of T-cell immune response cDNA 7 in
patients with immune thrombocytopenia. Hematology. 19:477–482.
2014. View Article : Google Scholar : PubMed/NCBI
|
|
13
|
Livak KJ and Schmittgen TD: Analysis of
relative gene expression data using real-time quantitative PCR and
the 2(-Delta Delta C(T)) method. Methods. 25:402–408. 2001.
View Article : Google Scholar : PubMed/NCBI
|
|
14
|
Zhu F, Qiao J, Zhong XM, Wu QY, Chen W,
Yao Y, Niu MS, Fu CL, Zeng LY, Li ZY and Xu KL: Antithymocyte
globulin combined with cyclosporine A down-regulates T helper 1
cells by modulating T-cell immune response cDNA 7 in aplastic
anemia. Med Oncol. 32:1972015. View Article : Google Scholar : PubMed/NCBI
|
|
15
|
Cooke KR, Kobzik L, Martin TR, Brewer J,
Delmonte J Jr, Crawford JM and Ferrara JL: An experimental model of
idiopathic pneumonia syndrome after bone marrow transplantation: I
the roles of minor H antigens and endotoxin. Blood. 88:3230–3239.
1996. View Article : Google Scholar : PubMed/NCBI
|
|
16
|
Blazar BR, Taylor PA, McElmurry R, Tian L,
Panoskaltsis- Mortari A, Lam S, Lees C, Waldschmidt T and Vallera
DA: Engraftment of severe combined immune deficient mice receiving
allogeneic bone marrow via In utero or postnatal transfer. Blood.
92:3949–3959. 1998. View Article : Google Scholar : PubMed/NCBI
|
|
17
|
Kaplan DH, Anderson BE, McNiff JM, Jain D,
Shlomchik MJ and Shlomchik WD: Target antigens determine
graft-versus-host disease phenotype. J Immunol. 173:5467–5475.
2004. View Article : Google Scholar : PubMed/NCBI
|
|
18
|
Utku N, Heinemann T, Winter M, Bulwin CG,
Schlawinsky M, Fraser P, Nieuwenhuis EE, Volk HD and Blumberg RS:
Antibody targeting of TIRC7 results in significant therapeutic
effects on collagen-induced arthritis in mice. Clin Exp Immunol.
144:142–151. 2006. View Article : Google Scholar : PubMed/NCBI
|
|
19
|
Zhu F, Zhong XM, Qiao J, Liu Q, Sun HY,
Chen W, Zhao K, Wu QY, Cao J, Sang W, et al: Cytotoxic T lymphocyte
antigen-4 down-regulates T helper 1 cells by increasing expression
of signal transducer and activator of transcription 3 in acute
graft-versus-host disease. Biol Blood Marrow Transplant.
22:212–219. 2016. View Article : Google Scholar : PubMed/NCBI
|
|
20
|
Bulwin GC, Heinemann T, Bugge V, Winter M,
Lohan A, Schlawinsky M, Schulze A, Wälter S, Sabat R, Schülein R,
et al: TIRC7 inhibits T cell proliferation by modulation of CTLA-4
expression. J Immunol. 177:6833–6841. 2006. View Article : Google Scholar : PubMed/NCBI
|
|
21
|
Ma HH, Ziegler J, Li C, Sepulveda A,
Bedeir A, Grandis J, Lentzsch S and Mapara MY: Sequential
activation of inflammatory signaling pathways during
graft-versus-host disease (GVHD): Early role for STAT1 and STAT3.
Cell Immunol. 268:37–46. 2011. View Article : Google Scholar : PubMed/NCBI
|
|
22
|
Betts BC, Sagatys EM, Veerapathran A,
Lloyd MC, Beato F, Lawrence HR, Yue B, Kim J, Sebti SM, Anasetti C
and Pidala J: CD4+ T cell STAT3 phosphorylation precedes acute
GVHD, and subsequent Th17 tissue invasion correlates with GVHD
severity and therapeutic response. J Leukoc Biol. 97:807–819. 2015.
View Article : Google Scholar : PubMed/NCBI
|
|
23
|
Capitini CM, Nasholm NM, Chien CD, Larabee
SM, Qin H, Song YK, Klover PJ, Hennighausen L, Khan J and Fry TJ:
Absence of STAT1 in donor-derived plasmacytoid dendritic cells
results in increased STAT3 and attenuates murine GVHD. Blood.
124:1976–1986. 2014. View Article : Google Scholar : PubMed/NCBI
|
|
24
|
Yu Y, Wang D, Liu C, Kaosaard K, Semple K,
Anasetti C and Yu XZ: Prevention of GVHD while sparing GVL effect
by targeting Th1 and Th17 transcription factor T-bet and RORγt in
mice. Blood. 118:5011–5020. 2011. View Article : Google Scholar : PubMed/NCBI
|
|
25
|
Varkila K and Hurme M: Reduction of acute
graft-versus-host disease-related mortality and cytotoxic T
lymphocyte induction after pretreatment of the recipient with
anti-asialo GM1 antibody in the murine P-to-F1 model. Transplant
Proc. 19:2690–2691. 1987.PubMed/NCBI
|
|
26
|
Krummel MF, Sullivan TJ and Allison JP:
Superantigen responses and co-stimulation: CD28 and CTLA-4 have
opposing effects on T cell expansion in vitro and in vivo. Int
Immunol. 8:519–523. 1996. View Article : Google Scholar : PubMed/NCBI
|
|
27
|
Sarmay G, Koncz G, Pecht I and Gergely J:
Fc gamma receptor type IIb induced recruitment of inositol and
protein phosphatases to the signal transductory complex of human
B-cell. Immunol Lett. 57:159–164. 1997. View Article : Google Scholar : PubMed/NCBI
|