Introduction
Gallbladder carcinoma (GBC) is the most aggressive
and prevalent malignant tumor in the biliary tract (1). With a lack of effective early
molecular biomarkers, most GBC patients have a poor prognosis due
to delayed diagnosis in advanced stages (2). Therefore, it is imperative to identify
additional valuable molecular prognostic biomarkers for GBC.
Chromosomal deletion is a common mechanism of the
inactivation of tumor suppressor genes (TSGs) (3). The deletion of multiple regions on the
short arm of chromosome 3 (3p) represents a genetic alteration
hotspot in numerous human solid tumors including GBC (4–7),
suggesting the existence of one or more TSGs in this region. One
such gene located at 3p24-p23, namely RNA binding motif,
single-stranded interacting protein 3 (RBMS3) is a member of the
c-Myc gene single-strand binding protein (MSSP) family and encodes
an RNA-binding protein (8). The
MSSP family members have numerous diverse functions, and by
cooperating with the c-Myc protein, regulate processes such as DNA
replication, gene expression, cell cycle progression, cell
proliferation and induction of apoptosis (9,10). It
has been reported in esophageal squamous cell carcinoma (ESCC) that
RBMS3 can arrest the cell cycle at the G1/S checkpoint by directly
binding to the promoter region of c-Myc (11). Conversely, the RBMS3 protein has
also been suggested to be located in the cytoplasm, indicating a
potential cytoplasmic function of RNA metabolism control rather
than transcription (8,12). Recent studies demonstrated that
RBMS3 may act as a TSG in several types of solid tumors (11–14).
Downregulation of RBMS3 mRNA and protein has been detected in
gastric cancer (GC), nasopharyngeal carcinoma (NPC) and lung
squamous cell carcinoma (LSCC). In addition, downregulation of
RBMS3 in GC, LSCC, NPC and ESCC has been revealed to be strongly
associated with worse outcomes (11,12,14,15).
Overexpression of RBMS3 effectively suppressed ESCC cell growth,
colony formation and tumor formation in nude mice (11). RBMS3 has also been reported to
inhibit angiogenesis, a necessary nutrient supply strategy for most
solid tumors, by negatively regulating of MMP2, MMP-9, VEGF and
β-catenin to inhibit tumor growth (12,15).
However, its expression and role in human GBC remains unclear.
Therefore, the present study was conducted to address these
topics.
In the present study, RT-qPCR, western blotting and
immunohistochemistry (IHC) were utilized to characterize the
expression levels of RBMS3 in GBC tissues. The association of RBMS3
expression with clinicopathological parameters and prognosis was
analyzed, and the relationship between RBMS3 expression and
microvascular density (MVD) was investigated. Moreover, the role of
RBMS3 in GBC proliferation, clonogenicity and apoptosis in
vitro was determined.
Materials and methods
Patients and tissue specimens
To construct the tissue microarray (TMA), a total of
125 formalin-fixed, paraffin-embedded GBC and 47 randomly selected
normal gallbladder tissues were collected at the Department of
General Surgical of the Armed Police Corps Hospital of Anhui
(Hefei, China) from December 2004 to December 2014. To obtain the
complete clinical information, all patients were followed-up
regularly every 2 months during the first 2 years post-surgery and
every 6 months afterwards. Complete clinical follow-up was updated
until December 2016. Immunohistochemical staining and patient
pathological characteristics were reviewed by two experienced
pathologists. Tumor node metastasis (TNM) staging was classified
based on the 7th edition of TNM classification criteria published
by the American Joint Committee on Cancer (AJCC) in 2010. Detailed
clinicopathological parameters are described in Table I. In detail, the overall cohort
consisted of 34 males and 91 females with a mean age of 66.58 years
and a median age of 68 years (range, 35 to 93 years). Additionally,
41 pairs of matched fresh GBC tissues and adjacent non-tumor
tissues (at least 5 cm from the tumor edge) were collected,
snap-frozen in liquid nitrogen and stored at −80°C between May 2015
and August 2017, until use in RT-qPCR and western blot analysis to
compare the protein and mRNA expression levels of RBMS3 between GBC
and adjacent non-tumor tissues. All diagnoses were
histopathologically confirmed. None of the patients had undergone
any anticancer treatment prior to surgery. The present study was
approved by the Institute Research Ethics Committee of the Armed
Police Corps Hospital of Anhui and written informed consent was
obtained from all patients involved.
 | Table I.Clinical and pathological features of
the GBC patients (n=125). |
Table I.
Clinical and pathological features of
the GBC patients (n=125).
| Clinicopathological
variables | No. of patients
(%) |
|---|
| Sex |
|
|
Male | 34 (27.2) |
|
Female | 91 (72.8) |
| Age (years) |
|
|
<68 | 58 (46.4) |
|
≥68 | 67 (53.6) |
| Tumor size
(cm) |
|
|
<2 | 60 (48) |
| ≥2 | 65 (52) |
|
Differentiation |
|
|
High/moderate | 80 (64) |
|
Low/undifferentiated | 45 (36) |
| Depth of
invasion |
|
|
T1/T2 | 37 (29.6) |
|
T3/T4 | 88 (70.4) |
| Lymph node
metastasis |
|
|
Yes | 51 (40.8) |
| No | 74 (59.2) |
| TNM |
|
|
I/II | 81 (64.8) |
|
III/IV | 44 (35.2) |
| Gallstones |
|
|
Yes | 83 (66.4) |
| No | 42 (33.6) |
| AFP (µg/l) |
|
|
<20 | 120 (96) |
|
≥20 | 5 (4) |
| CEA (ng/ml) |
|
|
<5 | 99 (79.2) |
| ≥5 | 26 (20.8) |
| CA199 (U/ml) |
|
|
<37 | 81 (64.8) |
|
≥37 | 44 (35.2) |
RNA preparation and reverse
transcription-quantitative polymerase chain reaction (RT-qPCR)
Total RNA was isolated from freshly frozen tissues
using TRIzol reagent (Invitrogen; Thermo Fisher Scientific) and
reverse-transcribed (RT) to generate first-strand cDNA using
ReverTra Ace qPCR RT Master Mix (Toyobo Life Science) according to
the protocol supplied by the manufacturer. The PCR primers used for
amplification were as follows: RBMS3 forward,
5-GGTAGCATCTCTCAAGGCAAAT-3 and reverse, 5-CATGTCCAAAGGGTTTCAGCA-3;
and glyceraldehyde-3-phosphate dehydrogenase (GAPDH), which was
used as the internal control: Forward, 5-ATCAAGAAGGTGGTGAAGCAGG-3,
and reverse, 5-CGTCAAAGGTGGAGGAGTGG-3. qPCR was carried out on an
ABI Prism 7900 HT Sequence Detection System (Applied Biosystems;
Thermo Fisher Scientific, Inc.) using a SYBR Green mix (Toyobo Life
Science). The amplification of the target sequence was performed in
a 10-µl reaction system with the following conditions: Denaturation
(95°C for 5 min) and 40 cycles of amplification and quantification
(95°C for 15 sec and 60°C for 45 sec). Each sample was detected in
triplicate, and a melting curve was analyzed to confirm the
amplification specificity. The results of relative mRNA expression
were calculated using the 2−ΔΔCq method (16).
Protein extraction and western
blotting
Western blotting was performed as described
previously (17,18). Briefly, total proteins were
extracted from fresh frozen tissues by RIPA lysis buffer (product
code P0013B; Beyotime Institute of Biotechnology). Protein
concentrations were determined using the BCA Protein Assay Kit
(Beyotime Institute of Biotechnology). Protein samples (30 µg) were
then separated electrophoretically using 10% sodium dodecyl
sulfate-polyacrylamide (SDS-PAGE) gels and transferred to
nitrocellulose membranes (EMD Millipore). After blocking the
nonspecific binding sites with 5% nonfat milk diluted in
Tris-buffered saline with Tween-20 (TBST) for 1 h at room
temperature, the membranes were blotted with a rabbit polyclonal
anti-RBMS3 antibody (1:2,000; product code ab198248; Abcam) at 4°C
overnight. After three 10-min TBST washes, the membranes were
blotted with horseradish peroxidase-labeled anti-rabbit IgG
secondary antibody (product no. 7074P2; Cell Signaling Technology)
at a dilution of 1:3,000 at room temperature for 60 min. The
membranes were then washed three times with TBST for 10 min each
time, and the bound antibodies were developed using the enhanced
chemiluminescence system (product code 34577; Thermo Fisher
Scientific, Inc.). GAPDH was detected as a loading control using an
anti-GAPDH antibody (1:3,000; Ab103-02; Vazyme).
IHC and scoring
The immunohistochemical assay was performed as
previously described (19,20). Briefly, H&E-stained slides were
screened to identify optimal intratumoral tissue to construct a TMA
(Shanghai Biochip Company, Ltd.) before IHC. Multiple 4-µm-thick
sections were prepared with a microtome and incubated at 63°C for 1
h, deparaffinized using xylene, and rehydrated in a graded ethanol
series. Heat-induced antigen retrieval was performed at 100°C for
10 min in citrate buffer (pH 6.0). The sections were then treated
with 3% hydrogen peroxide in methanol and 1% bovine serum albumin
to quench endogenous peroxidase activity and to block nonspecific
staining. Subsequently, the sections were incubated with primary
antibodies against RBMS3 (1:50; product code ab198248; Abcam) and
CD34 (1:1,000; product code ab81289, Abcam) overnight at 4°C
followed by a PBS wash. The sections were then incubated at room
temperature for 30 min with horseradish peroxidase-labeled
anti-rabbit IgG secondary antibody (product code K8002; Dako), PBS
washed and visualized using an autostainer link instrument (product
code Autostainer Link 48; Dako) according to the manufacturers
instructions. For negative controls, the primary antibodies were
substituted with normal rabbit IgG (product code A7016; Beyotime
Institute of Biotechnology). The immunohistochemical staining
results were assessed by two independent pathologists who were
blinded to the patient clinical data according to the proportion of
positive cells and the staining intensity. The staining
‘percentage’ (percentage scores) were graded using four categories:
0 for no cells stained, 1 for <25%, 2 for 25–75%, and 3 for
>75% of cells stained. The ‘intensity measurements (intensity
score) were divided into four groups: 0 for negative, 1 for weak, 2
for moderate and 3 for strong. The immunoreactivity score (IRS) was
defined by the ‘percentage × intensity’. Specimens were scored as
follows: Negative (IRS= ~0-2), positive (IRS= ~3-9).
MVD counting
The MVD was counted by two independent pathologists
without knowledge of the patient data. Microvessels were evaluated
by counting CD34-stained endothelial cells according to the
generally accepted criteria developed by Weidner et al
(21). Any immunostained
endothelial cell or endothelial cell cluster that was clearly
separate from other nearby microvessels could be considered a
countable microvessel. Vessels with vessel wall thickness >2.75
µm or with thick muscular walls were excluded. Immunostained
sections were initially scanned at a low power (magnification,
×100) under a light microscope (Leica Microsystems GmbH) to
identify ‘hot spots’, defined as areas with the highest number of
microvessels. Three representative areas of ‘hot spots’ were then
counted under a high-power (magnification, ×200) microscope. The
final MVD count was determined as the mean value of the three
sections examined.
Cell culture and lentivirus
infection
Two human GBC cell lines (GBC-SD and SGC996) and the
human embryonic kidney cell line 293T were purchased from Shanghai
GeneChem Co., Ltd. These cell lines were cultured in RPMI-1640
medium (Gibco; Thermo Fisher Scientific, Inc.) supplemented with
10% fetal bovine serum (FBS; Gibco; Thermo Fisher Scientific,
Inc.), penicillin (100 U/ml) and streptomycin (100 µg/ml), at 37°C
in a humidified incubator containing 5% CO2. The
lentiviral overexpression vector RBMS3 GV365 (OE,
Ubi-RBMS3-3FLAG-CMV-EGFP) and the corresponding negative control
GV365 vector (NC, Ubi-MCS-3FLAG-CMV-EGFP) were purchased from
Shanghai GeneChem Co., Ltd. The packaging procedures and infection
of lentiviruses were performed according to a previous study
(22). The overexpression efficacy
of target genes was detected by western blot analysis.
Cell proliferation assay and
clonogenic assay
Cell proliferation and colony formation were
assessed to evaluate the role of RBMS3 on the proliferation
capabilities of GBC cells. Briefly, for the cell proliferation
assay previously described (23),
RBMS3 overexpression (OE) and vector control (NC) cells were seeded
into 96-well plates (~2,000 cells/well) in sextuplicate and cell
proliferation was assessed using Cell Counting Kit-8 (CCK-8;
Sigma-Aldrich; Merck KGaA) assay at different time-points according
to the manufacturers instructions. The absorbance was determined at
450 nm using a Universal Microplate Reader (BioTek Instruments,
Inc.). In short, the clonogenic assay was performed as previously
described (24), whereby the RBMS3
overexpressing and vector control cells (~800 cells/well) were
plated into 6-well plates and the medium was replaced every three
days. Two weeks later, the surviving colonies were fixed by 4%
polyoxymethylene at room temperature for 30 min, and stained with
Giemsa, and colonies (>50 cells/colony) were then counted. Each
assay was performed at least three times.
Apoptosis assay
Apoptosis of the GBC-SD and SGC996 cells was
analyzed using the APC-conjugated Annexin V (Annexin V-APC;
eBioscience; Thermo Fisher Scientific, Inc.) kit according to the
manufacturers instructions. The percentage of apoptotic cells was
analyzed by flow cytometry (FACSCalibur; BD Biosciences). The
detailed apoptosis analysis is described in a previous study
(25).
Statistical analysis
All statistical analyses were performed using SPSS
16.0 software (SPSS, Inc.). The associations between RBMS3
expression and clinicopathological characteristics were analyzed by
chi-square tests. A paired-samples t-test was used to compare the
RBMS3 mRNA levels between freshly frozen GBC and paired normal
tissues. The overall survival (OS) analysis was performed by the
Kaplan-Meier method, and statistical significance was analyzed
using the log-rank test. Cox regression analysis was used to
estimate the independent risk factor for OS of GBC patients after
surgery. Differences between two groups for in vitro studies
were assessed using Students t-test. All statistical tests were
two-sided, with P-values <0.05 considered to indicate a
statistically significant difference. (*P<0.05, **P<0.01,
***P<0.001 and #P<0.0001, respectively, as
indicated in the figures and legends).
Results
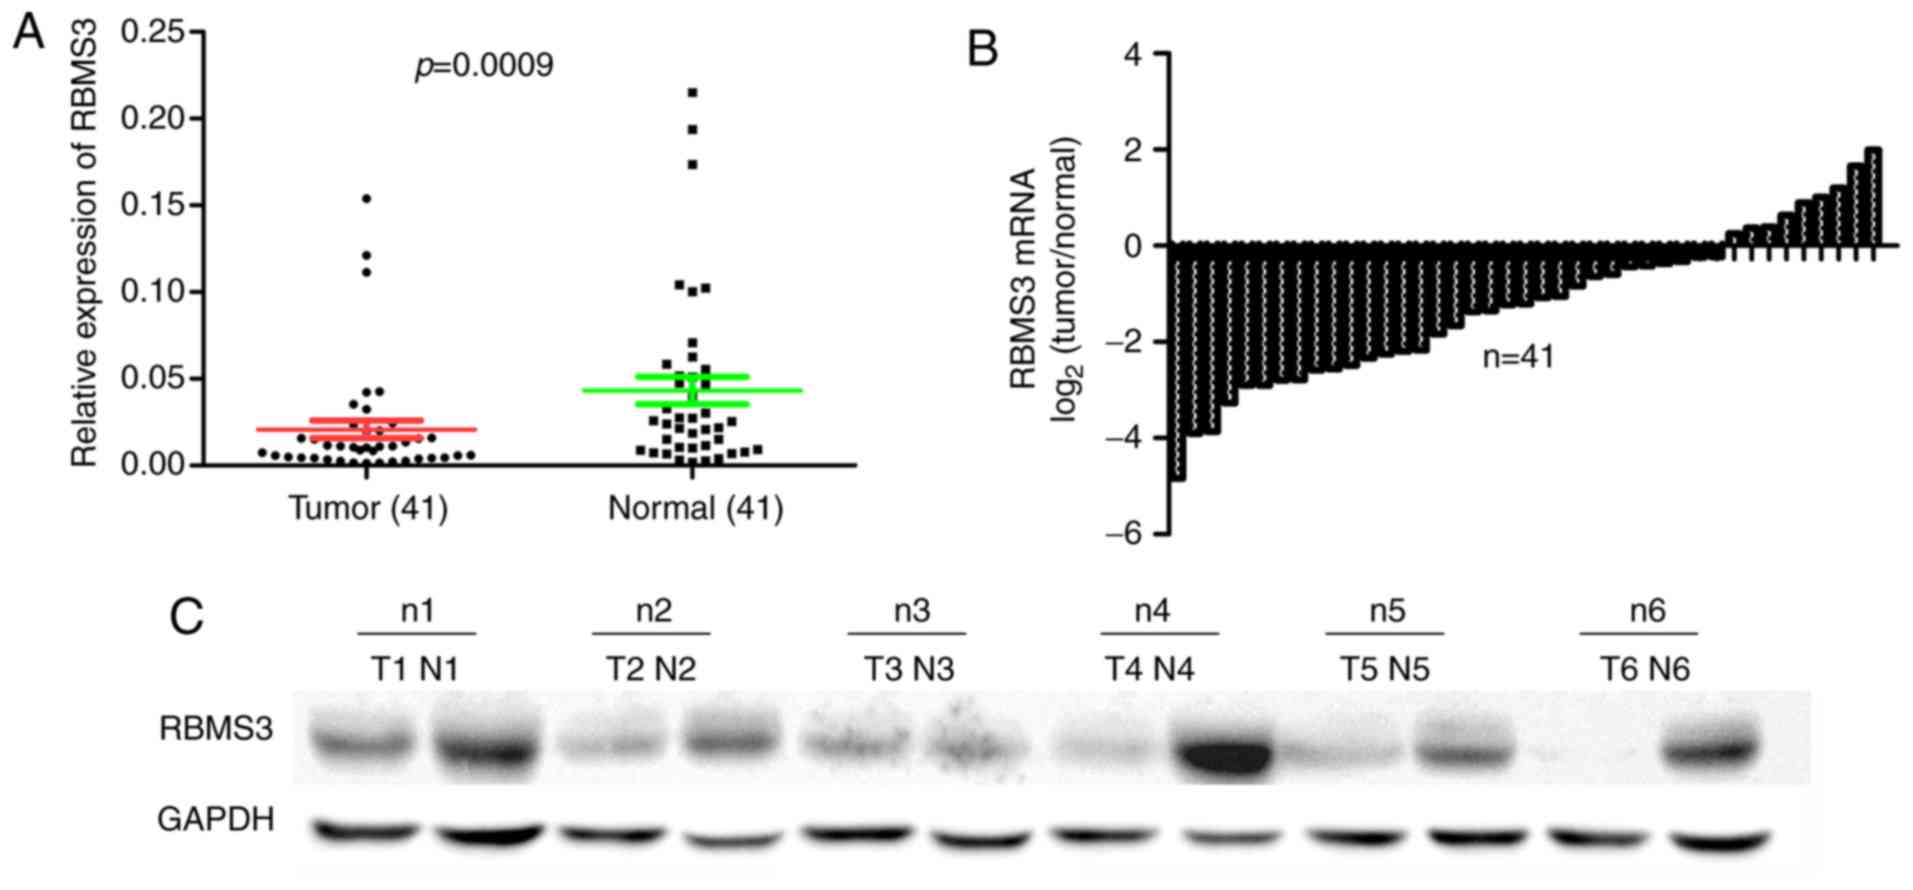
Expression of RBMS3 mRNA and protein
in matched fresh GBC tissues and adjacent non-tumor tissues
Low expression of RBMS3 has been reported in certain
human cancers (12). However, the
expression of RBMS3 in GBC has not been investigated. To determine
the expression of RBMS3 in GBC tissues, the mRNA and protein
expression levels of RBMS3 in a cohort of 41 GBCs and paired
adjacent non-tumor tissue specimens were assessed by RT-qPCR and
western blot analysis. The results revealed that the mean
expression level of RBMS3 mRNA in GBC tissues (0.021±0.033,
normalized to GAPDH gene expression) was significantly decreased
when compared to matched controls (0.043±0.051, P=0.0009; Fig. 1A). The differences with <1-fold
change were defined as downregulation (GBC/normal <1) and those
with >1-fold change as upregulation (GBC/normal >1) in RBMS3
mRNA expression in GBC tissues compared with normal tissues. The
results revealed that 78.05% (32/41) of GBC tissues expressed a
lower level of RBMS3 compared with the matched normal tissues
(Fig. 1B). In addition, to further
investigate whether protein expression was consistent with the
results of qPCR, RBMS3 protein levels in the matched tumor and
normal specimens were determined by western blotting and are
presented in Fig. 1C. Compared with
that in adjacent normal controls, the expression of RBMS3 protein
was decreased in the GBC specimens. Collectively, these results
indicated that in this Chinese GBC cohort, RBMS3 expression was
decreased at both the mRNA and protein levels.
Immunostaining for RBMS3
To elucidate the biological significance of RBMS3 in
GBC, RBMS3 protein expression was analyzed in a tissue microarray
(TMA) of 125 clinical GBC tissue samples and 47 normal controls
using IHC. In agreement with previous studies, the positive
immunohistochemical staining was predominantly located in the
cytoplasm and/or nucleus (12,13).
The expression levels of RBMS3 in the cytoplasm and nucleus are
summarized in Table II. The
results revealed that nuclear RBMS3 and cytoplasmic RBMS3
expression in GBC were significantly lower than those in the normal
controls (P=0.004 and P=0.005, respectively; data not shown).
Representative images of RBMS3 immunohistochemical staining in GBC
tissue and normal controls are shown in Fig. 2A. In summary, the present results
revealed that RBMS3 was downregulated in GBC.
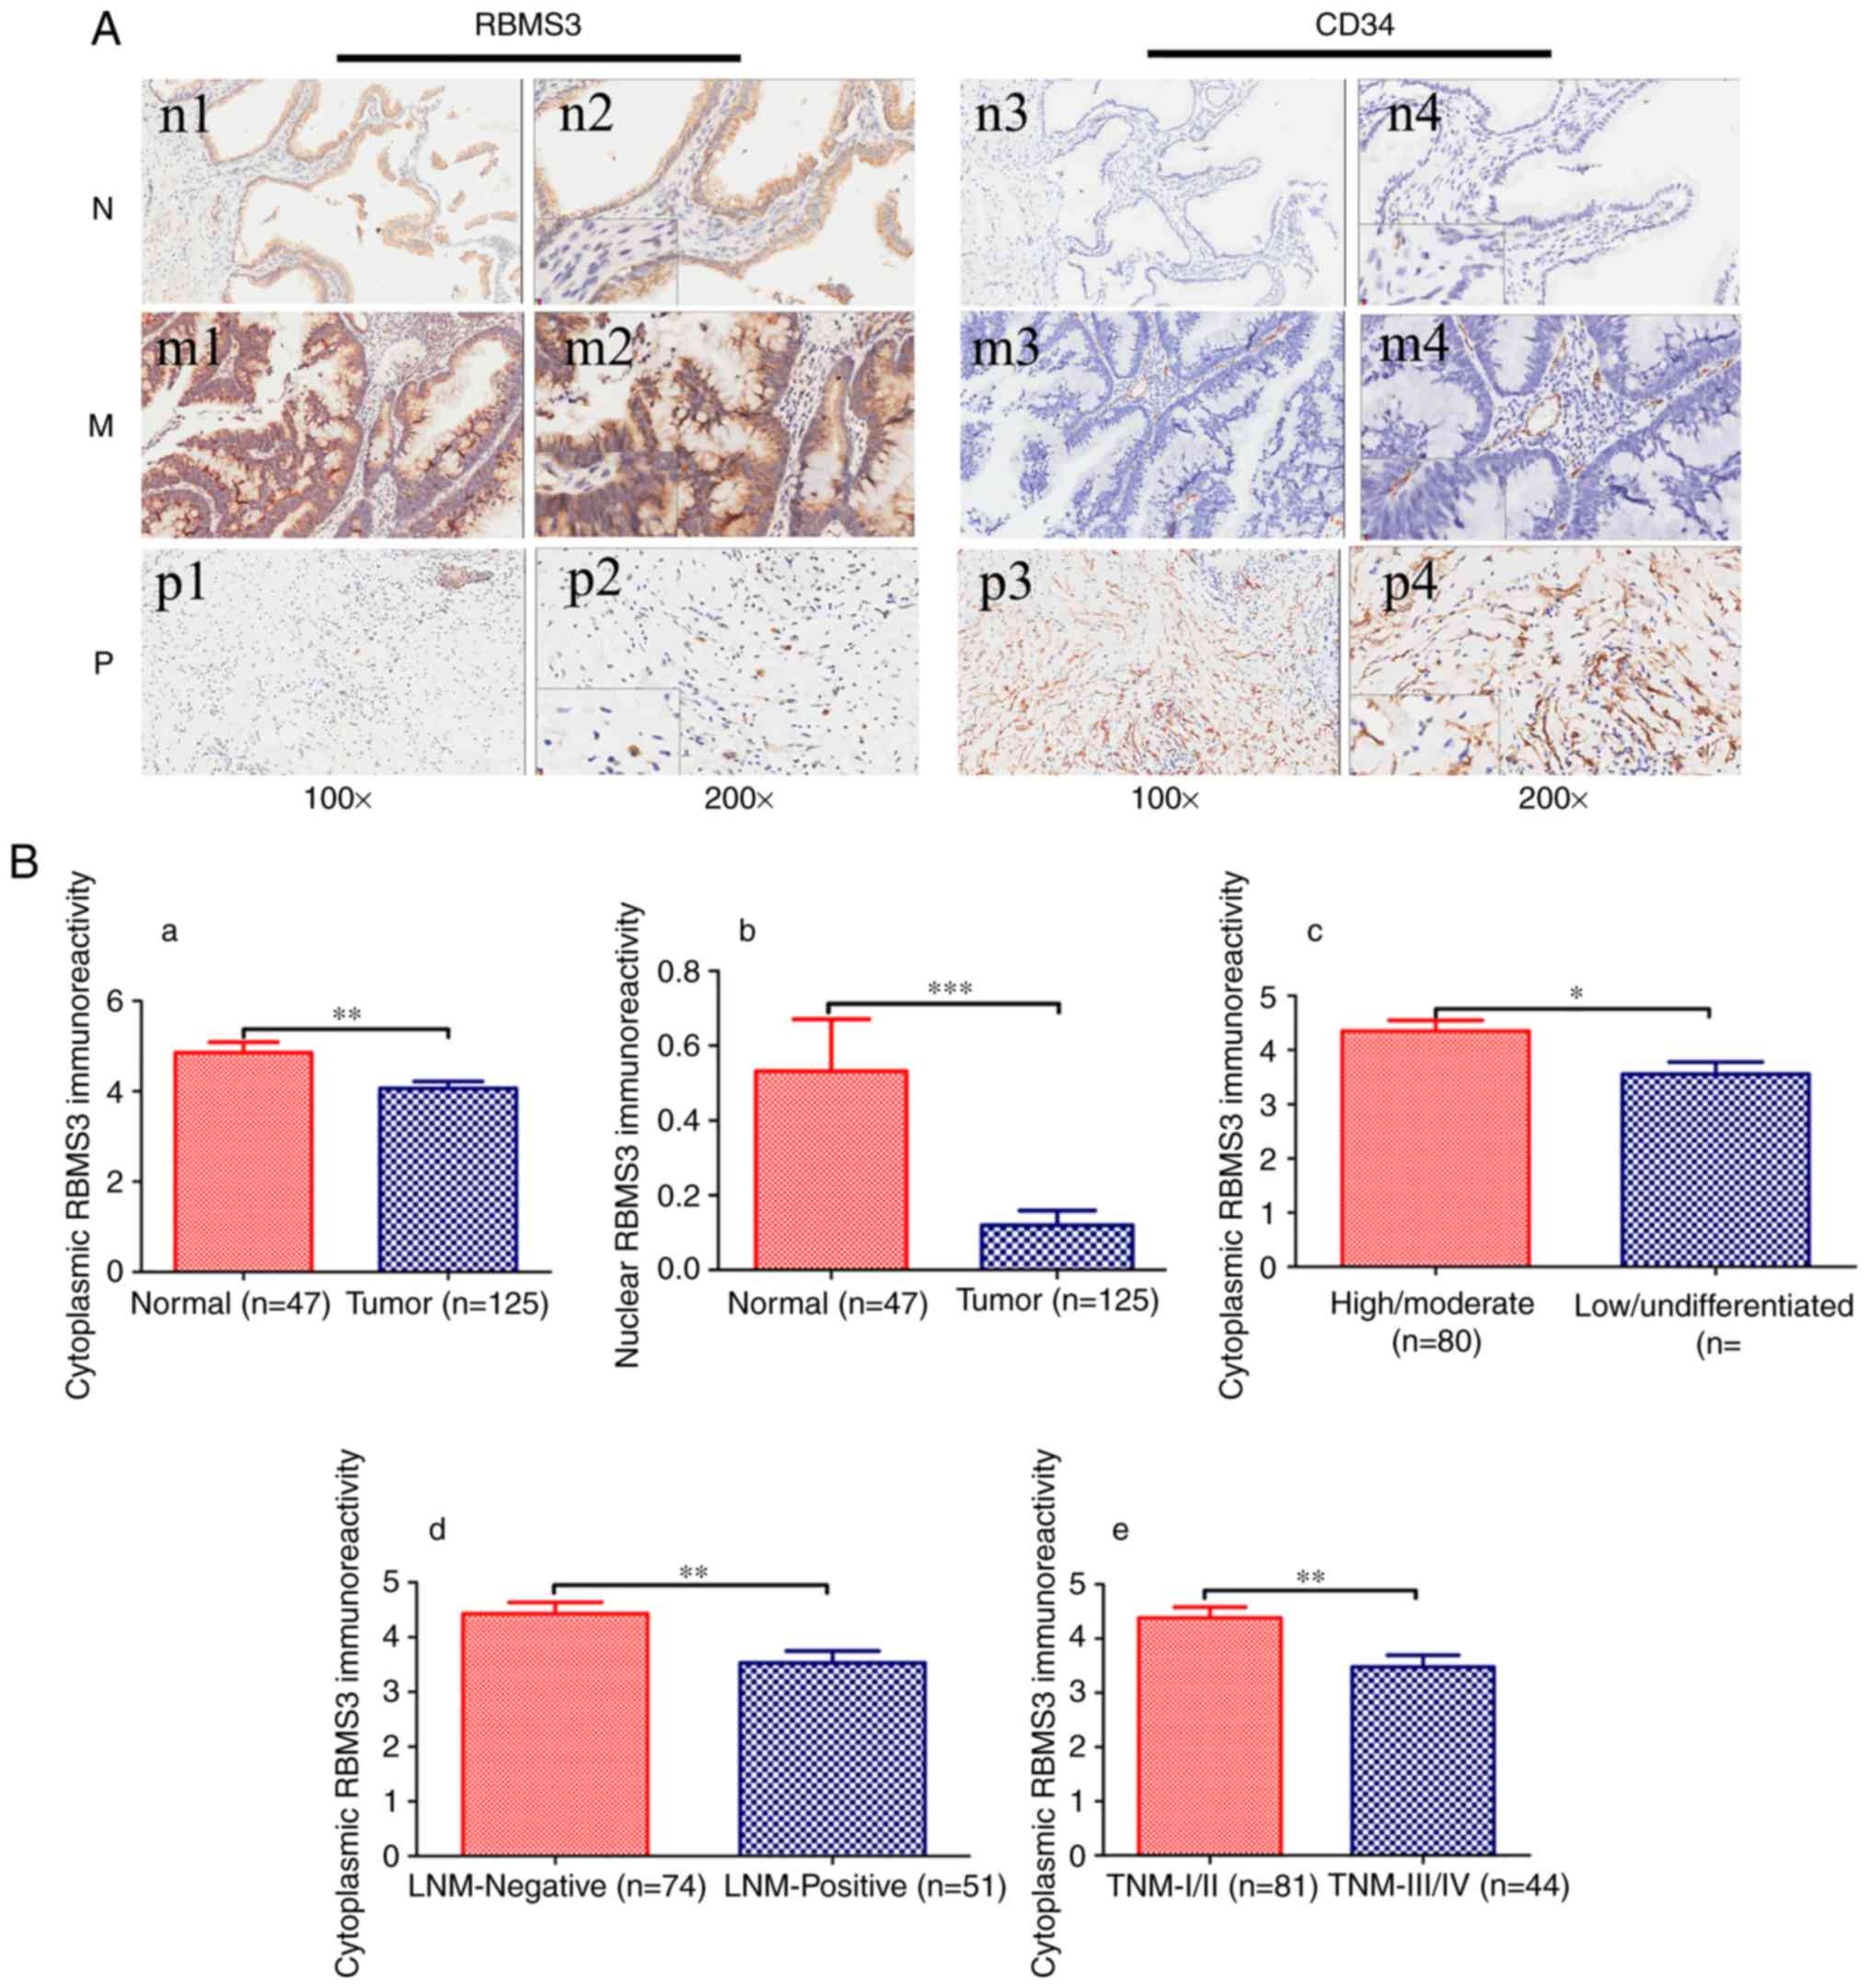 | Figure 2.Immunohistochemical staining of RBMS3
and CD34 protein in GBC and random normal gallbladder tissues. (A)
Representative images of RBMS3 and CD34 as follows: Normal
gallbladder tissues (N) with cytoplasmic RBMS3+
expression (n1 and n2) and low MVD (n3 and n4) expression; middle
differentiated (M) GBC with cytoplasmic RBMS3+
expression (m1 and m2) and low MVD (m3 and m4) expression; poorly
differentiated (P) GBC with cytoplasmic RBMS3−
expression (p1 and p2) and high MVD (p3 and p4) expression.
Magnification: ×100 (n1, n3, m1, m3, p1 and p3) and ×400 insertion
×200 (n2, n4, m2, m4, p2 and p4). (B) Immunoreactivity scores of
cytoplasmic RBMS3 and nuclear RBMS3 staining in (a and b) normal
gallbladder tissues and tumor tissues, (c) high/moderate and
low/undifferentiated, (d) LNM-negative and LNM-positive, and (e)
TNM-I/II and TNM-III/IV are represented as the mean ± SEM. (C) MVD
counts of tumor tissues. (a) MVD counting in tumor tissues with
cytoplasmic RBMS3+ and cytoplasmic RBMS3−
expression; (b) MVD counting in tumor tissues with nuclear
RBMS3+ and nuclear RBMS3− expression.
*P<0.05, **P<0.01, ***P<0.001 vs. NC. ns, not significant;
RBMS3, RNA binding motif, single-stranded interacting protein 3;
GBC, gallbladder carcinoma; MVD, microvessel density; LNM, lymph
node metastasis. |
| Table II.The expression of RBMS3 in GBC and
normal tissues. |
Table II.
The expression of RBMS3 in GBC and
normal tissues.
| Groups | Nuclear
RBMS3-positive/cytoplasmic RBMS3-positive | Nuclear
RBMS3-positive/cytoplasmic RBMS3-negative | Nuclear
RBMS3-negative/cytoplasmic RBMS3-positive | Nuclear
RBMS3-negative/cytoplasmic RBMS3-negative |
|---|
| GBC tissues | 1/125 (0.8) | 4/125 (3.2) | 46/125 (36.8) | 74/125 (59.2) |
| normal tissues | 5/47
(10.6) | 3/47
(6.4) | 24/47
(51.1) | 15/47
(31.9) |
| P-value | 0.008 | 0.611 | 0.09 | 0.001 |
Associations of RBMS3 expression with
GBC clinicopathological parameters
To further characterize the roles of RBMS3 in GBC
carcinogenesis, the associations between RBMS3 expression in GBC
tissues and clinicopathological parameters of GBC patients were
analyzed. The tumor TNM stage was classified as ‘early’ (I/II) or
‘advanced’ (III/IV). The lymph node stages were divided into lymph
node-negative (No) or lymph node-positive (Yes). As revealed in
Tables III and IV, the expression of cytoplasmic RBMS3 in
GBC was significantly associated with histopathological
differentiation (high/moderate vs. low/undifferentiated, P=0.023),
lymph node metastasis (Yes vs. No, P=0.007) and TNM tumor stage
(I/II vs. III/IV, P=0.004), while the expression of nuclear RBMS3
was not associated to any clinical parameters. Compared to that in
low/undifferentiated, lymph node-positive and TNM ‘advanced
(III/IV)’ stage, the immunoreactivity of cytoplasmic RBMS3 was
markedly increased in high/moderate histopathological
differentiation, lymph node-negative, TNM ‘early (I/II)’ stage and
normal controls. Immunoreactivity of cytoplasmic and nuclear RBMS3
in GBC tissues and normal controls and associations with
histopathological differentiation (high/moderate vs.
low/undifferentiated), lymph node metastasis (Yes vs. No) and TNM
tumor stage (I/II vs. III/IV) are presented in Fig. 2Ba-e. Collectively, the present
findings revealed that cytoplasmic RBMS3 expression was associated
with histopathological differentiation, lymph node metastasis and
TNM tumor stage.
| Table III.Association between cytoplasmic RBMS3
expression and clinicopathological variables (n=125). |
Table III.
Association between cytoplasmic RBMS3
expression and clinicopathological variables (n=125).
|
|
| Cytoplasmic RBMS3
expression |
|
|---|
|
|
|
|
|
|---|
| Clinicopathological
variables | Total | Positive | Negative | P-value |
|---|
| Sex |
|
|
| 0.182 |
|
Male | 34 | 16 (47.1) | 18 (52.9) |
|
|
Female | 91 | 31 (34.1) | 60 (65.9) |
|
| Age (years) |
|
|
| 0.417 |
|
<68 | 58 | 24 (41.4) | 34 (58.6) |
|
|
≥68 | 67 | 23 (34.3) | 44 (65.7) |
|
| Tumor size
(cm) |
|
|
| 0.344 |
|
<2 | 60 | 20 (33.3) | 40 (66.7) |
|
| ≥2 | 65 | 27 (41.5) | 38 (58.5) |
|
|
Differentiation |
|
|
| 0.023 |
|
High/moderate | 80 | 36 (45) | 44 (55) |
|
|
Low/undifferentiated | 45 | 11 (24.4) | 34 (75.6) |
|
| Depth of
invasion |
|
|
| 0.972 |
|
T1/T2 | 37 | 14 (37.8) | 23 (62.2) |
|
|
T3/T4 | 88 | 33 (37.5) | 55 (62.5) |
|
| Lymph node
metastasis |
|
|
| 0.007 |
|
Yes | 51 | 12 (23.5) | 39 (76.5) |
|
| No | 74 | 35 (47.3) | 39 (52.7) |
|
| TNM |
|
|
| 0.004 |
|
I/II | 81 | 38 (46.9) | 43 (53.1) |
|
|
III/IV | 44 | 9 (20.5) | 35 (79.5) |
|
| Gallstones |
|
|
| 0.757 |
|
Yes | 83 | 32 (38.6) | 51 (61.4) |
|
| No | 42 | 15 (35.7) | 27 (64.3) |
|
| AFP (µg/l) |
|
|
| 0.193 |
|
<20 | 120 | 47 (39.2) | 73 (60.8) |
|
|
≥20 | 5 | 0 (0) | 5 (100) |
|
| CEA (ng/ml) |
|
|
| 0.419 |
|
<5 | 99 | 39 (39.4) | 60 (60.6) |
|
| ≥5 | 26 | 8 (30.8) | 18 (69.2) |
|
| CA199 (U/ml) |
|
|
| 0.342 |
|
<37 | 81 | 28 (34.6) | 53 (65.4) |
|
|
≥37 | 44 | 19 (43.2) | 25 (56.8) |
|
| Table IV.Association between nuclear RBMS3
expression and clinicopathological variables (n=125). |
Table IV.
Association between nuclear RBMS3
expression and clinicopathological variables (n=125).
|
|
| Nuclear RBMS3
expression |
|
|---|
|
|
|
|
|
|---|
| Clinicopathological
variables | Total | Positive | Negative | P-value |
|---|
| Sex |
|
|
| 0.999 |
|
Male | 34 | 1 (2.9) | 33 (97.1) |
|
|
Female | 91 | 4 (4.4) | 87 (95.6) |
|
| Age (years) |
|
|
| 0.869 |
|
<68 | 58 | 3 (5.2) | 55 (94.8) |
|
|
≥68 | 67 | 2 (3) | 65 (97) |
|
| Tumor size
(cm) |
|
|
| 0.927 |
|
<2 | 60 | 3 (5) | 57 (95) |
|
| ≥2 | 65 | 2 (3.1) | 63 (93.3) |
|
|
Differentiation |
|
|
| 0.506 |
|
High/moderate | 80 | 2 (2.5) | 78 (97.5) |
|
|
Low/undifferentiated | 45 | 3 (6.7) | 42 (93.3) |
|
| Depth of
invasion |
|
|
| 0.327 |
|
T1/T2 | 37 | 0 (0) | 37 (100) |
|
|
T3/T4 | 88 | 5 (5.7) | 83 (94.3) |
|
| Lymph node
metastasis |
|
|
| 0.669 |
|
Yes | 51 | 3 (5.9) | 48 (94.1) |
|
| No | 74 | 2 (2.7) | 72 (97.3) |
|
| TNM |
|
|
| 0.479 |
|
I/II | 81 | 2 (2.5) | 79 (97.5) |
|
|
III/IV | 44 | 3 (6.8) | 41 (92.2) |
|
| Gallstones |
|
|
| 0.999 |
|
Yes | 83 | 3 (3.6) | 80 (96.4) |
|
| No | 42 | 2 (4.8) | 40 (95.2) |
|
| AFP (µg/l) |
|
|
| 0.999 |
|
<20 | 120 | 5 (4.2) | 115 (95.8) |
|
|
≥20 | 5 | 0 (0) | 5 (100) |
|
| CEA (ng/ml) |
|
|
| 0.999 |
|
<5 | 99 | 4 (4) | 95 (96) |
|
| ≥5 | 26 | 1 (3.8) | 25 (96.2) |
|
| CA199 (U/ml) |
|
|
| 0.999 |
|
<37 | 81 | 3 (3.7) | 78 (96.3) |
|
|
≥37 | 44 | 2 (4.5) | 42 (95.5) |
|
Correlation between angiogenesis and
RBMS3 expression
Previous studies revealed that RBMS3 could regulate
angiogenesis in NPC and GC (12,15).
However, the role of RBMS3 has not been reported in GBC. Therefore,
the correlation between MVD and RBMS3 expression in our TMA was
analyzed. MVD was quantified by counting CD34-positive endothelial
cells.
The MVD counts in the cytoplasm of the
RBMS3-negative group (cytoplasmic RBMS3−, 139.20±9.953)
were significantly higher than those in the cytoplasmic
RBMS3-positive group (cytoplasmic RBMS3+, 97.81±9.860,
P=0.0065) as revealed in Fig. 2Ca,
while MVD was not related to the expression of nuclear RBMS3, as
revealed in Fig. 2Cb. In
conclusion, the present results indicated that cytoplasmic RBMS3
was associated with GBC angiogenesis.
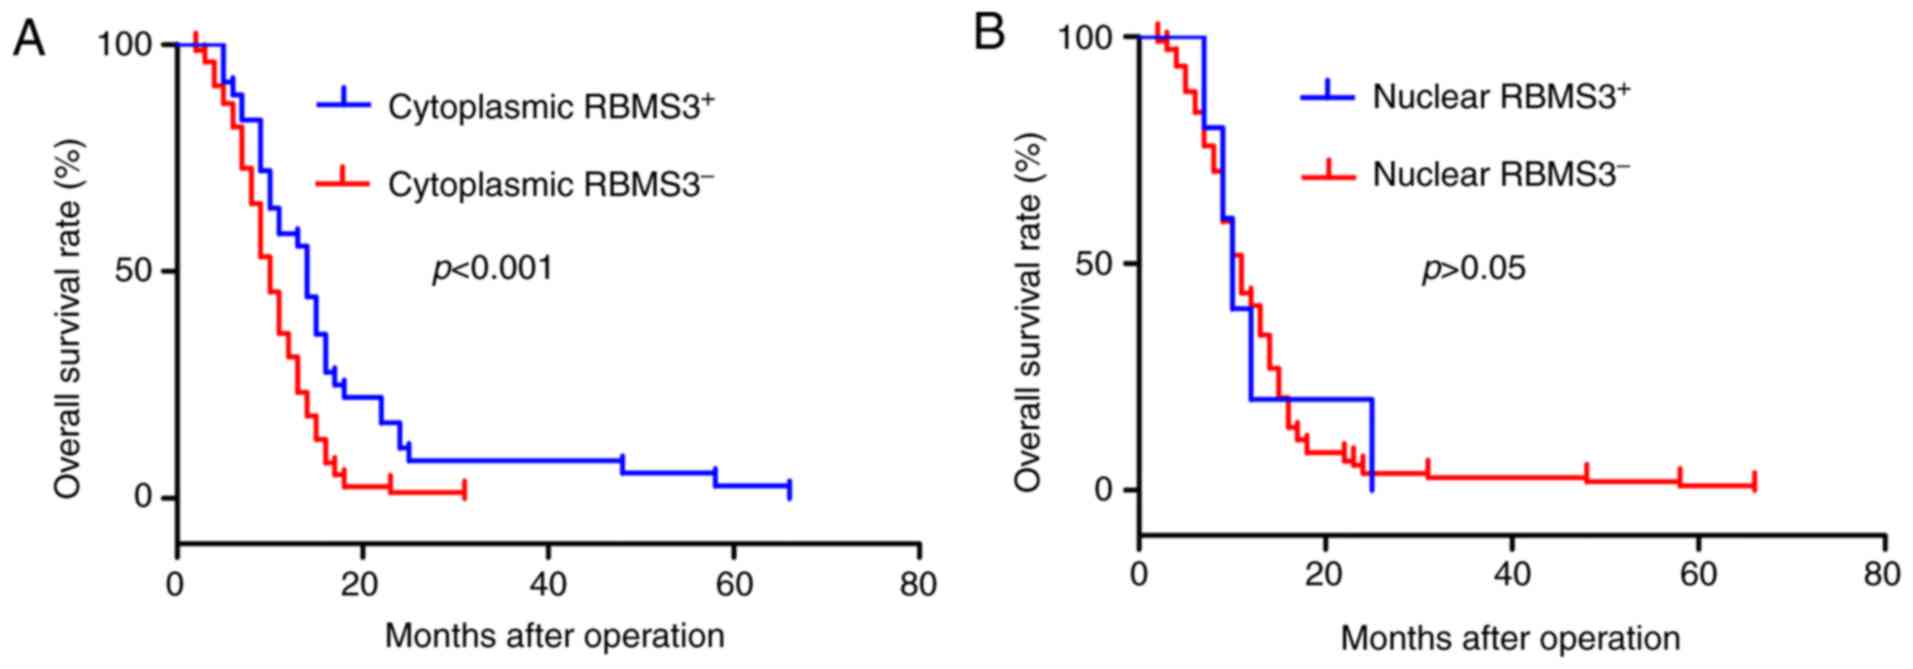
Survival analysis
Based on the aforementioned results, it was
determined that RBMS3 expression was associated with GBC
progression. Thus, the prognostic value of RBMS3 expression in
patients with GBC was evaluated using Kaplan-Meier analysis and
log-rank test. Kaplan-Meier survival curves revealed that
cytoplasmic RBMS3-negative expression (cytoplasmic
RBMS3−) was associated with worse overall survival (OS;
log-rank test: P<0.001; Fig.
3A), while overall survival was not related to the expression
of nuclear RBMS3, as revealed in Fig.
3B. Patients with cytoplasmic RBMS3− expression
exhibited shorter OS (mean 12.29±0.636 months) than those with
cytoplasmic RBMS3+ tumors (mean 16.81±1.929 months,
P<0.001), with an adjusted HR of 0.450 (95% CI: 0.294–0.688,
P<0.001). Collectively, the present results indicated that
cytoplasmic RBMS3 was significantly associated with the clinical
prognosis of GBC and may become a prognostic biomarker for GBC.
Univariate and multivariate Cox
regression analyses
The predictive roles of RBMS3 in GBC prognosis were
further assessed by Cox regression analysis. The univariate Cox
regression analysis revealed significant correlations between OS
and tumor size, differentiation, depth of invasion, lymph node
metastasis, TNM stages, AFP, CA199 levels and cytoplasmic RBMS3
expression (Table V). Furthermore,
a multivariate Cox regression analysis was performed for these
factors. As a result, differentiation, depth of invasion, AFP and
cytoplasmic RBMS3 expression were identified as independent
prognostic factors (Table V).
Collectively, the present results identified cytoplasmic RBMS3
expression as an independent prognostic factor for GBC.
| Table V.Univariate and multivariate analysis
of the correlation between clinicopathological parameters and
prognostic significance of GBC patients. |
Table V.
Univariate and multivariate analysis
of the correlation between clinicopathological parameters and
prognostic significance of GBC patients.
|
| Univariate
analysis | Multivariate
analysis |
|---|
|
|
|
|
|---|
| Variables | HR (95%CI) | P-value | HR (95%CI) | P-value |
|---|
| Sex (male vs.
female) | 1.188
(0.775–1.822) | 0.43 |
| NA |
| Age (years) (<68
vs. ≥68) | 1.325
(0.912–1.924) | 0.14 |
| NA |
| Tumor diameter (cm)
(<2 vs. ≥2) | 1.847
(1.263–2.700) | 0.002 | 1.526
(0.963–2.418) | 0.072 |
| Differentiation
(low/undifferentiated vs. | 0.314
(0.211–0.468) |
1.14E-08 | 0.564
(0.343–0.925) | 0.023 |
| high/moderate) |
| Depth of invasion
(T1/TI vs. T3/T4) | 2.277
(1.460–3.550) |
2.85E-04 | 1.898
(1.157–3.114) | 0.011 |
| Lymph node
metastasis (no vs. yes) | 1.880
(1.282–2.757) | 0.001 | 1.063
(0.467–2.420) | 0.884 |
| TNM stages (I/II
vs. III/IV) | 2.215
(1.486–3.301) |
9.38E-05 | 1.346
(0.568–3.190) | 0.5 |
| Gallstones | 0.961
(0.653–1.415) | 0.842 |
| NA |
| AFP (<20 vs.
≥20) | 1.927
(1.220–3.042) | 0.005 | 1.855
(1.091–3.155) | 0.023 |
| CEA (<5 vs.
≥5) | 1.718
(0.693–4.260) | 0.243 |
| NA |
| CA199 (<37 vs.
≥37) | 1.609
(1.094–2.367) | 0.016 | 1.310
(0.868–1.977) | 0.198 |
| Nuclear RBMS3
expression (positive vs. negative) | 1.224
(0.495–3.025) | 0.662 |
| NA |
| Cytoplasmic RBMS3
expression (positive vs. negative) | 0.508
(0.339–0.762) | 0.001 | 0.450
(0.294–0.688) |
2.29E-04 |
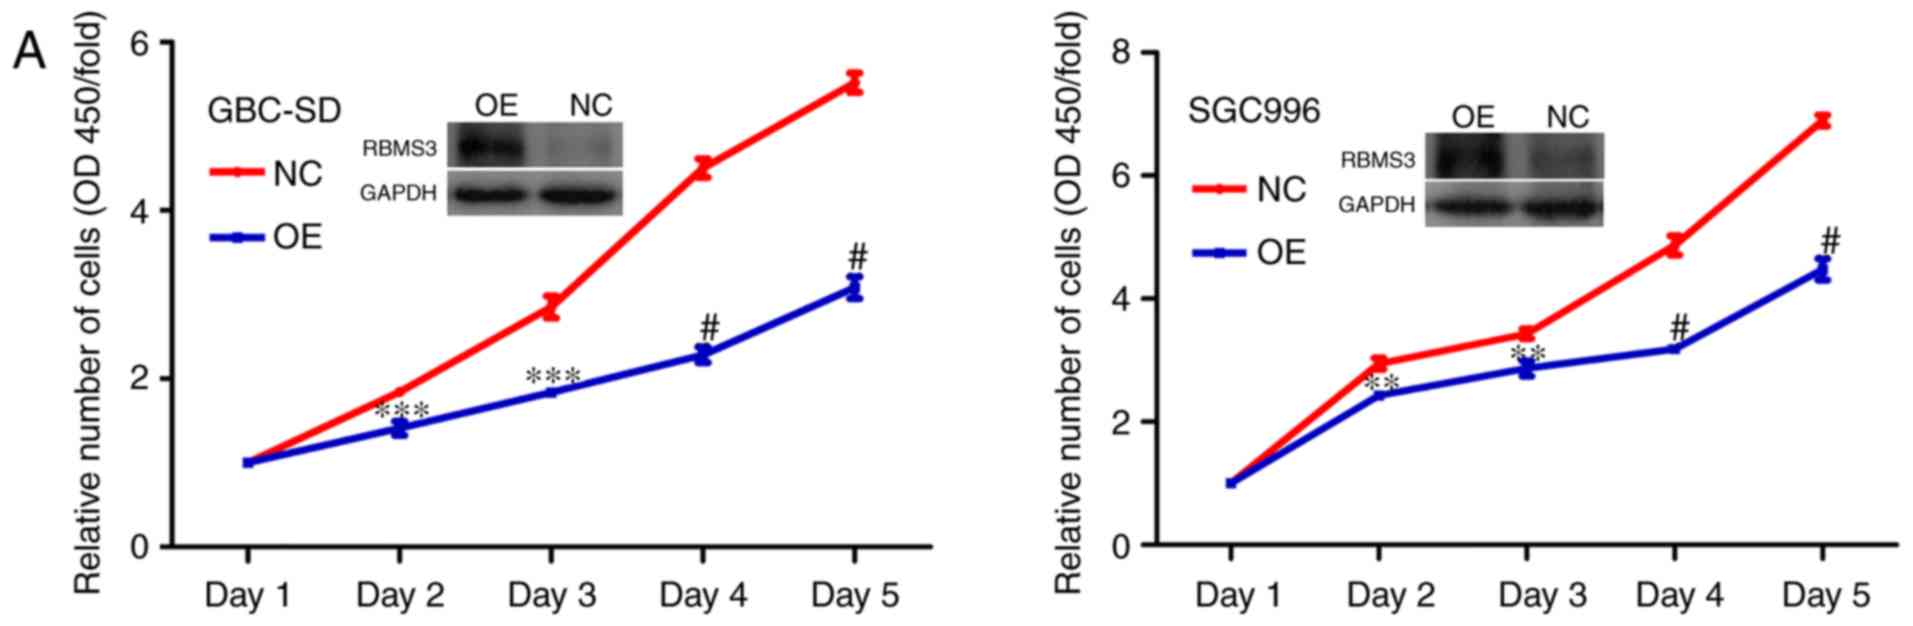
RBMS3 overexpression inhibits the
growth of GBC cells in vitro
Given the significant downregulation of RBMS3 in GBC
and the association between the downregulation of cytoplasmic RBMS3
expression and poor clinical prognosis, it was postulated that
RBMS3 may inhibit GBC cell growth. To investigate whether RBMS3 has
tumor suppressive ability, we stably overexpressed RBMS3 (OE) in
GBC-SD and SGC996 GBC cell lines by lentivirus infection, which was
confirmed by western blotting, while the empty vector lentivirus
(NC) served as a control.
Then, a cell proliferation and colony formation
assays were performed to evaluate the effects of RBMS3 on the
growth of GBC-SD and SGC996 cells. As revealed in Fig. 4A, it was determined that
overexpression of RBMS3 significantly inhibited the proliferation
ability of GBC-SD and SGC996 cells compared with the control.
Furthermore, colony formation assays similarly revealed that
overexpression of RBMS3 markedly decreased the number and size of
the colonies compared with the control (Fig. 4B). These results indicated an
inhibitory role for RBMS3 in the proliferation of GBC cells in
vitro, supporting the hypothesis that RBMS3 may act as a tumor
suppressor in GBC.
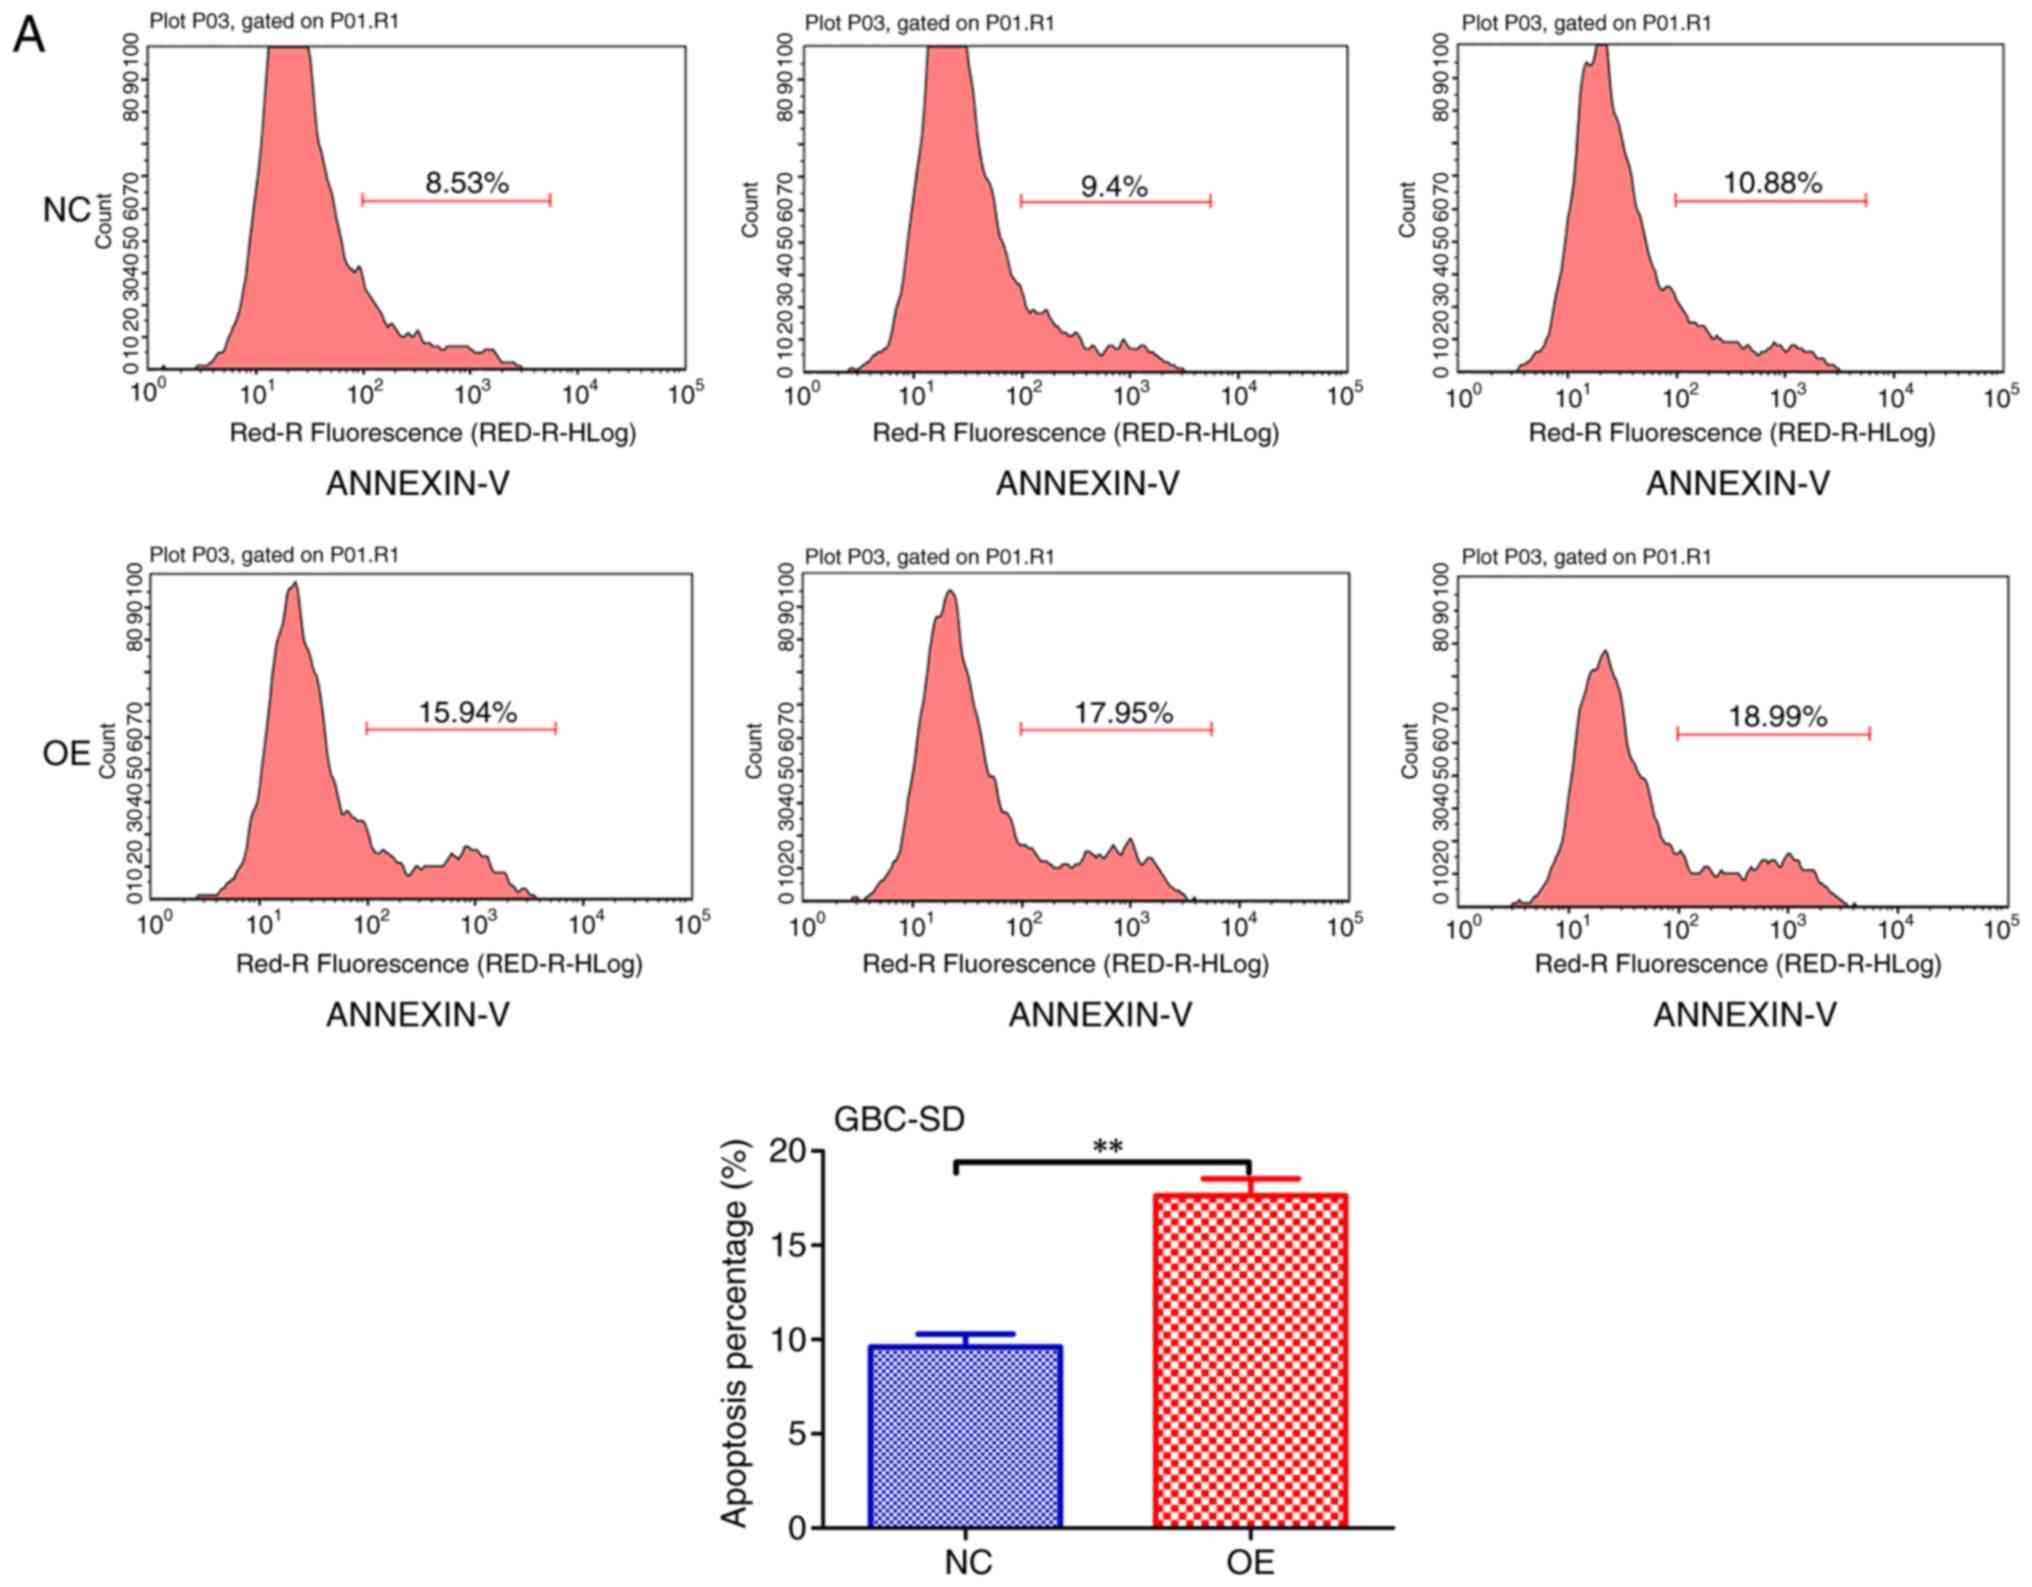
RBMS3 overexpression promotes the
apoptosis of GBC cells in vitro
Previous findings strongly suggest that RBMS3 is a
prominent apoptosis inducer in GBC (13,15).
To further verify our hypothesis, the apoptosis levels between the
two groups (OE vs. NC) in both cell lines (GBC-SD and SGC996) were
examined using flow cytometry and it was revealed that RBMS3
promoted apoptosis in both cell lines (Fig. 5A and B). These results support the
tumor suppressor role of RBMS3 in GBC via induction of tumor cell
apoptosis.
Discussion
Multiple regions within the short arm of chromosome
3 (3p) are frequently deleted in numerous human solid tumors
including GBC, representing a genetic alteration hotspot. The 3p24
gene RBMS3 has been identified as a candidate TSG in LSCC, NPC,
ESCC, and GC (11,12,14,15).
Previous studies revealed that in LSCC, NPC and ESCC, RBMS3 was
mainly found in the nucleus, and its low nuclear expression
predicted poor prognosis (11,14,15),
while in GC, RBMS3 was mainly found in the cytoplasm and its low
expression in the cytoplasm predicted poor prognosis (12). In the present study, it was revealed
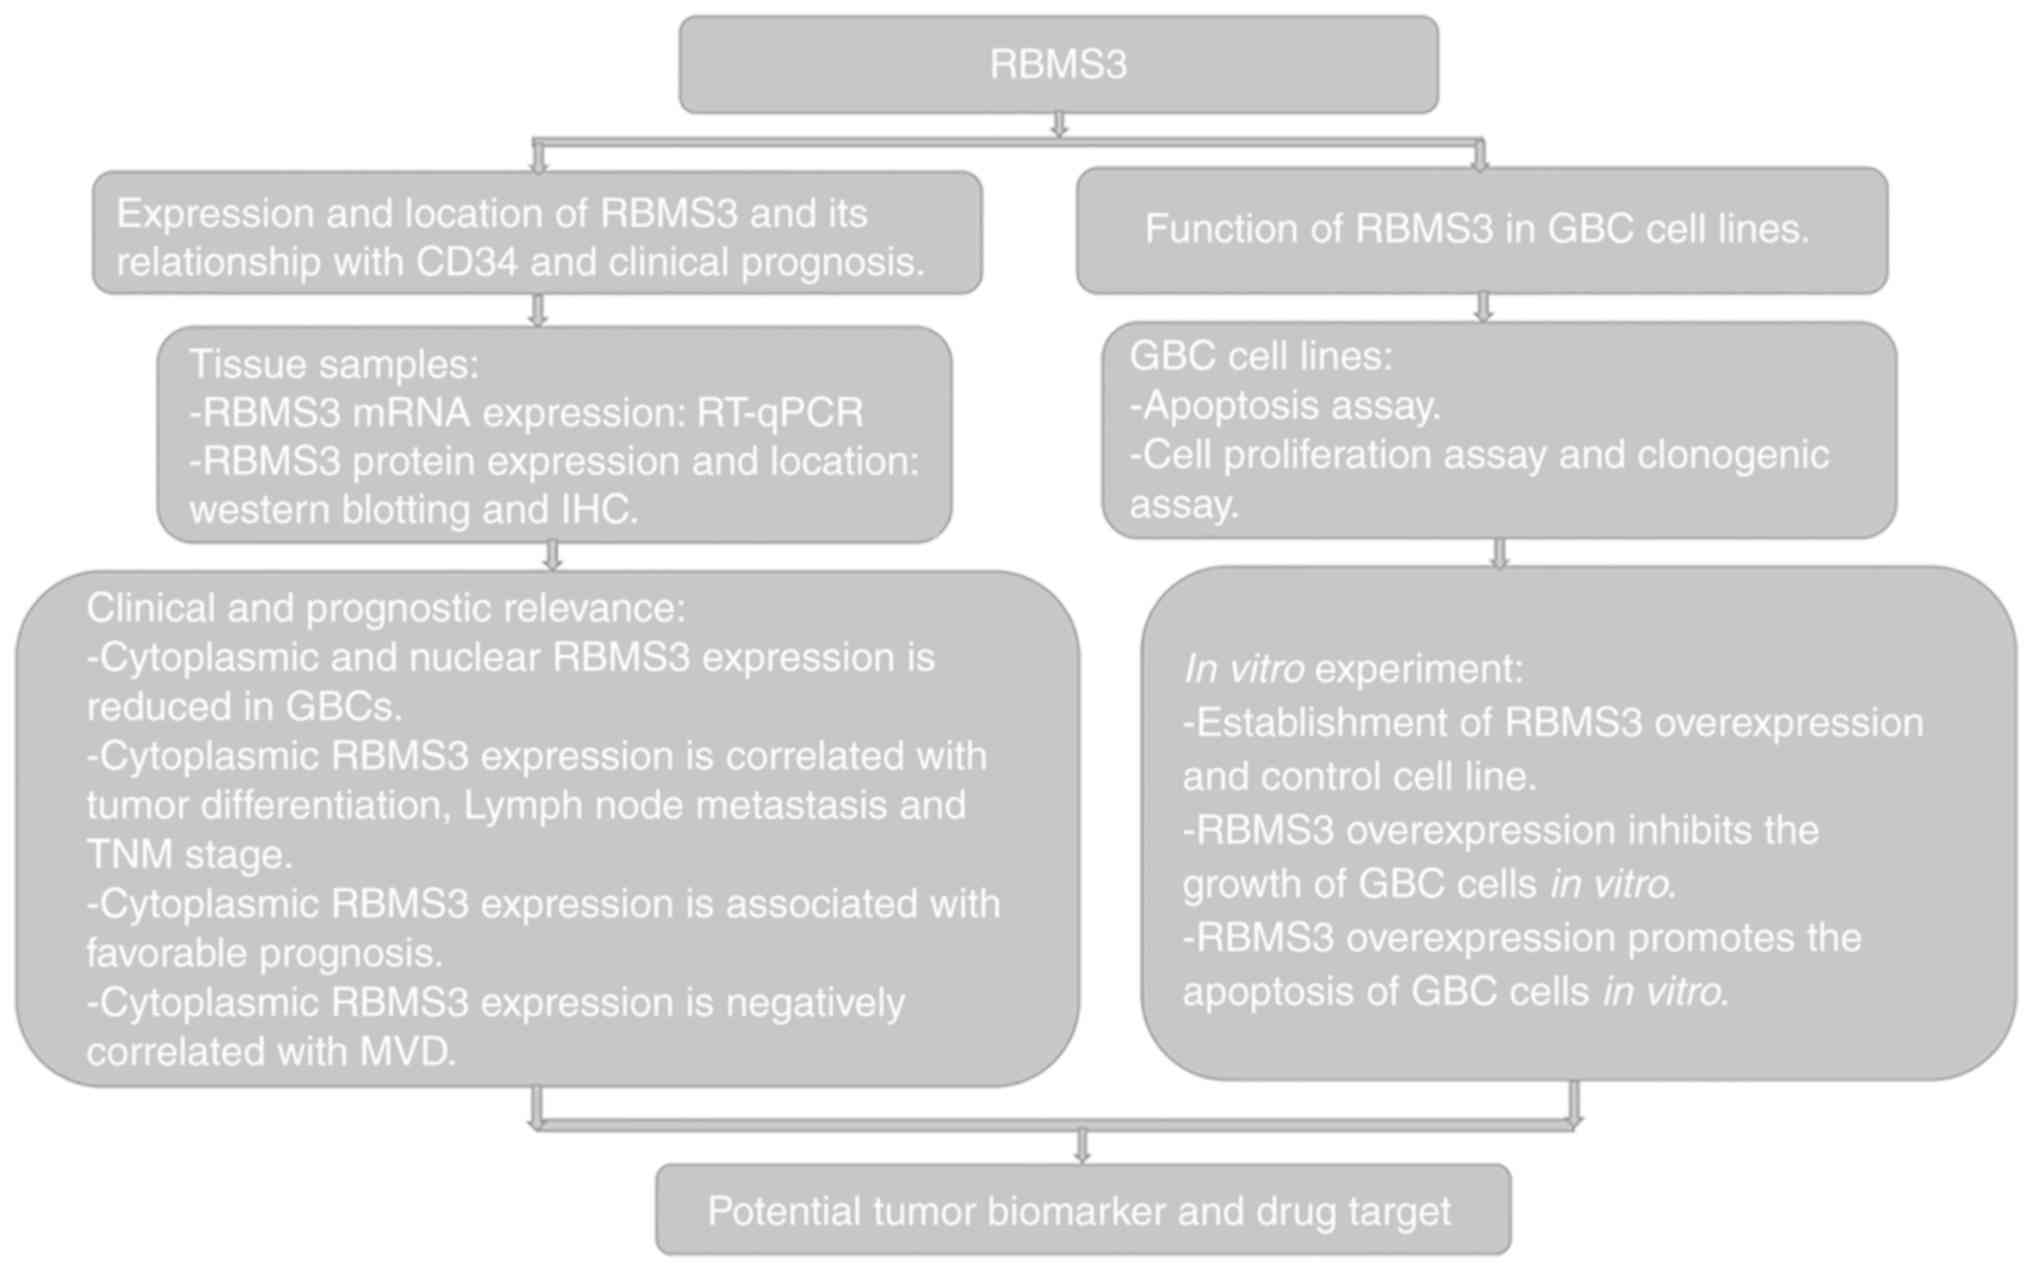
that RBMS3 is a candidate tumor biomarker for GBC (Fig. 6). It was demonstrated that in GBC
tissue, both the mRNA and protein expression levels of RBMS3 were
significantly downregulated. RBMS3 protein staining was detected in
the nucleus and/or cytoplasm of GBC cells, and both nuclear and
cytoplasmic RBMS3 staining was significantly reduced in GBC tissues
compared with normal controls, suggesting a pivotal role for RBMS3
in GBC development and progression.
Subsequent studies have revealed that RBMS3 is
downregulated in a number of solid tumors and plays an important
role in tumor progression and angiogenesis. For instance, Li et
al (11) revealed that ESCC
patients with RBMS3 downregulation had worse clinical outcomes, and
RBMS3 expression effectively suppressed cell growth, colony
formation, and tumor formation in nude mice through c-Myc
downregulation. Wu et al (12) revealed that RBMS3 may modulate the
cellular localization of the transcription factor HIF1A and thus
regulate tumor angiogenesis, and GC patients with low RBMS3
expression had worse clinical outcomes. Another study revealed that
downregulation of RBMS3 was detected in NPC cell lines and primary
NPC tissues and overexpression of RBMS3 in the NPC cell lines
markedly induced cell apoptosis and inhibited microvessel formation
by targeting caspase-9, PARP, MMP2 and β-catenin (15). RBMS3 was also suggested to play a
role in cell cycle arrest at the G1/S checkpoint by upregulating
p53 and p21 and downregulating cyclin E and CDK2 expression
(15). Recently, Yang et al
revealed that RBMS3 overexpression markedly suppressed
proliferation, migration, and invasion by inhibiting the protein
expression of β-catenin, cyclin D1, and c-Myc in breast cancer
cells (13). Consistent with the
aforementioned studies, in the present study, it was observed that
cytoplasmic RBMS3− GBC patients had significantly worse
prognosis and higher tumor angiogenesis compared with cytoplasmic
RBMS3+ GBC patients. However, no association of nuclear
RBMS3 with GBC prognosis or angiogenesis was revealed. This result
is consistent with a previous study showing RBMS3 accumulation in
the cytoplasm and strongly suggesting a cytoplasmic function for
RBMS3 (8). Therefore, cytoplasmic
RBMS3 expression may play more important roles in GBC than nuclear
RBMS3 expression. Moreover, multivariate Cox analysis further
confirmed cytoplasmic RBMS3 as an independent prognostic factor for
GBC, and RBMS3 overexpression markedly suppressed the proliferation
and clonogenicity of GBC cells and promoted apoptosis in
vitro. This result is consistent with previous studies on RBMS3
as an MSSP family protein to regulate cell proliferation and
apoptosis, both of which are crucial biological processes in
tumorigenesis. However, it was revealed that RBMS3 is mainly
located in the cytoplasm rather than the nucleus in GBC. It is
surmised that it can play a biological function in GBC by
regulating target-gene expression post-transcriptionally through
RNA binding. Previous research revealed that RBMS3 can increase the
half-life of Prx1 mRNA, thus increasing the expression of Prx1
protein, while Prx1 can interact with p66Shc, leading to changes in
mitochondrial membrane permeability cytochrome c release and
apoptosis (15). However, whether
RBMS3 can induce apoptosis through a similar pathway in GBC
requires further investigation. Collectively, these data indicated
that cytoplasmic RBMS3 is a novel TSG in GBC, and its
downregulation facilitates the development and progression of
GBC.
Tumor angiogenesis is correlated with invasion,
metastasis, treatment resistance and poor prognosis in some cancers
including GBC (26–29). A number of tumor therapeutic
strategies are being developed to inhibit tumor angiogenesis
(30,31). As previously reported, RBMS3 may
regulate tumor angiogenesis by modulating the location of HIF1A
(12) and RBMS3 may inhibit
microvessel formation in NPC cell lines through downregulation of
MMP2 and β-catenin and inactivation of its downstream targets
cyclin-D1, c-Myc, MMP7, and MMP9 (15). There have been no studies on the
association between MVD and RBMS3 expression in GBC. In the present
study, a strong association between cytoplasmic RBMS3 expression
and MVD was observed. GBC tissues with low expression of
cytoplasmic RBMS3 had high MVD counts compared with high expression
of cytoplasmic RBMS3, while nuclear RBMS3 expression was not
related to MVD counts. Therefore, cytoplasmic RBMS3 may contribute
to angiogenesis in GBC. Moreover, it was also revealed that GBC
tissues at the advanced stage with positive nodal metastasis and in
poor histological differentiation degree, had lower cytoplasmic
RBMS3 expression, indicating that cytoplasmic RBMS3 plays a
significant role in tumor invasion and metastasis. According to the
characteristics of GBC progression, patients with advanced tumor
stage, lymph node metastasis and poor histological differentiation
degree may be closely correlated with worse clinical outcome. Thus,
these results also indicated that cytoplasmic RBMS3 may play an
important tumor-suppressive role in GBC progression.
In conclusion, the present results indicated that,
as a member of the MSSPS family, RBMS3 could be an independent
prognostic factor for GBC and the low expression of cytoplasmic
RBMS3 in GBC patients was significantly correlated with advanced
tumor stage, lymph node metastasis, poor histological
differentiation degree, high tumor angiogenesis and poor prognosis,
suggesting that it may be a useful molecular marker in GBC.
However, there were some limitations in this study. First, in the
present study, the number of cases was relatively small, and a
larger number of patients would help to better understand the
clinical diagnostic and prognostic value of RBMS3 dysregulation in
GBC progression. In-depth investigation of the tumor-suppressive
roles and molecular mechanisms of RBMS3 in GBC will not only
greatly improve our biological understanding of GBC but also
suggest novel approaches for the clinical treatment of GBC.
Acknowledgments
We thank Mr. Shangxin Zhang for the technical
support. We thank Mrs. Mei Li for the helpful suggestions on this
manuscript. We thank Dr Yuanyuan Chen for supporting in the
manuscript preparation. We further thank all volunteers who
participated in this study.
Funding
The present study was supported by a grant from the
Provincial Natural Science Foundation of Anhui (no. 1808085MH238)
and the National Natural Science Foundation of China (no.
81874063).
Availability of data and materials
The datasets used and/or analyzed during the current
study are available from the corresponding author upon reasonable
request.
Authors' contributions
YW and DM performed the experiments and wrote the
manuscript. YY collected and analyzed the data. RS and QY
constructed the tissue microarray. JB and YS assisted with the
experiments and compiled the clinical data. DY assisted with the
statistical analysis. YL and DS conceived, designed, supervised and
wrote the manuscript. All authors read and approved the final
manuscript and agree to be responsible for all aspects of the work
in ensuring that the accuracy or integrity of any part of the work
are appropriately investigated and resolved.
Ethics approval and consent to
participate
The present study was approved by the Institute
Research Ethics Committee of the Armed Police Corps Hospital of
Anhui and written informed consent was obtained from all patients
involved.
Patient consent for publication
Not applicable.
Competing interests
The authors declare that they have no competing
interests.
References
|
1
|
Siegel RL, Miller KD and Jemal A: Cancer
statistics, 2015. CA Cancer J Clin. 65:5–29. 2015. View Article : Google Scholar : PubMed/NCBI
|
|
2
|
Hundal R and Shaffer EA: Gallbladder
cancer: Epidemiology and outcome. Clin Epidemiol. 6:99–109.
2014.PubMed/NCBI
|
|
3
|
Cai Y and Sablina AA: Cancer-associated
chromosomal deletions: Size makes a difference. Cell Cycle.
15:2850–2851. 2016. View Article : Google Scholar : PubMed/NCBI
|
|
4
|
Pezzolo A, Sementa AR, Lerone M, Morini M,
Ognibene M, Defferrari R, Mazzocco K, Conte M, Gigliotti AR,
Garaventa A, et al: Constitutional 3p26.3 terminal microdeletion in
an adolescent with neuroblastoma. Cancer Biol Ther. 18:285–289.
2017. View Article : Google Scholar : PubMed/NCBI
|
|
5
|
Togo Y, Yoshikawa Y, Suzuki T, Nakano Y,
Kanematsu A, Zozumi M, Nojima M, Hirota S, Yamamoto S and
Hashimoto-Tamaoki T: Genomic profiling of the genes on chromosome
3p in sporadic clear cell renal cell carcinoma. Int J Oncol.
48:1571–1580. 2016. View Article : Google Scholar : PubMed/NCBI
|
|
6
|
Riquelme E, Tang M, Baez S, Diaz A, Pruyas
M, Wistuba II and Corvalan A: Frequent epigenetic inactivation of
chromosome 3p candidate tumor suppressor genes in gallbladder
carcinoma. Cancer Lett. 250:100–106. 2007. View Article : Google Scholar : PubMed/NCBI
|
|
7
|
Kuroki T, Tajima Y, Matsuo K and Kanematsu
T: Genetic alterations in gallbladder carcinoma. Surg Today.
35:101–105. 2005. View Article : Google Scholar : PubMed/NCBI
|
|
8
|
Penkov D, Ni R, Else C, Piñol-Roma S,
Ramirez F and Tanaka S: Cloning of a human gene closely related to
the genes coding for the c-myc single-strand binding proteins.
Gene. 243:27–36. 2000. View Article : Google Scholar : PubMed/NCBI
|
|
9
|
Niki T, Galli I, Ariga H and Iguchi-Ariga
SM: MSSP, a protein binding to an origin of replication in the
c-myc gene, interacts with a catalytic subunit of DNA polymerase
alpha and stimulates its polymerase activity. FEBS Lett.
475:209–212. 2000. View Article : Google Scholar : PubMed/NCBI
|
|
10
|
Niki T, Izumi S, Saëgusa Y, Taira T, Takai
T, Iguchi-Ariga SM and Ariga H: MSSP promotes ras/myc cooperative
cell transforming activity by binding to c-Myc. Genes Cells.
5:127–141. 2000. View Article : Google Scholar : PubMed/NCBI
|
|
11
|
Li Y, Chen L, Nie CJ, Zeng TT, Liu H, Mao
X, Qin Y, Zhu YH, Fu L and Guan XY: Downregulation of RBMS3 is
associated with poor prognosis in esophageal squamous cell
carcinoma. Cancer Res. 71:6106–6115. 2011. View Article : Google Scholar : PubMed/NCBI
|
|
12
|
Wu Y, Yun D, Zhao Y, Wang Y, Sun R, Yan Q,
Zhang S, Lu M, Zhang Z, Lu D and Li Y: Down regulation of RNA
binding motif, single-stranded interacting protein 3, along with up
regulation of nuclear HIF1A correlates with poor prognosis in
patients with gastric cancer. Oncotarget. 8:1262–1277. 2017.
View Article : Google Scholar : PubMed/NCBI
|
|
13
|
Yang Y, Quan L and Ling Y: RBMS3 inhibits
the proliferation and metastasis of breast cancer cells. Oncol Res.
26:9–15. 2018. View Article : Google Scholar : PubMed/NCBI
|
|
14
|
Liang YN, Liu Y, Meng Q, Li X, Wang F, Yao
G, Wang L, Fu S and Tong D: RBMS3 is a tumor suppressor gene that
acts as a favorable prognostic marker in lung squamous cell
carcinoma. Med Oncol. 32:4592015. View Article : Google Scholar : PubMed/NCBI
|
|
15
|
Chen J, Kwong DL, Zhu CL, Chen LL, Dong
SS, Zhang LY, Tian J, Qi CB, Cao TT, Wong AM, et al: RBMS3 at 3p24
inhibits nasopharyngeal carcinoma development via inhibiting cell
proliferation, angiogenesis, and inducing apoptosis. PLoS One.
7:e446362012. View Article : Google Scholar : PubMed/NCBI
|
|
16
|
Livak KJ and Schmittgen TD: Analysis of
relative gene expression data using real-time quantitative PCR and
the 2(-Delta Delta C(T)) method. Methods. 25:402–408. 2001.
View Article : Google Scholar : PubMed/NCBI
|
|
17
|
Fang Z, Yin S, Sun R, Zhang S, Fu M, Wu Y,
Zhang T, Khaliq J and Li Y: miR-140-5p suppresses the
proliferation, migration and invasion of gastric cancer by
regulating YES1. Mol Cancer. 16:1392017. View Article : Google Scholar : PubMed/NCBI
|
|
18
|
Sun R, Wu J, Chen Y, Lu M, Zhang S, Lu D
and Li Y: Down regulation of Thrombospondin2 predicts poor
prognosis in patients with gastric cancer. Mol Cancer. 13:2252014.
View Article : Google Scholar : PubMed/NCBI
|
|
19
|
Yang S, Lu M, Chen Y, Meng D, Sun R, Yun
D, Zhao Z, Lu D and Li Y: Overexpression of eukaryotic elongation
factor 1 alpha-2 is associated with poorer prognosis in patients
with gastric cancer. J Cancer Res Clin Oncol. 141:1265–1275. 2015.
View Article : Google Scholar : PubMed/NCBI
|
|
20
|
Meng D, Chen Y, Yun D, Zhao Y, Wang J, Xu
T, Li X, Wang Y, Yuan L, Sun R, et al: High expression of N-myc
(and STAT) interactor predicts poor prognosis and promotes tumor
growth in human glioblastoma. Oncotarget. 6:4901–4919. 2015.
View Article : Google Scholar : PubMed/NCBI
|
|
21
|
Weidner N, Semple JP, Welch WR and Folkman
J: Tumor angiogenesis and metastasis-correlation in invasive breast
carcinoma. N Engl J Med. 324:1–8. 1991. View Article : Google Scholar : PubMed/NCBI
|
|
22
|
Wang ZH, Li Z, Hu M, Yang QJ, Yan S, Wu
RS, Li BA and Guo M: Ovol2 gene inhibits the
epithelial-to-mesenchymal transition in lung adenocarcinoma by
transcriptionally repressing Twist1. Gene. 600:1–8. 2017.
View Article : Google Scholar : PubMed/NCBI
|
|
23
|
Liu JD, Song LJ, Yan DJ, Feng YY, Zang YG
and Yang Y: Caffeine inhibits the growth of glioblastomas through
activating the caspase-3 signaling pathway in vitro. Eur Rev Med
Pharmacol Sci. 19:3080–3088. 2015.PubMed/NCBI
|
|
24
|
Tang L, Tan YX, Jiang BG, Pan YF, Li SX,
Yang GZ, Wang M, Wang Q, Zhang J, Zhou WP, et al: The prognostic
significance and therapeutic potential of hedgehog signaling in
intrahepatic cholangiocellular carcinoma. Clin Cancer Res.
19:2014–2024. 2013. View Article : Google Scholar : PubMed/NCBI
|
|
25
|
Shen Y, Wang X, Xu J and Lu L: SerpinE2, a
poor biomarker of endometrial cancer, promotes the proliferation
and mobility of EC cells. Cancer Biomark. 19:271–278. 2017.
View Article : Google Scholar : PubMed/NCBI
|
|
26
|
Wigerup C, Påhlman S and Bexell D:
Therapeutic targeting of hypoxia and hypoxia-inducible factors in
cancer. Pharmacol Ther. 164:152–169. 2016. View Article : Google Scholar : PubMed/NCBI
|
|
27
|
Zhang G, Miyake M, Lawton A, Goodison S
and Rosser CJ: Matrix metalloproteinase-10 promotes tumor
progression through regulation of angiogenic and apoptotic pathways
in cervical tumors. BMC Cancer. 14:3102014. View Article : Google Scholar : PubMed/NCBI
|
|
28
|
Ruan K, Song G and Ouyang G: Role of
hypoxia in the hallmarks of human cancer. J Cell Biochem.
107:1053–1062. 2009. View Article : Google Scholar : PubMed/NCBI
|
|
29
|
Okita S, Kondoh S, Shiraishi K, Kaino S,
Hatano S and Okita K: Expression of vascular endothelial growth
factor correlates with tumor progression in gallbladder cancer. Int
J Oncol. 12:1013–1018. 1998.PubMed/NCBI
|
|
30
|
Yano S, Muguruma H, Matsumori Y, Goto H,
Nakataki E, Edakuni N, Tomimoto H, Kakiuchi S, Yamamoto A, Uehara
H, et al: Antitumor vascular strategy for controlling experimental
metastatic spread of human small-cell lung cancer cells with ZD6474
in natural Killer cell-depleted severe combined immunodeficient
mice. Clin Cancer Res. 11:8789–8798. 2006. View Article : Google Scholar
|
|
31
|
Davidoff AM, Ng CY, Zhang Y, Streck CJ,
Mabry SJ, Barton SH, Baudino T, Zhou J, Kerbel RS, Vanin EF and
Nathwani AC: Careful decoy receptor titering is required to inhibit
tumor angiogenesis while avoiding adversely altering VEGF
bioavailability. Mol Ther. 11:300–310. 2005. View Article : Google Scholar : PubMed/NCBI
|