Introduction
Human hepatocellular carcinoma (HCC) is a common
malignancy of the digestive system and is the third leading cause
of tumor-related mortality (>780,000 cases per year) worldwide
according to data from 2018 (1).
Alcohol consumption, hepatitis B virus (HBV) and hepatitis C virus
(HCV) infection are known to be causative factors of HCC (2). In recent years, the morbidity rate
from alcohol-associated HCC has increased in developed countries
(accounting for 40% cases of HCC), as well as in China (accounting
for 28% cases of HCC) (3). A
previous study has demonstrated that in the human body, ethanol is
metabolized into acetaldehyde by alcohol dehydrogenase (4) and acetaldehyde exerts a carcinogenic
effect by binding to 2′-deoxyguanosine in hepatocyte DNA and
causing DNA mutations (5). During
metabolism, reactive oxygen species accumulate and promote further
DNA damage, including chain interruption and heterogeneous
interconversion (6). However, the
molecular mechanism of alcohol-associated HCC is yet to be
elucidated, thus, identification of key genes associated with the
development of alcohol-associated HCC may increase these
mechanisms, as well as identifying potential biomarkers and targets
for diagnosis and treatment, respectively.
Microarray and RNA-sequencing (RNA-seq) technology
are valuable tools for monitoring genome-wide changes in gene
expression. In previous studies, bioinformatics analysis of
microarray and RNA-seq gene data profiles identified key
onco-genes, such as cell division cycle 20 and cell division cycle
associated 5 involved in the prognosis of HCC (7,8). In a
preliminary bioinformatics study, Wu et al (9) identified 12 genes, including non-SMC
condensin I complex subunit G and TTK protein kinase that were
associated with the progression of HCC. In addition, Pan et
al (10) revealed that
micro(mi)RNA-15b-5p serves an oncogenic role in HCC. Through the
investigation of miRNA-mRNA regulatory pathways, Lou et al
(11) revealed 36 differentially
expressed miRNAs, including miR-93-5p and miR-106-5p, which
increased the activation of mitogen-activated protein kinase 8
pathway and promoted the development of HCC. Furthermore, Yin et
al (12) used weighted gene
co-expression network analysis (WGCNA) to identify 13 genes,
including cyclin-dependent kinase 1 and topoisomerase 2α which were
found to promote the development of HCC.
In the present study, RPS8 was found to be highly
expressed in alcohol-associated HCC and associated with tumor
progression, but not with non-alcohol-associated HCC. Thus, RPS8
may be a novel and specific biomarker and potential therapeutic
target for alcohol-associated HCC.
Materials and methods
Data collection and processing
Data of patients with HCC and with a history of
alcohol consumption were downloaded from TCGA database; a total of
68 alcohol-associated HCC tissue samples and the corresponding
patient clinical traits including age, Child-Pugh score, T-stage,
patient status (dead or alive) and body weight were obtained from
The University of California Santa Cruz (https://xenabrowser.net/datapages/). The gene matrix
of the 68 profiles was normalized using the limma package (version
3.10; http://www.bioconductor.org/packages/release/bioc/html/limma.html)
and transferred as log2 (fragments per kilobase of exon model per
million reads mapped; FPKM+1). Before conducting WGCNA, the probes
without gene symbols, and the genes with a mean expression level
<0.5 were removed. Concurrently, the hierarchical cluster
(Hclust) algorithm (version 3.4.1; http://web.mit.edu/~r/current/arch/amd64_linux26/lib/R/library/stats/html/hclust.html)
was performed to cluster the samples according to the gene
expression of the whole genome and to detect outliers. Then, the
height (a score for evaluating the mean dissimilarity) of each
sample was calculated and the threshold for identifying outlier
samples was set at 160. The remaining 15,195 genes and 64 samples
were regarded as ‘good genes’ and ‘good samples’.
WGCNA
Good samples and good genes were used to conduct
WGCNA, and the WGCNA network was constructed using the R package
‘WGCNA’ (version: 1.68; R Project Organization; https://cran.r-project.org/web/packages/WGCNA/index.html).
First, the gradient method was employed to measure the independence
and average connectivity degree of the different modules with
different power values (1–20). A degree of scale independence
(≥0.85) and low mean connectivity (~0.0) were selected as the
threshold obtain power values of 1–20, following which module
construction was performed. The minimum number of genes in each
co-expressed gene module was set as 100. When the comparability of
module eigengenes between two modules were <0.25, the modules
were merged.
Identification of clinically
significant modules and module core genes
Following WGCNA, the different module eigengenes and
their corresponding clinical traits were correlated using Pearson's
correlation analysis; five clinical traits were studied in the
present study, including age, Child-Pugh score, T-stage, patient
status (dead or alive) and weight. P<0.05 was used as the
threshold for a significant association between gene modules and
clinical traits. According to the requirements of the WGCNA
algorithm, the result from the grey module is invalid, as the genes
in the module are not co-expressed (13). Gene module genes with a module
membership >0.8 were determined to be module core genes.
GO and KEGG pathway enrichment
analysis
Module core genes were used to perform GO and KEGG
analyses. The core gene data were uploaded to the Database for
Annotation, Visualization and Integrated Discovery (DAVID) v6.8
(http://david-d.ncifcrf.gov/). The
results of GO and KEGG analysis were exported as .txt files and
visualized using R software (version: 3.5.3; R Project
Organization; http://www.r-project.org/). P<0.05 was used to
indicate a statistically significant difference.
Construction of the PPI network
The core gene data were uploaded to the Search Tool
for the Retrival of Interacting Genes/Proteins (STRING) online
database (http://string-db.org). The node and edge
information were exported as .txt files and visualized using
Cytoscape software (version, 3.7.2; The Cytoscape Consoritum;
http://cytoscape.org/). The Cytohub plug-in was
used to analyze the degree score; genes with the top ten degree
scores were identified as hub genes and used to construct a PPI
sub-network.
Progression and survival analysis
The gene expression data of the hub genes and the
tumor grade were imported into SPSS v20.0 (IBM Corp). The effect of
hub gene expression on the progression of alcohol-associated HCC
was analyzed using Pearson's correlation analysis. TCGA data from
patients with alcohol-associated were divided into two groups
according to the mean expression levels of the hub genes, and
Kaplan-Meier survival analysis was used to detect the prognostic
values of these genes.
Tissue samples
In total, 30 pairs of alcohol-associated HCC and
adjacent normal tissues were provided by patients with a long
history of alcohol consumption; 30 pairs of non-alcohol-associated
HCC tissues and their adjacent normal tissue samples were also
donated by patients with HCC, who did not consume alcohol or
consumed low levels (which failed to meet the criteria for a long
history of alcohol consumption). The criteria for a long history of
alcohol consumption were as follows: i) History of drinking >5
years; and ii) an average alcohol consumption >40 ml per day in
men, and >20 ml per day in women. There were 23 patients with
HBV infection and 4 patients with HCV infection in both the
alcohol- and the non-alcohol-associated HCC group; in addition,
there were 3 patients in both groups, which had neither HBV nor HCV
infection. This was used to group the two sets of patients
according to infection status (HBV, HCV or not infected), as this
can affect expression levels of genes. The tissues were collected
between March 2017 and June 2019. The mean age of patients with
alcohol-associated HCC was 55.2±7.4 years (range, 39–63; with 13
females and 17 male), while the mean age of the patients with
non-alcohol associated HCC was 53.1±9.2 years (range, 36–65; with
14 females and 16 males). All samples were obtained from the
Affiliated Hospital of Guizhou Medical University, (Guizhou, China)
and the study was approved by the Ethics Committee of Guizhou
Medical University and performed in accordance with the Declaration
of Helsinki. Informed consent was provided from all patients.
Reverse transcription-quantitative PCR
(RT-qPCR)
Total RNA was extracted from non-alcohol- and
alcohol-associated HCC tissues using TRIzol® reagent
(Invitrogen; Thermo Fisher Scientific, Inc.), and reverse
transcribed into cDNA using the First Strand cDNA Synthesis kit
(Shanghai Yeasen Biotechnology Co., Ltd.). under the following
conditions: 37°C for 15 min, 85°C for 30 sec and 4°C for 5 min.
qPCR was performed using SYBR® Green master mix
(Shanghai Yeasen Biotechnology Co., Ltd. and GAPDH was used as the
internal reference. The primer sequences for target genes were as
follows: AURKB forward, 5′-CAGTGGGACACCCGACATC-3′ and reverse,
5′-GTACACGTTTCCAAACTTGCC-3′; BUB1 forward,
5′-TGGGAAAGATACATACAGTGGGT-3′ and reverse,
5′-AGGGGATGACAGGGTTCCAAT-3′; BUB1B forward,
5′-AAATGACCCTCTGGATGTTTGG-3′ and reverse,
5′-GCATAAACGCCCTAATTTAAGCC-3′; CCNB1 forward,
5′-AATAAGGCGAAGATCAACATGGC-3′ and reverse,
5′-TTTGTTACCAATGTCCCCAAGAG-3′; CCNB2 forward,
5′-CCGACGGTGTCCAGTGATTT-3′ and reverse,
5′-TGTTGTTTTGGTGGGTTGAACT-3′; CDC20 forward,
5′-GCACAGTTCGCGTTCGAGA-3′ and reverse, 5′-CTGGATTTGCCAGGAGTTCGG-3′;
CDCA8 forward, 5′-GAAGGGCAGTAGTCGGGTG-3′ and reverse,
5′-TCACGGTCGAAGTCTTTCAGA-3′; CDK1 forward,
5′-AAACTACAGGTCAAGTGGTAGCC-3′ and reverse,
5′-TCCTGCATAAGCACATCCTGA-3′; PLK1 forward,
5′-AAAGAGATCCCGGAGGTCCTA-3′ and reverse,
5′-GGCTGCGGTGAATGGATATTTC-3′; RPS5 forward,
5′-ATGACCGAGTGGGAGACAG-3′ and reverse, 5′-GCTTTGCGGAAGCGTTTGG-3′;
RPS7 forward, 5′-GTGAAGCCCAATGGCGAGAA-3′ and reverse,
5′-TGAGGTCCGAGTTCATCTCCA; RPS8 forward, 5′-TGAGGTCCGAGTTCATCTCCA-3′
and reverse, 5′-AGCACGATGCAATTCTTCACC;-3′ RPS14 forward,
5′-CCATGTCACTGATCTTTCTGGC-3′ and reverse,
5′-TCATCTCGGTCTGCCTTTACC-3′; RPS27 forward,
5′-ATGCCTCTCGCAAAGGATCTC-3′ and reverse,
5′-TGAAGTAGGAATTGGGGCTCT-3′; RPSA forward,
5′-GTGGCACCAATCTTGACTTCC-3′ and reverse,
5′-GCAGGGTTTTCAATGGCAACAA-3′; TOP2A forward,
5′-ACCATTGCAGCCTGTAAATGA-3′ and reverse,
5′-GGGCGGAGCAAAATATGTTCC-3′; GAPDH forward,
5′-GGAGCGAGATCCCTCCAAAAT-3′ and reverse,
5′-GGCTGTTGTCATACTTCTCATGG-3′. The reaction was performed using the
following thermocycling conditions: Initial denaturation at 95°C
for 30; 40 cycles of 95°C for 30 sec and 60°C for 30 sec. The
relative level of gene expression was calculated using the
2−ΔΔCq method (14).
Immunohistochemistry (IHC)
The tissue samples were fixed in 4% paraformaldehyde
for 24 h at room temperature, dehydrated using ethyl alcohol (98%)
at 40°C and embedded in paraffin (Wuhan Boster Biological
Technology, Ltd.,) and subsequently cut into 4-µm sections. The
samples were then deparaffinized using xylene and rehydrated at
room temperature in a descending alcohol series. Following antigen
retrieval with sodium citrate at 100°C, the samples were treated
with 3% hydrogen peroxide to block endogenous peroxidase activity,
and then blocked with 5% BSA (Wuhan Boster Biological Technology,
Ltd.,) for 30 min at room temperature. The specimens were
subsequently incubated with a primary anti-RPS8 antibody (1:40;
cat. no. 18228-1-AP; ProteinTech Group, Inc.,) for 12 h at 4°C,
followed by incubation with horseradish peroxidase (HRP)-conjugated
secondary antibody (1:100; cat. no. G1210-2-A-100; Wuhan Servicebio
Technology Co., Ltd.) for 2 h at room temperature. After
development using the Cell and Tissue Staining HRP-DAB kit
(Beyotime Institute of Biotechnology) according to the
manufacturer's protocol, images were captured with an orthophoto
light microscope (magnification, ×200). Finally, the protein levels
of RPS8 were evaluated according to the percentage scores. The
proportion of positive cells were scored as follows: 0 (0-1%), 1
(1-33%), 2 (34-66%) and 3 (67-100%). The percentage scores were
determined using Image-Pro Plus software (version 6.0; Media
Cybernetics, Inc.). If the percentage scores in tumor tissues
(alcohol- or non-alcohol-associated HCC) was higher compared with
that in the corresponding adjacent tissues, the protein levels of
RPS8 was determined to be upregulated.
Gene set enrichment analysis
(GSEA)
Good samples were divided into two groups (high and
low) based on the median expression level of RPS8 [log (FPKM+1),
7.44]. To identify the potential pathways regulated by RPS8, GSEA
software (version 4.0.0; Broad Institute Inc; http://software.broadinstitute.org/gsea/index.jsp) was
used to determine whether a series of pathways were enriched in the
gene rank derived from the differentially expressed genes between
the two groups (high vs. low). Normalized enrichment score (NES)
was used to predict the association between RPS8 and the enriched
pathways; the higher the score indicates a stronger association).
Terms with P<0.01 and NES >1.5 were used as the cut-off
values.
Statistical analysis
The RT-qPCR experiment was repeated three times to
detect the expression of target genes and the data are presented as
the mean ± standard deviation. All statistical analyses in the
present study were performed using SPSS v21.0 (IBM Corp).
Comparisons between HCC tissues and adjacent normal tissues were
performed using paired t-test. P<0.05 was used to indicate a
statistically significant difference.
Results
Identification of good samples and
good genes in alcohol-associated HCC from TCGA
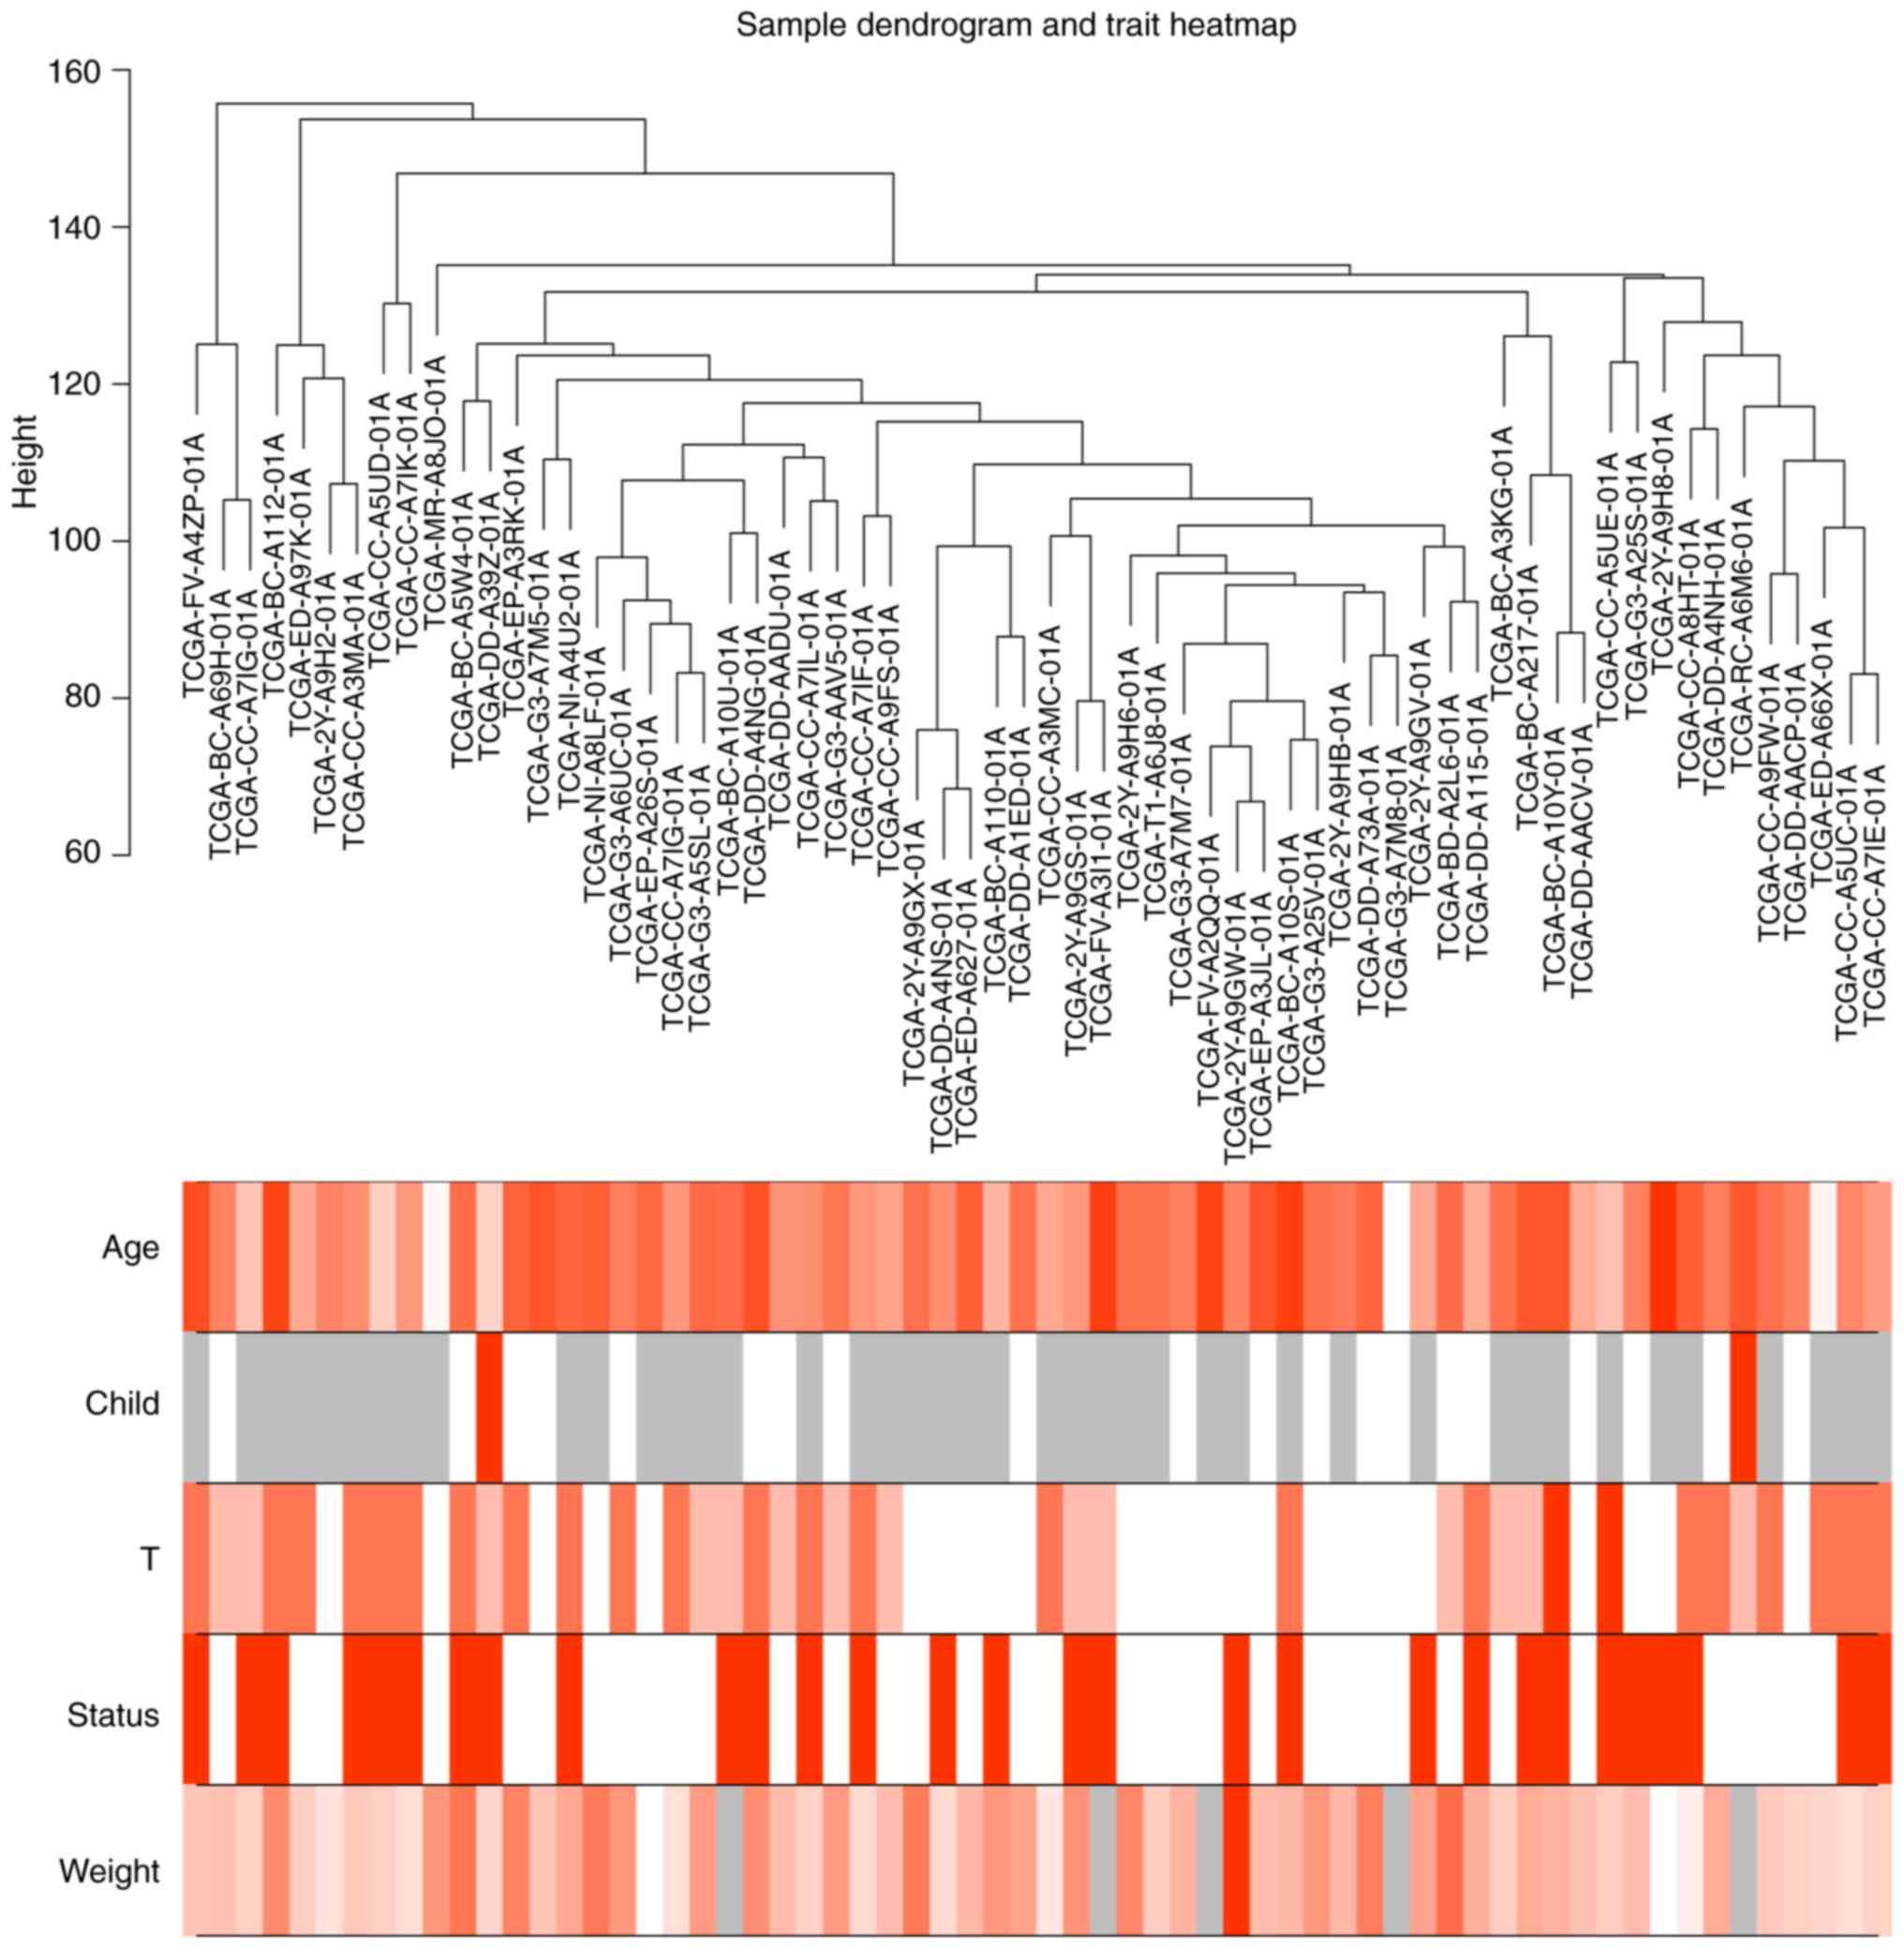
The gene data profiles and clinical traits of 68
patients with alcohol-associated HCC were obtained from TCGA
database. The results from using the Hclust algorithm for gene
expression profile revealed that 4 of the samples were outliers
with a height score >160, which were excluded from subsequent
analyses. The remaining 64 samples were identified as good samples
and are shown in the sample dendrogram and clustered according to
the height score of each sample; the corresponding clinical traits
of these patients, including age, Child-Pugh score, T-stage,
patient status (dead or alive) and body weight were also shown in
the heatmap and used for further analysis (Fig. 1). Similarly, following removal of
the probes without gene symbols, and genes with a mean expression
level <0.5, the remaining 15,195 genes were determined to be
good genes. Good genes and good samples were used to conduct
WGCNA.
WGCNA to identify ‘good samples’ and
‘good genes’
To ensure a high degree of independence (≥0.85; red
line) (Fig. 2A) and low mean
connectivity (~0.0) (Fig. 2B), a
soft power of β=14 was used between the soft power of 1–20 (red
numbers). Furthermore, scale free topology also verified that
β=14 could ensure independence >0.85 (Fig. 2C). The dissimilarity of the modules
was set as 0.2, and a total of 8 co-expressed gene modules (black,
green-yellow, brown, green, purple, pink, magenta and turquoise)
were identified with a module size cut-off ≥100. The grey colored
clusters represent the non-clustering genes (Fig. 2D).
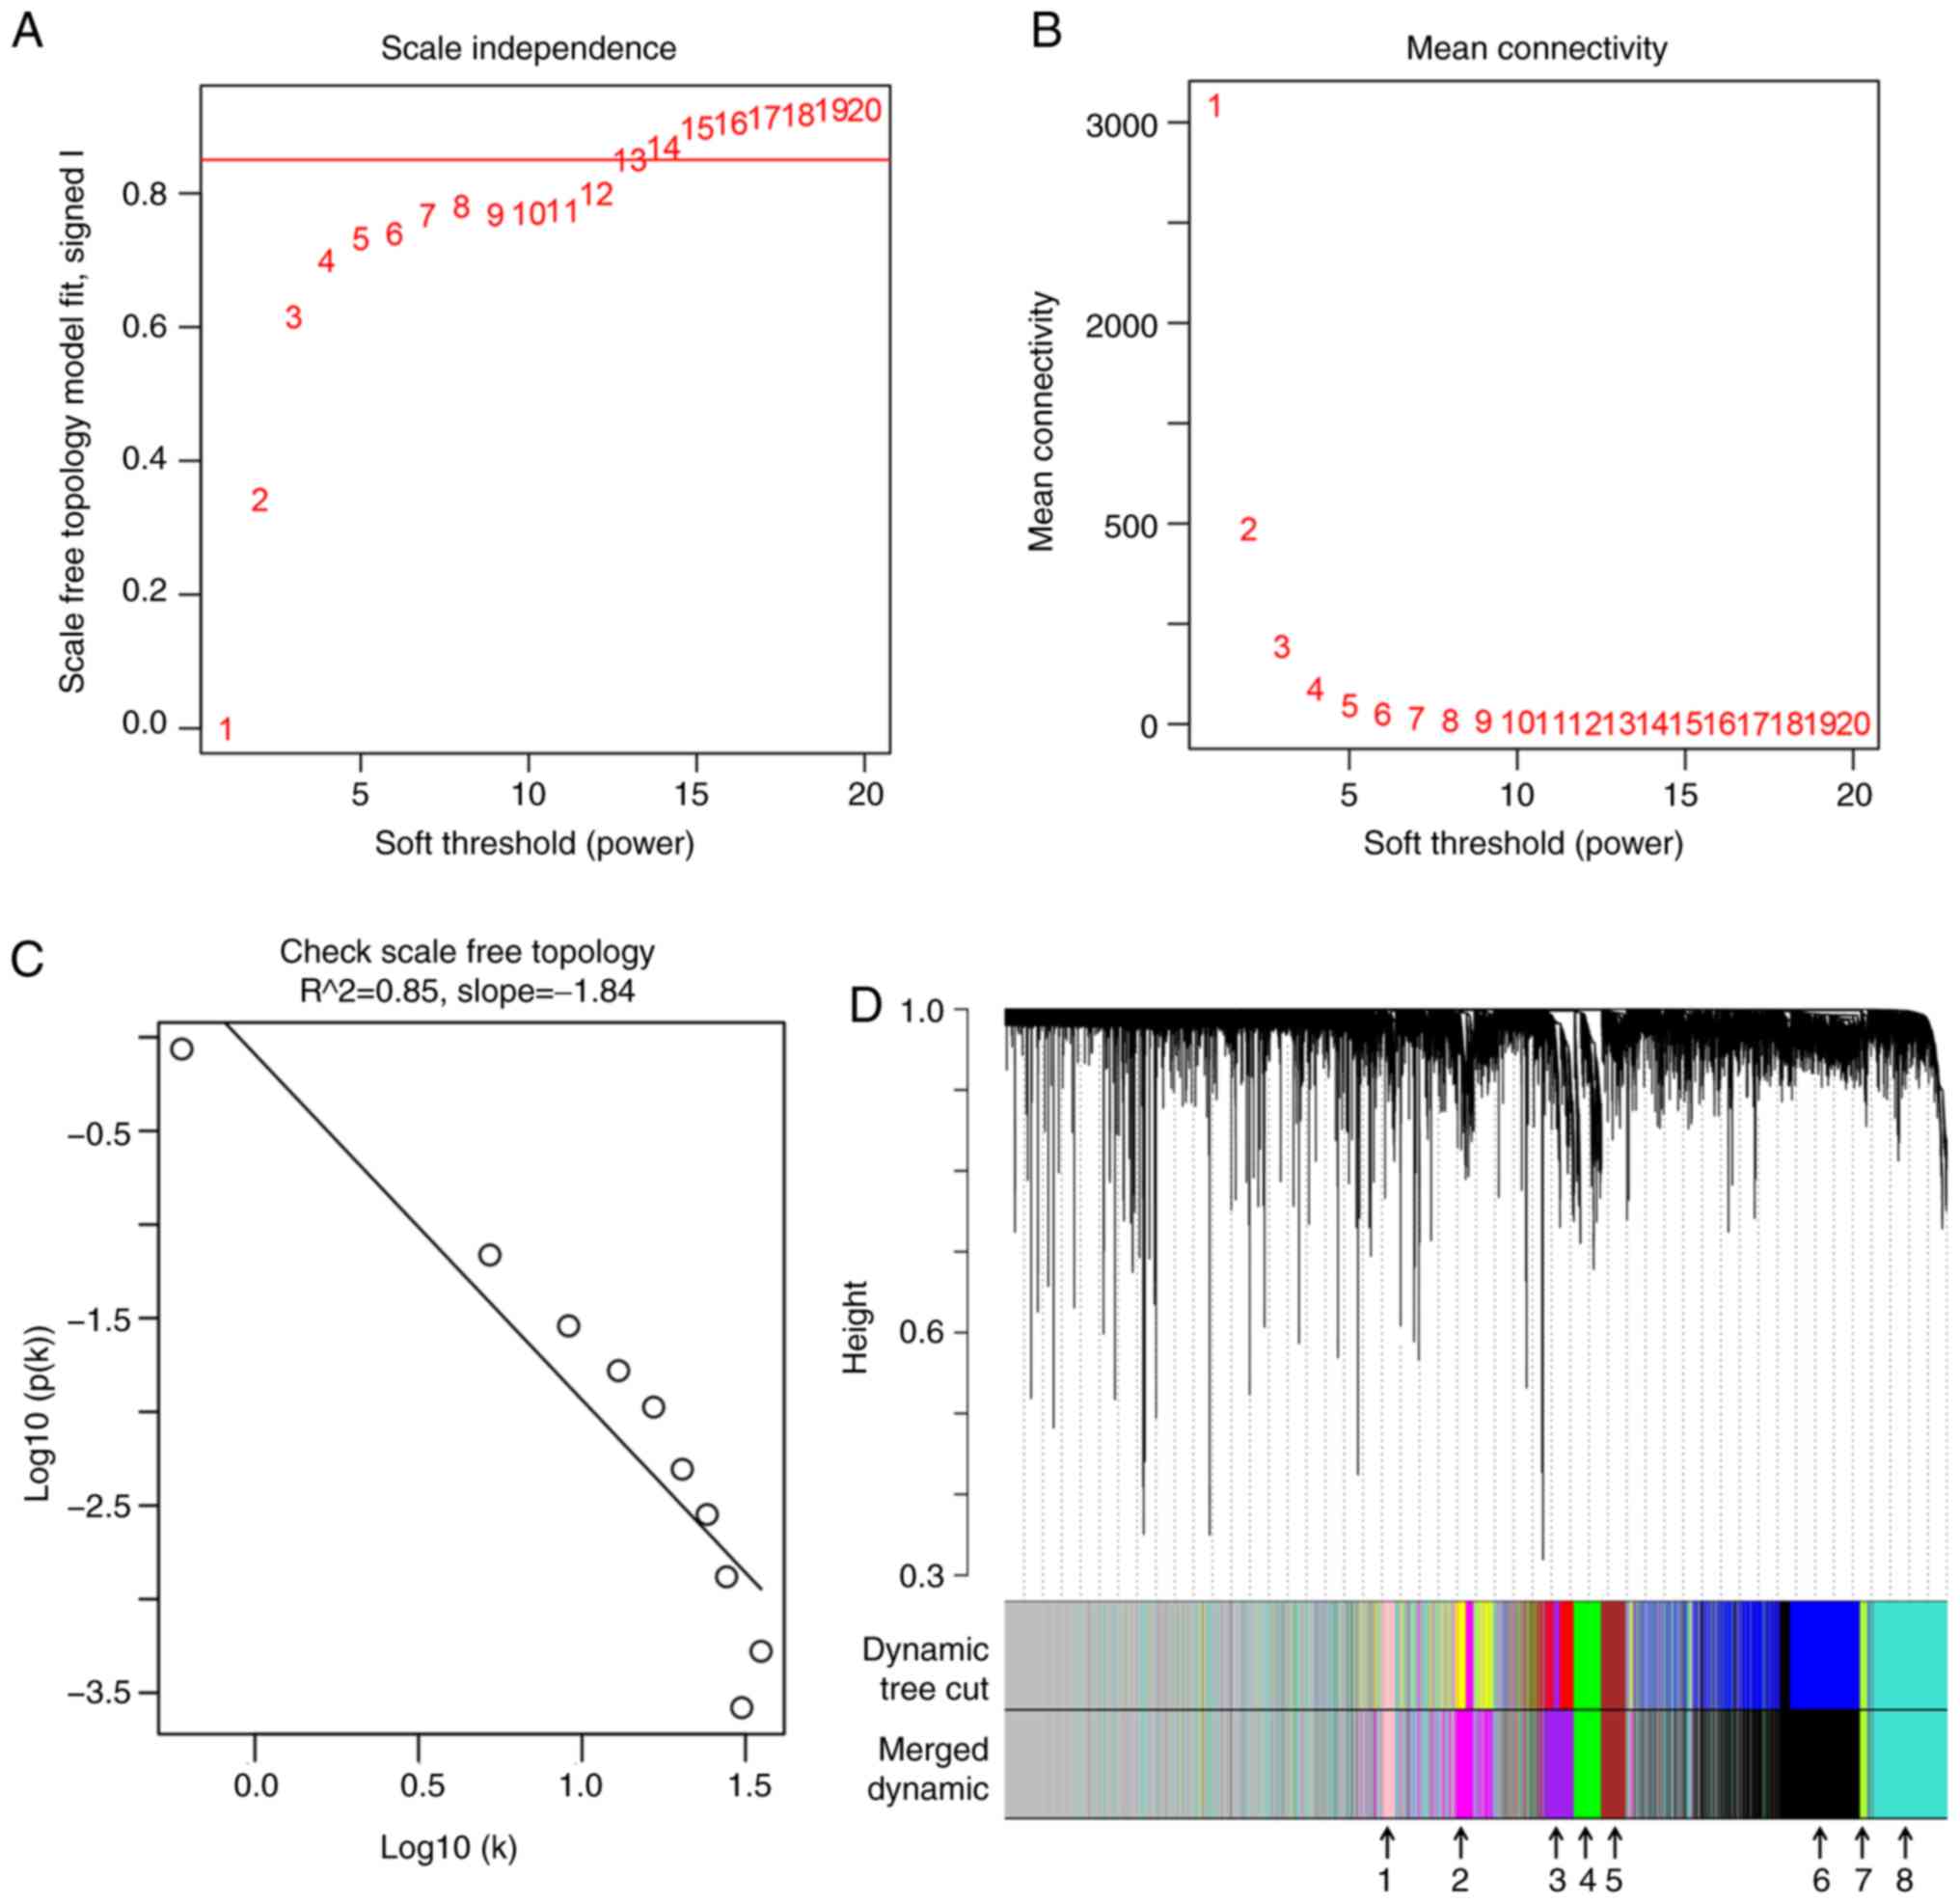 | Figure 2.WGCNA for the gene expression profile
of 64 alcohol-associated hepatocellular carcinoma from The Cancer
Genome Atlas database. (A and B) Scale independence and mean
connectivity of various soft-threshold values (β). The red number
indicates the different soft threshold values (1–20),
while the red lines indicates the cut-off values selected, as the
scale independence >0.85. (C) Gene sets (black circles) with
corresponding log10 (connectivity) and log10 P-value (connectivity)
when the scale-free topology is set as β=14. (D) Clustering
dendrograms of all genes with dissimilarity based on topological
overlap, together with assigned module colors. Different colors
represent different gene modules and there are 8 co-expressed
modules (merged dynamic) in the WGCNA network and the 8
co-expressed modules were indicated using arrows (1, pink; 2,
magenta; 3, purple; 4, green; 5, brown; 6, black, 7, green-yellow,
and 8, turquoise). WGCNA, weighted gene co-expression network
analysis. |
Pink, magenta and turquoise modules
were significant modules positively associated with the development
of alcohol-associated HCC
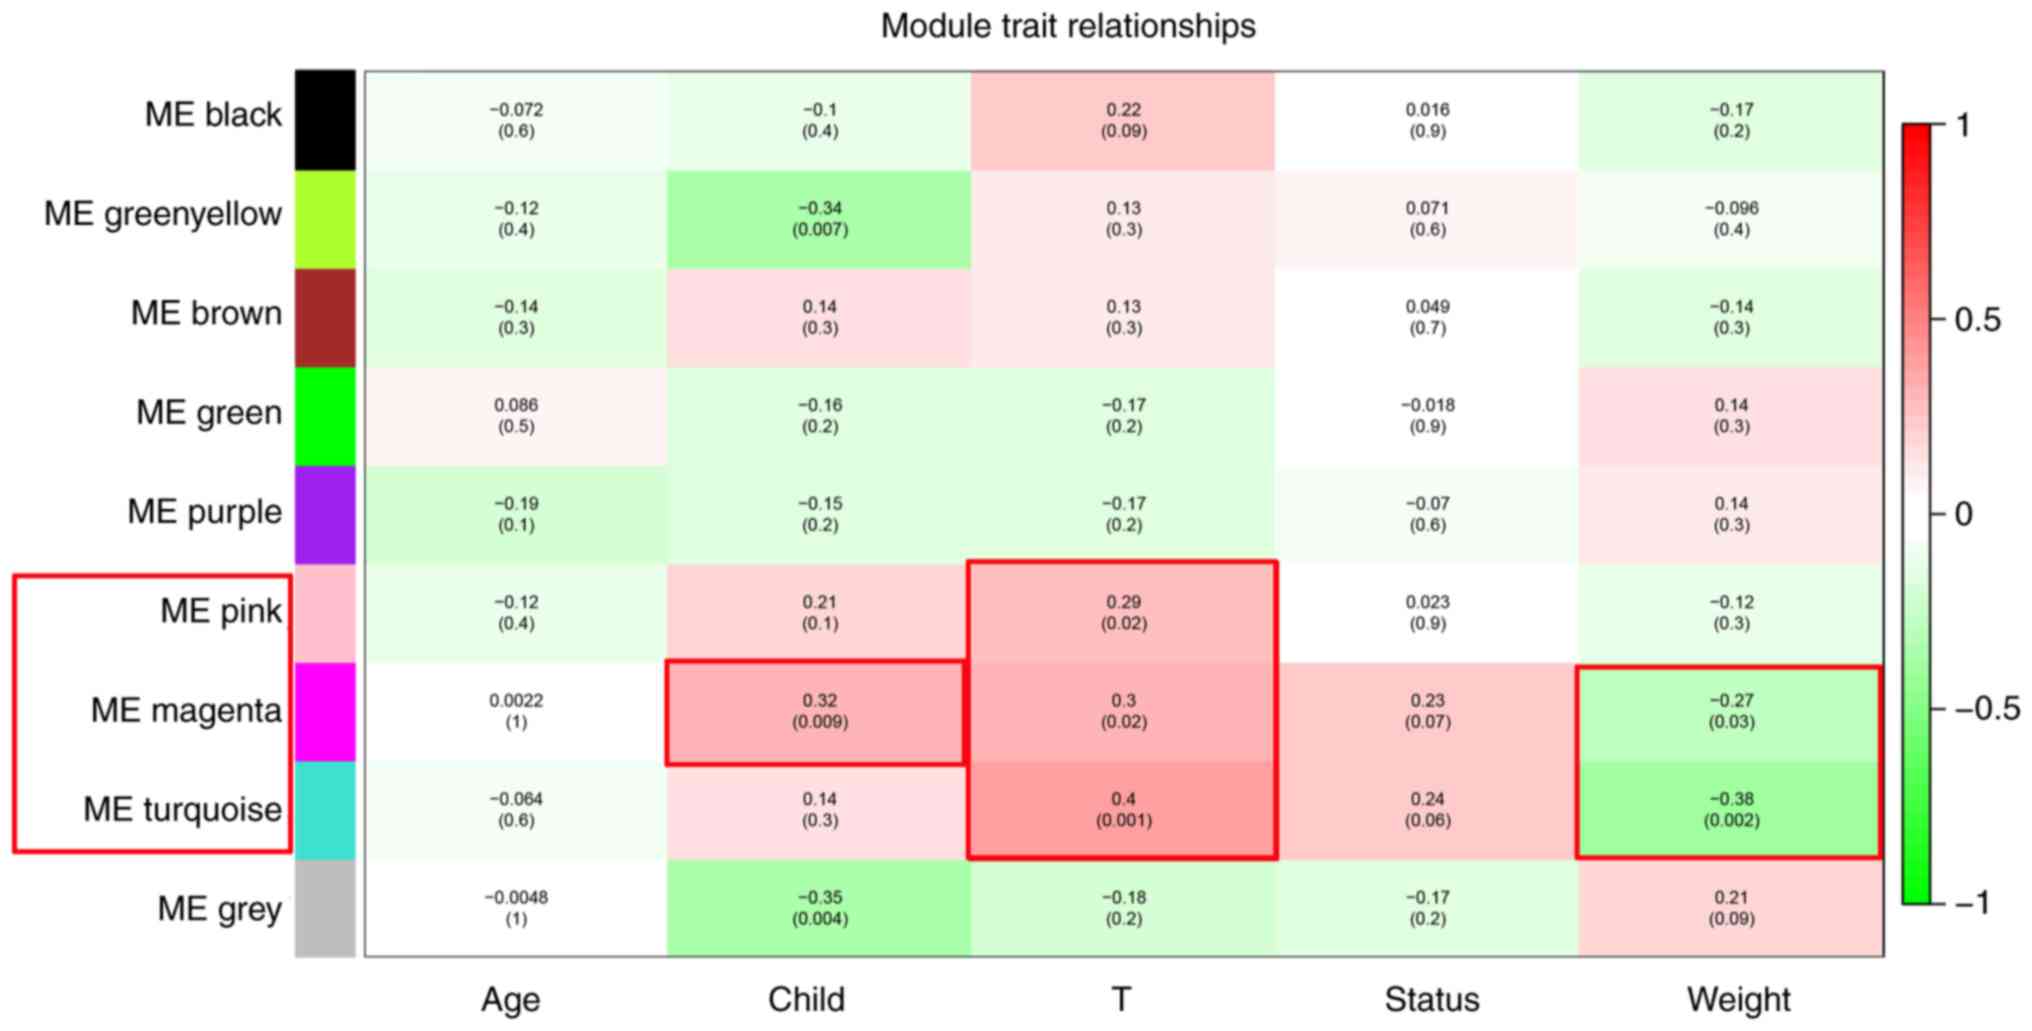
The association between modules and clinical trait
data was analyzed using WGCNA. The results revealed that 4 gene
co-expressed modules were associated with clinical traits. The
genes in the green-yellow module were negatively associated with
Child-Pugh score (R=−0.34; P=0.007), while genes in the pink module
were positively associated with T-stage (R=0.29; P=0.02). Genes in
the magenta module were positively associated with Child-Pugh score
(R=0.32; P=0.009) and T-stage (R=0.3; P=0.02) and negatively
associated with the weight of the patient (R=−0.27; P=0.03). The
turquoise module was positively associated with T-stage (R=0.4;
P=0.001) and negatively associated with the weight of the patient
(R=−0.38; P=0.002) (Fig. 3).
Positive associations with Child-Pugh score and T-stage, and
negative associations with the weight of the patient are all
unfavorable traits for patients with alcohol-associated HCC and
indicates the development of alcohol-associated HCC. Therefore,
genes in the modules associated with unfavorable traits were
further analyzed to identify hub genes positively associated with
the development of alcohol-associated HCC and were considered to be
oncogenes. In the pink, magenta and turquoise modules, 37, 111 and
204 genes with module membership >0.8 were identified as module
core genes, respectively.
GO and KEGG analysis of module core
genes
GO and KEGG analysis are methods used to identify
the function and pathways the genes of interest are involved in
(15). Therefore, the genes
identified in the modules following WGCNA were subsequently
analyzed to identify the pathways they are enriched in. The module
core genes in the pink module were only enriched in the biological
processes (BP) ‘negative regulation of organ growth’, ‘maturation
of SSU-rRNA from tricistronic rRNA transcript’ and the cellular
components (CC) ‘small-subunit processome’ (Table I). The top 10 terms in which the
magenta module core genes were enriched for were ‘protein binding’
and ‘poly(A) RNA binding’ for molecular function (MF), ‘cytosol’,
‘membrane’, ‘cytoplasm’ and ‘nucleus’ for CC and ‘rRNA processing’,
‘translational initiation’, ‘SRP-dependent cotranslational protein
targeting to membrane’ and ‘viral transcription’ for BP (Table II). The top 10 terms in which the
turquoise module core genes were enriched for were ‘cytoplasm’,
‘nucleoplasm’, ‘nucleus’, ‘membrane’, ‘nucleolus’ and ‘centrosome’
for CC, and ‘ATP binding’, ‘DNA binding’, ‘chromatin binding’ and
‘nuclear chromosome’ for MF (Table
III). The pink module core genes were not enriched in any
pathway from KEGG analysis; however, the magenta module hub genes
were enriched in the ‘ribosome’ and ‘spliceosome’ pathways
(Table IV), while the turquoise
module hub genes were enriched in ‘cell cycle’, ‘DNA replication’,
‘oocyte meiosis’, ‘fanconi anemia pathway’, ‘homologous
recombination’, ‘mismatch repair’, ‘progesterone-mediated oocyte
maturation’, ‘p53 signaling pathway’, ‘RNA transport’, ‘HTLV–I
infection’ and ‘pyrimidine metabolism’ (Table V).
 | Table I.GO analysis of core genes in the pink
module following weighted gene co-expression network analysis. |
Table I.
GO analysis of core genes in the pink
module following weighted gene co-expression network analysis.
| Category | ID | Term | Count | P-value | Genes |
|---|
| BP | GO: 0046621 | Negative regulation
of organ growth | 2 | 0.010954509 | PTK2, STK3 |
| BP | GO: 0000462 | Maturation of
SSU-rRNA from tricistronic rRNA transcript (SSU-rRNA, 5.8S rRNA,
LSU-rRNA) | 2 | 0.040116439 | UTP23, DCAF13 |
| CC | GO: 0032040 | Small-subunit
processome | 2 | 0.042149642 | UTP23, DCAF13 |
| Table II.GO analysis of core genes in the
magenta module following weighted gene co-expression network
analysis. |
Table II.
GO analysis of core genes in the
magenta module following weighted gene co-expression network
analysis.
| Category | ID | Term | Count | P-value | Genes |
|---|
| MF | GO: 0005515 | Protein
binding | 60 |
1.02×10⁻⁴ | CLTA, HRAS, RPL36A,
PTGES2, RPL19, RPL14, SNRPD1, COPS9, RPLP2, SNRPD2, RPS3, RPLP1,
LSM4, RPS27A, IMPDH2, PRPF31, RPL35A, EMG1, CCDC137, PA2G4, RPS19,
RPS16, NME1, RPS14, PFDN5, UBE2M, MZT2B, RPS13, RPS10, RPS11,
DYNLRB1, UBA52, SEC61G, RPL27A, NMB, ARPC4, RPS27, EIF3B, MYL6B,
PSMB3, RPL9, GEMIN7, RPSA, LAMTOR4, RPS9, RPL23A, RPL24, ZNF524,
RPS5, FBL, RPL28, RPS7, HSPBP1, NOSIP, RPL23, RPL18A, DPM2, RPL37A,
POP7, TXNL4A |
|
| GO: 0044822 | Poly(A) RNA
binding | 47 |
3.83×10⁻³³ | RPL36A, RPL19,
RPL14, RPL27A, RPL35, SNRPD1, RPL36, SNRPD2, RPS3, RPS27, RPL32,
REXO4, CCDC124, LSM4, RPS21, RPS27A, RPSA, RPL35A, PRPF31, RRP1,
EMG1, RPL27, RPS9, RPL24, RPL23A, CCDC137, RRP9, RPS5, RPL28, FBL,
RPS8, RPL29, RPS7, PA2G4, NOSIP, RPS19, RPS16, RPL18A, RPL23,
RPL13A, NME1, RPS14, RPS13, RPL37A, RPS10, RPS11, POP7 |
| CC | GO: 0005829 | Cytosol | 58 |
2.34×10⁻²⁴ | RPL18, CLTA, HRAS,
RPL36A, PTGES2, RPL19, RPL14, SNRPD1, RPLP2, SNRPD2, RPS3, RPLP1,
LSM4, RPS27A, IMPDH2, NT5C, RPL35A, RPS19, RPS16, NME1, RPS14,
UBE2M, RPS13, RPS10, RPS11, UBA52, SEC61G, POLR2H, RPL35, RPL27A,
RPL36, RPL37, ARPC4, RPL38, RPS27, EIF3B, RPL32, MYL6B, PSMB3,
RPL9, RPS21, GEMIN7, RPSA, RPS9, RPL27, RPL23A, RPL24, RPS5, RPS8,
RPL28, RPS7, RPL29, ITPA, NOSIP, RPL23, RPL18A, RPL13A, RPL37A |
|
| GO: 0016020 | Membrane | 41 |
2.77×10⁻¹⁶ | RPL18, CLTA, HRAS,
RPL19, RPL14, RPL27A, RPL35, RPLP2, RPL36, RPS3, RPL32, RPL9,
IMPDH2, RPS27A, PTDSS2, RPSA, RPL35A, RPL27, RPS9, RPL24, BCL2L12,
RPS5, RPL28, FBL, RPS8, RPL29, RPS7, PA2G4, RPS19, RPS16, RPL18A,
RPL23, CD320, NME1, RPL13A, RPS14, RPS13, RPS10, RPS11, DYNLRB1,
SEC61G |
|
| GO: 0005737 | Cytoplasm | 41 |
8.96×10⁻⁵ | RPL18, HRAS, RPL19,
RPL14, RPL35, COPS9, RPL36, RFXANK, RPS3, EIF3B, CCDC124, PSMB3,
RPL9, RPLP1, RPS21, GEMIN7, RPS27A, IMPDH2, NT5C, RPSA, EMG1, RPS9,
RPL24, RPL23A, RPL28, RPS8, RPS7, PA2G4, NOSIP, ITPA, RPS19, RPL23,
RPL13A, NME1, PFDN5, RPS14, UBE2M, RPS11, DYNLRB1, POP7,
TXNL4A |
|
| GO: 0005634 | Nucleus | 40 |
4.85×10⁻⁴ | RPL18, POLR2H,
HRAS, PTGES2, SNRPD1, COPS9, RFXANK, RPS3, RPS27, REXO4, PSMB3,
RPL9, GEMIN7, RPS27A, IMPDH2, NT5C, RPSA, PRPF31, RRP1, EMG1,
RPL27, RPS9, RPL23A, RRP9, BCL2L12, ZNF524, FBL, RPS8, RPS7, PA2G4,
NOSIP, RPL13A, NME1, PFDN5, RPS13, SURF2, RPL37A, UBA52, POP7,
TXNL4A |
| Table III.GO analysis of core genes in the
turquoise module following weighted gene co-expression network
analysis. |
Table III.
GO analysis of core genes in the
turquoise module following weighted gene co-expression network
analysis.
| Category | ID | Term | P-value | Genes |
|---|
| CC | GO: 0005737 | Cytoplasm |
2.78×10⁻⁶ | RAD51D, PRC1, EZH2,
PRR11, PKMYT1, PTTG1, MCM10, FANCI, CDCA2, ORC1, CDCA5, CDK1,
MCRS1, KIF11, STK25, DSN1, DTL, MTA3, NUSAP1, MCM2, TACC3, UBE2C,
ECT2, RAD51, NCAPD2, CAPN10, SGO1, FANCD2, ZWINT, STMN1, MELK,
UBE2T, NEK2, FOXM1, POLA1, COPS7B, NDC1, SRRT, NCAPG, HJURP,
SPATS2, BUB1, ERCC6L, GIT1, EXO1, DLGAP5, EME1, KIF18A, CDC20,
BIRC5, SPDL1, ZBED8, RACGAP1, CENPI, BRCA1, PLK1, POLD1 |
|
| GO: 0005654 | Nucleoplasm |
6.24×10⁻¹⁸ | KIF23, ITGB3BP,
RAD51D, PRC1, AURKB, FANCI, CDCA2, NUP37, CDCA5, TOP2A, KHDRBS1,
CDC6, DTL, LIG1, RBL1, TPX2, MCM2, MCM3, MCM4, MCM5, HNRNPU, MCM6,
RAD51, NCAPD2, RAD1, SGO2, SGO1, RAD18, THOC5, KPNA2, LMNB1, FOXM1,
TIPIN, POLA1, ANLN, CHEK1, MYBL2, HNRNPA3, HNRNPL, SRRT, BUB1,
WDHD1, FEN1, ERCC6L, CENPO, EXO1, NASP, CDC20, ZBED8, RACGAP1,
RAD54L,POLD1, TUBD1, RBM14, CHAF1B, PIP4K2B |
|
| GO: 0005634 | Nucleus |
6.98×10⁻⁵ | RALY, DTYMK, PRR11,
PKMYT1, PTTG1, CDT1, TLK2, CDCA5, TOP2A, CDCA4, LIG1, RBL1, CCNF,
MCM2, UBE2C, ECT2, HNRNPU, RAD51, ZSWIM1, SGO1, FANCD2, RRM2,
RAD18, MELK, UBE2T, NEK2, FOXM1, CERS5, MYBL2, VPS72, HJURP, CENPA,
RHNO1, ASF1B, TPRKB, DLGAP5, KIF18A, NUF2, SPDL1, BIRC5, EHMT2,
BRCA1, CENPI, SUV39H2, CENPH, CCNB1, CCNB2, WDR62, SFPQ,
CHAF1B |
|
| GO: 0016020 | Membrane |
5.67×10⁻⁹ | KIFC1, PRR11,
PKMYT1, TTK, COIL, HNRNPL, KIF2C, NCAPH, FANCI, NCAPG, EDC3, BUB1,
GIT1, KHDRBS1, CDK1, KIF11, MKI67, MSH2, KIF15, NUF2, NUP85, NDC80,
NUP155, MCM3, MCM4, RBMX, MCM5, HNRNPU, NCAPD2, POLD1, STMN1,
KPNA2, NKIRAS2 |
|
| GO: 0005730 | Nucleolus |
3.09×10⁻⁴ | MCRS1, MKI67, DTL,
POLA1, NUSAP1, MCM10, PPP1CC, COIL, RAD51, CDCA8, FANCD2, HJURP,
PLK1, RAE1, FANCG, ORC1, TOP2A, FEN1 |
|
| GO: 0005813 | Centrosome |
9.07×10⁻⁷ | RAD51D, KIF23,
CDK1, HAUS5, XRCC2, NEK2, DTL, CHEK1, MCM3, CDC45, SGO1, WDR62,
NCAPG, PLK1, CKAP2L, RAD18, ERCC6L |
| MF | GO: 0005524 | ATP binding |
1.09×10⁻¹³ | KIF23, RAD51D,
KIFC1, KIF4A, XRCC2, NEK2, DTYMK, PKMYT1, TTK, CHEK1, AURKB, KIF2C,
BUB1, TLK2, CDK16, TOP2A, ORC1, ERCC6L, TRIP13, CDK1, CDC6, KIF11,
STK25, MSH2, LIG1, KIF15, KIF18A, KIF18B, ATAD5, CENPE, MCM2, MCM3,
UBE2C, MCM4, RAD54L, MCM5, MCM6, RAD51, RFC4, PLK1, MYO19, UBE2T,
MELK, KIF20A |
|
| GO: 0003677 | DNA binding |
1.00×10⁻⁴ | EXO1, LIG1, EME1,
TIPIN, POLA1, CERS5, MCM2, ZBED8, MCM3, BRCA1, CDT1, SRRT, POLD1,
PRIM2, H2AFZ, CENPW, FEN1 |
|
| GO: 0003682 | Chromatin
binding |
6.55×10⁻⁷ | EXO1, CDK1, CDC45,
POLD1, MTA3, POLA1, FAAP24, ACTL6A, CDCA5, RBMX, TOP2A, ORC1,
UBE2T, MCM5, NCAPD2, RAD51 |
| Table IV.Kyoto Encyclopedia of Genes and
Genomes analysis of core genes in the magenta module following
weighted gene co-expression network analysis. |
Table IV.
Kyoto Encyclopedia of Genes and
Genomes analysis of core genes in the magenta module following
weighted gene co-expression network analysis.
| ID | Term | Count | P-value | Genes |
|---|
| hsa03010 | Ribosome | 39 |
6.2923×10−50 | RPL18, RPL36A,
RPL19, RPL14, RPL27A, RPL35, RPLP2, RPL36, RPL37, RPL38, RPS3,
RPS27, RPL32, RPL9, RPLP1, RPS21, RPS27A, RPSA, RPL35A, RPL27,
RPS9, RPL24, RPL23A, RPS5, RPL28, RPS8, RPL29, RPS7, RPS19, RPS16,
RPL18A, RPL23, RPL13A, RPS14, RPS13, RPS10, RPL37A, RPS11,
UBA52 |
| hsa03040 | Spliceosome | 5 | 0.036532189 | PRPF31, SNRPD1,
LSM4, SNRPD2, TXNL4A |
| Table V.Kyoto Encyclopedia of Genes and
Genomes analysis of module core genes in the turquoise module
following weighted gene co-expression network analysis. |
Table V.
Kyoto Encyclopedia of Genes and
Genomes analysis of module core genes in the turquoise module
following weighted gene co-expression network analysis.
| ID | Term | Count | P-value | Genes |
|---|
| Hsa04110 | Cell cycle | 23 |
6.88×10⁻²¹ | E2F1, E2F2, CDC6,
CDK1, RBL1, PKMYT1, TTK, CHEK1, CDC20, PTTG1, MCM2, MCM3, MCM4,
MCM5, MCM6, CCNB1, CDC45, CCNB2, PLK1, BUB1, BUB1B, ANAPC7,
ORC1 |
| hsa03030 | DNA
replication | 11 |
5.06×10⁻¹² | RFC4, LIG1, POLD1,
PRIM2, POLA1, MCM2, MCM3, MCM4, MCM5, FEN1, MCM6 |
| hsa04114 | Oocyte meiosis | 11 |
5.09×10⁻⁷ | CCNB1, CDK1, CCNB2,
PLK1, SGO1, BUB1, PKMYT1, CDC20, PTTG1, ANAPC7, PPP1CC |
| hsa03460 | Fanconi anemia
pathway | 8 |
2.21×10⁻⁶ | FANCD2, FANCI,
EME1, FAAP24, FANCG, BRCA1, UBE2T, RAD51 |
| hsa03440 | Homologous
recombination | 6 |
1.79×10⁻⁵ | RAD51D, XRCC2,
POLD1, EME1, RAD54L, RAD51 |
| hsa03430 | Mismatch
repair | 5 |
1.27×10⁻⁴ | EXO1, RFC4, MSH2,
LIG1, POLD1 |
| hsa04914 |
Progesterone-mediated oocyte
maturation | 7 |
4.89×10⁻⁴ | CCNB1, CDK1, CCNB2,
PLK1, BUB1, PKMYT1, ANAPC7 |
| hsa0411 | 5:p53 signaling
pathway | 6 |
1.03×10⁻³ | CCNB1, CDK1, CCNB2,
RRM2, CHEK1, GTSE1 |
| hsa03013 | RNA transport | 8 |
3.70×10⁻³ | NDC1, SUMO2, RAE1,
NUP37, NUP85, THOC5, NUP155, TACC3 |
| hsa05166 | HTLV–I
infection | 9 |
9.02×10⁻³ | E2F1, DVL3, E2F2,
POLD1, BUB1B, CHEK1, CDC20, PTTG1, ANAPC7 |
| hsa00240 | Pyrimidine
metabolism | 5 |
2.96×10⁻² | POLD1, RRM2, DTYMK,
PRIM2, POLA1 |
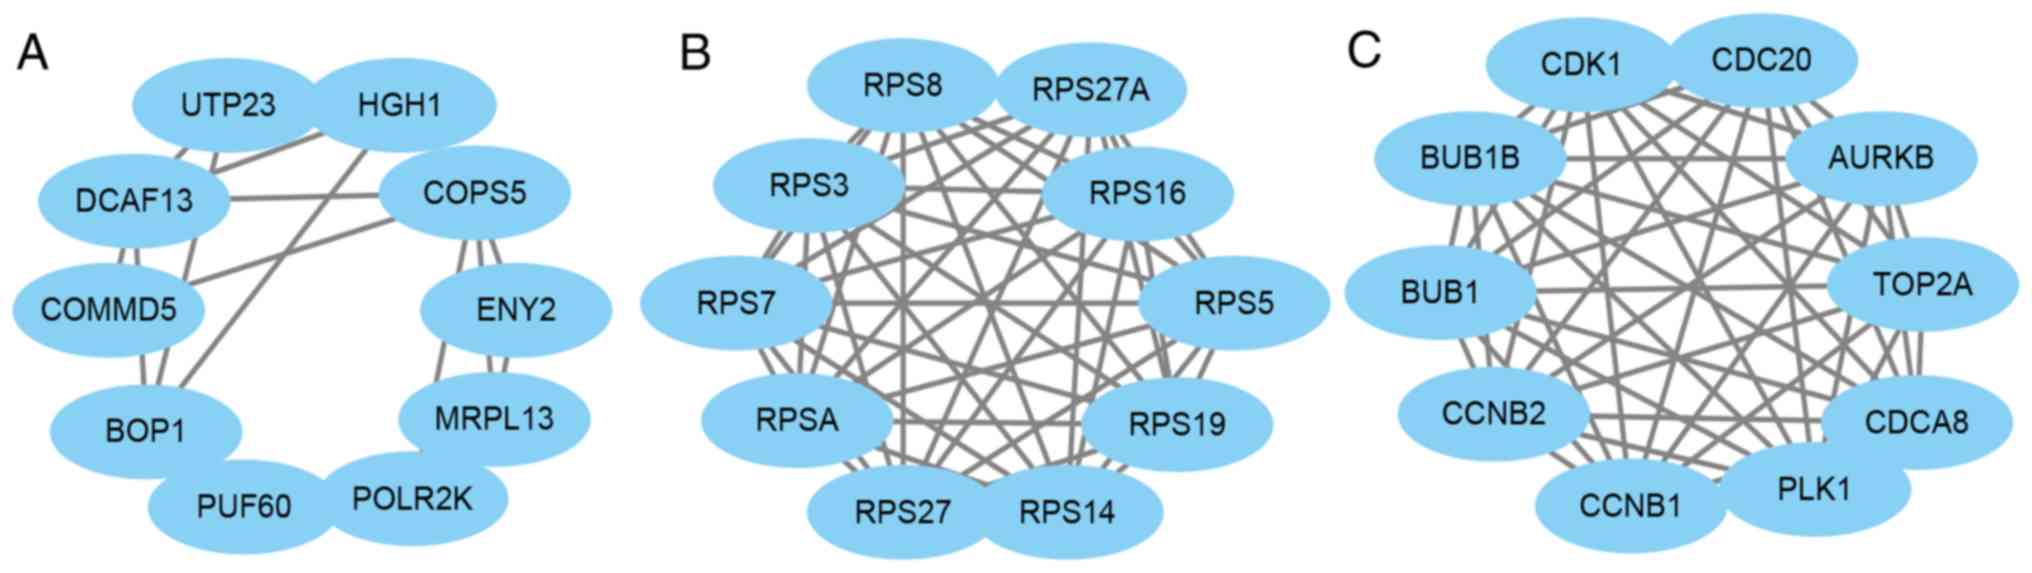
PPI network construction of core
genes
The core genes in the pink, magenta and turquoise
modules were then used to construct a PPI network using STRING,
while Cytoscape was used to analyze and determine the hub genes
based on degree score. The results revealed that MRPL13, UTP23,
HGH1, DCAF13, BOP1, PUF60, COMMD5, POLR2K, ENY2 and COPS5 were all
hub genes in the pink module (Fig.
4A), while RPS19, RPS7, RPS5, RPS16, RPS3, RPS8, RPSA, RPS27A,
RPS27 and RPS14 were hub gens in the magenta module (Fig. 4B). Furthermore, CDCA8, CDC20, BUB1B,
AURKB, TOP2A, CDK1, CCNB1, PLK1, BUB1 and CCNB2 were hub genes in
the turquoise module (Fig. 4C).
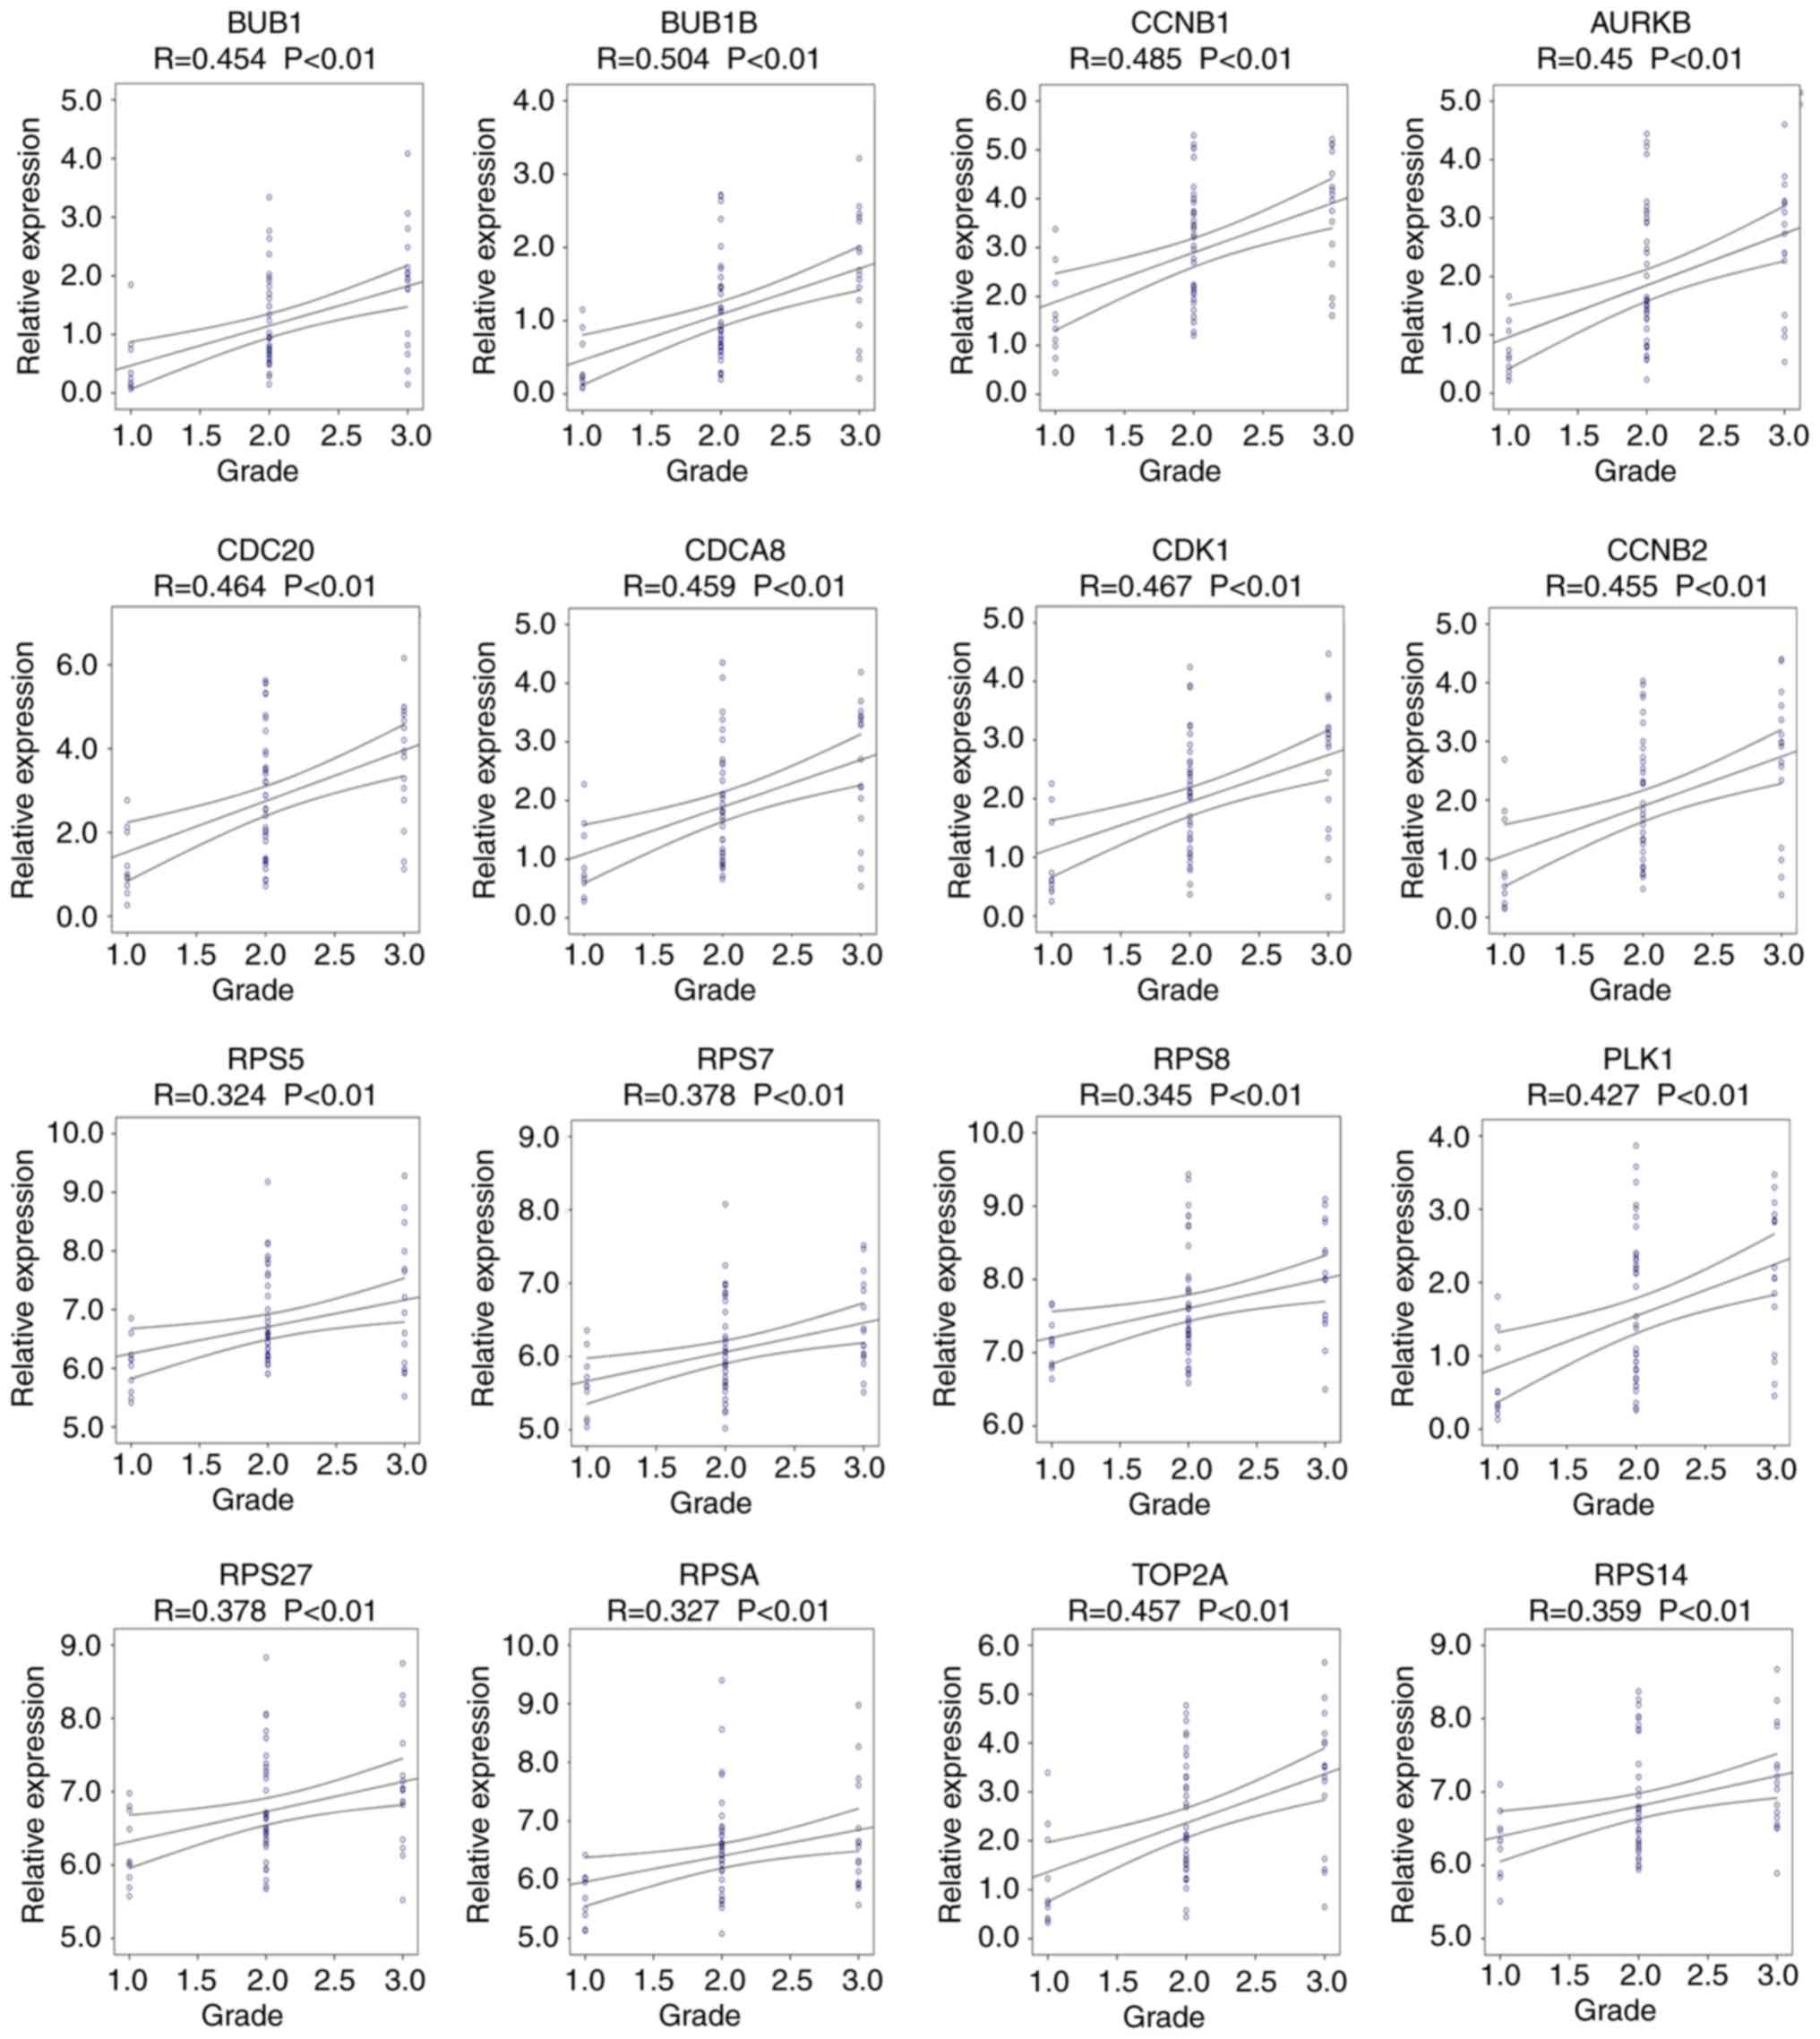
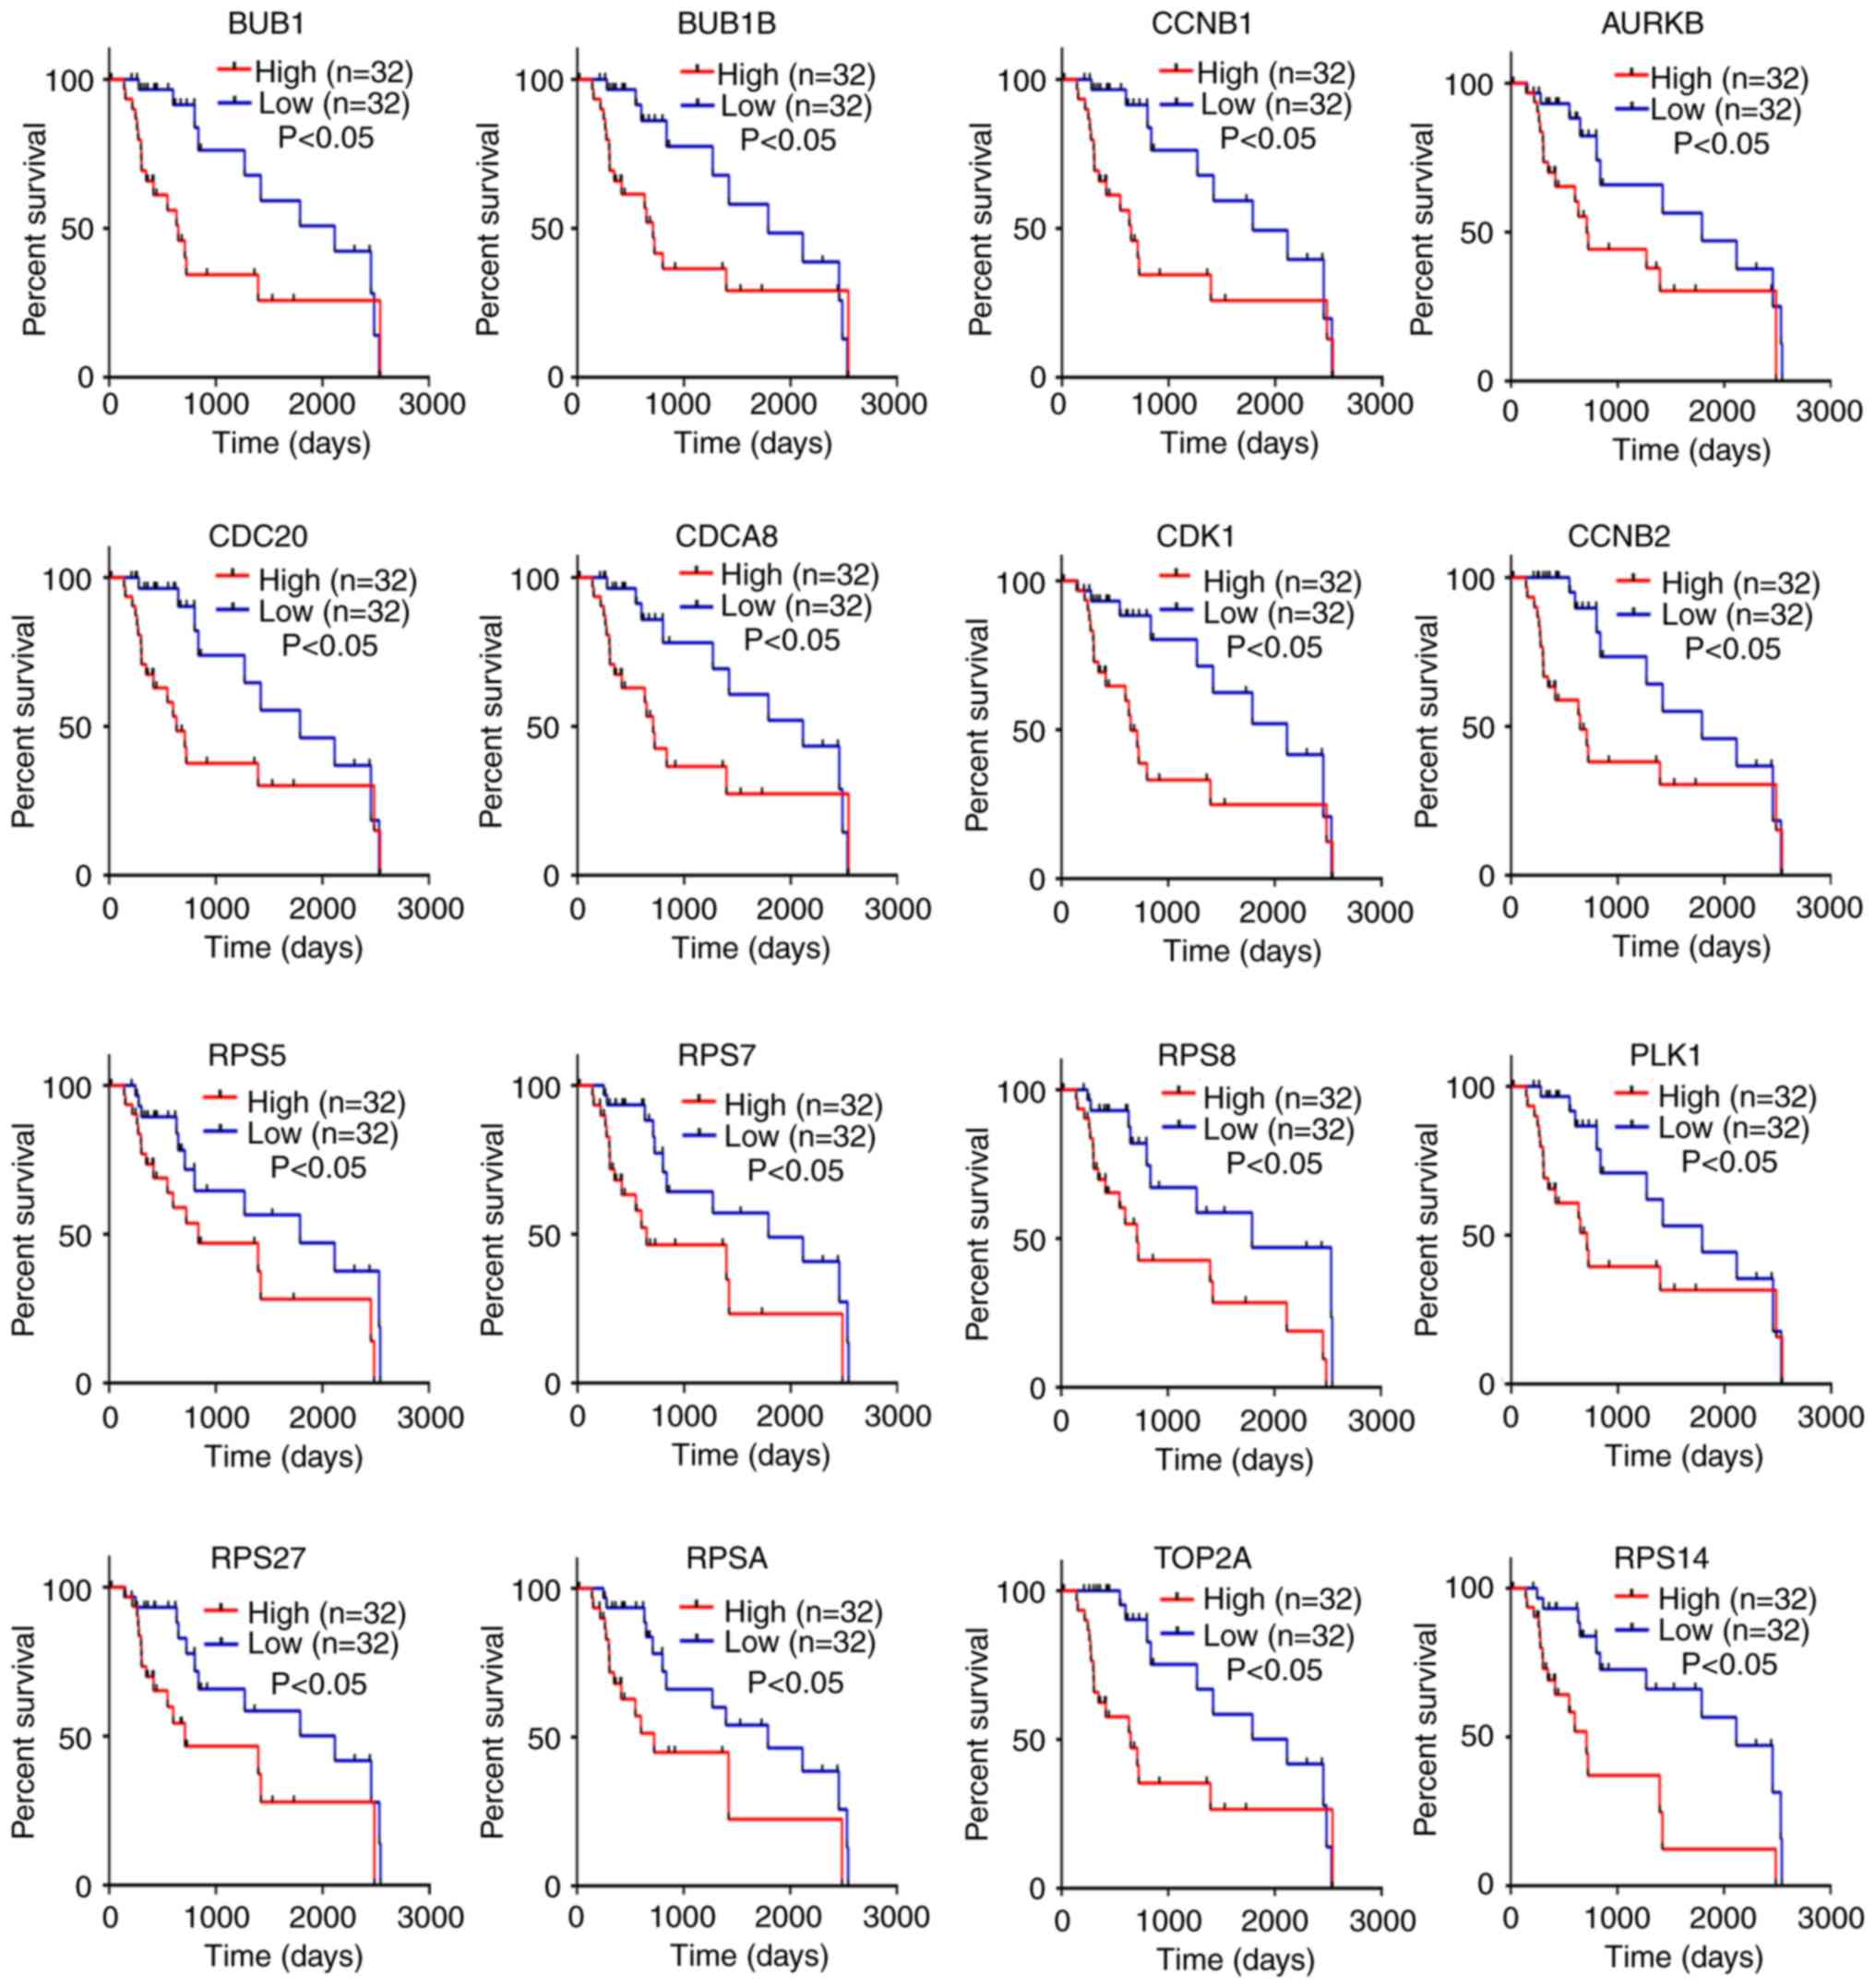
Progression and survival analysis of
hub genes
Pearson's correlation analysis was performed to
determine the association between hub gene expression and the
progression of alcohol-associated HCC. The results indicated that
the expression of AURKB, BUB1, BUB1B, CCNB1, CCNB2, CDC20, CDCA8,
CDK1, PLK1, RPS5, RPS7, RPS8, RPS14, RPS27, RPSA and TOP2A was
positively associated with the progression of alcohol-associated
HCC (P<0.01; Fig. 5). Similarly,
high expression levels of these genes were significantly associated
with poor prognosis (P<0.05; Fig.
6). Taken together, these results indicate that AURKB, BUB1,
BUB1B, CCNB1, CCNB2, CDC20, CDCA8, CDK1, PLK1, RPS5, RPS7, RPS8,
RPS14, RPS27, RPSA and TOP2A may be real hub genes for
alcohol-associated HCC.
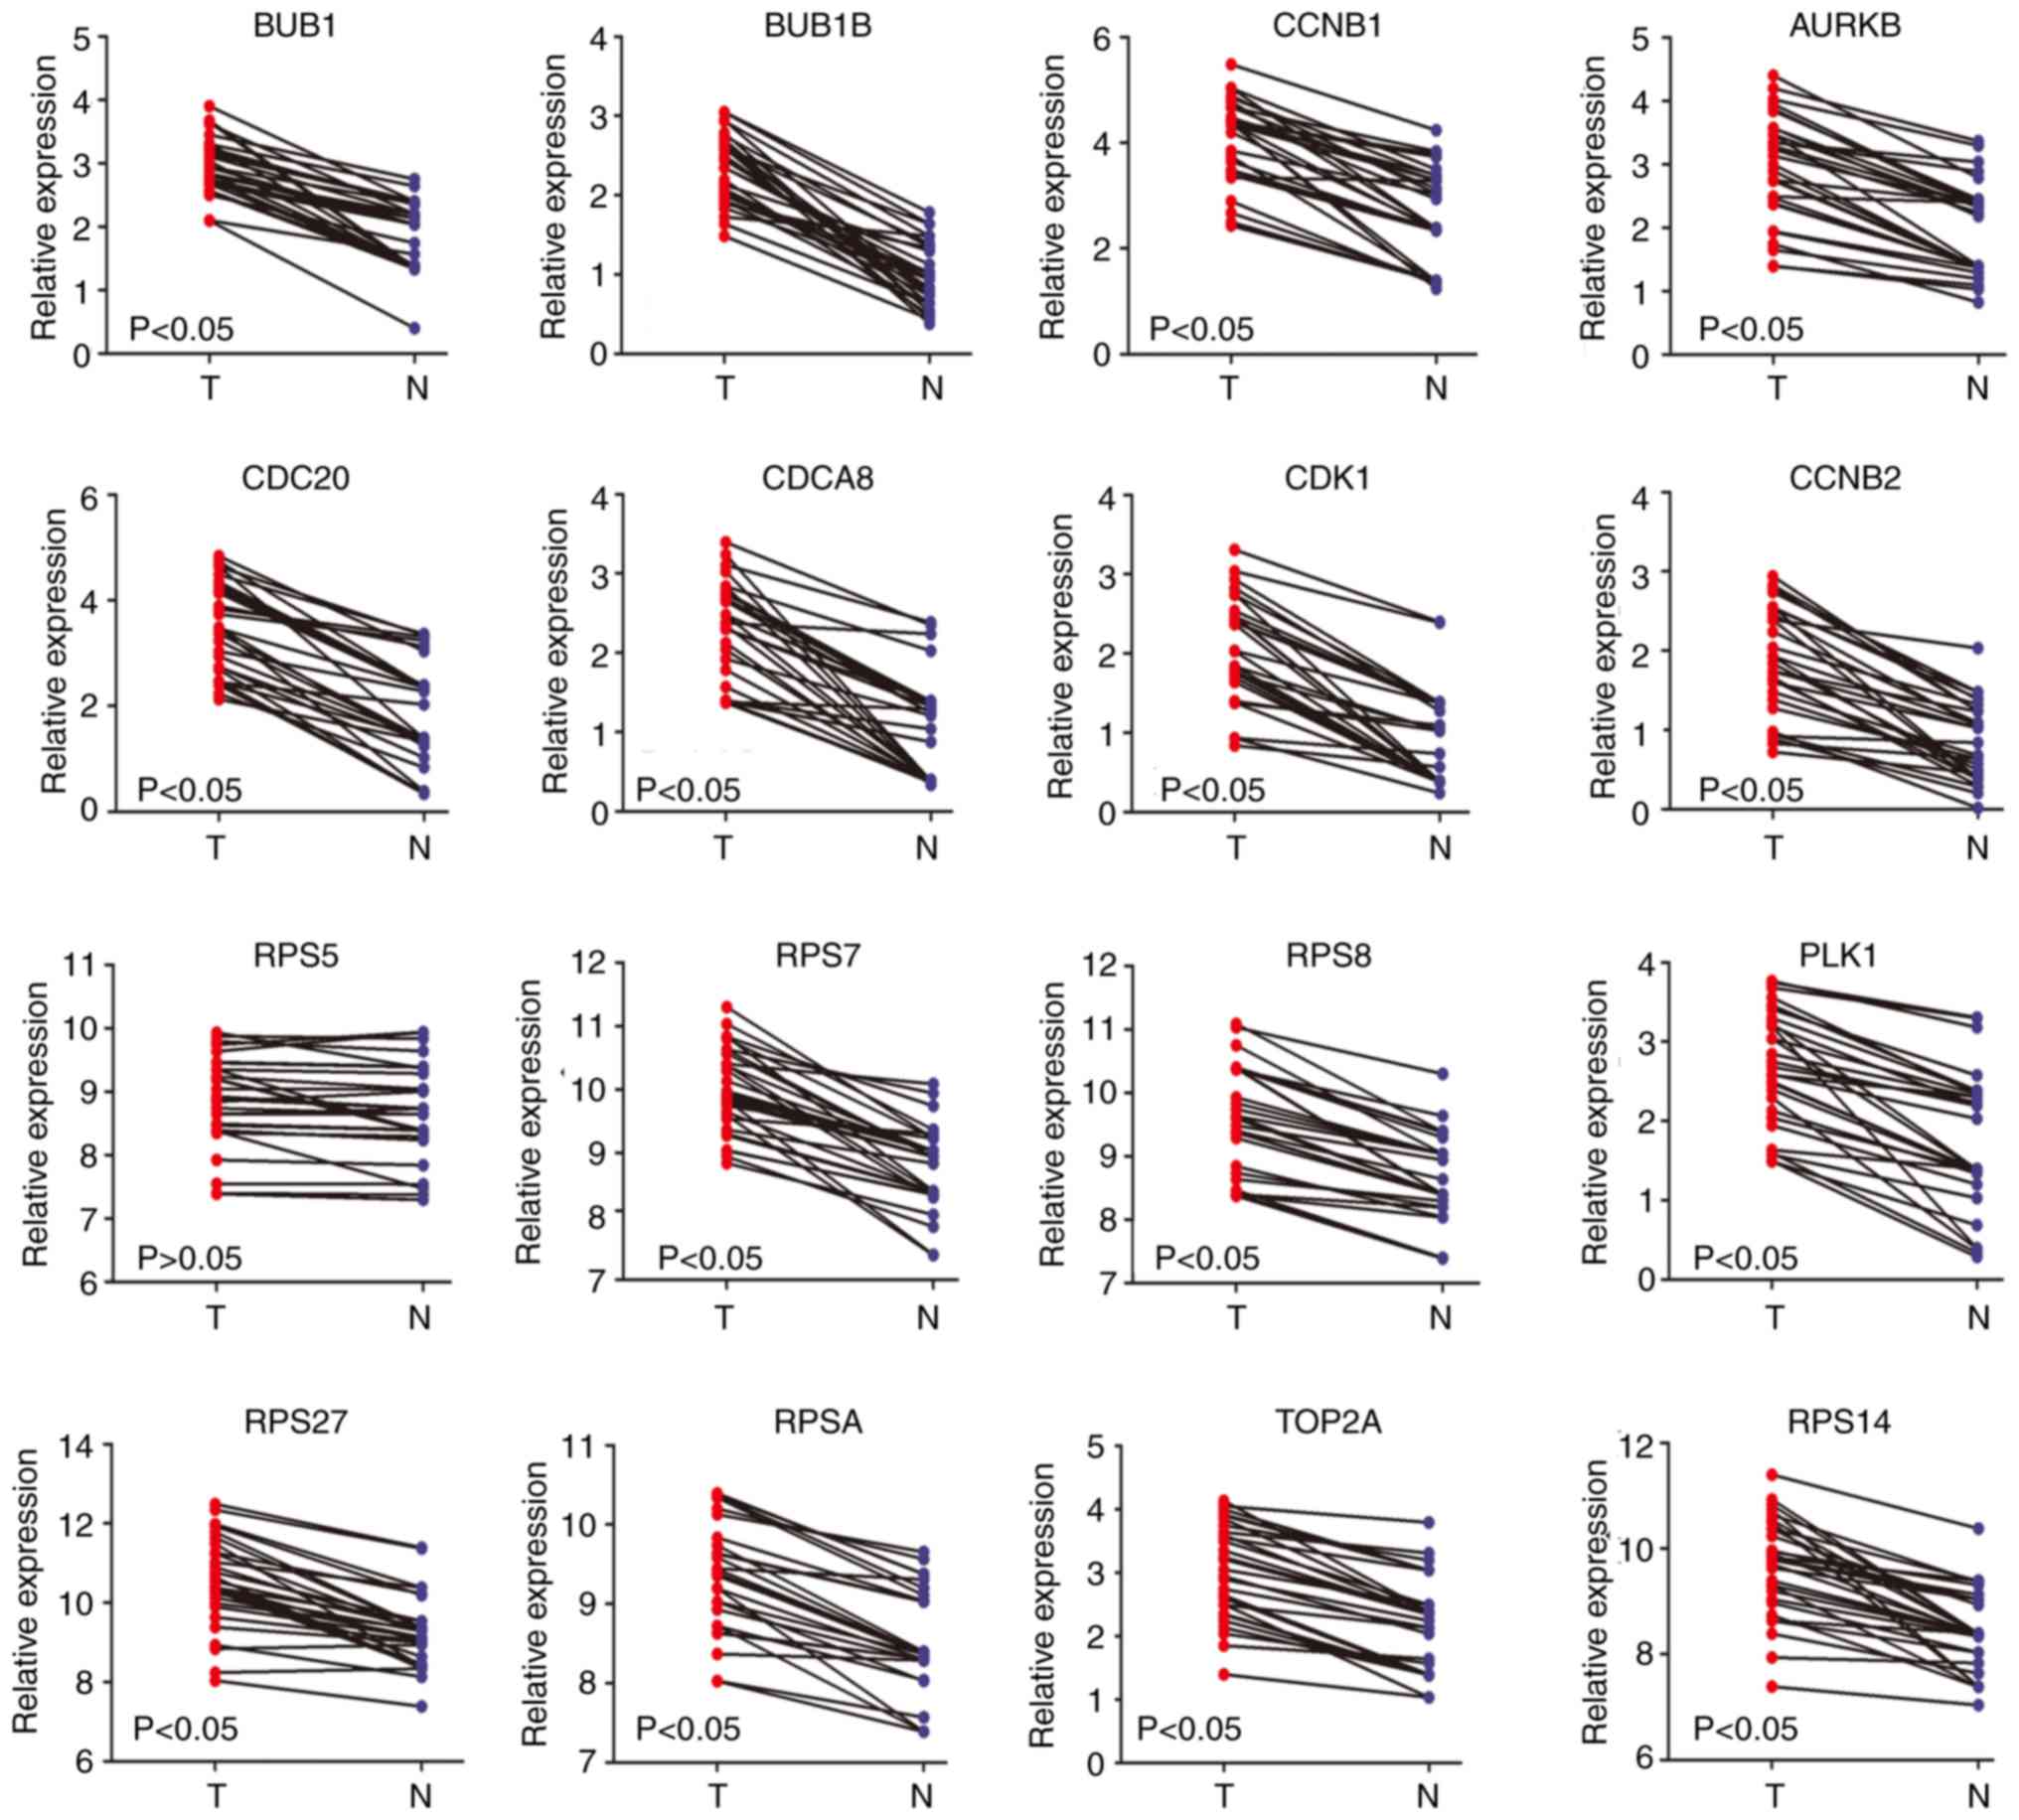
RPS8 was specifically highly expressed
in alcohol-associated HCC tissues
To determine whether the real hub genes identified
in the present study were specific to alcohol-associated HCC, their
mRNA and protein expression levels were verified in patients with
non-alcohol- and alcohol-associated HCC. The RT-qPCR results
revealed that the mRNA expression levels of AURKB, BUB1, BUB1B,
CCNB1, CCNB2, CDC20, CDCA8, CDK1, PLK1, RPS7, RPS8, RPS14, RPS27,
RPSA and TOP2A were significantly higher in patients with
alcohol-associated HCC, but there was no significant difference for
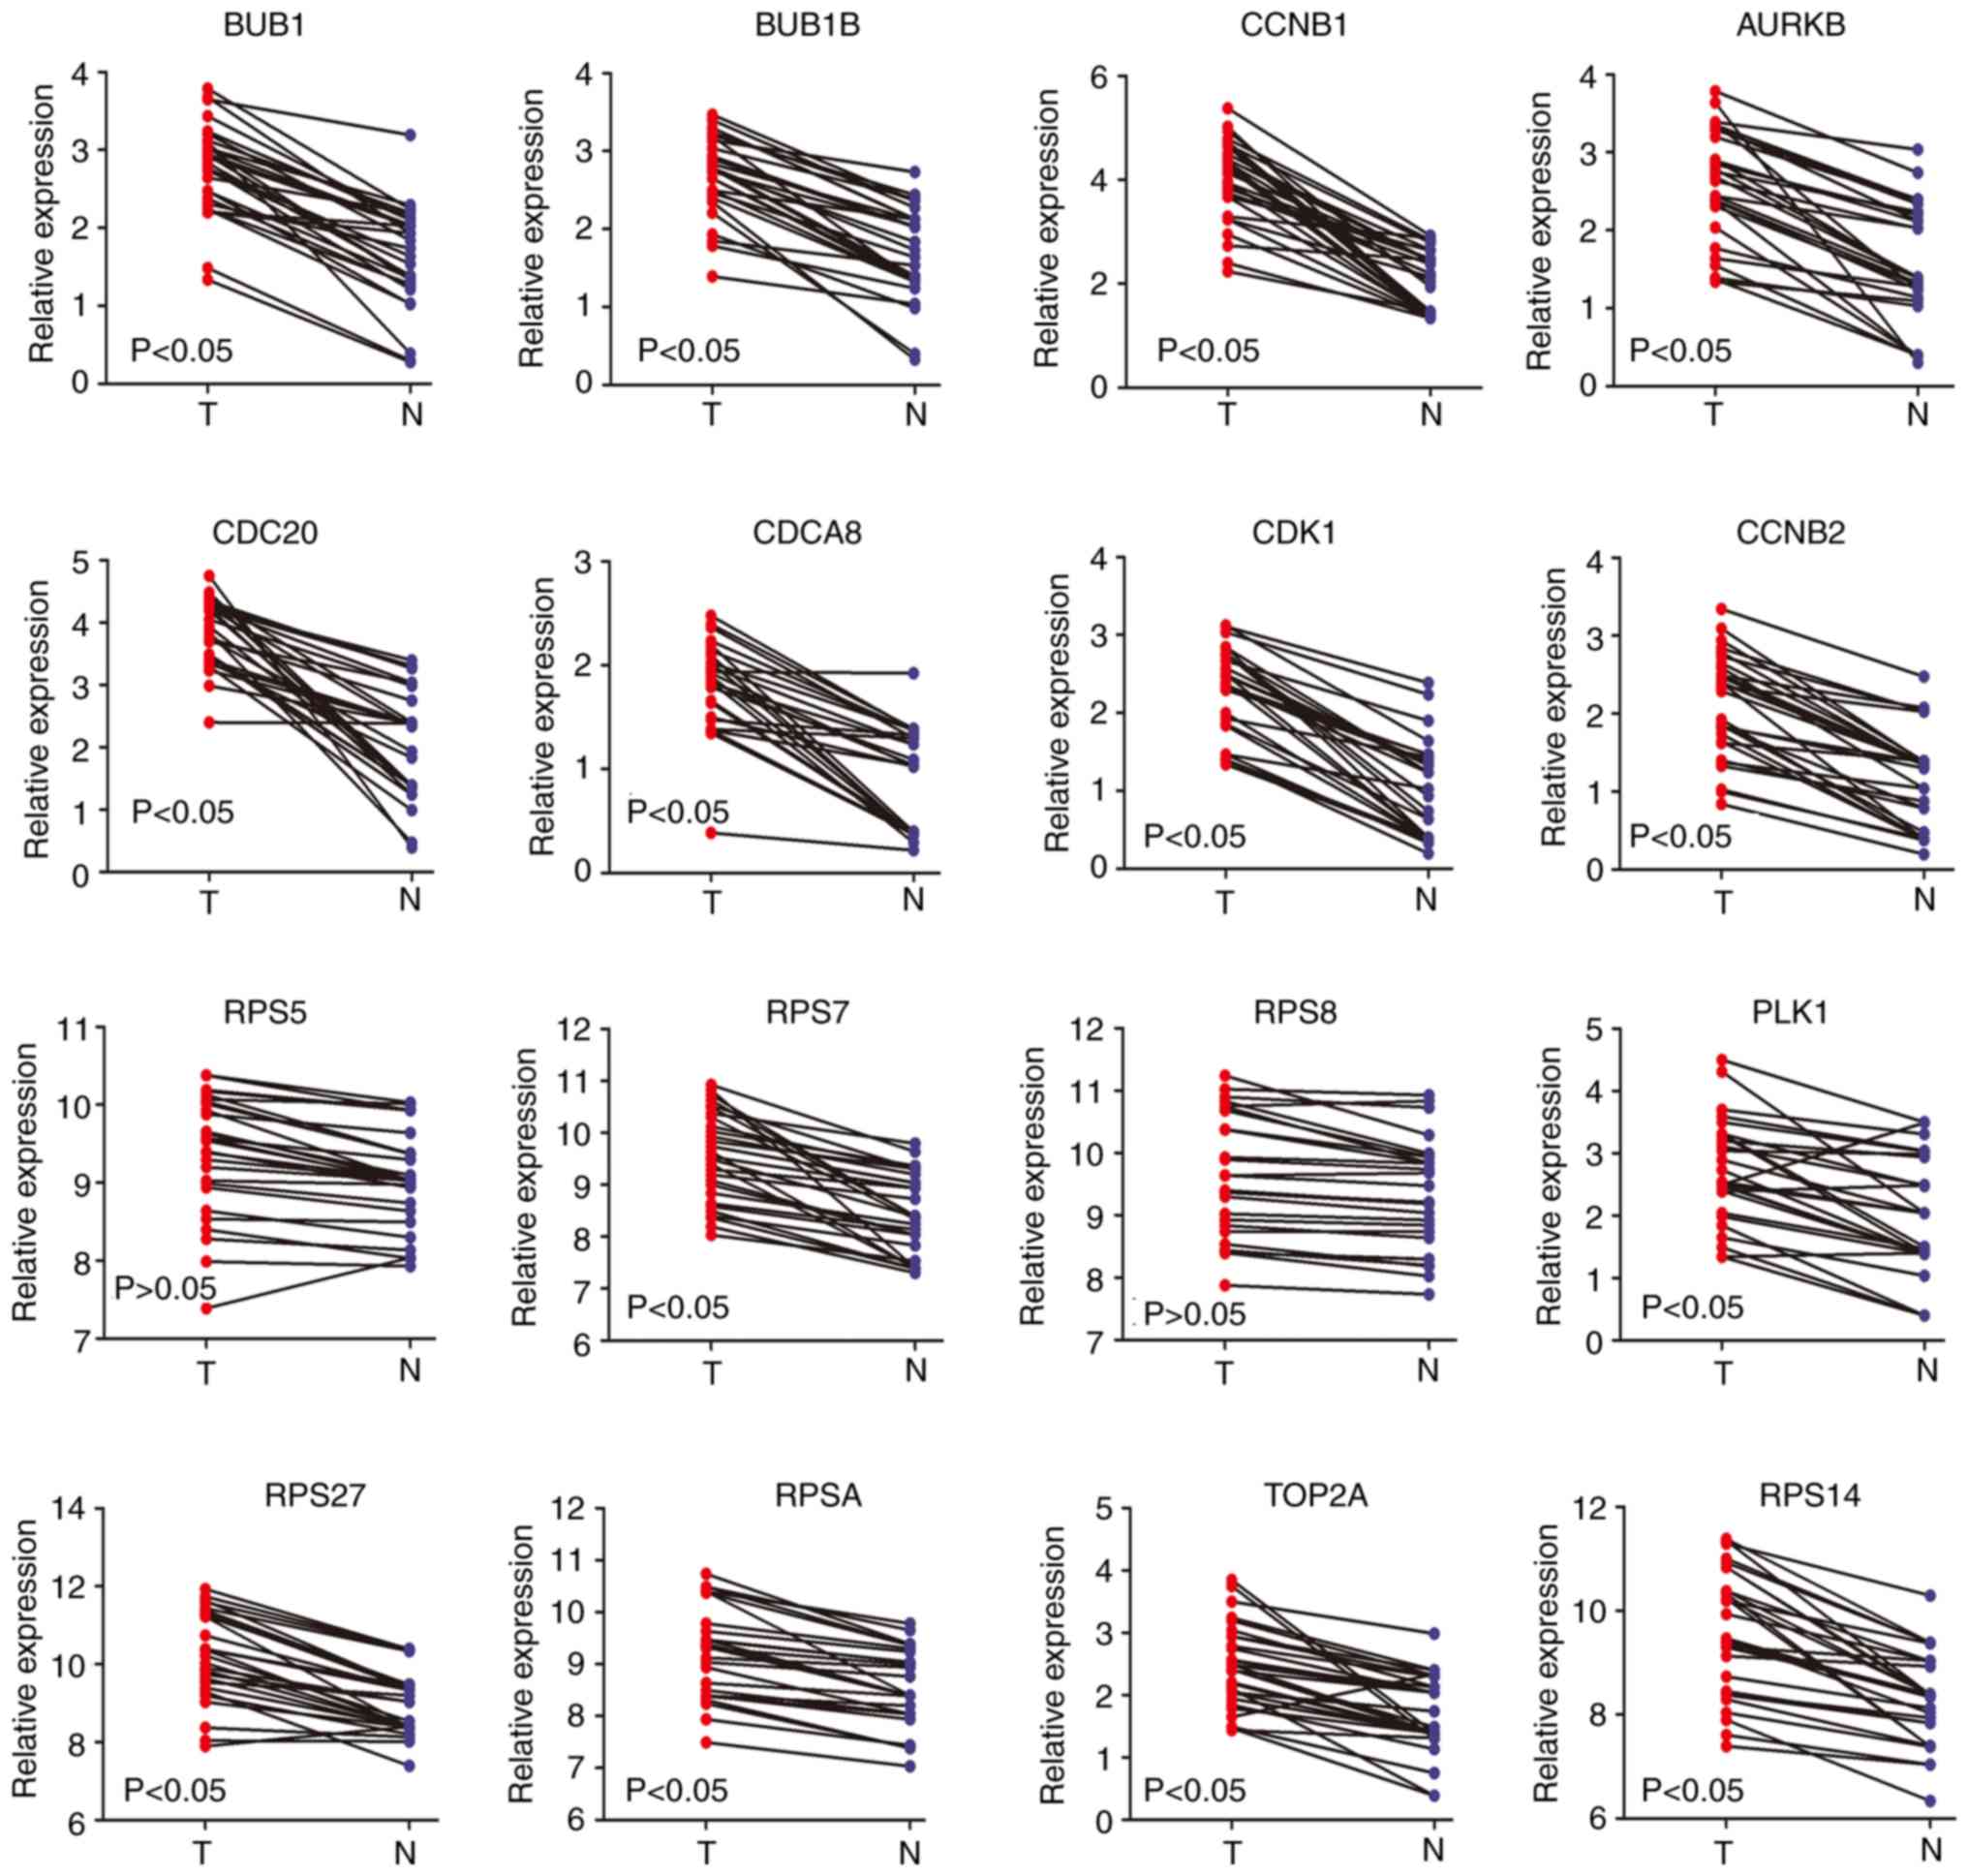
RPS5 (Fig. 7). The mRNA expression
levels of the aforementioned genes were also significantly higher
in non-alcohol-associated HCC; however, there was no significant
difference with RPS8 and RPS5 (Fig.
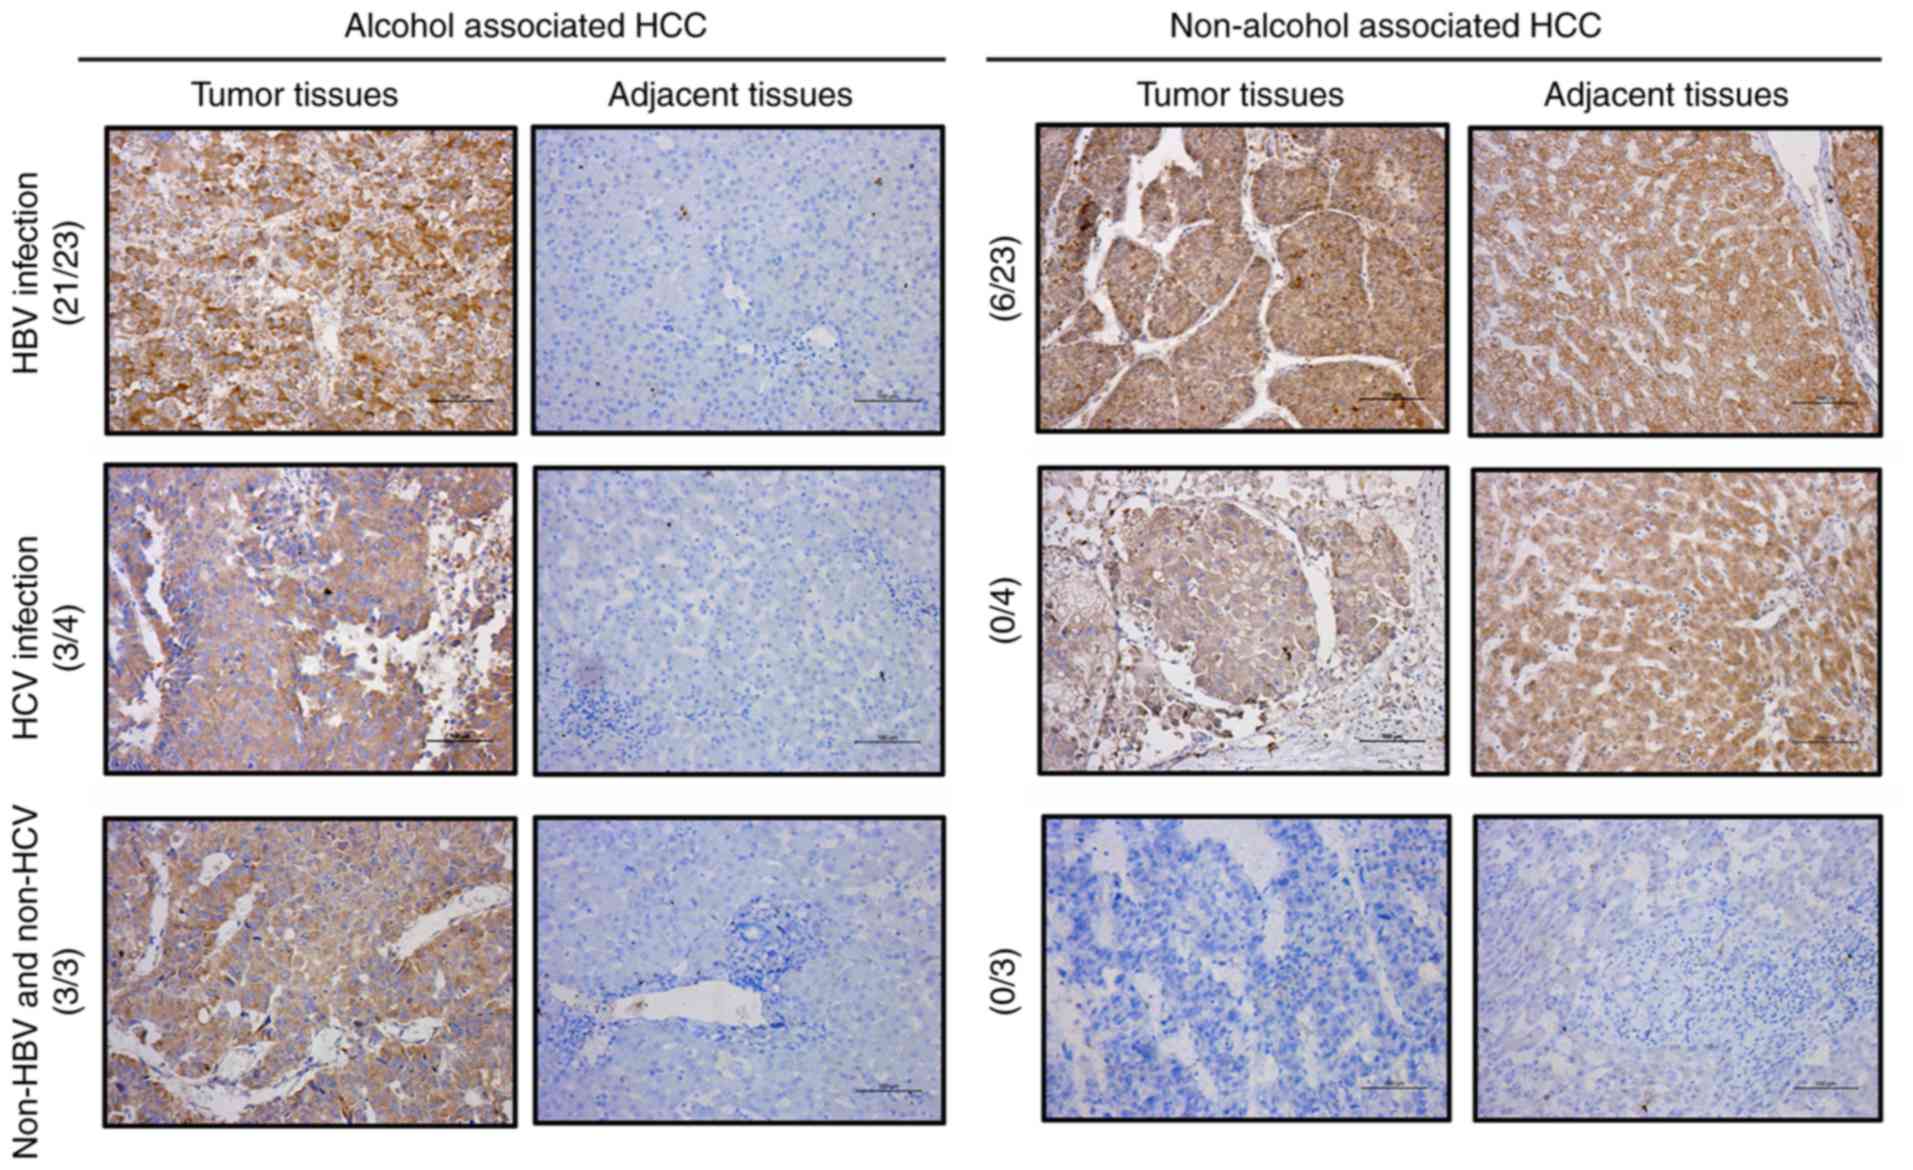
8). As the mRNA expression level of RPS8 was found to be
specifically highly expressed in alcohol-associated HCC tissues
rather than in non-alcohol-associated HCC tissues from the RT-qPCR
results, IHC was performed to further determine the protein
expression level of RPS8 in the tissues of patients with alcohol-
and non-alcohol-associated HCC. The results revealed that the
protein expression level of RPS8 was increased in 27 of the 30
alcohol-associated HCC tissues compared with that in their paired
adjacent normal tissues; however, RPS8 was not increased in the
non-alcohol-associated HCC tissues (Fig. 9). Taken together, these results
indicate that AURKB, BUB1, BUB1B, CCNB1, CCNB2, CDC20, CDCA8, CDK1,
PLK1, RPS7, RPS14, RPS27, RPSA and TOP2A may be common biomarkers
for alcohol- and non-alcohol-associated HCC, while RPS8 may be
specific biomarker for alcohol-associated HCC.
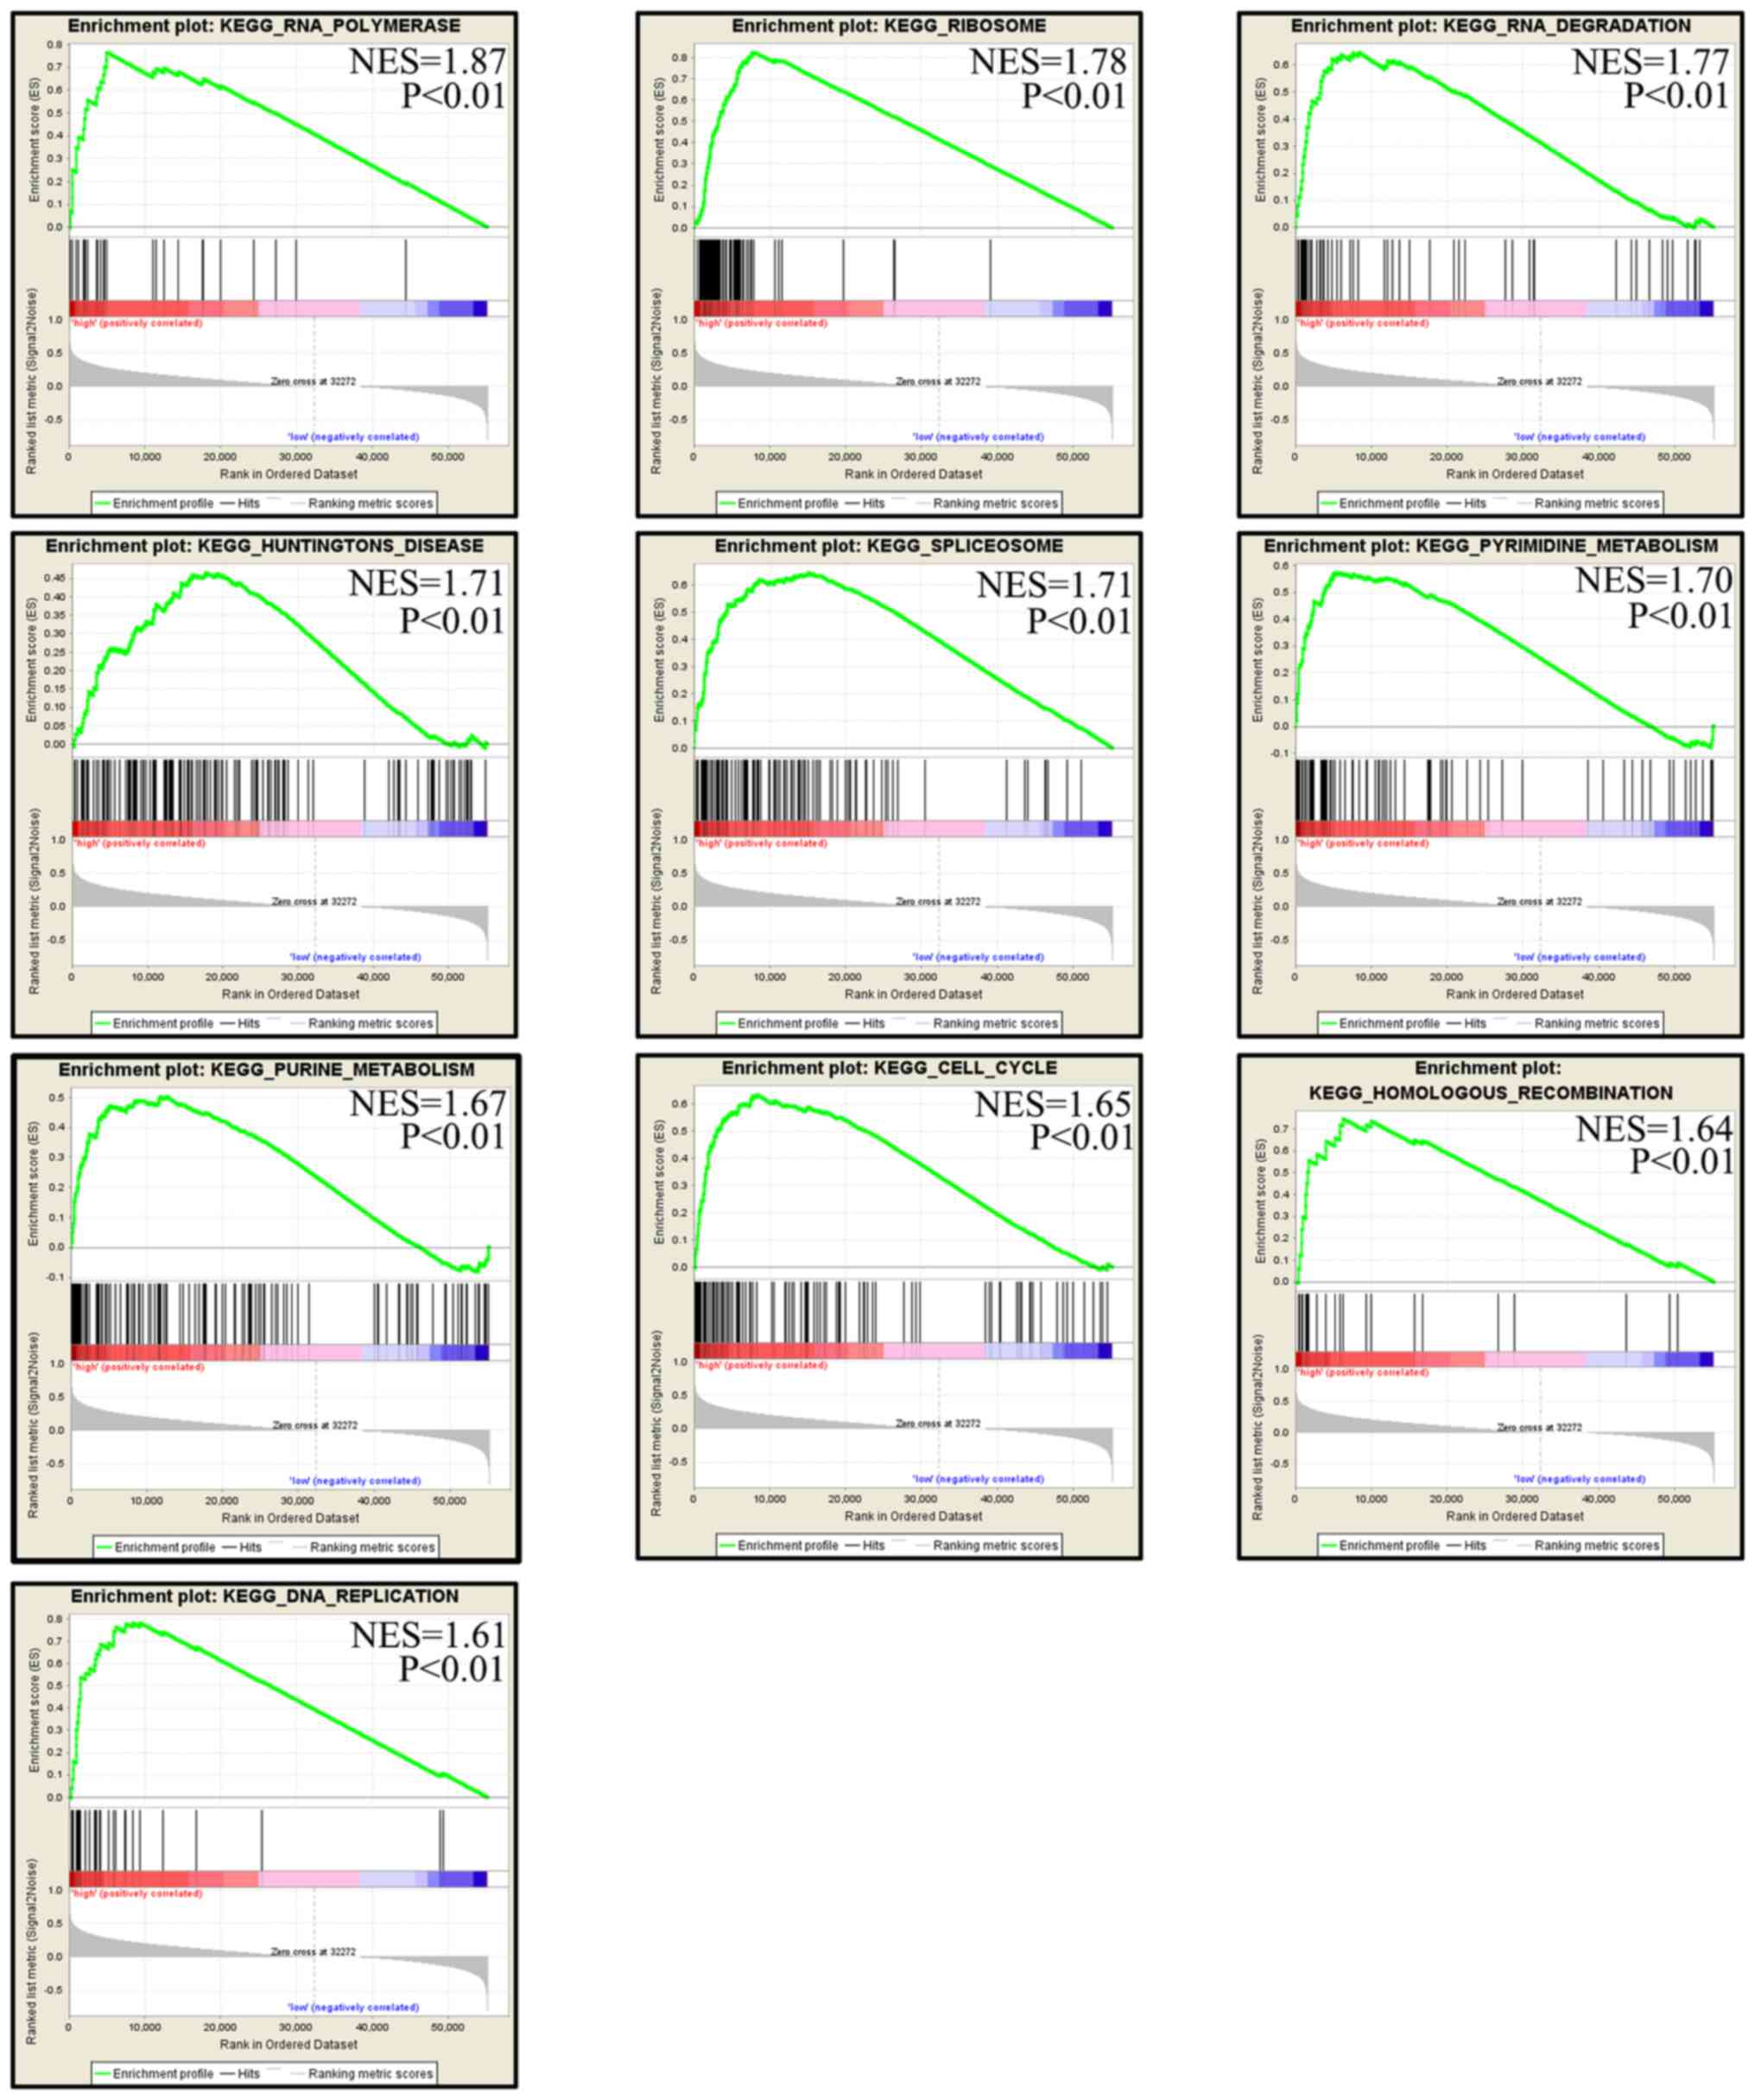
GSEA of RPS8 in TCGA
GSEA was performed to identify the pathways enriched
in samples with high mRNA levels of RPS8. A total of 10 pathways
were obtained, including ‘RNA polymerase’, ‘ribosome’,
‘degradation’, ‘Huntington's disease’, ‘spliceosome’, ‘pyrimidine
metabolism’, ‘purine metabolism’, ‘cell cycle’, ‘homologous
recombination’ and ‘DNA replication’ (Fig. 10). The results indicate that RPS8
may regulate the progression of alcohol-associated HCC by affecting
these pathways.
Discussion
Previous studies have demonstrated that the
prognosis of patients with alcohol-associated HCC is lower compared
with that of those with non-alcohol associated HCC (16,17).
Furthermore, the risk of distant metastases and worse liver
function is increased in patients with alcohol-associated HCC
(18). Similarly,
alcohol-associated HCC is harder to diagnose, and patients are
commonly diagnosed at a late disease stage (16). A study, which enrolled 32,913
patients in 2019, demonstrated that the overall survival rate
following liver transplant for alcohol-associated HCC was shorter
compared with that for non-alcohol associated HCC (mean rate, 3.9
vs. 4.7) in USA (19). Therefore,
the identification of key genes associated with alcohol-associated
HCC may improve diagnosis and treatment.
In the present study, the gene expression profiles
of patients with alcohol-associated HCC and their corresponding
clinical traits, were downloaded from TCGA and used to perform
WGCNA; 8 co-expressed genes were identified and 3 co-expressed gene
modules were positively associated with the clinical traits.
Following GO and KEGG analysis, and the construction of a PPI
network, 30 hub genes were identified; 16 of which were associated
with the progression of alcohol-associated HCC and were able to
predict poor patient outcome. Among these 16 genes, only the mRNA
expression level of RPS8 was significantly higher in
alcohol-associated HCC, but not in non-alcohol-associated HCC, and
there was no significant difference with RPS5 in both non-alcohol-
and alcohol-associated HCC; the remaining 14 real hub genes,
including AURKB, BUB1, BUB1B, CCNB1, CCNB2, CDC20, CDCA8, CDK1,
PLK1, RPS7, RPS14, RPS27, RPSA and TOP2A, were highly expressed in
both alcohol- and non-alcohol-associated HCC. It was therefore
hypothesized that RPS8 may be a novel and specific biomarker for
alcohol-associated HCC, while the remaining 14 real hub genes may
be common biomarkers for both alcohol- and non-alcohol associated
HCC.
The small ribosomal family proteins are important
structural components of the ribosome, which serves a key role in
protein synthesis (20). The
functional biology and related molecular mechanisms of small
ribosomal proteins have been widely investigated (21). The mRNA expression level of RPS7 was
found to be highly expressed in prostate cancer compared with that
in adjacent normal tissues, and a high mRNA expression level of was
also found to be positively associated with poor outcome via
promoting cell proliferation (22).
RPSA was revealed to activate AKT-related pathways and to promote
pancreatic cancer cell metastasis (23). RPS5 was identified as a risk factor
for recurrence and progression in patients with Dukes' B colon
cancer (24). The small ribosomal
protein family is also involved in HCC. RPS3 has been shown to
post-transcriptionally upregulate the NAD-dependent protein
deacetylase sirtuin-1 which promotes hepatocarcinogenesis (25). RPS6 promotes HCC cell proliferation
and migration, which is regulated by the AKT/mTOR pathway (26). RPS8 is primarily located in
cytoplasmic messenger ribonucleoprotein granules containing
untranslated mRNAs, and is expressed in all organs and tissues in
humans, and has no tissue specificity (27). In addition, previous studies have
revealed that the mRNA expression level of RPS8 was increased in
pancreatic cancer tissues and associated with poor outcome
(28,29) and may promote gemcitabine resistance
(30).
Previous studies have revealed that alcohol intake
can alter the metabolic capacity of the liver (31). However, knowledge of its influence
on biological function for all sub-types of HCC is limited. In the
present study, GESA revealed that two metabolic pathways were
enriched in samples with high mRNA expression levels of RPS8,
including the ‘pyrimidine-’ and ‘purine metabolism’ pathways.
Therefore, RPS8 is hypothesized to play a key role in
alcohol-associated HCC by regulating these pathways. However, the
exact role of RPS8 in alcohol-associated HCC requires further
investigation. Moreover, the results of the present study require
further validation with an increased sample population and relevant
experimental investigation.
In conclusion, using WGCNA and additional analytical
methods (GO, KEGG, PPI network, survival analysis, and GSEA), and
RT-qPCR using patient samples, the results of the present study
indicate that RPS8 may be a novel and specific biomarker for
alcohol-associated HCC.
Acknowledgements
Not applicable
Funding
The present study was funded by grants from The
National Natural Science Foundation of China (grant nos. 81560477,
81860505, 81860506 and 81660483), and Science and Technology
Co-operation in Guizhou (grant nos. 5404, 09, and 5647).
Availability of data and materials
The datasets used and/or analyzed during the current
study are available from the corresponding author on reasonable
request.
Authors' contributions
NB, SL and YS performed the experiments. NB, YS, ZZ
and YZ collected data, performed data analysis, and interpretation.
CY, SL and CS designed the experiments and wrote the manuscript.
All authors revised the manuscript and read and approved the final
version of the article.
Ethics approval and consent to
participate
The present study was approved by the Ethics
Committee of Guizhou Medical University and performed in accordance
with the Declaration of Helsinki. Informed consent was provided
from all the patients.
Patient consent for publication
Not applicable.
Competing interests
The authors declare that they have no competing
interests.
References
|
1
|
Bray F, Ferlay J, Soerjomataram I, Siegel
RL, Torre LA and Jemal A: Global cancer statistics 2018: GLOBOCAN
estimates of incidence and mortality worldwide for 36 cancers in
185 countries. CA Cancer J Clin. 68:394–424. 2018. View Article : Google Scholar : PubMed/NCBI
|
|
2
|
Li L, Li B and Zhang M: HBV DNA levels
impact the prognosis of hepatocellular carcinoma patients with
microvascular invasion. Medicine (Baltimore). 98:e163082019.
View Article : Google Scholar : PubMed/NCBI
|
|
3
|
Zhao H, Zhu P, Han T, Ye Q, Xu C, Wu L,
Liu F, Yin W, Li Z and Guo Y: Clinical characteristics analysis of
1180 patients with hepatocellular carcinoma secondary to hepatitis
B, hepatitis C and alcoholic liver disease. J Clin Lab Anal.
34:e230752019.PubMed/NCBI
|
|
4
|
Tian L, Cervenka ND, Low AM, Olson DG and
Lynd LR: A mutation in the AdhE alcohol dehydrogenase of
Clostridium thermocellum increases tolerance to several primary
alcohols, including isobutanol, n-butanol and ethanol. Sci Rep.
9:17362019. View Article : Google Scholar : PubMed/NCBI
|
|
5
|
Garcia CC, Batista GL, Freitas FP, Lopes
FS, Sanchez AB, Gutz IG, Di Mascio P and Medeiros MH:
Quantification of DNA adducts in lungs, liver and brain of rats
exposed to acetaldehyde. Free Radic Biol Med. 75 (Suppl 1):S412014.
View Article : Google Scholar : PubMed/NCBI
|
|
6
|
Pradhan N, Parbin S, Kar S, Das L, Kirtana
R, Suma SG, Sengupta D, Deb M, Kausar C and Patra SK: Epigenetic
silencing of genes enhanced by collective role of reactive oxygen
species and MAPK signaling downstream ERK/Snail axis: Ectopic
application of hydrogen peroxide repress CDH1 gene by enhanced DNA
methyltransferase activity in human breast cancer. Biochim Biophys
Acta Mol Basis Dis. 1865:1651–1665. 2019. View Article : Google Scholar : PubMed/NCBI
|
|
7
|
Shang F, Lyu Y, Xie XC, Ding BY, Niu J and
Wang JJ: RNA-seq analysis of clitea metallica (coleoptera:
Chrysomelidae), provides insights into cuticle-related genes and
miRNAs. J Econ Entomol. 112:2940–2951. 2019.PubMed/NCBI
|
|
8
|
Maind A and Raut S: Mining conditions
specific hub genes from RNA-Seq gene-expression data via
biclustering and their application to drug discovery. IET Syst
Biol. 13:194–203. 2019. View Article : Google Scholar : PubMed/NCBI
|
|
9
|
Wu M, Liu Z, Zhang A and Li N:
Identification of key genes and pathways in hepatocellular
carcinoma: A preliminary bioinformatics analysis. Medicine
(Baltimore). 98:e142872019. View Article : Google Scholar : PubMed/NCBI
|
|
10
|
Pan WY, Zeng JH, Wen DY, Wang JY, Wang PP,
Chen G and Feng ZB: Oncogenic value of microRNA-15b-5p in
hepatocellular carcinoma and a bioinformatics investigation. Oncol
Lett. 17:1695–1713. 2019.PubMed/NCBI
|
|
11
|
Lou W, Liu J, Ding B, Chen D, Xu L, Ding
J, Jiang D, Zhou L, Zheng S and Fan W: Identification of potential
miRNA-mRNA regulatory network contributing to pathogenesis of
HBV-related HCC. J Transl Med. 17:72019. View Article : Google Scholar : PubMed/NCBI
|
|
12
|
Yin L, Cai Z, Zhu B and Xu C:
Identification of key pathways and genes in the dynamic progression
of HCC based on WGCNA. Genes (Basel). 9(pii): E922018. View Article : Google Scholar : PubMed/NCBI
|
|
13
|
Langfelder P and Horvath S: WGCNA: An R
package for weighted correlation network analysis. BMC
Bioinformatics. 9:5592008. View Article : Google Scholar : PubMed/NCBI
|
|
14
|
Livak KJ and Schmittgen TD: Analysis of
relative gene expression data using real-time quantitative PCR and
the 2−ΔΔCt method. Methods. 25:402–408. 2001. View Article : Google Scholar : PubMed/NCBI
|
|
15
|
González-Castro TB, Tovilla-Zárate CA,
Genis-Mendoza AD, Juárez-Rojop IE, Nicolini H, López-Narváez ML and
Martínez-Magaña JJ: Identification of gene ontology and pathways
implicated in suicide behavior: Systematic review and enrichment
analysis of GWAS studies. Am J Med Genet B Neuropsychiatr Genet.
180:320–329. 2019. View Article : Google Scholar : PubMed/NCBI
|
|
16
|
Zhao J, O'Neil M, Vittal A, Weinman SA and
Tikhanovich I: PRMT1-dependent macrophage IL-6 production is
required for alcohol-induced HCC progression. Gene Expr.
19:137–150. 2019. View Article : Google Scholar : PubMed/NCBI
|
|
17
|
Machida K, Feldman DE and Tsukamoto H:
TLR4-dependent tumor-initiating stem cell-like cells (TICs) in
alcohol-associated hepatocellular carcinogenesis. Adv Exp Med Biol.
815:131–144. 2015. View Article : Google Scholar : PubMed/NCBI
|
|
18
|
Thompson KJ, Humphries JR, Niemeyer DJ,
Sindram D and McKillop IH: The effect of alcohol on Sirt1
expression and function in animal and human models of
hepatocellular carcinoma (HCC). Adv Exp Med Biol. 815:361–373.
2015. View Article : Google Scholar : PubMed/NCBI
|
|
19
|
Nischalke HD, Berger C, Lutz P, Langhans
B, Wolter F, Eisenhardt M, Kramer B, Kokordelis P, Glassner A,
Muller T, et al: Influence of the CXCL1 rs4074 A allele on alcohol
induced cirrhosis and HCC in patients of European descent. PLoS
One. 8:e808482013. View Article : Google Scholar : PubMed/NCBI
|
|
20
|
Chu T, Weng X, Law C, Kong HK, Lau J, Li
S, Pham HQ, Wang R, Zhang L, Kao R, et al: The ribosomal maturation
factor P from Mycobacterium smegmatis facilitates the ribosomal
biogenesis by binding to the small ribosomal protein S12. J Biol
Chem. 294:372–378. 2019. View Article : Google Scholar : PubMed/NCBI
|
|
21
|
Lee SJ, Swanson MJ and Sattlegger E: Gcn1
contacts the small ribosomal protein Rps10, which is required for
full activation of the protein kinase Gcn2. Biochem J. 466:547–559.
2015. View Article : Google Scholar : PubMed/NCBI
|
|
22
|
Zhang C, Qie Y, Yang T, Wang L, Du E, Liu
Y, Xu Y, Qiao B and Zhang Z: Kinase PIM1 promotes prostate cancer
cell growth via c-Myc-RPS7-driven ribosomal stress. Carcinogenesis.
40:2022019. View Article : Google Scholar : PubMed/NCBI
|
|
23
|
Wu Y, Tan X, Liu P, Yang Y, Huang Y, Liu
X, Meng X, Yu B, Wu M and Jin H: ITGA6 and RPSA synergistically
promote pancreatic cancer invasion and metastasis via PI3K and MAPK
signaling pathways. Exp Cell Res. 379:30–47. 2019. View Article : Google Scholar : PubMed/NCBI
|
|
24
|
Tomioka M, Shimobayashi M, Kitabatake M,
Ohno M, Kozutsumi Y, Oka S and Takematsu H: Ribosomal protein
uS7/Rps5 serine-223 in protein kinase-mediated phosphorylation and
ribosomal small subunit maturation. Sci Rep. 8:12442018. View Article : Google Scholar : PubMed/NCBI
|
|
25
|
Zhao L, Cao J, Hu K, Wang P, Li G, He X,
Tong T and Han L: RNA-binding protein RPS3 contributes to
hepatocarcinogenesis by post-transcriptionally up-regulating SIRT1.
Nucleic Acids Res. 47:2011–2028. 2019. View Article : Google Scholar : PubMed/NCBI
|
|
26
|
Mok KW, Mruk DD and Cheng CY: rpS6
regulates blood-testis barrier dynamics through Akt-mediated
effects on MMP-9. J Cell Sci. 127:4870–4882. 2014. View Article : Google Scholar : PubMed/NCBI
|
|
27
|
Tian ZC, Liu GY, Yin H, Luo JX, Guan GQ,
Luo J, Xie JR, Shen H, Tian MY, Zheng JF, et al: RPS8-a new
informative DNA marker for phylogeny of Babesia and Theileria
parasites in China. PLoS One. 8:e798602013. View Article : Google Scholar : PubMed/NCBI
|
|
28
|
Liu WJ, Zhou L, Liang ZY, Zhou WX, You L,
Zhang TP and Zhao YP: Plasminogen activator inhibitor 1 as a poor
prognostic indicator in resectable pancreatic ductal
adenocarcinoma. Chin Med J (Engl). 131:2947–2952. 2018. View Article : Google Scholar : PubMed/NCBI
|
|
29
|
Chen R, Dawson DW, Pan S, Ottenhof NA, de
Wilde RF, Wolfgang CL, May DH, Crispin DA, Lai LA, Lay AR, et al:
Proteins associated with pancreatic cancer survival in patients
with resectable pancreatic ductal adenocarcinoma. Lab Invest.
95:43–55. 2015. View Article : Google Scholar : PubMed/NCBI
|
|
30
|
Toshimitsu H, Iizuka N, Yamamoto K,
Kawauchi S, Oga A, Furuya T, Oka M and Sasaki K: Molecular features
linked to the growth-inhibitory effects of gemcitabine on human
pancreatic cancer cells. Oncol Rep. 16:1285–1291. 2006.PubMed/NCBI
|
|
31
|
Li TT, Tong AJ, Liu YY, Huang ZR, Wan XZ,
Pan YY, Jia RB, Liu B, Chen XH and Zhao C: Polyunsaturated fatty
acids from microalgae Spirulina platensis modulates lipid
metabolism disorders and gut microbiota in high-fat diet rats. Food
Chem Toxicol. 131:1105582019. View Article : Google Scholar : PubMed/NCBI
|