Introduction
Ovarian carcinoma (OC) has the highest mortality
rate among gynecological and reproductive malignant tumors in the
United States. The early symptoms that patients exhibit are not
obvious and are nonspecific due to the fact that the ovary lies
deep within the pelvic cavity. In addition, OC is often initially
diagnosed in an advanced stage due to the lack of effective
detection measures. The 5-year survival rate of patients with OC is
only 15–40% (1,2). The primary treatments for advanced
epithelial ovarian cancer (AEOC) patients include primary
cytoreductive surgery, chemotherapy, radiotherapy and endocrine
therapy. In the 1970s, Griffiths and Fuller (3,4)
proposed neoadjuvant chemotherapy (NACT) as an alternative
treatment for AEOC patients. The aim of NACT is to improve the
preoperative status of patients, reduce the tumor volume and
post-surgical complications, create conditions that allow surgery,
and improve the quality of life and prognosis of the patient.
However, when eliminating tissue plane, NACT can promote
inflammatory adhesion, which complicates surgery in a small number
of AEOC patients. Moreover, NACT can induce resistance to
platinum-based chemotherapies in tumor cells by exposing large
tumor volumes to chemotherapy (5).
To date, there is no uniform standard for accurately evaluating and
screening OC patients to determine their suitability for NACT.
Currently, the common evaluation methods used internationally by
gynecological oncologists include cancer antigen 125 (CA125), human
epididymis protein 4 (HE4), computed tomography (CT),
MRI and laparoscopic exploration (6–8).
However, any single method mentioned above is not ideal enough to
screen for patients indicative for NACT (9). There is an urgent need for a novel
biological predictor that can facilitate the selection of patients
suitable for NACT. Consequently, to maximize the therapeutic effect
of NACT and avoid tumor cell resistance caused by the overuse of
NACT, biomarkers are needed to screen the most suitable ovarian
cancer patients for NACT and to enable therapy targeted at the
process of platinum-based chemoresistance at the molecular level.
Simultaneously, it is important to elucidate the resistance
mechanisms of tumor cells to chemotherapeutic drugs and to attempt
to reverse their resistance.
The present study was based on NACT and
drug-resistant microarrays from the GEO database. We identified
four differentially expressed genes (DEGs) associated with NACT and
chemoresistance in AEOC. Therefore, these core genes may be
potential therapeutic targets for NACT and platinum-based
chemoresistance factors as well as candidate biomarkers in
AEOC.
Materials and methods
Microarray data
Three eligible profiles (GSE114206, GSE41499 and
GSE33482) of drug resistance and one gene expression profiles
(GSE109934) of NACT were obtained from the GEO databases
(http://www.ncbi.nlm.nih.gov/geo/)
(10,11).
Identification of DEGs
GEO2R is an interactive web tool that identifies
differentially expressed genes (DEGs) by comparing two sets of
samples that belong to the GEO database (12). Platinum-sensitive OC samples were
compared with platinum-resistant samples by GEO2R. Platinum
sensitivity was defined by a complete response during adjuvant
chemotherapy and clinical remission for at least 6 months after the
completion of chemotherapy. Platinum resistance was defined as
progressive or persistent disease or progression within 6 months of
completing platinum therapy. The pre-NACT OC samples and the
post-NACT samples of the GSE109934 profile were divided into a
platinum-sensitive group and platinum-resistant group. The pre-NACT
OC samples were compared with the post-NACT samples using GEO2R.
The defining values used to screen out statistically significant
DEGs were |log FC| ≥1 and P<0.05. As a followed up, we visually
displayed the DEGs in the form of heat maps using Morpheus
(https://software.broadin stitute.org/morpheus/)
online tools. To screen for DEGs that were more likely to be
associated with neoadjuvant chemotherapy and platinum-based
chemotherapy resistance, we used a Venn diagram to filter the
results. In addition, the patient clinical information of the
microarray profiles GSE114206, GSE41499, GSE33482, and GSE109934,
including the demographic features, FIGO stage, and histological
type as well as grade were listed.
GO and KEGG analyses of DEGs
To understand the nature of the DEGs, we determined
their biomolecular functions via their Gene Ontology (GO)
annotations. To better understand gene and protein functions, we
used the Metascape (http://metascape.org/) online tool to analyze the
DEGs. One of the hallmarks of the Kyoto Encyclopedia of Genes and
Genome (KEGG) database (http://www.genome.jp/) is the ability to correlate
fully sequenced gene catalogs with higher-level cellular and
ecosystem functions. In addition, EasyChart (http://www.ehbio.com/ImageGP/) was used to highlight
the different signaling pathways associated with gene enrichment.
Using the The Database for Annotation, Visualization and Integrated
Discovery (DAVID) (http://david.abcc.ncifcrf.gov/) online tool (13) for GO categories and KEGG pathway
enrichment analysis, we were able to reveal the roles of these DEGs
in the underlying mechanisms of neoadjuvant chemotherapy and
platinum-based chemotherapy resistance.
PPI network construction and module
analysis
STRING (Search Tool for the Retrieval of Interacting
Genes/Proteins) (http://string-db.org/) is a search tool for studying
genetic interactions and assessing protein-protein interaction
(PPI) through the retrieval of data on interacting genes/proteins
(14). Exploring protein
interactions allow us to more fully understand the potential
regulatory mechanisms that govern biological processes. Therefore,
the visualization analysis software Cytoscape (15) was used to construct a network and
map the underlying relationships among the DEGs.
Protein/gene interaction network and
biological process annotation analyses
GeneMANIA (http://www.genemania.org/) (16,17) is
a vast database of genomics and proteomics that can be used to
predict gene function and prioritize genes based on a protein/gene
interaction network. Coremine Medical (http://www.coremine.com/medic al/) is an online tool
that can be used to conduct homologous similarity analysis of gene
sequence, and consult the biological processes affected via query
genes based on ontology language, semantic networks, intelligent
analysis and other technical support.
Variation of the 4 genes in EOC
The cBioPortal (https://www.cbioportal.org/) is a comprehensive
genetic database that includes data on DNA mutations, gene
amplification and methylation. The cBioPortal v1.11.3 visualization
and analysis tools were used to summarize the possible genetic
variation in 4 abnormally expressed genes in EOC and to further
analyze the clinical value of this genetic variation.
Cell culture
The ovarian cancer cell lines SKOV3, HeyA8 and A2780
were obtained from the University of Texas M.D. Anderson Cancer
Center (Houston, TX, USA) via ATCC. The cell lines were
continuously subcultured in a moist incubator at 37°C under 5%
carbon dioxide in 10% fetal bovine serum (FBS) in RPMI-1640 medium
(Gibco; Thermo Fisher Scientific, Inc.). We established
cisplatin-resistant cell lines, SKOV3-CDDP and HeyA8-CDDP, and
carboplatin-resistant cell line, A2780-CBP, by successively
increasing the concentrations of cisplatin and carboplatin,
respectively, as previously described (18,19).
Migration and invasion assays
To assess the migration and invasion potential of
the cells in vitro, migratory and invasive tests were
conducted in Transwell chambers with an aperture of 8 µm (Corning
Costar, Inc.). Cells (5×10⁴) were evenly mixed with 100
µl RPMI-1640 medium without serum and transferred to the upper
Transwell chamber. After incubation for 24 h, the migratory cells
adhering to the sub-membrane surface were fixed (4%
paraformaldehyde) and stained for 10 min at room temperature (0.1%
crystal violet). For the invasion assay, the bottom of the transfer
hole in the upper chamber was covered with Matrigel (BD
Bioscience). Each trial was repeated three times. The number of
migrating and invading cells in 10 randomly selected areas were
counted at ×100 magnification under a microscope (Olympus).
Quantitative RT-PCR analysis
Using the GoScript™ reverse transcription system
(Promega), 1 µg total RNA in TRIzol reagent (Invitrogen; Thermo
Fisher Scientific, Inc.) was reverse transcribed to cDNA based on
the manufacturer's instructions. The oligonucleotide sequence
information used to amplify the target mRNA is shown in Table I. Glyceraldehyde-3-phosphate
dehydrogenase (GAPDH) was used to normalize the level of mRNA
expression. The PCR conditions for the reaction were as follows: An
initial denaturation step at 95°C for 5 min, followed by 40 cycles
of 95°C for 12 sec and 60°C for 30 sec. GoTap qPCR Master Mix kit
(Promega) was used to detect the quantity of each target mRNA, and
relative expression was calculated using the 2−ΔΔCq
method (20).
 | Table I.Human primer sequences used for
real-time quantitative PCR. |
Table I.
Human primer sequences used for
real-time quantitative PCR.
| Gene | Forward primer
(5′-3′) | Reverse primer
(5′-3′) | Annealing
temperature (°C) |
|---|
| NFATc1 |
5′-CGATCCCGGGGTAGCAGCCT-3′ |
5′-CACCGCCATACTGGAGCCGC-3′ | 62.4 |
| KLF4 |
5′-TCGGACCACCTCGCCTTACA-3′ |
5′-CTGGGCTCCTTCCCTCATCG-3′ | 60.5 |
| NR4A3 |
5′-GGGAGCCGCTGGGCTTG-3′ |
5′-CAGTGGGCTTTGAGTGCTGTG-3′ | 61.0 |
| HGF |
5′-TAGGCACTGACTCCGAACA-3′ |
5′-AGGAGATGCAGGAGGACAT-3′ | 60.7 |
| GAPDH |
5′-CGTGGAAGGACTCATGACCA-3′ |
5′-GGCAGGGATGATGTTCTGGA-3′ | 62.0 |
Statistical analysis
GraphPad version 6.0 statistical software (GraphPad
Software, Inc.) was used to analyze the experimental data.
Student's t-test was used to analyze comparisons between groups.
Quantitative data are presented as the mean ±SD. All statistics
were two-tailed, and P<0.05 was considered statistically
significant.
Results
Gene expression profiles
Microarray data for the drug-resistant profiles,
GSE114206, GSE41499 and GSE33482, and the gene expression profile,
GSE109934 for NACT were obtained from GEO. The platforms for these
datasets were GPL13497, GPL3921, GPL6480 and GPL19956,
respectively. The GSE114206 profile contained 12 samples, including
6 platinum-resistant samples and 6 platinum-sensitive samples; the
GSE41499 profile contained 8 samples, including 4
platinum-resistant samples and 4 platinum-sensitive samples, and
the GSE33482 profile contained 12 samples, including 6
cisplatin-resistant samples and 6 cisplatin-sensitive samples. The
GSE109934 profile consisted of 38 samples (a total of 19 patients;
each patient provided a tissue sample before and after NACT),
including 19 pre-NACT samples and 19 post-NACT samples, and finally
each received 2–6 cycles of chemotherapy before surgery and 9 of
these were classified as platinum resistant and 10 cases classified
as platinum sensitive. A series of matrix files were downloaded as
TXT files. Data preprocessing included the conversion and rejection
of unqualified data, calibration, filing of missing data and
standardization. The demographics and clinical characteristics of
these samples of the microarray profiles GSE114206, GSE41499 and
GSE109934, except for the GSE33482 profile are summarized in
Tables SI and SII.
DEG screening
A comparison of the chemotherapy-sensitive samples
and the chemotherapy-resistant samples identified the DEGs based on
GEO2R analysis and the defined values of |log FC| ≥1 and P<0.05.
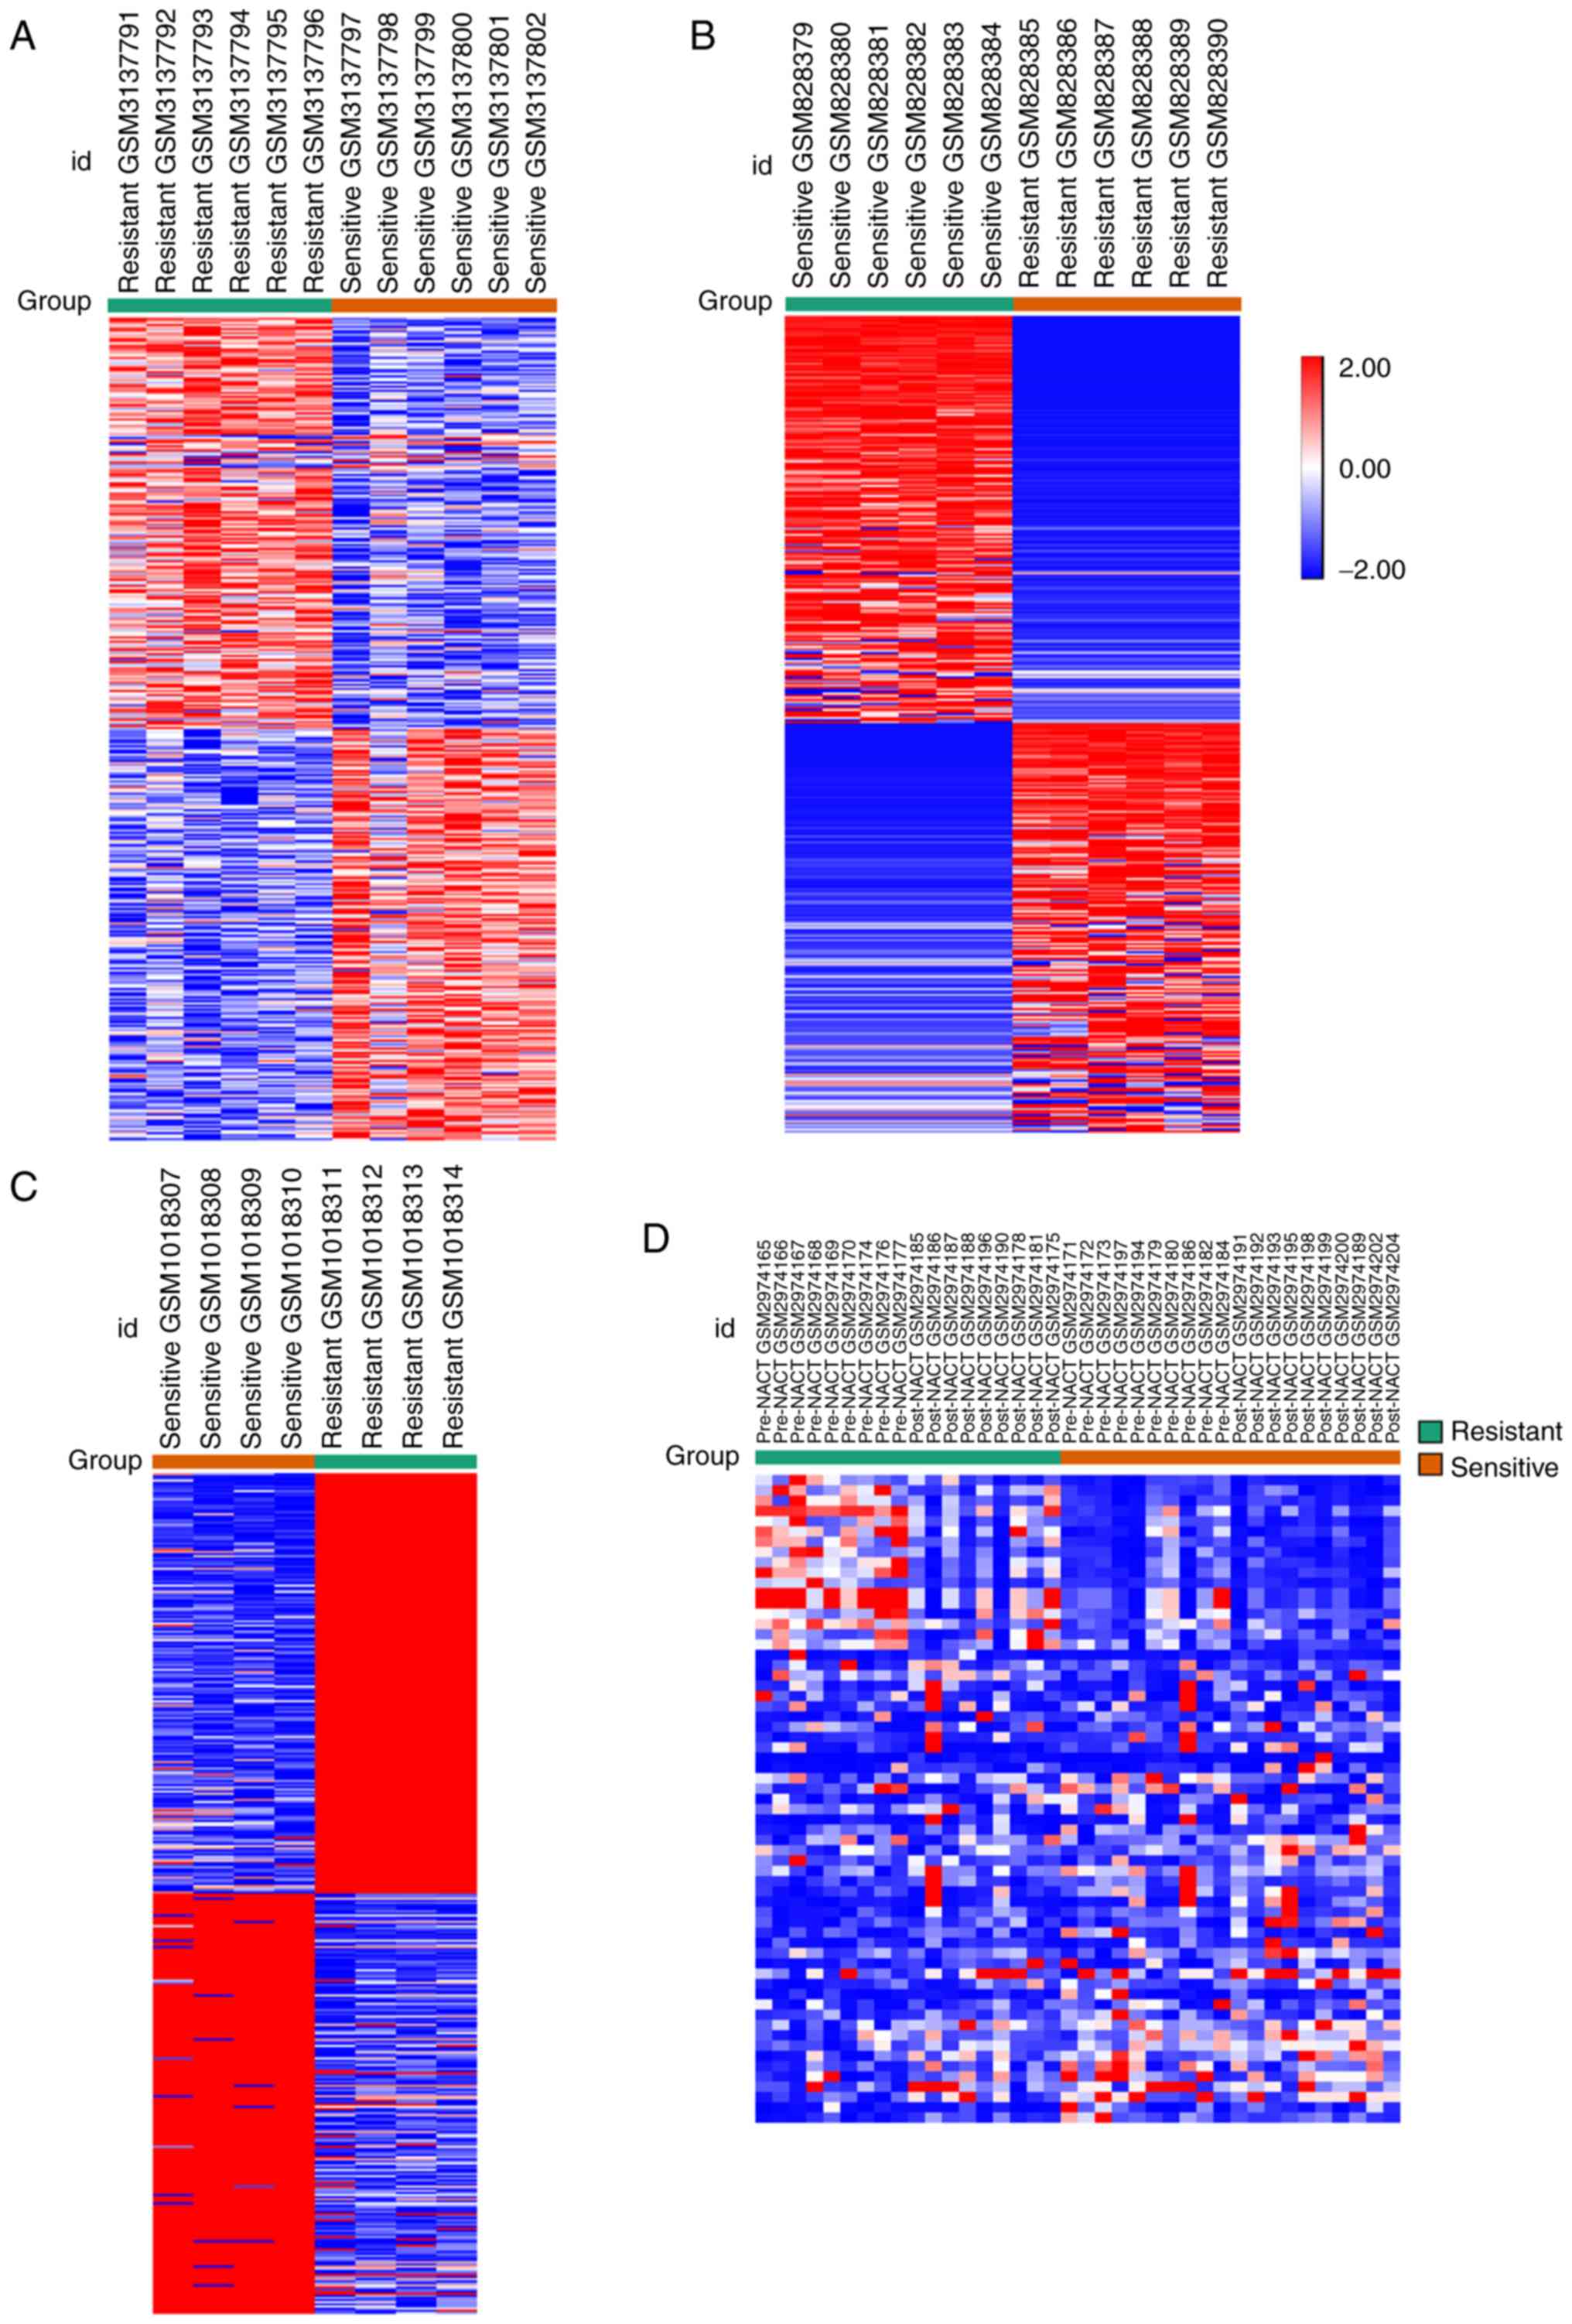
A total of 1,976, 1,086 and 3,382 DEGs were identified from the
GSE114206, GSE41499 and GSE33482 datasets, respectively (expression
heat map of the top DEGs are shown in Fig. 1A-C from GSE114206, GSE33482 and
GSE41499). A total of 63 genes were selected as DEGs from the
GSE109934 profile by comparing the platinum-resistant group with
the platinum-sensitive group, and the two groups both contained
pre-NACT samples with post-NACT samples. The expression heat maps
are shown in Fig. 1D. Of these
DEGs, 1,040 upregulated and 936 downregulated genes were selected
from GSE114206, and 536 upregulated and 550 downregulated genes
were selected from GSE41499. Subsequently, 106 DEGs from the two
datasets (GSE114206 and GSE41499) were selected, of which 36 genes
were upregulated and 70 genes were downregulated (Fig. 2A). A total of 2,052 upregulated and
1,330 downregulated genes were identified in GSE33482, and 45
upregulated and 18 downregulated genes were identified in
GSE109934. Subsequently, 406 DEGs with the same expression pattern
as the DEGs of the GSE114206 and GSE33482 datasets were selected,
which included 157 upregulated genes and 249 downregulated genes
(Fig. 2B). To further screen genes
related to drug resistance before and after neoadjuvant
chemotherapy, 106 DEGs and 406 DEGs from the drug-resistant
profiles were compared with GSE109934 (the NACT profile). The
results indicated that two core genes, nuclear factor of activated
T-cells, cytoplasmic 1 (NFATc1) and Kruppel-like factor 4
(KLF4), were potentially associated with neoadjuvant
chemotherapy and platinum-based chemoresistance (Fig. 2C). Three key genes [NFATc1,
nuclear receptor subfamily 4 group A member 3 (NR4A3) and
hepatocyte growth factor (HGF)] were selected (Fig. 2D). The results of the overall
screening are shown in the Venn diagram in Fig. 2E. Four genes potentially associated
with NACT and platinum-based chemoresistance were screened,
including NAFTc1, KLF4, NR4A3 and HGF.
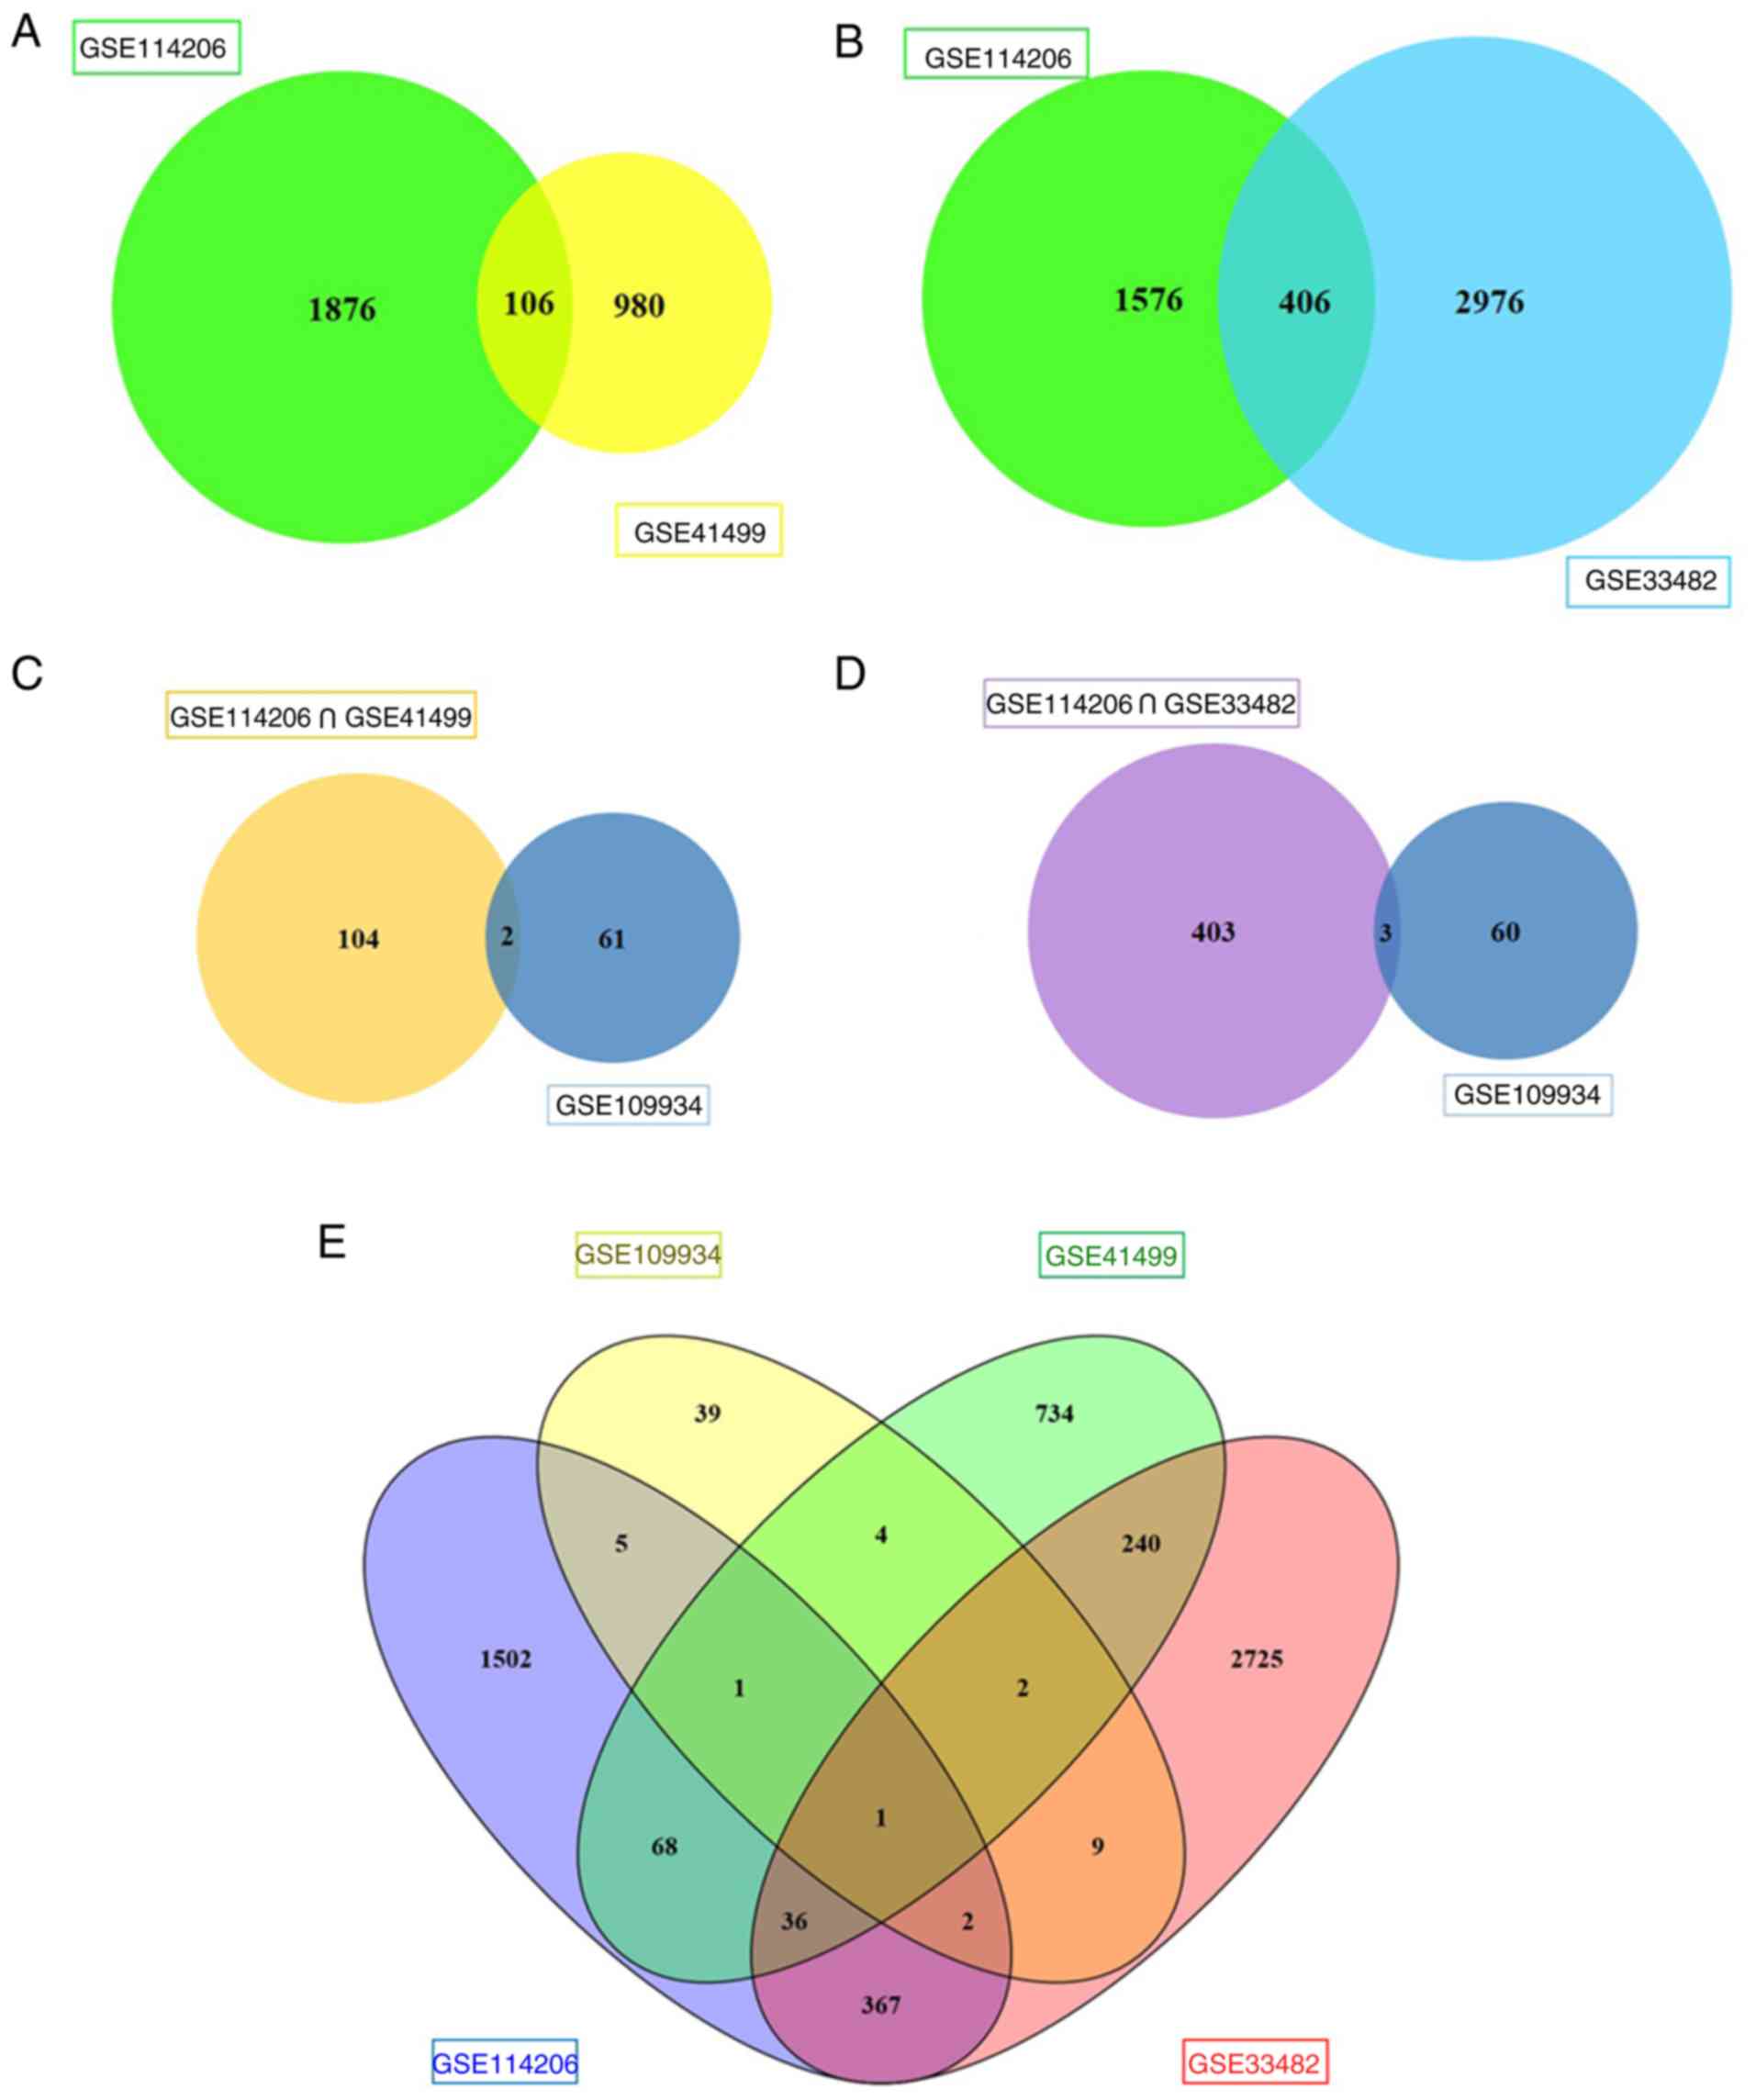 | Figure 2.Venn diagram. (A) A total of 106 DEGs
in the two datasets (GSE114206 and GSE41499) were singled out, of
which 36 genes were upregulated and 70 genes were downregulated.
(B) A total of 406 DEGs in the two datasets (GSE114206 and
GSE33482) were chosen, of which 157 genes were upregulated and 249
genes were downregulated. (C) Two core genes, NFATc1 and KLF4, were
potentially associated with NACT and platinum-based
chemoresistance. (D) Three key genes NFATc1, NR4A3 and HGF were
selected. (E) The results of the overall screening of the Venn
diagram are shown. DEGs, differentially expressed genes; NACT,
neoadjuvant chemotherapy; NAFTc1, nuclear factor of activated
T-cells, cytoplasmic 1; KLF4, Kruppel-like factor 4; NR4A3, nuclear
receptor subfamily 4 group A member 3; HGF, hepatocyte growth
factor. |
GO and KEGG analyses
The results of the GO and KEGG analyses are
presented in Tables II and
III, respectively, based on
P<0.05 in the DAVID tool. Of the 106 DEGs, those that were
upregulated DEGs were most abundant in the BP categories ‘Negative
regulation of signal transduction’ and ‘Negative regulation of cell
communication’ as well as MF category ‘Transcription regulator
activity’. The downregulated DEGs were primarily associated with
‘Positive regulation of defense response’ in the BP category,
‘Plasma membrane part’ in the CC category, and ‘Cytokine activity’
and ‘Growth factor activity’ in the MF category. Consistent with
the results of the KEGG analysis, the downregulated DEGs were
enriched in ‘Toll-like receptor signaling pathway’ development
(Table II).
| Table II.Gene Ontology analysis and KEGG
enrichment analyses of 106 differentially expressed genes
correlated with platinum-based chemoresistance in ovarian
carcinoma. |
Table II.
Gene Ontology analysis and KEGG
enrichment analyses of 106 differentially expressed genes
correlated with platinum-based chemoresistance in ovarian
carcinoma.
| Category | Term | Count | % | P-value |
|---|
| Upregulated |
|
GOTERM_BP_FAT | GO:0009968~negative
regulation of signal transduction | 4 | 1.2 | 1.5E-2 |
|
GOTERM_BP_FAT | GO:0010648~negative
regulation of cell communication | 4 | 1.2 | 2.0E-2 |
|
GOTERM_MF_FAT |
GO:0030528~transcription regulator
activity | 8 | 2.4 | 2.6E-2 |
| Downregulated |
|
GOTERM_BP_FAT | GO:0031349~positive
regulation of defense response | 6 | 0.9 | 1.9E-5 |
|
GOTERM_BP_FAT | GO:0008285~negative
regulation of cell proliferation | 10 | 1.4 | 3.2E-5 |
|
GOTERM_BP_FAT |
GO:0042127~regulation of cell
proliferation | 14 | 2.0 | 3.9E-5 |
|
GOTERM_BP_FAT | GO:0006955~immune
response | 12 | 1.7 | 2.3E-4 |
|
GOTERM_BP_FAT |
GO:0051174~regulation of phosphorus
metabolic process | 10 | 1.4 | 3.0E-4 |
|
GOTERM_CC_FAT | GO:0044459~plasma
membrane part | 21 | 3.0 | 1.5E-3 |
|
GOTERM_CC_FAT | GO:0005886~plasma
membrane | 29 | 4.1 | 2.7E-3 |
|
GOTERM_CC_FAT |
GO:0005576~extracellular region | 19 | 2.7 | 3.2E-3 |
|
GOTERM_CC_FAT |
GO:0044421~extracellular region part | 11 | 1.6 | 1.2E-2 |
|
GOTERM_CC_FAT |
GO:0005615~extracellular space | 9 | 1.3 | 1.3E-2 |
|
GOTERM_MF_FAT | GO:0005125~cytokine
activity | 6 | 0.9 | 1.4E-3 |
|
GOTERM_MF_FAT | GO:0008083~growth
factor activity | 5 | 0.7 | 4.8E-3 |
|
GOTERM_MF_FAT |
GO:0005068~transmembrane receptor protein
tyrosine kinase adaptor protein activity | 2 | 0.3 | 2.1E-2 |
|
GOTERM_MF_FAT |
GO:0005539~glycosaminoglycan binding | 4 | 0.6 | 2.1E-2 |
|
GOTERM_MF_FAT | GO:0001871~pattern
binding | 4 | 0.6 | 2.7E-2 |
|
KEGG_PATHWAY | hsa04620: Toll-like
receptor signaling pathway | 4 | 0.6 | 2.9E-2 |
| Table III.Gene ontology analysis and KEGG
enrichment analyses of 406 differentially expressed genes
correlated to platinum-based chemoresistance in ovarian
carcinoma. |
Table III.
Gene ontology analysis and KEGG
enrichment analyses of 406 differentially expressed genes
correlated to platinum-based chemoresistance in ovarian
carcinoma.
| Category | Term | Count | % | P-value |
|---|
| Upregulated |
|
GOTERM_BP_FAT | GO:0051240~positive
regulation of multicellular organismal process | 10 | 0.8 | 2.7E-4 |
|
GOTERM_BP_FAT | GO:0002474~antigen
processing and presentation of peptide antigen via MHC class I | 4 | 0.3 | 3.9E-4 |
|
GOTERM_BP_FAT | GO:0048002~antigen
processing and presentation of peptide antigen | 4 | 0.3 | 1.8E-3 |
|
GOTERM_BP_FAT |
GO:0007267~cell-cell signaling | 14 | 1.1 | 2.0E-3 |
|
GOTERM_BP_FAT | GO:0008283~cell
proliferation | 11 | 0.8 | 4.5E-3 |
|
GOTERM_CC_FAT |
GO:0044421~extracellular region part | 26 | 2.0 | 1.7E-7 |
|
GOTERM_CC_FAT |
GO:0005576~extracellular region | 39 | 3.0 | 2.2E-7 |
|
GOTERM_CC_FAT | GO:0044459~plasma
membrane part | 39 | 3.0 | 2.4E-6 |
|
GOTERM_CC_FAT |
GO:0031226~intrinsic to plasma
membrane | 25 | 1.9 | 3.7E-5 |
|
GOTERM_CC_FAT | GO:0005887~integral
to plasma membrane | 24 | 1.8 | 7.7E-5 |
|
GOTERM_MF_FAT | GO:0005125~cytokine
activity | 8 | 0.6 | 1.5E-3 |
|
GOTERM_MF_FAT |
GO:0030246~carbohydrate binding | 10 | 0.8 | 3.5E-3 |
|
GOTERM_MF_FAT | GO:0032393~MHC
class I receptor activity | 3 | 0.2 | 9.2E-3 |
|
GOTERM_MF_FAT |
GO:0004947~bradykinin receptor
activity | 2 | 0.2 | 2.6E-2 |
|
GOTERM_MF_FAT |
GO:0008454~alpha-1,3-mannosylglycoprotein
4-beta-N-acetylglucosaminyltransferase activity | 2 | 0.2 | 2.6E-2 |
|
KEGG_PATHWAY | hsa04060:
Cytokine-cytokine receptor interaction | 12 | 0.9 | 7.3E-5 |
|
KEGG_PATHWAY | hsa04940: Type I
diabetes mellitus | 5 | 0.4 | 9.4E-4 |
|
KEGG_PATHWAY | hsa05330: Allograft
rejection | 4 | 0.3 | 6.3E-3 |
|
KEGG_PATHWAY | hsa05332:
Graft-versus-host disease | 4 | 0.3 | 7.9E-3 |
|
KEGG_PATHWAY | hsa04630: Jak-STAT
signaling pathway | 6 | 0.5 | 2.3E-2 |
| Downregulated |
|
GOTERM_BP_FAT | GO:0050830~defense
response to Gram-positive bacterium | 5 | 0.2 | 1.2E-4 |
|
GOTERM_BP_FAT |
GO:0002449~lymphocyte mediated
immunity | 7 | 0.3 | 3.1E-4 |
|
GOTERM_BP_FAT | GO:0002460~adaptive
immune response based on somatic recombination of immune receptors
built from immunoglobulin superfamily domains | 7 | 0.3 | 5.2E-4 |
|
GOTERM_BP_FAT | GO:0002250~adaptive
immune response | 7 | 0.3 | 5.2E-4 |
|
GOTERM_BP_FAT | GO:0009968~negative
regulation of signal transduction | 11 | 0.5 | 6.9E-4 |
|
GOTERM_CC_FAT |
GO:0044421~extracellular region part | 32 | 1.5 | 5.2E-6 |
|
GOTERM_CC_FAT |
GO:0005615~extracellular space | 23 | 1.1 | 1.5E-4 |
|
GOTERM_CC_FAT |
GO:0005576~extracellular region | 47 | 2.2 | 1.8E-4 |
|
GOTERM_CC_FAT | GO:0044459~plasma
membrane part | 46 | 2.2 | 2.6E-3 |
|
GOTERM_CC_FAT |
GO:0031012~extracellular matrix | 13 | 0.6 | 2.7E-3 |
|
GOTERM_MF_FAT |
GO:0008081~phosphoric diester hydrolase
activity | 5 | 0.2 | 2.1E-2 |
|
GOTERM_MF_FAT | GO:0005164~tumor
necrosis factor receptor binding | 3 | 0.1 | 2.8E-2 |
|
GOTERM_MF_FAT | GO:0005125~cytokine
activity | 7 | 0.3 | 3.6E-2 |
|
GOTERM_MF_FAT | GO:0005509~calcium
ion binding | 19 | 0.9 | 4.0E-2 |
|
GOTERM_MF_FAT |
GO:0022890~inorganic cation transmembrane
transporter activity | 6 | 0.3 | 4.2E-2 |
|
KEGG_PATHWAY | hsa04514: Cell
adhesion molecules (CAMs) | 8 | 0.4 | 6.6E-3 |
|
KEGG_PATHWAY | hsa04060:
Cytokine-cytokine receptor interaction | 11 | 0.5 | 1.2E-2 |
|
KEGG_PATHWAY | hsa05330: Allograft
rejection | 4 | 0.2 | 2.2E-2 |
|
KEGG_PATHWAY | hsa04940: Type I
diabetes mellitus | 4 | 0.2 | 3.3E-2 |
|
KEGG_PATHWAY | hsa04672:
Intestinal immune network for IgA production | 4 | 0.2 | 4.9E-2 |
Of the 406 DEGs, the upregulated DEGs were
principally concentrated in the BP category ‘Positive regulation of
multicellular organismal process’, the CC category ‘Extracellular
region part’, and the MF categories ‘Cytokine activity’ and
‘Carbohydrate binding’. The downregulated DEGs were primarily
associated with ‘Defense response to a Gram-positive bacterium’ in
the BP category, ‘Extracellular region part’ in the CC category,
and ‘Phosphoric diester hydrolase activity’ in the MF category. The
results also showed that the upregulated DEGs were generally
associated with ‘Cytokine-cytokine receptor interaction’, ‘Type I
diabetes mellitus’ and ‘JAK-STAT signaling pathway’, whereas the
downregulated DEGs were associated with ‘Cell adhesion molecules
(CAMs)’, ‘Cytokine-cytokine receptor interaction’ and ‘Allograft
rejection’ according to the KEGG pathway analysis (Table III). The outcomes of the 106 DEGs
and 406 DEGs are also presented as a bar chart and scatterplot
diagram of the results of the GO and KEGG analyses, respectively.
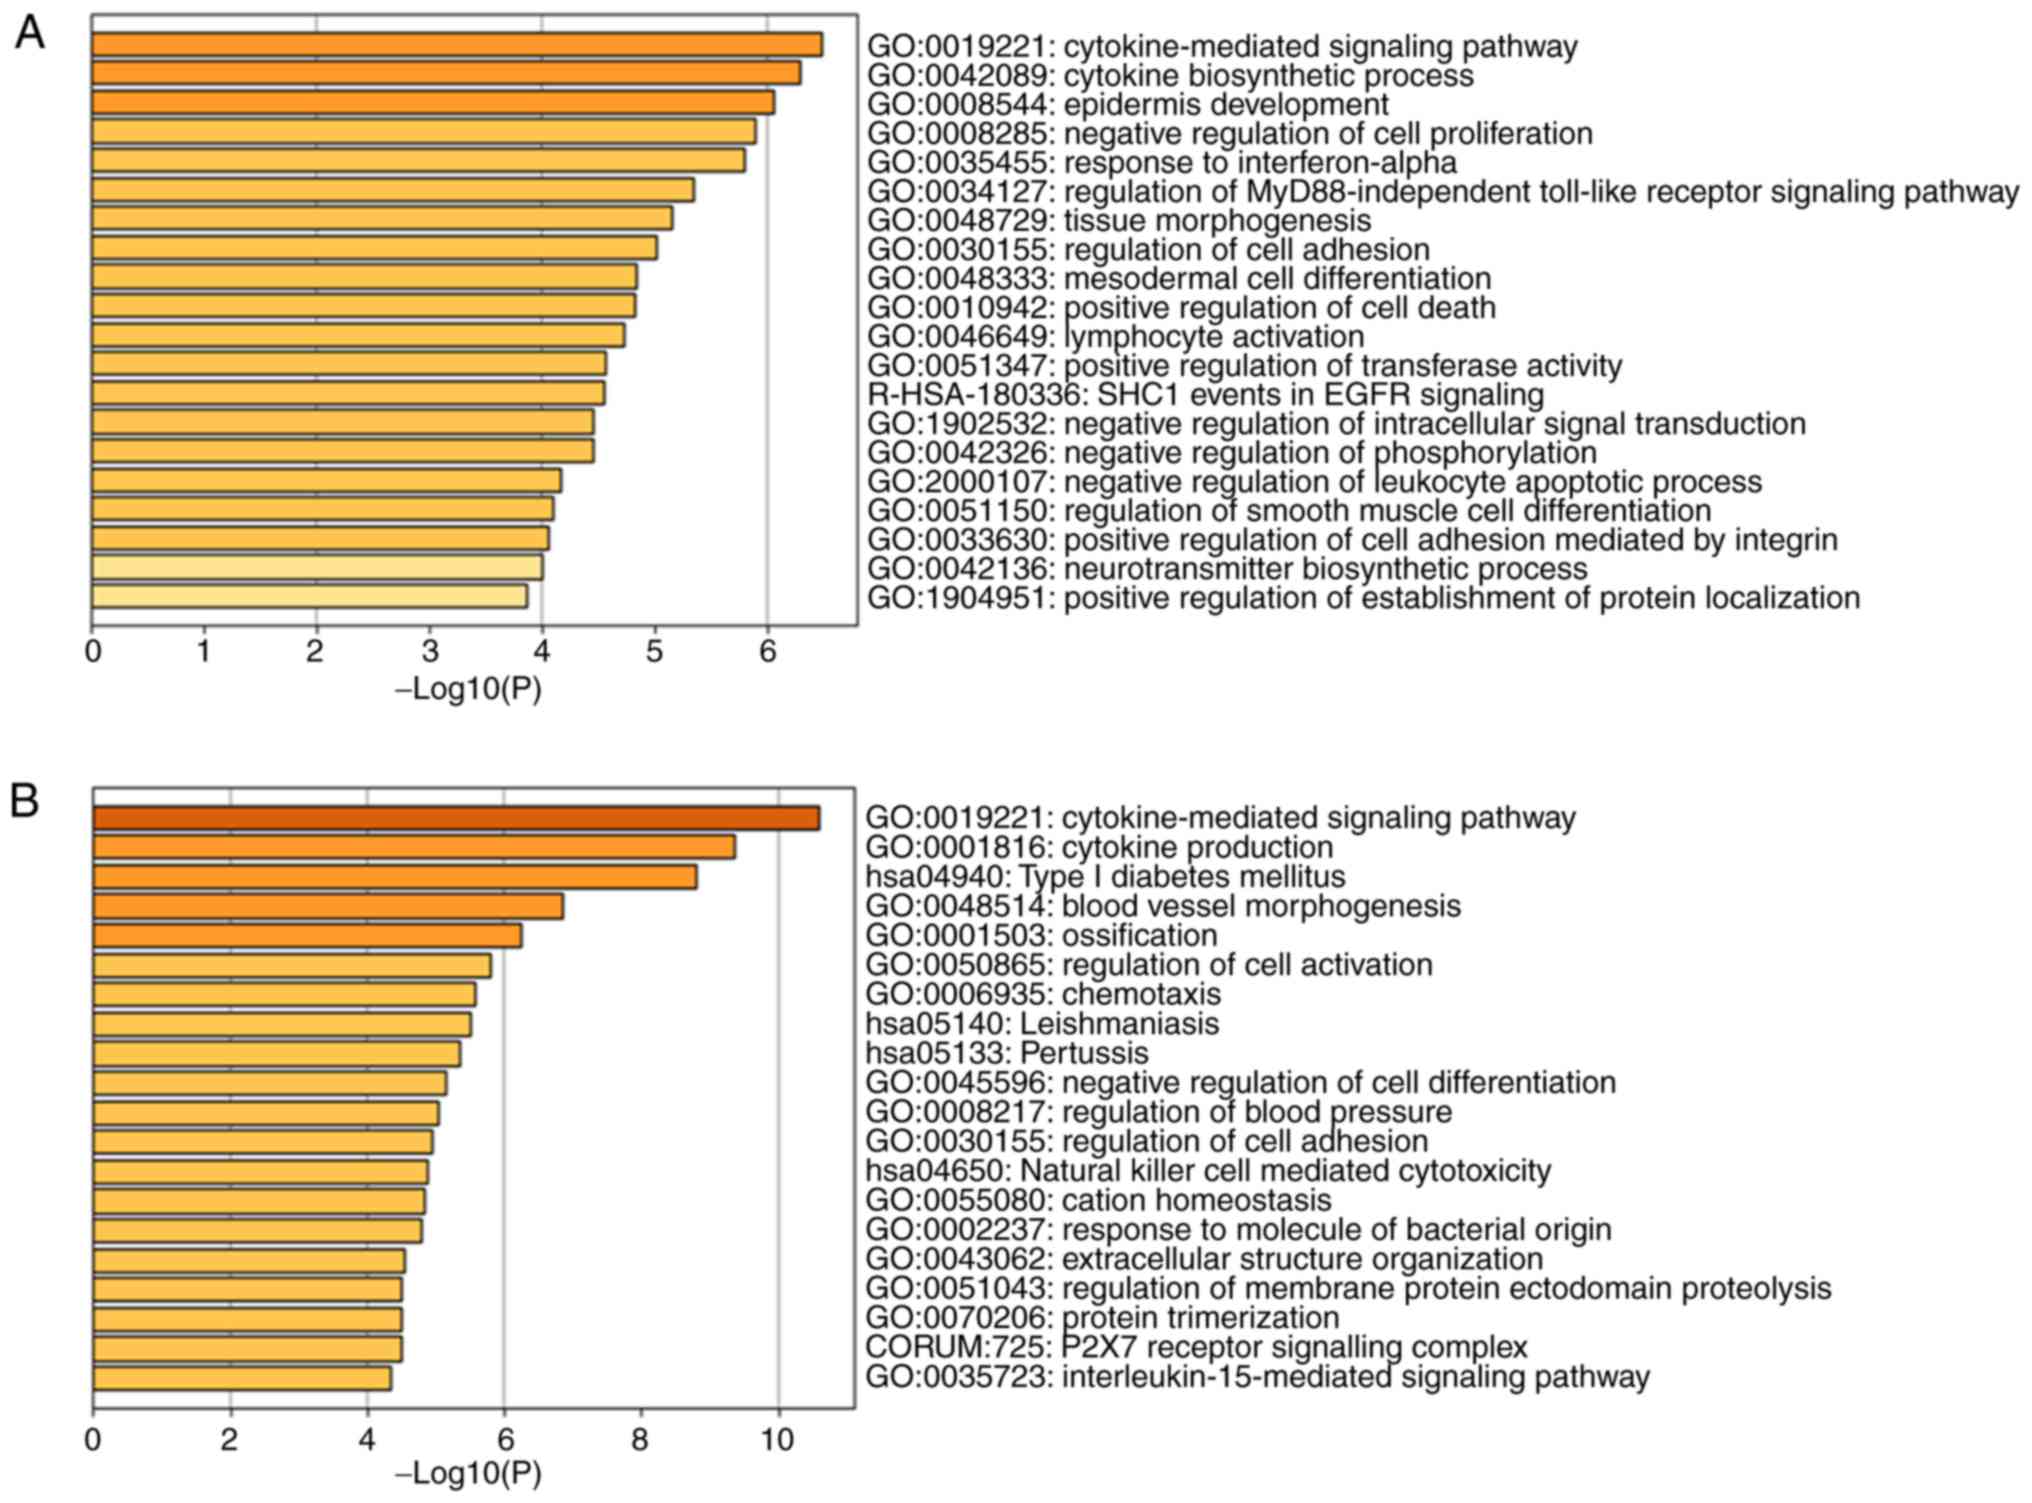
According to the results of a bar chart and scatterplot diagram in
106 DEGs, the significantly enriched GO terms were
cytokine-mediated signaling pathway, cytokine biosynthetic process
and epidermis development in Fig.
3A and the significantly enriched KEGG terms were Toll-like
receptor signaling pathway in Fig.
3C. The results of a bar chart and scatterplot diagram in 406
DEGs showed that GO terms were mainly enriched in the
cytokine-mediated signaling pathway, cytokine production and type I
diabetes mellitus in Fig. 3B while
KEGG terms were mainly enriched in cytokine-cytokine receptor
interaction, cell adhesion molecules and phagosome in Fig. 3D. Only the top three terms are
listed.
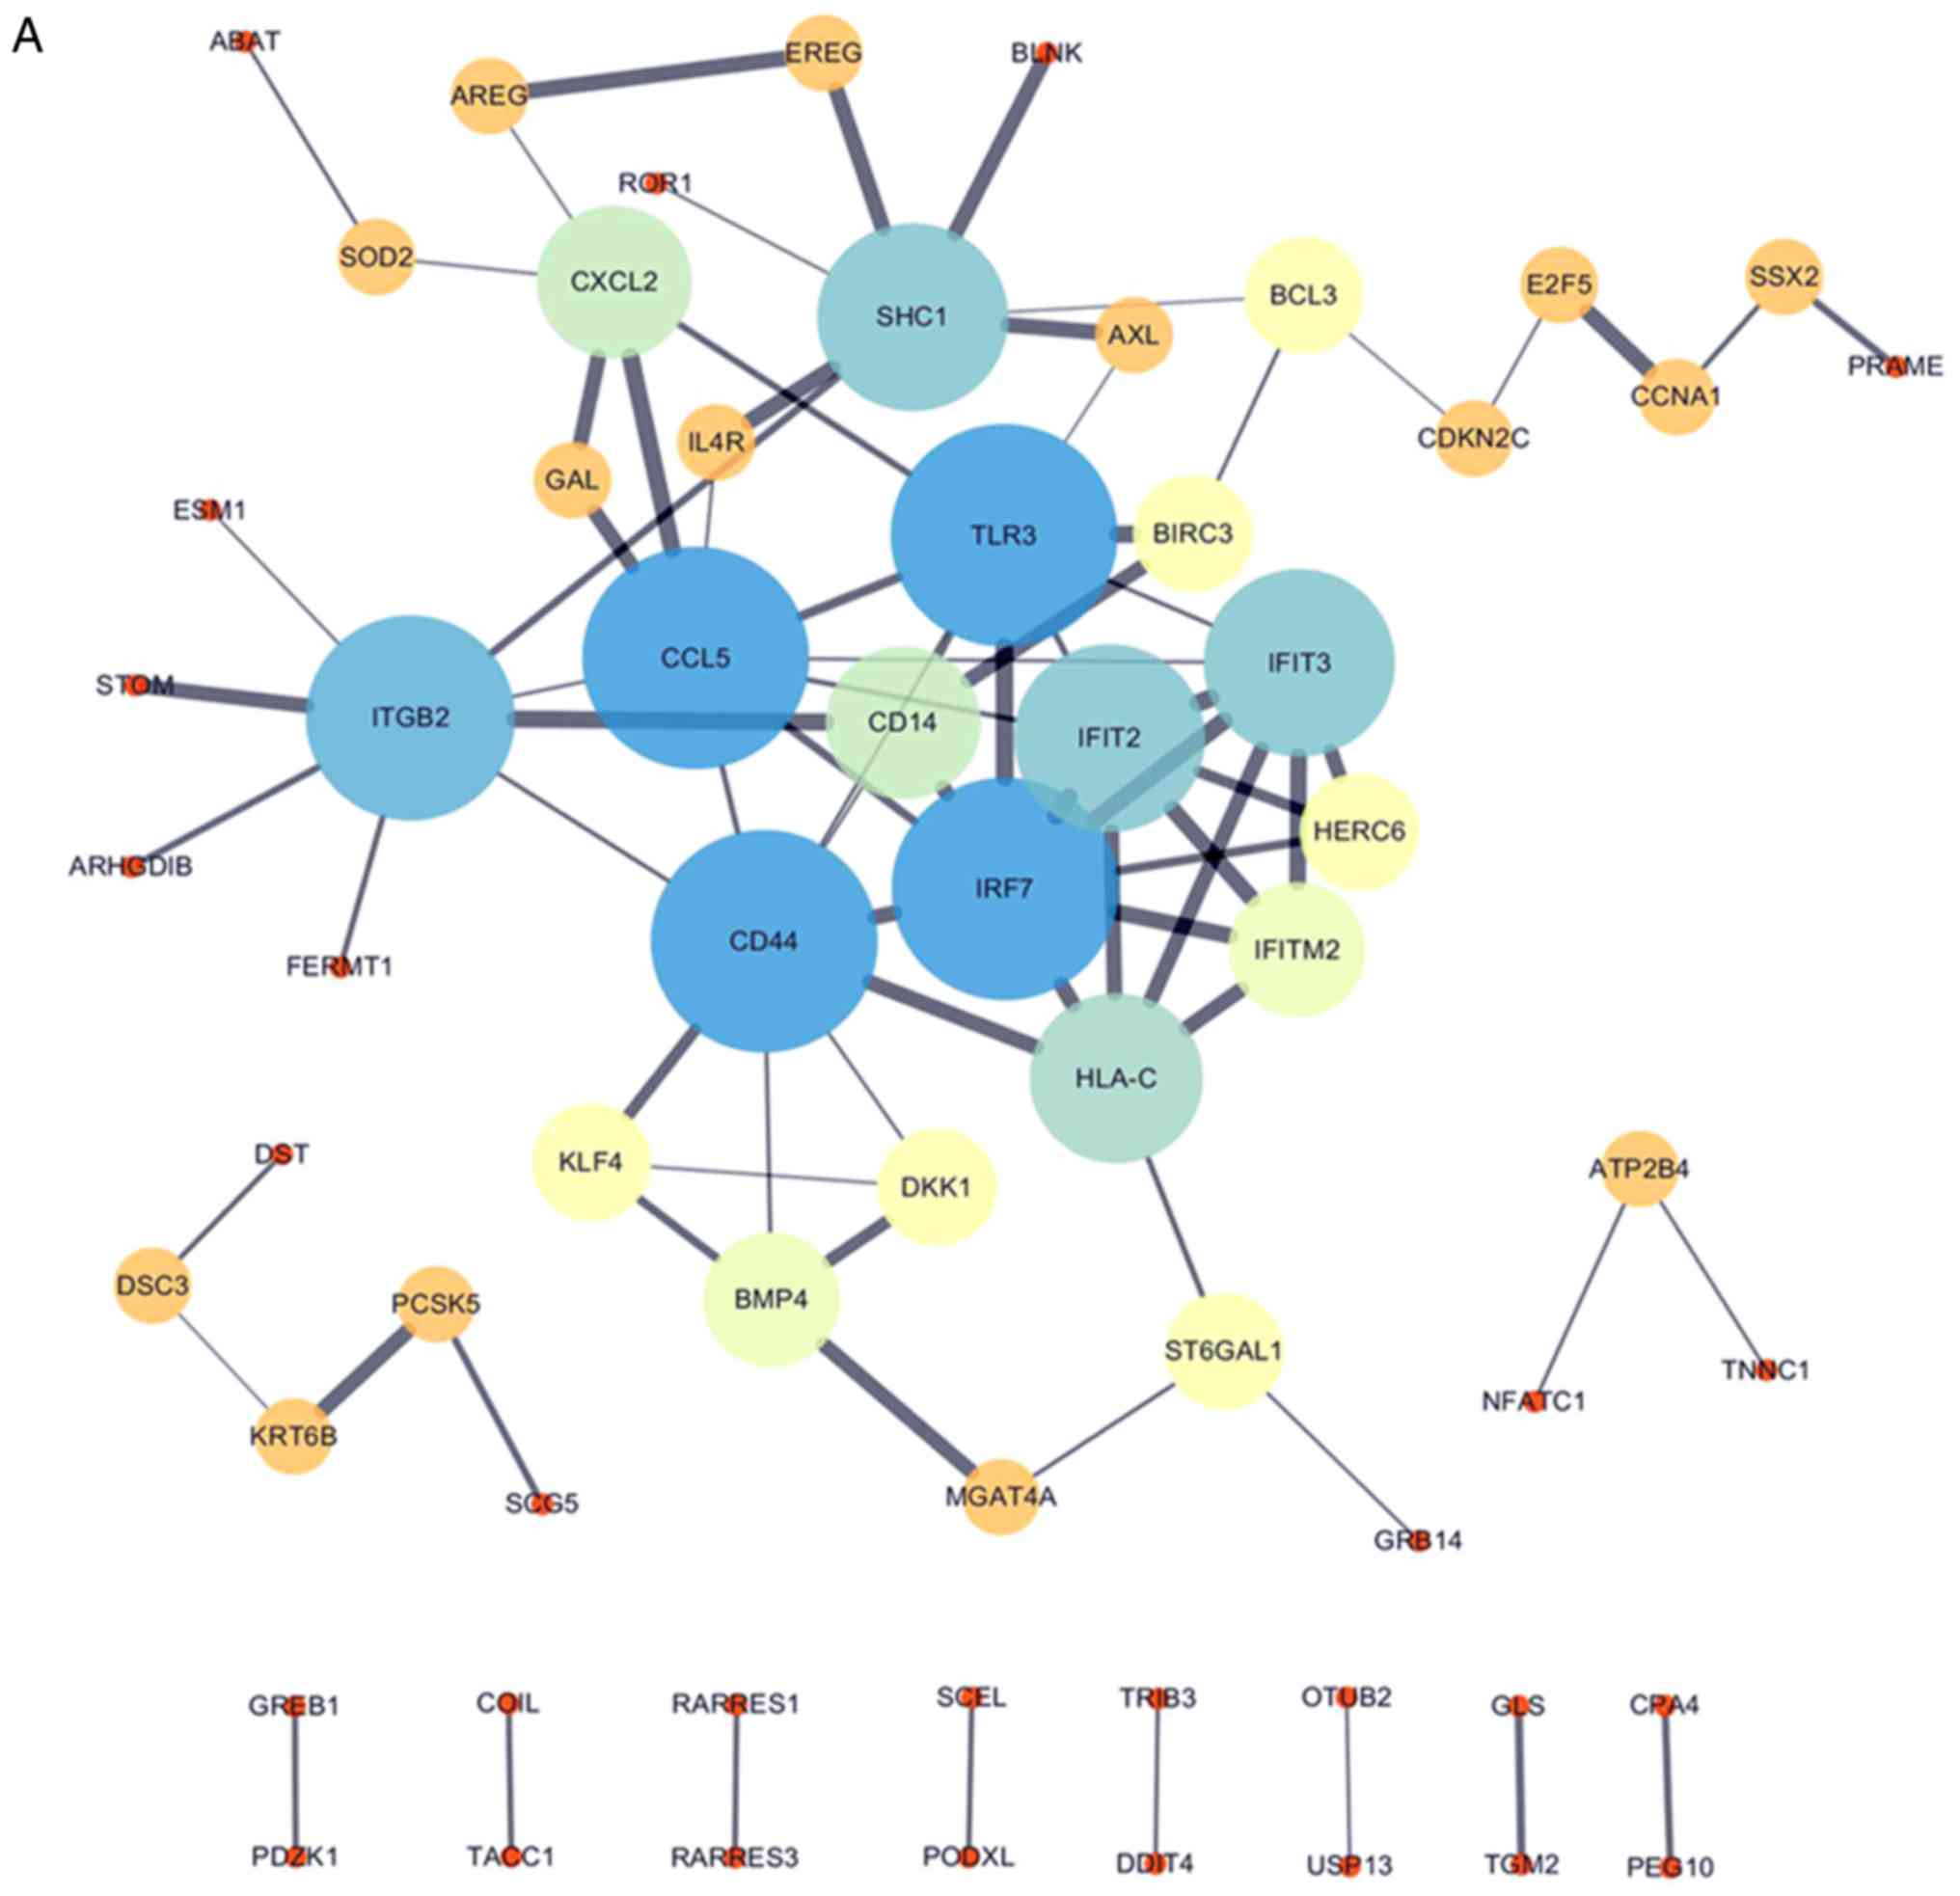
PPI network
All 106 DEGs from the 2 datasets (GSE114206 and
GSE41499) (Fig. 4A) and all 406
DEGs from the 2 datasets (GSE114206 and GSE33482) (Fig. 4B) were analyzed using the STRING
database to further examine the characteristics and the potential
interconnections of the DEGs. A PPI network of the DEGs was
generated in Cytoscape (Fig. 4A and
B).
Protein/gene interaction network and
biological processes
GeneMANIA was used to analyze and elucidate the
functional roles of NFATc1, KLF4, NR4A3 and HGF in drug tolerance.
More importantly, additional bioinformatics analysis exposed the
interrelationships among the four genes that play a role in
chemotherapeutic resistance in EOC. A protein/gene interaction
network was formed for the four genes and 20 genes/proteins that
corresponded to drug-tolerance, which included CEBPB, FN1, MET,
PTPRJ, MUC20, PPP3CA, PDCD1, NR4A1, NCOR1, GLMN, KLF6, HGFAC,
RANBP10, NCOR2, NFATC4, HMGB1, PPP3CC, SIX3, INPPL1 and KDM6B. As
shown in Fig. 5A, NFATc1, KLF4,
NR4A3 and HGF were associated with 20 drug-resistant
proteins/genes.
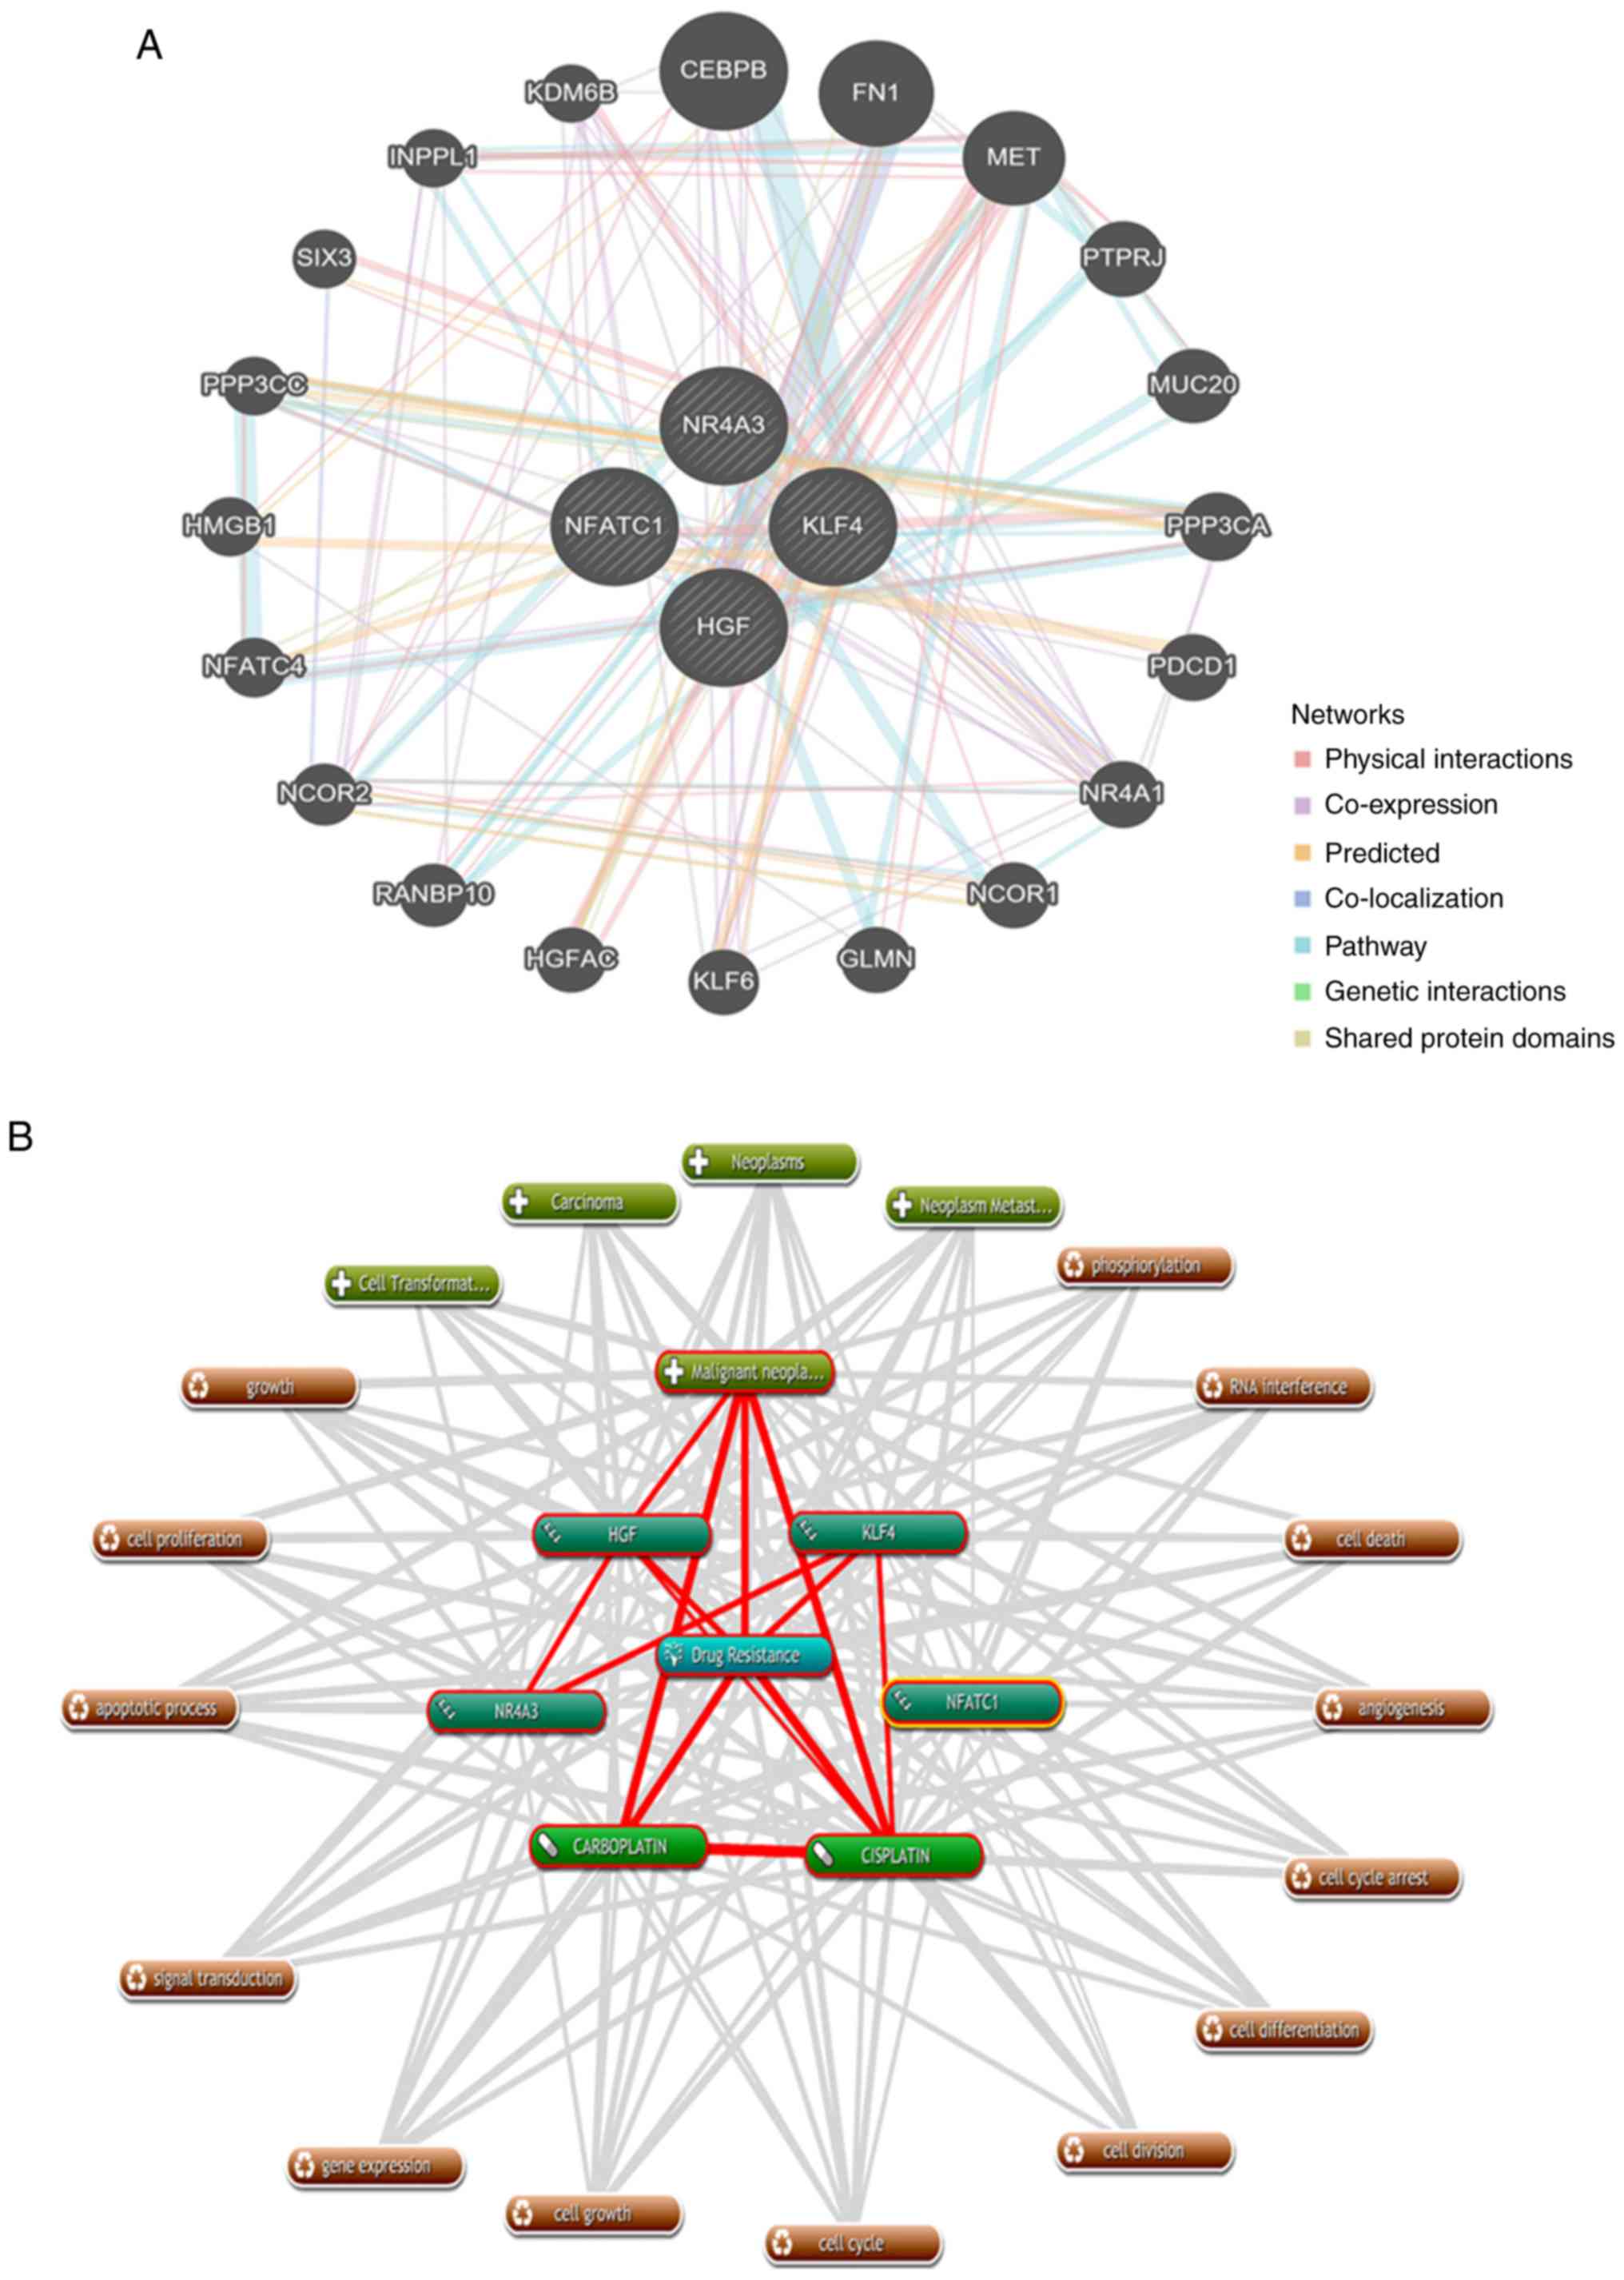 | Figure 5.Protein/gene interaction network and
biological process annotation of the differentially expressed
genes. (A) Protein/gene-protein/gene interaction network of the
four proteins/genes with 20 drug resistance-related proteins/genes
in OC. (B) Four genes/proteins identified using Coremine Medical
tools were associated with drug resistance and OC. Input terms were
NFATc1, KLF4, NR4A3, HGF, drug resistance, cisplatin, carboplatin
and OC. (C) Genetic alterations. Red indicates amplification and
blue indicates deep deletion of genes in 57 of the 594 serous
ovarian cancer patients (10%). OC, ovarian cancer; NAFTc1, nuclear
factor of activated T-cells, cytoplasmic 1; KLF4, Kruppel-like
factor 4; NR4A3, nuclear receptor subfamily 4 group A member 3;
HGF, hepatocyte growth factor. |
As shown in Fig. 5B,
text mining analysis indicated that these four key genes directly
or indirectly participate in 14 physiological processes that
contribute to drug-resistance in OC, including cell proliferation,
cell differentiation, apoptosis, cell division and phosphorylation
(P<0.05). Additionally, the OncoPrint module in the cBioPortal
was used to evaluate genetic conversions and demonstrated that 10%
(57/594) of patients exhibited genetic metamorphosis (Fig. 5C).
RT-qPCR analysis
We quantified the mRNA levels of the four genes
NFATc1, KLF4, NR4A3 and HGF in sensitive ovarian
cells and cisplatin- and carboplatin-resistant cell lines. The mRNA
expression levels of NFATc1 were significantly increased in
cisplatin- and carboplatin-resistant cells compared with those in
sensitive OC cells (all P-values <0.0001; Fig. 6A-a-c). In addition, mRNA expression
of KLF4 was significantly lower in the SKOV3-CDDP and
HeyA8-CDDP cell lines than that in the SKOV3 and HeyA8 cell lines
(both P<0.0001; Fig. 6B-a and
-b). However, mRNA expression of KLF4 was increased in the
A2780-CBP cells (P<0.0001; Fig.
6B-c). Compared with sensitive cells, the expression of NR4A3
was increased in the SKOV3-CDDP, HeyA8-CDDP and A2780-CBP cells
(P<0.0001, P<0.01, and P<0.05, respectively) (Fig. 6C-a-c). We also observed that the
expression of HGF was significantly increased in SKOV3-CDDP,
HeyA8-CDDP and A2780-CBP cells compared with that in the
corresponding sensitive ovarian cancer cells (P<0.05,
P<0.0001, and P<0.001, respectively) (Fig. 6D-a-c).
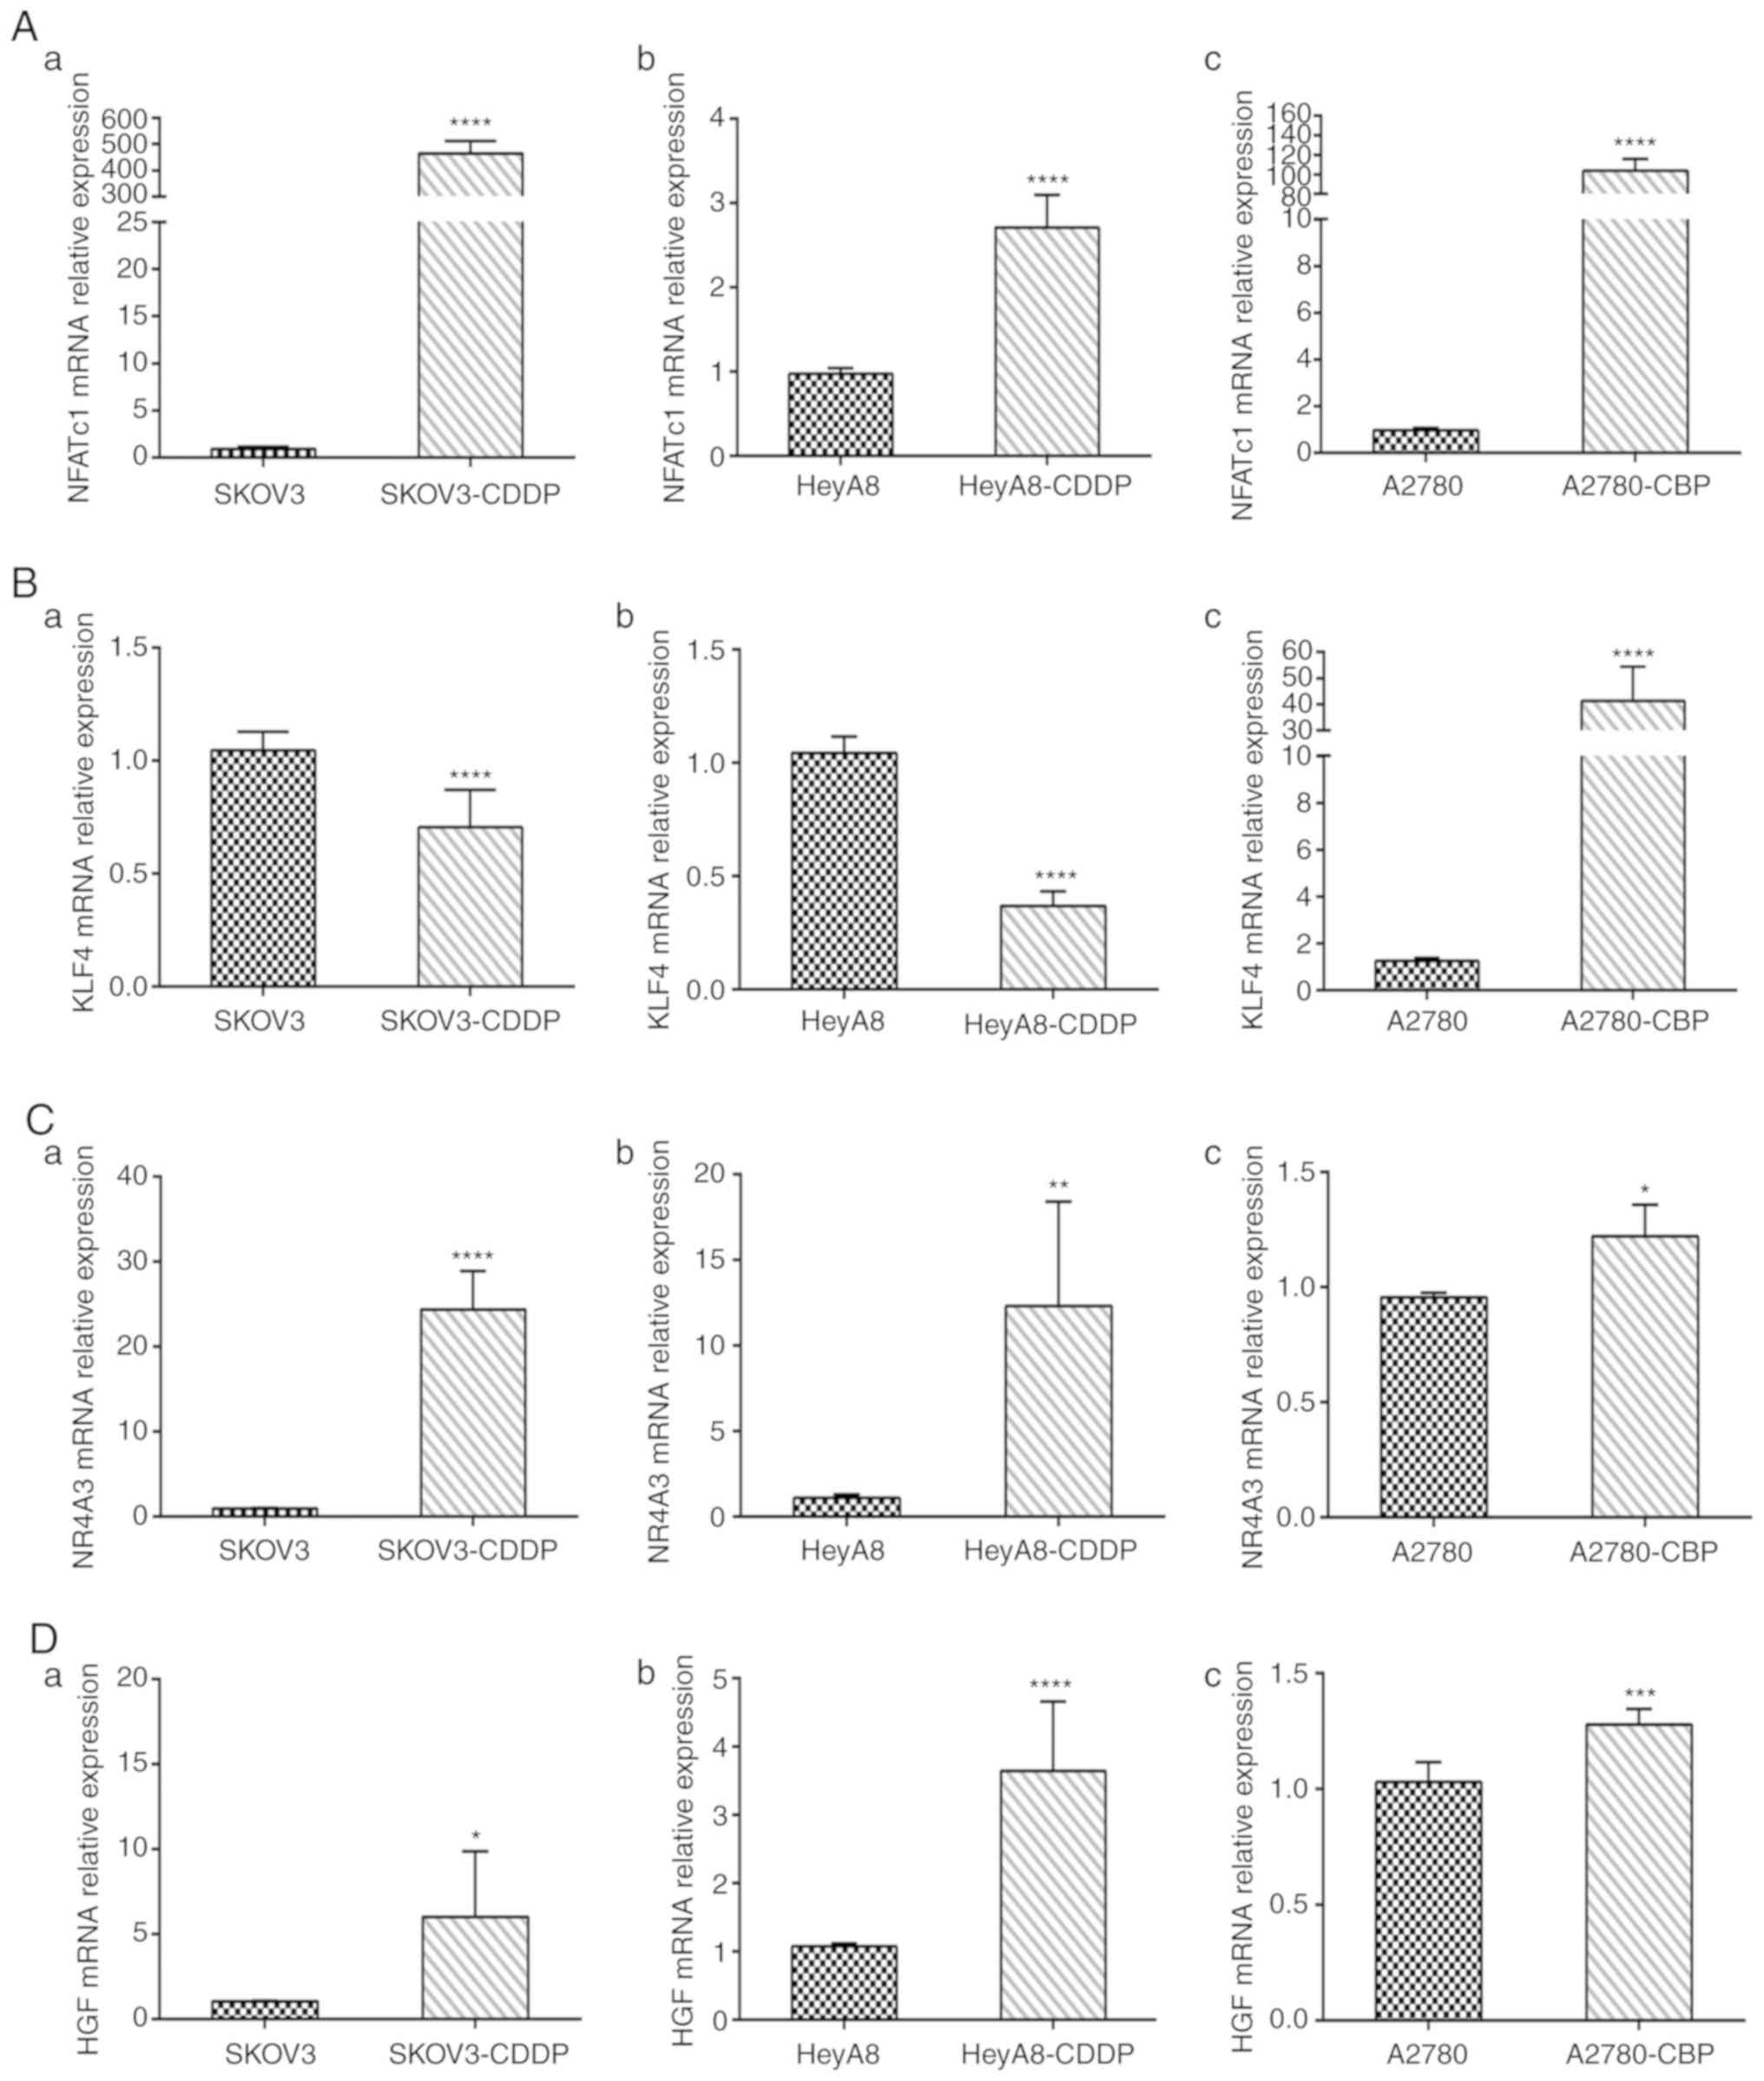 | Figure 6.Using RT-qPCR to detect gene mRNA
expression in cisplatin- and carboplatin-resistant cells and
sensitive ovarian cancer cells. (A) NFATc1 mRNA expression level in
parental sensitive/resistant: (a) SKOV3/SKOV3-CDDP, (b)
HeyA8/HeyA8-CDDP and (c) A2780/A2780-CBP cell lines. (B) KLF4 mRNA
expression level in (a) SKOV3/SKOV3-CDDP, (b) HeyA8/HeyA8-CDDP and
(c) A2780/A2780-CBP cell lines. (C) NR4A3 mRNA expression level in
parental sensitive/resistant: (a) SKOV3/SKOV3-CDDP, (b)
HeyA8/HeyA8-CDDP and (c) A2780/A2780-CBP cell lines. (D) KLF4 mRNA
expression level in parental sensitive/resistant: (a)
SKOV3/SKOV3-CDDP, (b) HeyA8/HeyA8-CDDP and (c) A2780/A2780-CBP cell
lines. *P<0.05, **P<0.01, ***P<0.001, ****P<0.0001,
compared with the parental cell line. CDDP, cisplatin; CBP,
carboplatin. |
Cell migration and invasion assay
analyses
The migratory and invasive potential of sensitive
ovarian cells and cisplatin- and carboplatin-resistant cells in the
Transwell migration assay is shown in Fig. S1A. Quantification revealed a
significant 218.0±8.01% increase in migration in the SKOV3-CDDP
cell line compared with that in sensitive SKOV3 cells (P<0.01;
Fig. S1B-a), a 169.0±5.15%
increase in migration in the HeyA8-CDDP cells compared with that in
HeyA8 cells (P<0.01; Fig.
S1B-b), and a significant 225.9±14.08% increase in migration in
the A2780-CBP cell line compared with that in A2780 cells
(P<0.01; Fig. S1B-c).
Quantification revealed a significant 216.8±19.52% increase in
invasion in the SKOV3-CDDP cell line compared with that in
sensitive SKOV3 cells (P<0.01; Fig.
S1C-a), a 271.9±22.81% increase in invasion in the HeyA8-CDDP
cells compared with that in HeyA8 cells (P<0.01; Fig. S1C-b), and a significant 222.2±6.61%
increase in invasion in the A2780-CBP cell line compared with that
in A2780 cells (P<0.01; Fig.
S1C-c).
Discussion
Ovarian cancer (OC) is the primary cause of death
worldwide in female reproductive malignancies (21,22) OC
patients have no apparent symptoms at early stages, and the
majority of patients are diagnosed at late stages. The current
standard treatment strategy for advanced epithelial ovarian cancer
(AEOC) is primary cytoreductive surgery in combination with
platinum-based first-line chemotherapy and radiotherapy or
endocrine therapy (23,24). When adequate evaluation suggests
that patients are less likely to receive a satisfactory outcome
from tumor cell depletion surgery, neoadjuvant chemotherapy (NACT)
followed by interval-based nodulation (NACT-IDS) after three
platinum-based chemotherapy cycles has become an increasingly
common treatment strategy (25–28).
Overall, research has shown that the survival rate of patients with
stage III or IV OC treated with NACT-IDS is not inferior to that of
patients receiving primary cytoreductive surgery followed by
chemotherapy (27). However,
Rauh-Hain et al (5)
suggested that compared with the primary surgery (PDS) group,
patients in the NACT-IDS group had a higher rate of resistance to
platinum after initial platinum chemotherapy. Therefore, there is
an urgent clinical need to identify predictive markers for drug
resistance and to accurately assess the risk before treatment to
identify AEOC patients who are most likely to benefit from NACT and
to optimize the role of NACT in OC treatment.
Therefore, the present study will aid gynecologic
oncologists to better understand the mechanisms of OC resistance
and avoid the occurrence of early chemotherapy resistance in their
patients. Additionally, the core genes in this study may contribute
to the identification of candidate biomarkers and the introduction
of novel therapeutic targets for EOC.
In our research, the combined analyses identified 4
DEGs between pre-NACT and post-NACT cells that were also in common
between sensitive and cisplatin- /carboplatin-resistant OC cells;
these genes were ascertained as those most likely to be associated
with neoadjuvant chemotherapy and platinum-based chemoresistance in
EOC.
The nuclear factor of activated T-cells, cytoplasmic
1 (NFATc1) gene is a member of the NFAT gene family and
encodes a component of the nuclear factor of activated T cells
DNA-binding transcription complex and has been identified as a
transcription factor in recent years.
The NFAT family
As required components for promoting and activating
the expression of IL-2 and IL-2 receptors, members of the NFAT
family are primarily described as being present in inactive T cells
and functioning as a set of T cell-specific transcription factors
(29–31). From the ongoing study of the NFAT
family, we have found that NFAT is not only T cell-specific but is
also expressed in a wide range of lymphoid cells and possibly in
non-lymphocytes, such as natural killer (NK) cells and macrophages.
More recently, five NFAT subfamily members, including the
NFAT1, NFAT2, NFAT3, NFAT4 and NFAT5 families, have
been discovered (32,33). Four members of the NFAT gene
subfamily, NFAT1, NFAT2, NFAT3 and NFAT4, encode four
proteins that are regulated by the calcium and calcineurin
signaling pathway. The NFAT5 gene was found to encode a
protein regulated by the cellular response to hyperosmotic stress
(34,35).
Structure of the NFAT family
The general structure of the NFAT protein family is
shown in Fig. 7A. The conventional
NFAT protein (NFAT1-4) contains N- and C-terminal transactivation
domains (TAD-N and TAD-C, respectively), which are highly variable
in different NFAT proteins and isoforms. Additionally, except for
the absence of a calcineurin-binding domain in the structure of
NFAT5, all other conventional members have a Rel homology region
(RHR), which consists of an NFAT homology region (NHR) and a
DNA-binding domain (DBD). NFAT5 also lacks Fos/Jun residues, so it
cannot bind to DNA through c-Fos and Jun. However, NFAT5 preserves
the DNA contact residues of NFAT1 through NFAT4, such as the Rel
homology domain, which can help bind DNA sequences (36). Deeper study of the NFAT family has
shown that NHR contains several conserved regulatory motifs among
NFAT family members, such as a nuclear localization sequence (NLS),
a nuclear export signal (NES), serine-rich regions (SRRs),
serine-proline repeat motifs (SPs), and a phosphorylation site.
Moreover, NFAT family members contain a DNA-binding loop, binding
sites for Fos and Jun in NFAT1-4, and a NES in the DNA-binding
domain (DBD) (37). A schematic of
the primary alignment of NFAT1-5 is displayed in Fig. 7B.
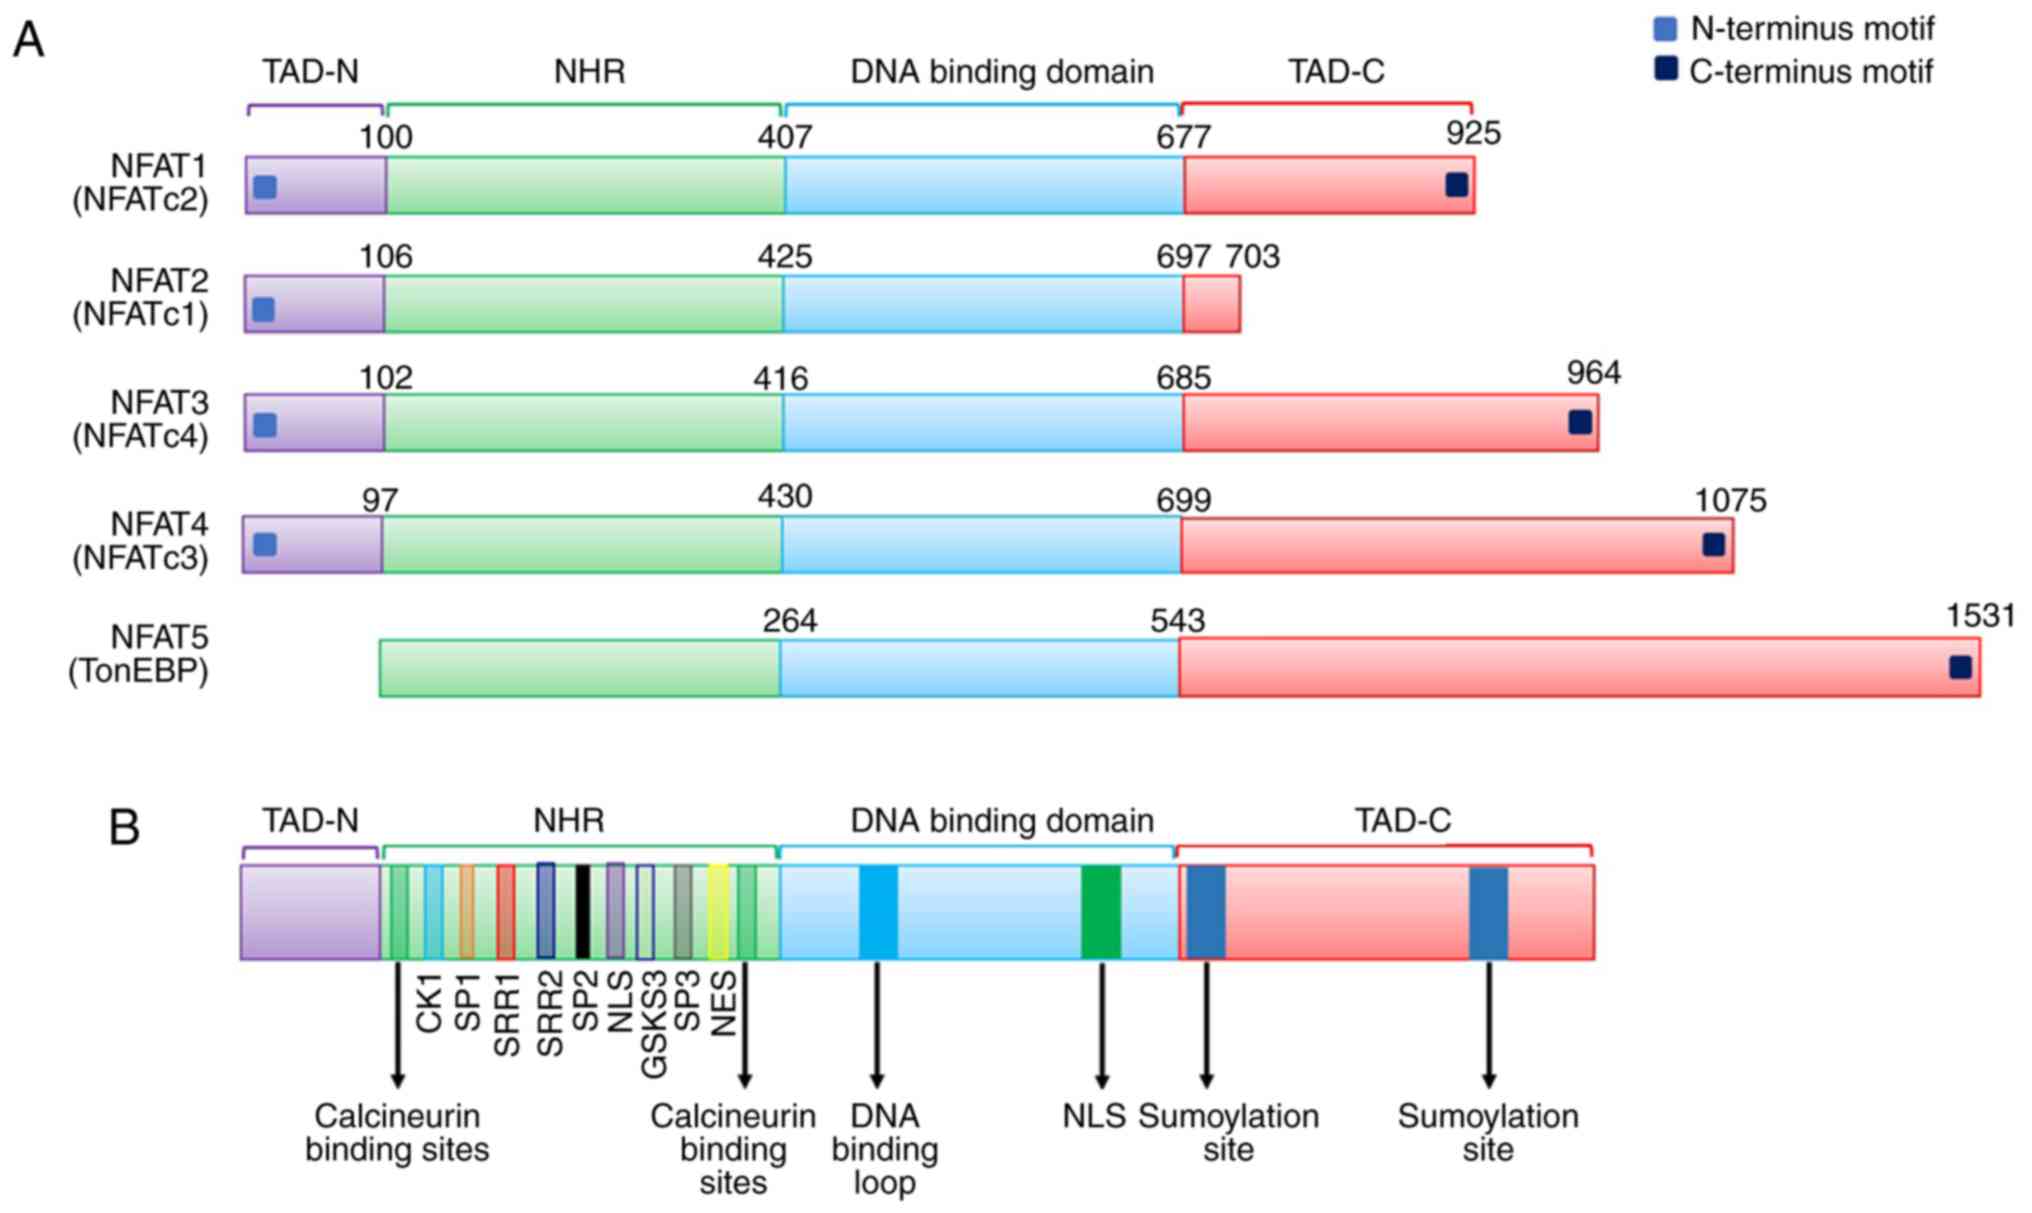 | Figure 7.(A) General structure of the NFAT
protein family is shown. NFAT protein consists of N- and C-terminus
transactivation domains which are tremendously alterable among the
different NFAT members and isoforms. Except that NFAT5 has no
calcineurin-binding domain in its structure, all other conventional
members have a structure named as REL homology region (RHR), which
consisted of a NFAT homology region (NHR) and DNA-binding domain
(DBD). (B) Schematic primary alignment of NFAT. The NHR contains a
nuclear localization sequence (NLS), a nuclear export signal (NES)
and two calcineurin binding sites. NHR also contains serine-rich
regions (SRRs), serine-proline-repeat motifs (SPs), and a
phosphorylation site, such as casein kinase 1 (CK1), GSK3 docking
site. The DNA binding domain, contains DNA-binding loop sites that
directly contacts DNA core sequence (A/T) GGAAA and a nuclear
localization sequence NLS. C-terminus transactivation domains
(TAD-C) consist of two sumoylation sites. (C) Tumor-related
processes regulated by NFAT transcription factors. The nuclear
factor of activated T-cells (NFAT) family includes five
subfamilies, namely, the NFAT1 family, the NFAT2 family and the
NFAT3, NFAT4 and NFAT5 family. NFAT proteins directly regulate the
expression of genes related to cellular proliferation, apoptosis,
angiogenesis and tissue invasion mechanisms among others. (D) NOR1
(NR4A3) belongs to one of the NR4A family. NR4A subfamily members
are one of the subfamily of nuclear receptors (NRs). NRs are major
drug targets for the therapy of reproductive abnormalities and
cancer. We classified and present 48 NR members. (E) Phylogenetic
classification of the human Krüppel-like factor (KLF) family. Human
Genome Organization Gene Nomenclature Committee has numbered the
Krüppel-like factor family in the order in which members of were
discovered. Based on the structural similarity of the N-terminal,
17 human KLF proteins can be divided into three major subfamilies.
Due to the presence of recognizable protein-protein interactions
motifs, KLF5, 15 and 17 are not classified into any other family.
KLF3, 8, and 12 (group 1) usually bind to the C-terminal binding
proteins (CtBPs), which act as inhibitors of gene transcription.
Members of the second group of KLF factors, including 1, 2, 4, 6,
and 7, generally reckon as transcriptional activators because they
all have acidic activation domains. KLF9, 10, 11, 13, 14 and 16
(group 3) share a Sin3a-interacting domain (SID), an α-helical
motif that interworks with the repressor protein Sin3a. (F)
Structure and function domains of KLF4, where the amino terminal is
the transcriptional activation domain, the carboxyl terminal
(triple Cys2-His2 zinc finger) is the DNA-binding domain, which are
highly conserved among KLFs, and repression domain is the
intermediate target of post-translational regulation. |
Function of the NFAT family
The NFAT family was originally regarded as
transcription factors that affect T cell activation. Therefore, in
recent decades, members of this family have been major molecular
targets for the development of immunosuppressive drugs, such as
cyclosporine A, which modulates T cell immunity in autoimmune
diseases (38,39). Accumulating evidence indicates that
NFATs are indirectly involved in the regulation of the cell cycle
and other processes, which suggests their broader role in normal
physiological processes. Participation of NFAT in the processes of
tumorigenicity and transformation has been reported (32). In addition, NFAT proteins can
directly regulate the expression of genes related to cellular
proliferation, angiogenesis and tissue invasion mechanisms in
cancers (40,41) (Fig.
7C). Xu et al (42)
demonstrated that NFATc1 is extremely overexpressed in ovarian
tumor tissues compared with normal tissues. Additionally, c-myc was
upregulated to accelerate cell proliferation through activation of
the ERK1/2/p38/MAPK signaling pathway by NFATc1. Recent research
has also found that NFATc1 modulates cell proliferation, migration,
and invasion in SKOV3 cells (43).
Additionally, NFATc1 siRNA can dramatically decrease SKOV3
cell growth (44). Furthermore,
NFATc1 overexpression is linked to a poor prognosis in urothelial
carcinoma (45). NFAT1 also plays a
vital role in aspects of drug-resistant cancers. Murray et
al (46) demonstrated that
NFATc1 is a crucial factor in mediating drug-resistance and
upgrades the tumor response to chemotherapeutic drugs in pancreatic
cancer. Our research results also demonstrated that the mRNA
expression levels of NFATc1 were significantly increased in
cisplatin- and carboplatin-resistant cells compared with those in
sensitive OC cells. Thus, our findings in the present study are
consistent with the mentioned above studies.
Taken together, the results indicate that NFATc1 may
be a drug resistance candidate and that better NFAT inhibitors may
be promising targets for neoadjuvant chemotherapy and
platinum-based chemoresistance in epithelial ovarian carcinoma.
However, more research is needed to further detail the roles of
NFATc1 in chemoresistance.
The nuclear receptor subfamily 4 group A member 3
(NR4A3) gene, also called the oxidored-nitro domain protein
1 (NOR1), is a member of the NR4A family. NR4A subfamily members
are a subfamily of nuclear receptors (NRs).
NRs were identified in metazoans by Mangelsdorf
et al (47) and represent
the largest family of transcription factors. A number of small
lipophilic ligands and cellular signaling pathways, including
vitamins, fatty acids and cholesterol metabolites, can regulate a
large conserved family of ligand-dependent transcription factors
known as NRs (48). There is
increasing evidence that NRs play important roles in a number of
human physiological processes, including cell development,
reproduction, circadian rhythms, and metabolism, and therefore,
they have become primary drug targets for the treatment of cancer,
cardiovascular disease and metabolic syndrome (49–51).
NRs have also been among the most successful targets for drugs
approved to treat many diseases, including cancer (52,53).
The 48 members of the NR superfamily of the human genome are
divided into seven subfamilies (54,55). A
phylogenetic tree can be used to classify the subfamilies based on
their sequences (56). The seven
subfamilies of the 48 NRs are presented in Fig. 7D.
Subfamily 4 consists of neuron-derived orphan
receptor-1 (NR4A3), nerve growth factor 1B (NR4A1) and nurr-related
factor 1 (NR4A2). A previous study reported that compared with the
control myometrium, the expression of NR4A subfamily members was
significantly restrained in leiomyoma (57). In hematopoietic neoplasms,
downregulated NRs, NR4A3 and NR4A1, which are believed to be tumor
suppressors, were found to contribute to the formation of acute
myeloid leukemia (58,59). In contrast, Haller et al
(60) demonstrated that the
overexpression of NR4A3 could stimulate cell proliferation in mouse
salivary gland cancer. NOR1 may act as an antigen in tumor cells,
and altered NOR1 expression can help clarify the function of the
NOR1 protein in liver cancer (61).
These results are consistent with our findings indicating that the
NR4A3 protein is significantly increased in drug-resistant ovarian
cancer. Currently, there are few studies on the NR4A3 gene
and protein in epithelial ovarian tumors. There has been
controversy in previous studies regarding the role of the
NR4A3 gene in promoting cancer or tumor suppression in
different types of tumors. It is speculated that the detection of
altered NOR1 expression before surgery in patients with advanced
EOC could help to identify whether tumor cells are resistant to
platinum-based chemotherapy drugs. However, the exact function of
the NR4A3 gene and protein has yet to be determined with a
sufficient number of validated experimental trials.
KLF4, also known as gut-enriched Krüppel-like factor
or GKLF, belongs to the Krüppel transcription factor family and has
multiple functions, including cell differentiation, embryogenesis
and pluripotency. Shields et al (62) first isolated and identified KLF4
from a NIH3T3 cDNA library. The Human Genome Organization Gene
Nomenclature Committee numbered the members of the Krüppel-like
factor family in the order in which they were discovered. Based on
the structural similarity of their N-terminus, as shown in Fig. 7E, 17 human KLF proteins can be
divided into three major subfamilies. Due to the presence of
recognizable protein-protein interaction motifs, Krüppel-like
factors 5, 15 and 17 are not classified into any other family. The
KLF4 gene is affiliated with the second group of the Krüppel
family of transcription factors. Furthermore, group 2 also includes
Krüppel-like factors 1, 2, 6 and 7, which are characterized by
three zinc fingers in the carboxyl terminus sequences and acidic
activation domains and thus generally act as transcriptional
activators (63). The general
structure of Krüppel-like factor 4 protein is shown in Fig. 7F.
Recent research has found that KLF4-encoded proteins
can induce G1-to-S transition of the cell cycle via the p53
gene after DNA damage (64). As a
tumor suppressor, it has been documented that overexpression of
KLF4 in the human colon cancer cell line RKO can reduce the ability
of tumor cells to migrate and invade (65). By using RT-qPCR technique, we found
that mRNA expression of KLF4 was significantly lower in the
SKOV3-CDDP and HeyA8-CDDP cell lines than that noted in the SKOV3
and HeyA8 cell lines in our research. Furthermore, we also observed
that the migration and invasion ability of drug-resistant OC cell
lines SKOV3-CDDP and HeyA8-CDDP were higher than the SKOV3 and
HeyA8 cell lines. Therefore, the results of our study were in line
with the above previous experiments. In addition, KLF4 has also
been observed to inhibit tumors in lung cancer (66), cervical cancer (67), and pancreatic cancer (68). It is still controversial whether
KLF4 plays a role in carcinogenesis (69) or cancer suppression (70) in breast cancer. Additionally, it is
not fully understood how the KLF4 gene promotes or
suppresses cancer in different tumors. Additionally, KLF4 has a
considerable effect on cancer drug resistance. A recent report
noted that KLF4 expression was dramatically higher in normal
ovarian tissue than in ovarian cancer tissue. However, the efficacy
of chemotherapy drugs in OC cells can be significantly improved by
small molecule inducers. Thus, the attempt to induce KLF4
expression by APTO-253 is a new therapeutic approach to treat OC
and avoid the emergence of chemotherapy resistance (71). Future studies will be conducted to
explore the mechanism of the KLF4 protein in carcinogenesis and
chemotherapy resistance.
Mesenchymal cells typically produce a protein knowns
as hepatocyte growth factor (HGF) that adheres to the hepatocyte
growth factor receptor. This protein regulates cell growth and cell
motility in a variety of cells and tissue types.
The HGF receptor and c-Met are highly expressed in
some OC cell lines and in epithelial cells of ovarian tumors.
Sowter et al (72)
demonstrated that the primary cause of OC cell migration may be
closely related to HGF in ovarian tumor fluid. Considerable
evidence has indicated that HGF/Met is overexpressed in a
consistent fraction of OCs (73,74).
Rasola et al found that 100 ng/ml exogenous HGF enhanced
CDDP- and PTX-induced apoptosis in OC cells via the
caspase-dependent apoptosis pathways, and dose-dependent effects
were observed (75). In a
comparison of microRNA and gene expression of targets in patients
treated with NACT and primary debulking surgery (PDS) followed by
platinum/taxane chemotherapy, Mariani et al (76) reported that HGF and its receptor
c-Met were notably increased in post-NACT patients. Similarly, the
mRNA expression levels of HGF were dramatically increased in
cisplatin- and carboplatin-resistant ovarian cancer cell lines.
Taken together, these studies explain why the HGF/MET axis has
become a candidate target of numerous therapeutic clinical trials
in platinum-based chemotherapy resistance in patients with
NACT.
PDS in combination with chemotherapy often leads to
drug resistance and relapse in advanced OC, and there is a clear
need to pursue the development of novel alternative therapies. In
the present study, we used NACT as a basis to explore the mechanism
underlying drug resistance in combination with sensitive and
resistant ovarian cancer cells and to analyze the induction of
chemoresistance in tumor cell clone chemotherapy. In conclusion,
analysis of the altered expression of NFATc1, NR4A3, KLF3 and HGF
as candidate biomarkers will contribute to the selection of
patients suitable for this modality of treatment. Furthermore,
inhibitors of these targets may improve the therapeutic efficacy of
NACT and avoid platinum-based chemotherapy resistance. However, the
present study had a limitation. More in-depth experimental studies
are necessary to sufficiently confirm the role of these DEGs in
drug resistance mechanism of OC.
Supplementary Material
Supporting Data
Acknowledgements
Not applicable.
Funding
The present study was funded by the Natural Science
Foundation of China (grant nos. 81972448, 81602292, 81802617 and
81602293), the Postgraduate Innovation Fund of the 13th Five-Year
Comprehensive Investment, Tianjin Medical University (grant no.
YJSCX201812) and the Natural Science Foundation of Tianjin (grant
no. 18JCQNJC81200).
Availability of data and materials
The datasets analyzed during the current study are
available in the GEO repository (http://www.ncbi.nlm.nih.gov/geo/).
Authors' contributions
KZ drafted this manuscript. KZ, WW and LC conceived
and designed the study. YL, JH, FG and WT collected the data and
performed the analyses. YW and FX revised the manuscript,
interpreted the data and approved the final version of manuscript.
All authors read and approved the manuscript and agree to be
accountable for all aspects of the research in ensuring that the
accuracy or integrity of any part of the work are appropriately
investigated and resolved.
Ethics approval and consent to
participate
Not applicable.
Patient consent for publication
Not applicable.
Competing interests
The authors declare that they have no competing
interests.
References
|
1
|
Usach I, Blansit K, Chen LM, Ueda S,
Brooks R, Kapp DS and Chan JK: Survival differences in women with
serous tubal, ovarian, peritoneal, and uterine carcinomas. J Obstet
Gynecol. 212:188.e1–e6. 2015. View Article : Google Scholar
|
|
2
|
Kyrgiou M, Salanti G, Pavlidis N,
Paraskevaidis E and Ioannidis JP: Survival benefits with diverse
chemotherapy regimens for ovarian cancer: Meta-analysis of multiple
treatments. J Natl Cancer Inst. 98:1655–1663. 2006. View Article : Google Scholar : PubMed/NCBI
|
|
3
|
Griffiths CT and Fuller AF: Intensive
surgical and chemotherapeutic management of advanced ovarian
cancer. Surg Clin North Am. 58:131–142. 1978. View Article : Google Scholar : PubMed/NCBI
|
|
4
|
Griffiths CT: Surgical resection of tumor
bulk in the primary treatment of ovarian carcinoma. Natl Cancer
Inst Monogr. 42:101–104. 1975.PubMed/NCBI
|
|
5
|
Rauh-Hain JA, Nitschmann CC, Worley MJ,
Bradford LS, Berkowitz RS, Schorge JO, Campos SM, Del CM and
Horowitz NS: Platinum resistance after neoadjuvant chemotherapy
compared to primary surgery in patients with advanced epithelial
ovarian carcinoma. Gynecol Oncol. 129:63–68. 2013. View Article : Google Scholar : PubMed/NCBI
|
|
6
|
Ghasemi N, Ghobadzadeh S, Zahraei M,
Mohammadpour H, Bahrami S, Ganje MB and Rajabi S: HE4 combined with
CA125: Favorable screening tool for ovarian cancer. Med Oncol.
31:8082014. View Article : Google Scholar : PubMed/NCBI
|
|
7
|
Qin L, Huang H, Chen M, Liang Y and Wang
H: Clinical study of a CT evaluation model combined with serum
CA125 in predicting the treatment of newly diagnosed advanced
epithelial ovarian cancer. J Ovarian Res. 11:492018. View Article : Google Scholar : PubMed/NCBI
|
|
8
|
Yang Y, Xiao Z, Liu Z and Lv F: MRI can be
used to differentiate between primary fallopian tube carcinoma and
epithelial ovarian cancer. Clin Radiol. 75:457–465. 2020.
View Article : Google Scholar : PubMed/NCBI
|
|
9
|
Eisenhauer EA, Therasse P, Bogaerts J,
Schwartz LH, Sargent D, Ford R, Dancey J, Arbuck S, Gwyther S,
Mooney M, et al: New response evaluation criteria in solid tumors:
Revised RECIST guideline (version 1.1). Eur J Cancer. 45:228–247.
2009. View Article : Google Scholar : PubMed/NCBI
|
|
10
|
Edgar R, Domrachev M and Lash AE: Gene
Expression Omnibus: NCBI gene expression and hybridization array
data repository. Nucleic Acids Res. 30:207–210. 2002. View Article : Google Scholar : PubMed/NCBI
|
|
11
|
Chapman-Rothe N, Curry E, Zeller C, Liber
D, Stronach E, Gabra H, Ghaem-Maghami S and Brown R: Chromatin
H3K27me3/H3K4me3 histone marks define gene sets in high-grade
serous ovarian cancer that distinguish malignant, tumour-sustaining
and chemo-resistant ovarian tumour cells. Oncogene. 32:4586–4592.
2013. View Article : Google Scholar : PubMed/NCBI
|
|
12
|
Davis S and Meltzer PS: GEOquery: A bridge
between the Gene Expression Omnibus (GEO) and BioConductor.
Bioinformatics. 23:1846–1847. 2007. View Article : Google Scholar : PubMed/NCBI
|
|
13
|
Huang Da W, Sherman BT and Lempicki RA:
Systematic and integrative analysis of large gene lists using DAVID
bioinformatics resources. Nat Protoc. 4:44–57. 2009. View Article : Google Scholar : PubMed/NCBI
|
|
14
|
Szklarczyk D, Franceschini A, Wyder S,
Forslund K, Heller D, Huerta-Cepas J, Simonovic M, Roth A, Santos
A, Tsafou KP, et al: STRING v10: Protein-protein interaction
networks, integrated over the tree of life. Nucleic Acids Res.
43((Database Issue)): D447–D452. 2015. View Article : Google Scholar : PubMed/NCBI
|
|
15
|
Ono K, Demchak B and Ideker T: Cytoscape
tools for the web age: D3.js and Cytoscape.js exporters. F1000Res.
3:1432014. View Article : Google Scholar : PubMed/NCBI
|
|
16
|
Guan R, Wen XY, Wu J, Duan R, Cao H, Lam
S, Hou D, Wang Y, Hu J and Chen Z: Knockdown of ZNF403 inhibits
cell proliferation and induces G2/M arrest by modulating cell-cycle
mediators. Mol Cell Biochem. 365:211–222. 2012. View Article : Google Scholar : PubMed/NCBI
|
|
17
|
Mostafavi S, Ray D, Warde-Farley D,
Grouios C and Morris Q: GeneMANIA: A real-time multiple association
network integration algorithm for predicting gene function. Genome
Biol. 9 (Suppl 1):S42008. View Article : Google Scholar : PubMed/NCBI
|
|
18
|
Yin F, Liu L, Liu X, Li G, Zheng L, Li D,
Wang Q, Zhang W and Li L: Downregulation of tumor suppressor gene
ribonuclease T2 and gametogenetin binding protein 2 is associated
with drug resistance in ovarian cancer. Oncol Rep. 32:362–372.
2014. View Article : Google Scholar : PubMed/NCBI
|
|
19
|
Gao Y, Liu X, Li T, Wei L, Yang A, Lu Y,
Zhang J, Li L, Wang S and Yin F: Cross-validation of genes
potentially associated with overall survival and drug resistance in
ovarian cancer. Oncol Rep. 37:3084–3092. 2017. View Article : Google Scholar : PubMed/NCBI
|
|
20
|
Livak KJ and Schmittgen TD: Analysis of
relative gene expression data using real-time quantitative PCR and
the 2(-Delta Delta C(T)) method. Methods. 25:402–408. 2001.
View Article : Google Scholar : PubMed/NCBI
|
|
21
|
Webb PM and Jordan SJ: Epidemiology of
epithelial ovarian cancer. Best Pract Res Clin Obstet Gynaecol.
41:3–14. 2017. View Article : Google Scholar : PubMed/NCBI
|
|
22
|
Siegel RL, Miller KD and Jemal A: Cancer
statistics, 2019. CA Cancer J Clin. 69:7–34. 2019. View Article : Google Scholar : PubMed/NCBI
|
|
23
|
Hoskins WJ: Epithelial ovarian carcinoma:
Principles of primary surgery. Gynecol Oncol. 55 (Suppl):S91–S96.
1994. View Article : Google Scholar : PubMed/NCBI
|
|
24
|
Cannistra SA: Cancer of the ovary. N Engl
J Med. 351:2519–2529. 2004. View Article : Google Scholar : PubMed/NCBI
|
|
25
|
Thrall MM, Gray HJ, Symons RG, Weiss NS,
Flum DR and Goff BA: Neoadjuvant chemotherapy in the Medicare
cohort with advanced ovarian cancer. Gynecol Oncol. 123:461–466.
2011. View Article : Google Scholar : PubMed/NCBI
|
|
26
|
Chi DS, Musa F, Dao F, Zivanovic O, Sonoda
Y, Leitao MM, Levine DA, Gardner GJ, Abu-Rustum NR and Barakat RR:
An analysis of patients with bulky advanced stage ovarian, tubal,
and peritoneal carcinoma treated with primary debulking surgery
(PDS) during an identical time period as the randomized EORTC-NCIC
trial of PDS vs. neoadjuvant chemotherapy (NACT). Gynecol Oncol.
124:10–14. 2012. View Article : Google Scholar : PubMed/NCBI
|
|
27
|
Kehoe S, Hook J, Nankivell M, Jayson GC,
Kitchener H, Lopes T, Luesley D, Perren T, Bannoo S, Mascarenhas M,
et al: Primary chemotherapy versus primary surgery for newly
diagnosed advanced ovarian cancer (CHORUS): An open-label,
randomised, controlled, non-inferiority trial. Lancet. 386:249–257.
2015. View Article : Google Scholar : PubMed/NCBI
|
|
28
|
Nicklin JL, McGrath S, Tripcony L, Garrett
A, Land R, Tang A, Perrin L, Chetty N, Jagasia N, Crandon AJ, et
al: The shift toward neo-adjuvant chemotherapy and interval
debulking surgery for management of advanced ovarian and related
cancers in a population-based setting: Impact on clinical outcomes.
Aust N Z J Obstet Gynaecol. 57:651–658. 2017. View Article : Google Scholar : PubMed/NCBI
|
|
29
|
Rincon M and Flavell RA: Transcription
mediated by NFAT is highly inducible in effector CD4+ T
helper 2 (Th2) cells but not in Th1 cells. Mol Cell Biol.
17:1522–1534. 1997. View Article : Google Scholar : PubMed/NCBI
|
|
30
|
Shaw JP, Utz PJ, Durand DB, Toole JJ,
Emmel EA and Crabtree GR: Identification of a putative regulator of
early T cell activation genes. Science. 241:202–205. 1988.
View Article : Google Scholar : PubMed/NCBI
|
|
31
|
Chen L, Rao A and Harrison SC: Signal
integration by transcription-factor assemblies: Interactions of
NF-AT1 and AP-1 on the IL-2 promoter. Cold Spring Harb Symp Quant
Biol. 64:527–531. 1999. View Article : Google Scholar : PubMed/NCBI
|
|
32
|
Viola JP, Carvalho LD, Fonseca BP and
Teixeira LK: NFAT transcription factors: From cell cycle to tumor
development. Braz J Med Biol Res. 38:335–344. 2005. View Article : Google Scholar : PubMed/NCBI
|
|
33
|
Macian F, Lopez-Rodriguez C and Rao A:
Partners in transcription: NFAT and AP-1. Oncogene. 20:2476–2489.
2001. View Article : Google Scholar : PubMed/NCBI
|
|
34
|
Lopez-Rodríguez C, Aramburu J, Rakeman AS
and Rao A: NFAT5, a constitutively nuclear NFAT protein that does
not cooperate with Fos and Jun. Proc Natl Acad Sci USA.
96:7214–7219. 1999. View Article : Google Scholar : PubMed/NCBI
|
|
35
|
Lee N, Kim D and Kim WU: Role of NFAT5 in
the immune system and pathogenesis of autoimmune diseases. Front
Immunol. 10:2702019. View Article : Google Scholar : PubMed/NCBI
|
|
36
|
Aramburu J and López-Rodríguez C:
Regulation of Inflammatory Functions of Macrophages and T
Lymphocytes by NFAT5. Front Immunol. 10:5352019. View Article : Google Scholar : PubMed/NCBI
|
|
37
|
Mognol GP, Carneiro FR, Robbs BK, Faget DV
and Viola JP: Cell cycle and apoptosis regulation by NFAT
transcription factors: New roles for an old player. Cell Death Dis.
7:e21992016. View Article : Google Scholar : PubMed/NCBI
|
|
38
|
Lee JU, Kim LK and Choi JM: Revisiting the
concept of targeting NFAT to control T cell immunity and autoimmune
diseases. Front Immunol. 9:27472018. View Article : Google Scholar : PubMed/NCBI
|
|
39
|
Bendickova K, Tidu F and Fric J:
Calcineurin-NFAT signalling in myeloid leucocytes: New prospects
and pitfalls in immunosuppressive therapy. EMBO Mol Med. 9:990–999.
2017. View Article : Google Scholar : PubMed/NCBI
|
|
40
|
Jauliac S, Lopez-Rodriguez C, Shaw LM,
Brown LF, Rao A and Toker A: The role of NFAT transcription factors
in integrin-mediated carcinoma invasion. Nat Cell Biol. 4:540–544.
2002. View
Article : Google Scholar : PubMed/NCBI
|
|
41
|
Kawahara T, Kashiwagi E, Ide H, Li Y,
Zheng Y, Miyamoto Y, Netto GJ, Ishiguro H and Miyamoto H:
Cyclosporine A and tacrolimus inhibit bladder cancer growth through
down-regulation of NFATc1. Oncotarget. 6:1582–1593. 2015.
View Article : Google Scholar : PubMed/NCBI
|
|
42
|
Xu W, Gu J, Ren Q, Shi Y, Xia Q and Wang
J, Wang S, Wang Y and Wang J: NFATC1 promotes cell growth and
tumorigenesis in ovarian cancer up-regulating c-Myc through
ERK1/2/p38 MAPK signal pathway. Tumour Biol. 37:4493–4500. 2016.
View Article : Google Scholar : PubMed/NCBI
|
|
43
|
Li L, Duan Z, Yu J and Dang HX: NFATc1
regulates cell proliferation, migration, and invasion of ovarian
cancer SKOV3 cells in vitro and in vivo. Oncol Rep.
36:918–928. 2016. View Article : Google Scholar : PubMed/NCBI
|
|
44
|
Li L, Yu J, Duan Z and Dang HX: The effect
of NFATc1 on vascular generation and the possible underlying
mechanism in epithelial ovarian carcinoma. Int J Oncol.
48:1457–1466. 2016. View Article : Google Scholar : PubMed/NCBI
|
|
45
|
Kawahara T, Inoue S, Fujita K, Mizushima
T, Ide H, Yamaguchi S, Fushimi H, Nonomura N and Miyamoto H: NFATc1
expression as a prognosticator in urothelial carcinoma of the upper
urinary tract. Transl Oncol. 10:318–323. 2017. View Article : Google Scholar : PubMed/NCBI
|
|
46
|
Murray OT, Wong CC, Vrankova K and Rigas
B: Phospho-sulindac inhibits pancreatic cancer growth: NFATc1 as a
drug resistance candidate. Int J Oncol. 44:521–529. 2014.
View Article : Google Scholar : PubMed/NCBI
|
|
47
|
Mangelsdorf DJ, Thummel C, Beato M,
Herrlich P, Schutz G, Umesono K, Blumberg B, Kastner P, Mark M,
Chambon P and Evans RM: The nuclear receptor superfamily: The
second decade. Cell. 83:835–839. 1995. View Article : Google Scholar : PubMed/NCBI
|
|
48
|
Chawla A, Repa JJ, Evans RM and
Mangelsdorf DJ: Nuclear receptors and lipid physiology: Opening the
X-files. Science. 294:1866–1870. 2001. View Article : Google Scholar : PubMed/NCBI
|
|
49
|
Yang X, Downes M, Yu RT, Bookout AL, He W,
Straume M, Mangelsdorf DJ and Evans RM: Nuclear receptor expression
links the circadian clock to metabolism. Cell. 126:801–810. 2006.
View Article : Google Scholar : PubMed/NCBI
|
|
50
|
Xie CQ, Jeong Y, Fu M, Bookout AL,
Garcia-Barrio MT, Sun T, Kim BH, Xie Y, Root S, Zhang J, et al:
Expression profiling of nuclear receptors in human and mouse
embryonic stem cells. Mol Endocrinol. 23:724–733. 2009. View Article : Google Scholar : PubMed/NCBI
|
|
51
|
Bookout AL, Jeong Y, Downes M, Yu RT,
Evans RM and Mangelsdorf DJ: Anatomical profiling of nuclear
receptor expression reveals a hierarchical transcriptional network.
Cell. 126:789–799. 2006. View Article : Google Scholar : PubMed/NCBI
|
|
52
|
Hegele RA: Retinoid X receptor
heterodimers in the metabolic syndrome. N Engl J Med. 353:20882005.
View Article : Google Scholar : PubMed/NCBI
|
|
53
|
Jeong Y, Xie Y, Xiao G, Behrens C, Girard
L, Wistuba II, Minna JD and Mangelsdorf DJ: Nuclear receptor
expression defines a set of prognostic biomarkers for lung cancer.
PLoS Med. 7:e10003782010. View Article : Google Scholar : PubMed/NCBI
|
|
54
|
McEwan IJ: The nuclear receptor
superfamily at thirty. Methods Mol Biol. 1443:3–9. 2016. View Article : Google Scholar : PubMed/NCBI
|
|
55
|
Weikum ER, Liu X and Ortlund EA: The
nuclear receptor superfamily: A structural perspective. Protein
Sci. 27:1876–1892. 2018. View Article : Google Scholar : PubMed/NCBI
|
|
56
|
Nuclear Receptors Nomenclature Committee,
. A unified nomenclature system for the nuclear receptor
superfamily. Cell. 97:161–163. 1999. View Article : Google Scholar : PubMed/NCBI
|
|
57
|
Yin H, Lo JH, Kim JY, Marsh EE, Kim JJ,
Ghosh AK, Bulun S and Chakravarti D: Expression profiling of
nuclear receptors identifies key roles of NR4A subfamily in uterine
fibroids. Mol Endocrinol. 27:726–740. 2013. View Article : Google Scholar : PubMed/NCBI
|
|
58
|
Mullican SE, Zhang S, Konopleva M, Ruvolo
V, Andreeff M, Milbrandt J and Conneely OM: Abrogation of nuclear
receptors Nr4a3 and Nr4a1 leads to development of acute myeloid
leukemia. Nat Med. 13:730–735. 2007. View
Article : Google Scholar : PubMed/NCBI
|
|
59
|
Wenzl K, Troppan K, Neumeister P and
Deutsch AJ: The nuclear orphan receptor NR4A1 and NR4A3 as tumor
suppressors in hematologic neoplasms. Curr Drug Targets. 16:38–46.
2015. View Article : Google Scholar : PubMed/NCBI
|
|
60
|
Haller F, Bieg M, Will R, Korner C,
Weichenhan D, Bott A, Ishaque N, Lutsik P, Moskalev EA, Mueller SK,
et al: Enhancer hijacking activates oncogenic transcription factor
NR4A3 in acinic cell carcinomas of the salivary glands. Nat Commun.
10:3682019. View Article : Google Scholar : PubMed/NCBI
|
|
61
|
Xiang B, Wang W, Li W, Li X, Li X and Li
G: Differential expression of oxidored nitro domain containing
protein 1 (NOR1), in mouse tissues and in normal and cancerous
human tissues. Gene. 493:18–26. 2012. View Article : Google Scholar : PubMed/NCBI
|
|
62
|
Shields JM, Christy RJ and Yang VW:
Identification and characterization of a gene encoding a
gut-enriched Krüppel-like factor expressed during growth arrest. J
Biol Chem. 271:20009–20017. 1996. View Article : Google Scholar : PubMed/NCBI
|
|
63
|
Dang DT, Pevsner J and Yang VW: The
biology of the mammalian Krüppel-like family of transcription
factors. Int J Biochem Cell Biol. 32:1103–1121. 2000. View Article : Google Scholar : PubMed/NCBI
|
|
64
|
Chen X, Johns DC, Geiman DE, Marban E,
Dang DT, Hamlin G, Sun R and Yang VW: Krüppel-like factor 4
(gut-enriched Krüppel-like factor) inhibits cell proliferation by
blocking G1/S progression of the cell cycle. J Biol Chem.
276:30423–30428. 2001. View Article : Google Scholar : PubMed/NCBI
|
|
65
|
Dang DT, Chen X, Feng J, Torbenson M, Dang
LH and Yang VW: Overexpression of Krüppel-like factor 4 in the
human colon cancer cell line RKO leads to reduced tumorigenecity.
Oncogene. 22:3424–3430. 2003. View Article : Google Scholar : PubMed/NCBI
|
|
66
|
Zhou Y, Hofstetter WL, He Y, Hu W, Pataer
A, Wang L, Wang J, Zhou Y, Yu L, Fang B and Swisher SG: KLF4
inhibition of lung cancer cell invasion by suppression of SPARC
expression. Cancer Biol Ther. 9:507–513. 2010. View Article : Google Scholar : PubMed/NCBI
|
|
67
|
Yang WT and Zheng PS: Krüppel-like factor
4 functions as a tumor suppressor in cervical carcinoma. Cancer.
118:3691–3702. 2012. View Article : Google Scholar : PubMed/NCBI
|
|
68
|
Zammarchi F, Morelli M, Menicagli M, Di
Cristofano C, Zavaglia K, Paolucci A, Campani D, Aretini P, Boggi
U, Mosca F, et al: KLF4 is a novel candidate tumor suppressor gene
in pancreatic ductal carcinoma. Am J Pathol. 178:361–372. 2011.
View Article : Google Scholar : PubMed/NCBI
|
|
69
|
Yu F, Li J, Chen H, Fu J, Ray S, Huang S,
Zheng H and Ai W.: Krüppel-like factor 4 (KLF4) is required for
maintenance of breast cancer stem cells and for cell migration and
invasion. Oncogene. 30:2161–2172. 2011. View Article : Google Scholar : PubMed/NCBI
|
|
70
|
Yori JL, Seachrist DD, Johnson E, Lozada
KL, Abdul-Karim FW, Chodosh LA, Schiemann WP and Keri RA:
Krüppel-like factor 4 inhibits tumorigenic progression and
metastasis in a mouse model of breast cancer. Neoplasia.
13:601–610. 2011. View Article : Google Scholar : PubMed/NCBI
|
|
71
|
Wang B, Shen A, Ouyang X, Zhao G, Du Z,
Huo W, Zhang T, Wang Y, Yang C, Dong P, et al: KLF4 expression
enhances the efficacy of chemotherapy drugs in ovarian cancer
cells. Biochem Biophys Res Commun. 484:486–492. 2017. View Article : Google Scholar : PubMed/NCBI
|
|
72
|
Sowter HM, Corps AN and Smith SK:
Hepatocyte growth factor (HGF) in ovarian epithelial tumour fluids
stimulates the migration of ovarian carcinoma cells. Int J Cancer.
83:476–480. 1999. View Article : Google Scholar : PubMed/NCBI
|
|
73
|
Di Renzo MF, Olivero M, Katsaros D,
Crepaldi T, Gaglia P, Zola P, Sismondi P and Comoglio PM:
Overexpression of the Met/HGF receptor in ovarian cancer. Int J
Cancer. 58:658–662. 1994. View Article : Google Scholar : PubMed/NCBI
|
|
74
|
Li H, Zhang H, Zhao S, Shi Y, Yao J, Zhang
Y, Guo H and Liu X: Overexpression of MACC1 and the association
with hepatocyte growth factor/c-Met in epithelial ovarian cancer.
Oncol Lett. 9:1989–1996. 2015. View Article : Google Scholar : PubMed/NCBI
|
|
75
|
Rasola A, Anguissola S, Ferrero N,
Gramaglia D, Maffe A, Maggiora P, Comoglio PM and Di Renzo MF:
Hepatocyte growth factor sensitizes human ovarian carcinoma cell
lines to paclitaxel and cisplatin. Cancer Res. 64:1744–1750. 2004.
View Article : Google Scholar : PubMed/NCBI
|
|
76
|
Mariani M, McHugh M, Petrillo M, Sieber S,
He S, Andreoli M, Wu Z, Fiedler P, Scambia G, Shahabi S and Ferlini
C: HGF/c-Met axis drives cancer aggressiveness in the neo-adjuvant
setting of ovarian cancer. Oncotarget. 5:4855–4867. 2014.
View Article : Google Scholar : PubMed/NCBI
|