Introduction
Esophageal cancer (EC) is a particularly aggressive
malignancy with a high mortality rate, which is the ninth most
commonly diagnosed type of cancer and the sixth leading cause of
cancer-related mortality worldwide (1). There are two types of EC, namely
esophageal squamous cell carcinoma (ESCC) and esophageal
adenocarcinoma. In China and other East Asian countries, up to 90%
of cases are ESCCs (2). Shantou, in
particular, is a high-risk area for ESCC. Due to the lack of early
signs or symptoms in ESCC, endoscopic screening in the asymptomatic
population is inadequate, and early diagnosis of ESCC is difficult.
In the majority of the cases, at the time of endoscopy, the disease
has already progressed to an advanced stage. Despite numerous
advances over the last several decades, the prognosis of this
disease remains poor, with a 5-year survival rate of <40%
(3,4). Thus, it is urgent to explore the key
protein-signaling networks and relative molecular regulatory
mechanisms of ESCC.
Previous evidence indicates that the process of
epithelial-to-mesenchymal transition (EMT) is a cellular switch
from epithelial to mesenchymal cell properties, which promotes
cancer progression (5,6). EMT often occurs at the early stages of
tumor metastasis, and involves a disassembly of cell-cell junctions
and enhancement of cell motility, accompanied by decreased
expression of classic epithelial markers (E-cadherin and β-catenin)
and increased expression of mesenchymal markers [N-cadherin,
glycogen synthase kinase (GSK)-3β, vimentin and Snail] (7,8).
Recent studies have revealed that lncRNAs play key
roles in the carcinogenesis and development of various types of
cancer. The lncRNA maternally expressed gene 3 (MEG3) is widely
expressed in a variety of normal tissues. MEG3 has been identified
as a tumor suppressor and is expressed at lower levels in diverse
types of cancer (9–13). However, whether MEG3 is involved in
the EMT process of ESCC remains elusive.
The aim of the present study was to determine the
expression levels of MEG3 in ESCC tissues and cells, and analyze
its clinical significance. A recombinant lentiviral vector
expressing MEG3 (Lv-MEG3) was constructed. Microarray technology
and bioinformatics analysis were employed to study the
differentially expressed genes (DEGs) between the two groups. Based
on functional annotation results, the underlying target genes and
the effects of ectopic expression of MEG3 on cell growth,
migration, invasion and EMT were assessed in vitro and in
vivo.
Materials and methods
Patients and human esophageal tissue
specimens
A total of 43 cases of ESCC, which had been
clinically and histologically diagnosed between 2011 and 2016, were
included in the present study. The cohort comprised 25 men and 18
women (median age, 57.41 years; range, 36–75 years). Lymph node
metastasis was detected in 28 cases, and 19 patients were diagnosed
with grade I or II ESCC. None of the patients underwent
radiotherapy or chemotherapy prior to surgery. Tumor masses and
adjacent normal tissues, which were located ≥5.0 cm distal to the
tumor margins, were divided into two parts. One part was
snap-frozen in liquid nitrogen for reverse
transcription-quantitative PCR (RT-qPCR) assay, and the other part
was fixed in formalin and embedded in paraffin for
immunohistochemistry assay. Written informed consent was obtained
from each patient and all the procedures were approved by the
Second Affiliated Hospital Ethics Committee of Shantou University
Medical College (Shantou, China).
Cell culture
ESCC cell lines (EC109, EC-9706 and KYSE-450) and
the normal esophageal epithelial cell line Het-1A were obtained
from the Institute of Biochemistry and Cell Biology of the Chinese
Academy of Sciences. Cells were cultured in DMEM supplemented with
10% (v/v) FBS (Invitrogen; Thermo Fisher Scientific, Inc.), 100
U/ml penicillin and 100 mg/ml streptomycin at 37°C in 5%
CO2.
Plasmid constructs and
lentivirus-mediated MEG3 overexpression in ESCC cells
To construct the MEG3 overexpression lentiviral
vector, the full-length coding sequence of the MEG3 gene (GenBank
ID: NR_002766) was amplified by PCR and then cloned into the
BamHI/EcoRI sites of the
pLenti-EF1a-EGFP-F2A-Puro-CMV-MEG3 vector (Obio Technology) using
the following primers: Forward, 5′-CGCAAATGGGCGGTAGGCGTG-3′ and
reverse, 5′-CATAGCGTAAAAGGAGCAACA-3′. The recombinant eukaryotic
expression vector was constructed and confirmed by DNA sequencing,
enzymatic digestion and PCR identification. For the production of
viral particles, the lentivirus-mediated MEG3 packaging system
containing MEG3 was co-transfected with packaging vectors (pLP1 and
pLP2) and envelope vector (pLP/VSVG) into 293T cells with
OGTR20131002 Transfection Reagent (Obio Technology) according to
the manufacturer's instructions. After the recombinant lentiviral
vector expressing MEG3 (Lv-MEG3) and the negative control (NC)
empty vector (Lv-NC) were constructed, packaging, purification and
titer determination were conducted in 293T cells, as described in
our previous study (14).
Microarray analysis
EC109 cells were transfected with Lv-MEG3 or Lv-NC.
Total RNA was extracted from Lv-MEG3 or Lv-NC cells using
TRIzol® RNA isolation reagent (Invitrogen; Thermo Fisher
Scientific, Inc.) according to the manufacturer's protocol. The
gene expression profiles were performed based on the Affymetrix
PrimeView™ Human Gene Expression Array (Affymetrix; Thermo Fisher
Scientific, Inc.). Gene expression analysis was performed using
GeneSpring software (version 14.8; Agilent Technologies, Inc.), and
the data were shown by volcano plots. Cluster, Gene Ontology (GO)
enrichment and Kyoto Encyclopedia of Genes and Genomes (KEGG)
analyses were conducted using online tools (http://www.shbio.com/customer.php) to determine the
DEGs. P-value and false discovery rate (FDR) were used to define
the threshold of significance, and the figures were generated by R
language. DEGs were identified by paired test [fold-change (FC)
≥2.0 or ≤0.5, P<0.05 and FDR<0.05]. The microarray data were
uploaded in the National Center for Biotechnology Information Gene
Expression Omnibus (GEO) database; GEO accession no., GSE142036
(https://www.ncbi.nlm.nih.Gov/geo/query/acc.cgi?acc=GSE142036).
Construction of a protein-protein
interaction (PPI) network
The Search Tool for the Retrieval of Interacting
Genes/Proteins (STRING; version 10.0; http://string-db.org) was employed to identify the
interaction pairs of the overlapped target genes. The predicted and
acknowledged interactions were unified and scored. Genes with a
connectivity degree of ≥5.0 were considered as hub genes.
Interaction pairs in the PPI network were selected when the
combined score was >0.4.
Fluorescence in situ hybridization
(FISH) and subcellular fractionation analysis
EC109 cells were transfected with Lv-MEG3 or Lv-NC,
and immunofluorescence assays were performed as described
previously (15).
Digoxigenin-labeled MEG3 and FISH Kit (Exon Lab) were used
following the manufacturer's instructions. MEG3 was visualized
using HRP anti-digoxigenin-antibody (1:50; cat. no. ab6212; Abcam)
at room temperature for 1 h, and tyramide signal amplification-FITC
technology was used. EC109 cells were co-stained with DAPI and
finally observed under a fluorescence microscope at a magnification
of ×1,000 (Nikon80i; Nikon Corporation). RNA was isolated as
nuclear and cytoplasmic fractions in EC109 cells using the RNA
Subcellular Isolation Kit (Norgen Biotek Corp.) according to the
manufacturer's guidelines. Cytoplasmic and nuclear fractions were
analyzed by RT-qPCR.
Cell proliferation assay
Cell proliferation was analyzed with the Cell
Counting Kit-8 (CCK-8) assay (Beyotime Institute of Biotechnology)
according to the manufacturer's protocol. A total of 4,000 cells
were seeded in triplicate in 96-well plates and transfected with
Lv-MEG3 or Lv-NC plasmids for the indicated times. Cell viability
was assessed by measuring the absorbance at 450 nm using the
FilterMax F5 microplate reader (Molecular Devices, LLC).
Cell cycle analysis
After transfection for 48 h, EC109 cells
(1×10⁵ cells/ml) were harvested, washed with ice-cold
PBS and fixed with 70% ethanol at 4°C overnight. After fixation,
the cells were washed, resuspended in PBS, incubated with
ribonuclease at 37°C for 30 min and stained with propidium iodide
(Nanjing KeyGen Biotech Co., Ltd.) in the dark at 4°C for 30 min.
Then, the cell cycle distribution was analyzed with a flow
cytometer (BD Biosciences).
RT-qPCR analysis
Total RNA was extracted from freshly frozen ESCC
tissues or transfected cells according to the instructions of the
TRIzol® kit (Invitrogen; Thermo Fisher Scientific,
Inc.). Subsequently, RT-qPCR was performed with a Step-One Plus
Real-Time PCR System (Applied Biosystems; Thermo Fisher Scientific,
Inc.) using the SYBR Green PCR Master Mix (Promega Corporation).
The thermal cycling conditions were as follows: 95°C for 10 min,
95°C for 15 sec, and 58°C for 30 sec for 40 cycles. GAPDH was
employed as an endogenous control. All the primer sequences used in
this study are listed in the Table
I. The relative expression level of mRNAs was calculated by the
2−∆∆Cq method as described in our previous study
(16).
 | Table I.Primer sequences for reverse
transcription-quantitative PCR analysis. |
Table I.
Primer sequences for reverse
transcription-quantitative PCR analysis.
| Gene | Primer sequence
(5′-3′) |
|---|
| MEG3 | Forward,
TGGGTCGGCTGAAGAACTG |
|
| Reverse,
CCAAACCAGGAAGGAGACGA |
| PSAT1 | Forward,
CTCAGGCAGGATCTGGCATA |
|
| Reverse,
CCTGGAGTGCTGTTGGAGAA |
| VEGFA | Forward,
CCTTCGCTTACTCTCACCTGCTTC |
|
| Reverse,
GGCTGCTTCTTCCAACAATGTGTC |
| U6 | Forward,
CTCGCTTCGGCAGCACATA |
|
| Reverse,
AACGATTCACGAATTTGCGT |
| GAPDH | Forward,
CACCATCTTCCAGGAGCGA |
|
| Reverse,
TCAGCAGAGGGGGCAGAGA |
Cell invasion assay
After transfection for 48 h, EC109 cells were seeded
in a 6-well plate for 48 h and resuspended in serum-free DMEM at a
cell density of 3×10⁵ cells/ml. Then, 200 µl cell
suspension was added to the apical chamber, while 500 µl DMEM
containing 10% FBS was added to the basolateral chamber, and
incubated at 37°C in the presence of 5% CO2. After 24 h,
the invading cells were fixed at 4°C with methanol for 10 min,
washed with PBS 3 times and stained at room temperature with 0.1%
crystal violet solution for 10 min. A neutral resin was applied to
seal the cells in the apical chamber, and 6 randomly selected
fields were observed with an inverted microscope (Axiovert 40 CFL,
Carl Zeiss AG) microscope at a magnification of ×100.
Wound healing assay
After transfection with Lv-MEG3 or Lv-NC for 48 h,
EC109 cells (1×10⁶ cells/ml) were added to a 6-well
plate and incubated for 24 h. After the cells had reached 90–100%
confluence, a sterile 1-ml pipette tip was used to create a linear
scratch in the cell monolayer. After culturing with FBS-free medium
at 37°C for different durations, the cells that migrated to the
wounded area were visualized and images were captured with an
Axiovert 40 CFL fluorescence microscope (Carl Zeiss AG) at 0, 24,
36 and 48 h. The rate of wound closure was measured using ImageJ
software (version 1.46; National Institutes of Health).
Protein extraction and western
blotting
EC109 cells transfected with Lv-MEG3 or Lv-NC were
harvested at 48 h and washed with ice-cold PBS 3 times. The cell
lysates were prepared with RIPA buffer (Beyotime Institute of
Biotechnology) containing PMSF. Equal quantities of proteins (50
µg) were separated by 10% SDS-PAGE and transferred to PVDF
membranes. After being blocked with 5% non-fat milk for 60 min at
room temperature, the membranes were incubated with specific
primary antibodies against PSAT1 (1:1,000; cat. no. GTX82102;
GeneTex, Inc.), cyclin D1 (CCND1; 1:1,000; cat. no. sc-8396; Santa
Cruz Biotechnology, Inc.), phosphorylated (p)-GSK-3β (1:500; cat.
no. ab75745; Abcam), GSK-3β (1:500; cat. no. ab32391; Abcam),
E-cadherin (1:1,000; cat. no. sc-21791; Santa Cruz Biotechnology,
Inc.), Snail (1:1,000; cat. no. sc-271977; Santa Cruz
Biotechnology, Inc.), vascular endothelial growth factor (VEGF)A
(1:1,000; cat. no. Ag13500; ProteinTech Group, Inc.), vimentin
(1:5,000; cat. no. GTX100619; GeneTex, Inc.), β-actin (1:500; cat.
no. ab8226; Abcam) or GAPDH (1:5,000; cat. no. sc-166574; Santa
Cruz Biotechnology, Inc.) as an internal control in TBS-0.5%
Tween-20 (TBST) at 4°C overnight. On the following day, the
membranes were washed with TBST 3 times and incubated by
anti-rabbit horseradish peroxidase-conjugated secondary antibody
(1:10,000; cat. no. sc-2004; Santa Cruz Biotechnology, Inc.) at
room temperature in the dark for 60 min. The expression of proteins
was measured with the Odyssey Detection System (LI-COR Biosciences)
and analyzed using ImageJ software, version 1.46r (National
Institutes of Health).
In vivo tumorigenesis assay
The animal protocols in the present study were
approved by the Ethics Committee of Shantou University Medical
College. A total of 19 male BALB/c nude mice (class SPF, purchased
from Beijing Animal Center), aged 6-weeks and weighing 18–24 g,
were subcutaneously injected in the right flank with
8×10⁶ EC109 cells transfected with Lv-MEG3 (experimental
group) or Lv-NC (control group) in 0.1 ml PBS. Tumor volume (V) was
measured with calipers and calculated with the formula
V=0.52×LxW2 (where L and W are the long and short axes
of the tumor, respectively). After 3–4 weeks, the mice were
anesthetized by inhalation of 5% isoflurane and sacrificed by
cervical dislocation. Death was confirmed based cessation of
convulsions and sustained absence of breathing. The tumors were
excised and weighed. The target molecules in the tumor tissues were
detected by western blotting.
Immunohistochemical analysis
Formalin-fixed tissues were embedded in paraffin and
4-µm sections were cut from each paraffin block. The paraffin
sections were dewaxed in xylene twice for 15 min each and
rehydrated through a graded series of alcohol solutions (5 min per
step). The slides were then stained with the primary antibody
(rabbit anti-PSAT1 antibody; dilution, 1:100; cat. no. sc-133929;
Santa Cruz Biotechnology, Inc.) at 4°C overnight. The sections were
then washed in PBS and incubated at room temperature for 20 min
with biotinylated secondary antibody, followed by incubation at
room temperature for 10 min with streptavidin-peroxidase complex
(Histostain-Plus Kit, Invitrogen; Thermo Fisher Scientific, Inc.).
The chromogen 3,3′-diaminobenzidine was then added, and the
sections were subsequently counterstained for 2 min at room
temperature with Mayer's hematoxylin. Negative control sections
were treated as described above, but the primary antibody was
omitted. Two pathologists blinded to the clinical information
independently assessed the immunohistochemistry results. In total,
5 visual fields were randomly selected in each section, and 200
tumor cells were counted in each visual field at ×200
magnification. According to the percentage of positive cells marked
by yellow particles observed in tissues, the PSAT1 staining index
(SI) was scored according to staining intensity (0, negative; 1,
weak, light yellow; 2, moderate, yellow brown; and 3, strong,
brown) multiplied by a distribution score (1, <10%; 2, 10–50%;
and 3, >50% cells stained). An SI score ≥3 was defined as a high
expression level of PSAT1, while SI scores 0–2 were considered to
reflect a low expression level of PSAT1.
Statistical analysis
Statistical analyses were performed using SPSS
software (version 22.0; IBM Corp.). All experiments in the present
study were repeated ≥3 times, and the data are presented as the
mean ± SD. Differences in mean values between groups were assessed
for statistical significance using the Student's t-test. Welch's
ANOVA test and Games-Howell post hoc test were applied to compare
MEG3 expression among different cell lines. Pearson's correlation
coefficient analysis was applied to calculate the correlation
between the expression of MEG3 and PSAT1 in ESCC tissues. Survival
curves were plotted using the Kaplan-Meier method and were analyzed
using the log-rank test. P<0.05 was considered to indicate
statistically significant differences.
Results
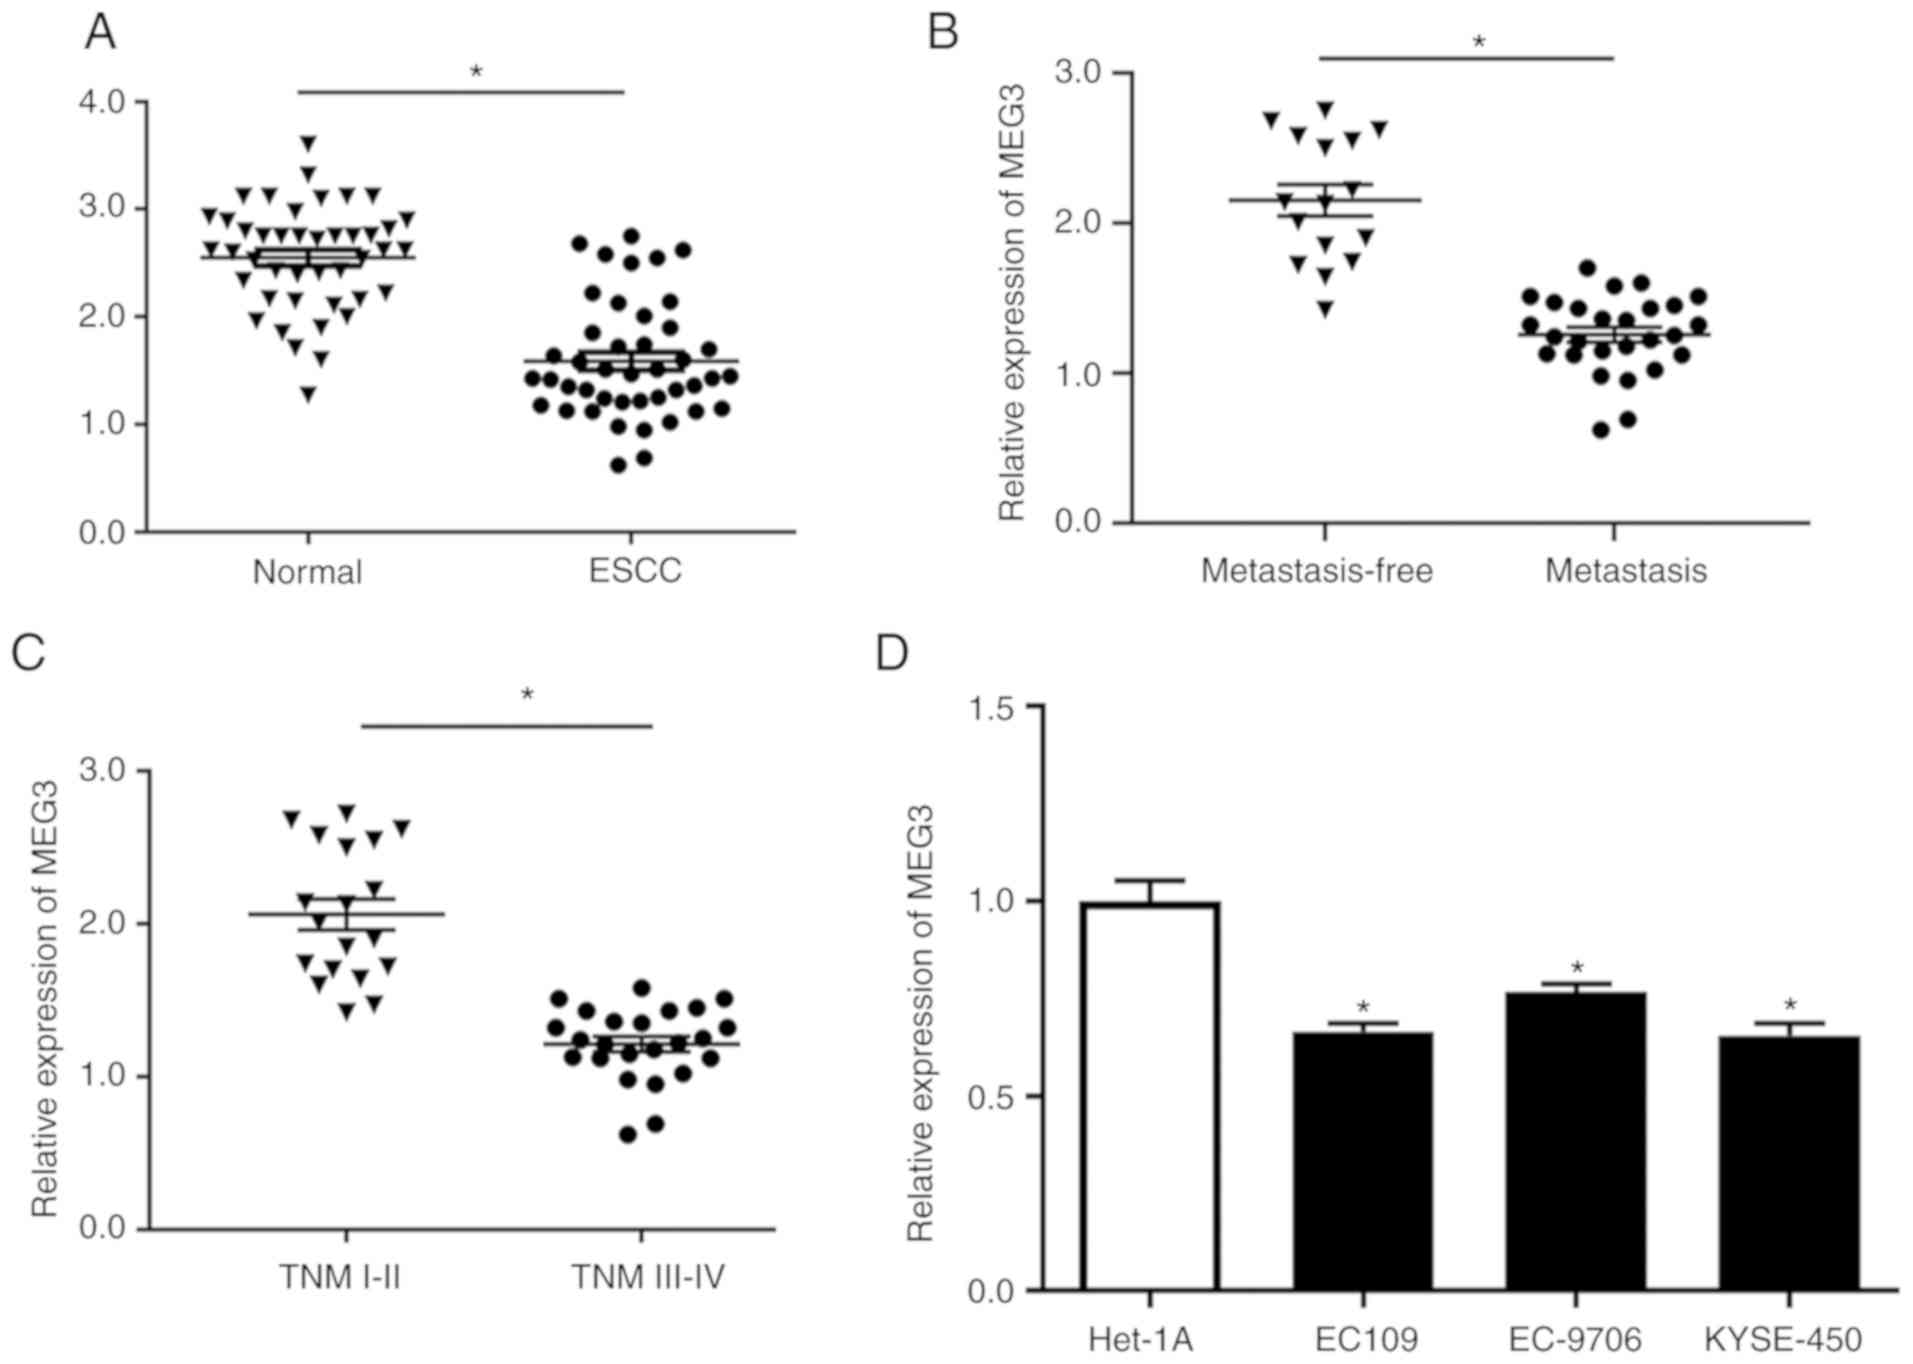
MEG3 expression is downregulated in
ESCC tissues/cells and is associated with poor prognosis
The levels of MEG3 were evaluated in 43 pairs of
ESCC tissues and corresponding adjacent normal tissues. The results
indicated that MEG3 was significantly downregulated in ESCC tissues
compared with its expression in normal controls (Fig. 1A). The expression level of MEG3 was
significantly reduced in tumor tissues, as described in our
previous study (17). In addition,
the association between MEG3 expression and lymph node metastasis
in ESCC was investigated. As shown in Fig. 1B, the expression of MEG3 was
significantly decreased in ESCC patients with lymph node metastasis
compared with that in ESCC patients without lymph node metastasis.
Moreover, the expression level of MEG3 was significantly reduced in
aggressive ESCC (TNM stage III–IV; Fig.
1C), suggesting that the downregulation of MEG3 is associated
with the development of ESCC. Additionally, the level of MEG3 in
ESCC cell lines (EC109, EC-9706 and KYSE-450) was significantly
lower compared with that in Het-1A cells (Fig. 1D). Among the three ESCC cell lines
evaluated, EC109 exhibited the lowest expression of MEG3; thus,
this cell line was used for subsequent experiments. Taken together,
these findings suggest that MEG3 may play a role as a tumor
suppressor gene in the development of ESCC.
Lentivirus-mediated MEG3 stable
expression in EC109 cells
To further explore the biological relevance of MEG3
in EC109 cells, the cultured EC109 cells were infected with either
Lv-MEG3 or Lv-NC, and then puromycin was employed for selection and
enrichment of lentivirus-infected cells (Fig. 2A). The mRNA expression of MEG3 was
significantly increased in the Lv-MEG3 group compared with that in
the Lv-NC group (Fig. 2B),
indicating that Lv-MEG3 was transfected into cells successfully,
and a high mRNA expression level of MEG3 was observed in EC109
cells. FISH assay revealed that MEG3 was mainly distributed in the
nucleus, and a small portion was distributed in the cytoplasm
(Fig. 2C). The results of MEG3
subcellular localization were further confirmed by cytoplasmic and
nuclear RNA fractionation analysis in EC109 cells (Fig. 2D).
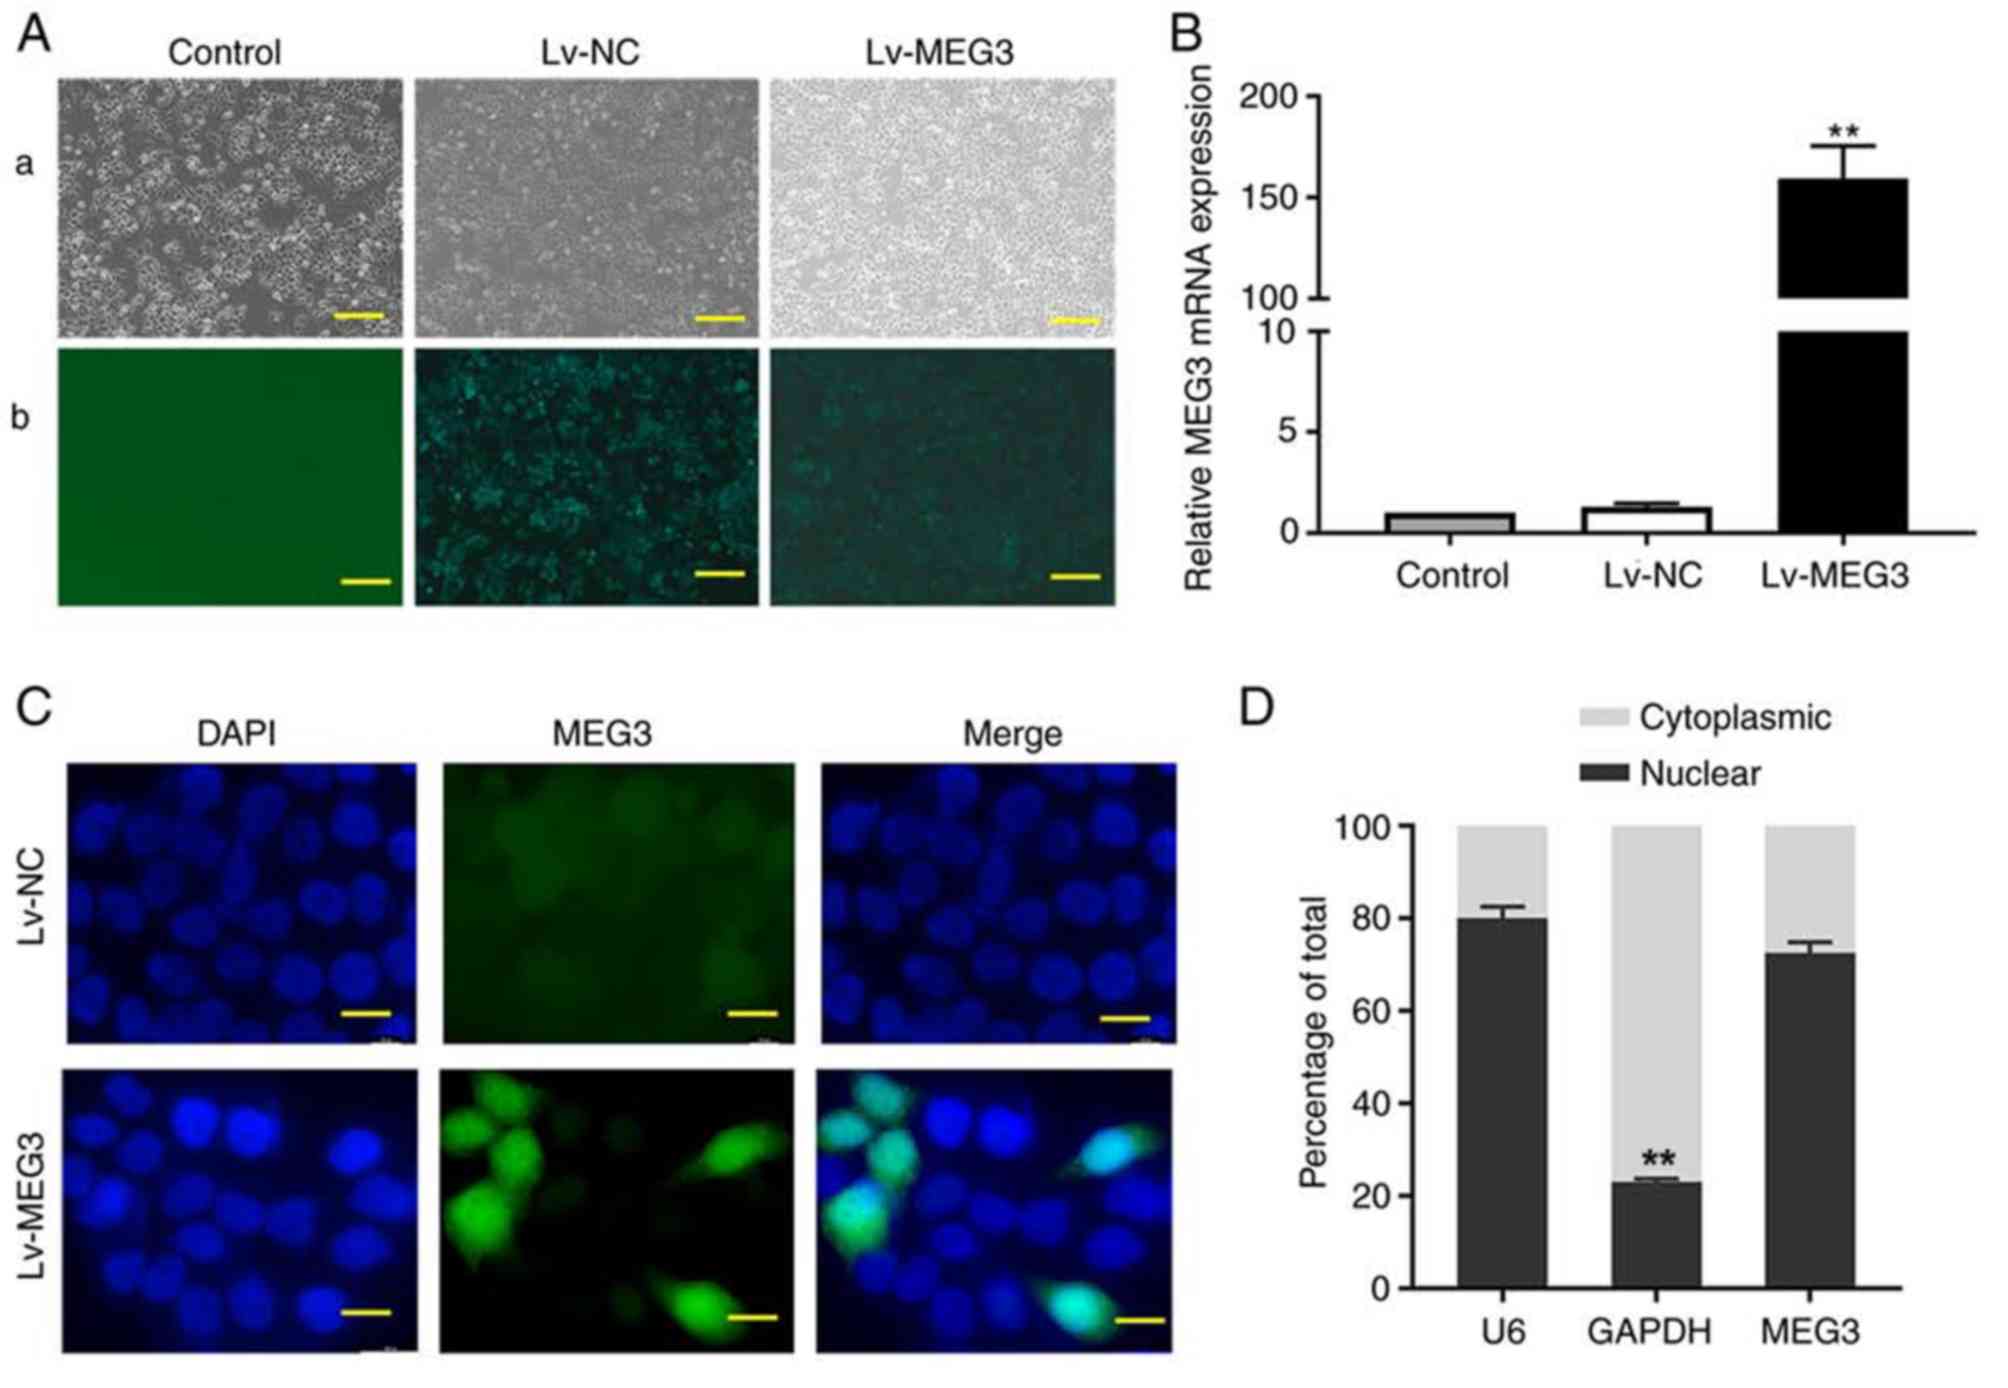 | Figure 2.Ectopic expression of MEG3 and its
subcellular location in EC109 cells. (A) Representative images of
EC109 cells transfected with Lv-MEG3 or Lv-NC (magnification, ×100;
scale bar, 100 µm): (a) Bright image; (b) fluorescence image. (B)
The ectopic expression of MEG3 in the Lv-MEG3 group was
significantly higher compared with that in the control or Lv-NC
groups by RT-qPCR assay. (C) Fluorescence in situ
hybridization assay was performed to detect the distribution of
MEG3 in EC109 cells (magnification, ×1,000; scale bar, 10 µm).
EC109 cells were co-stained with MEG3 anti-digoxin-HRP antibody
(green) and DAPI (nucleus, blue). (D) Nuclear and cytoplasmic
fractions of MEG3 in EC109 cells were evaluated by RT-qPCR with U6
or GAPDH as a nuclear or cytoplasmic internal control
(**P<0.01). MEG3, maternally expressed gene 3; RT-qPCR, reverse
transcription-quantitative PCR; NC, negative control; Lv,
lentiviral vector. |
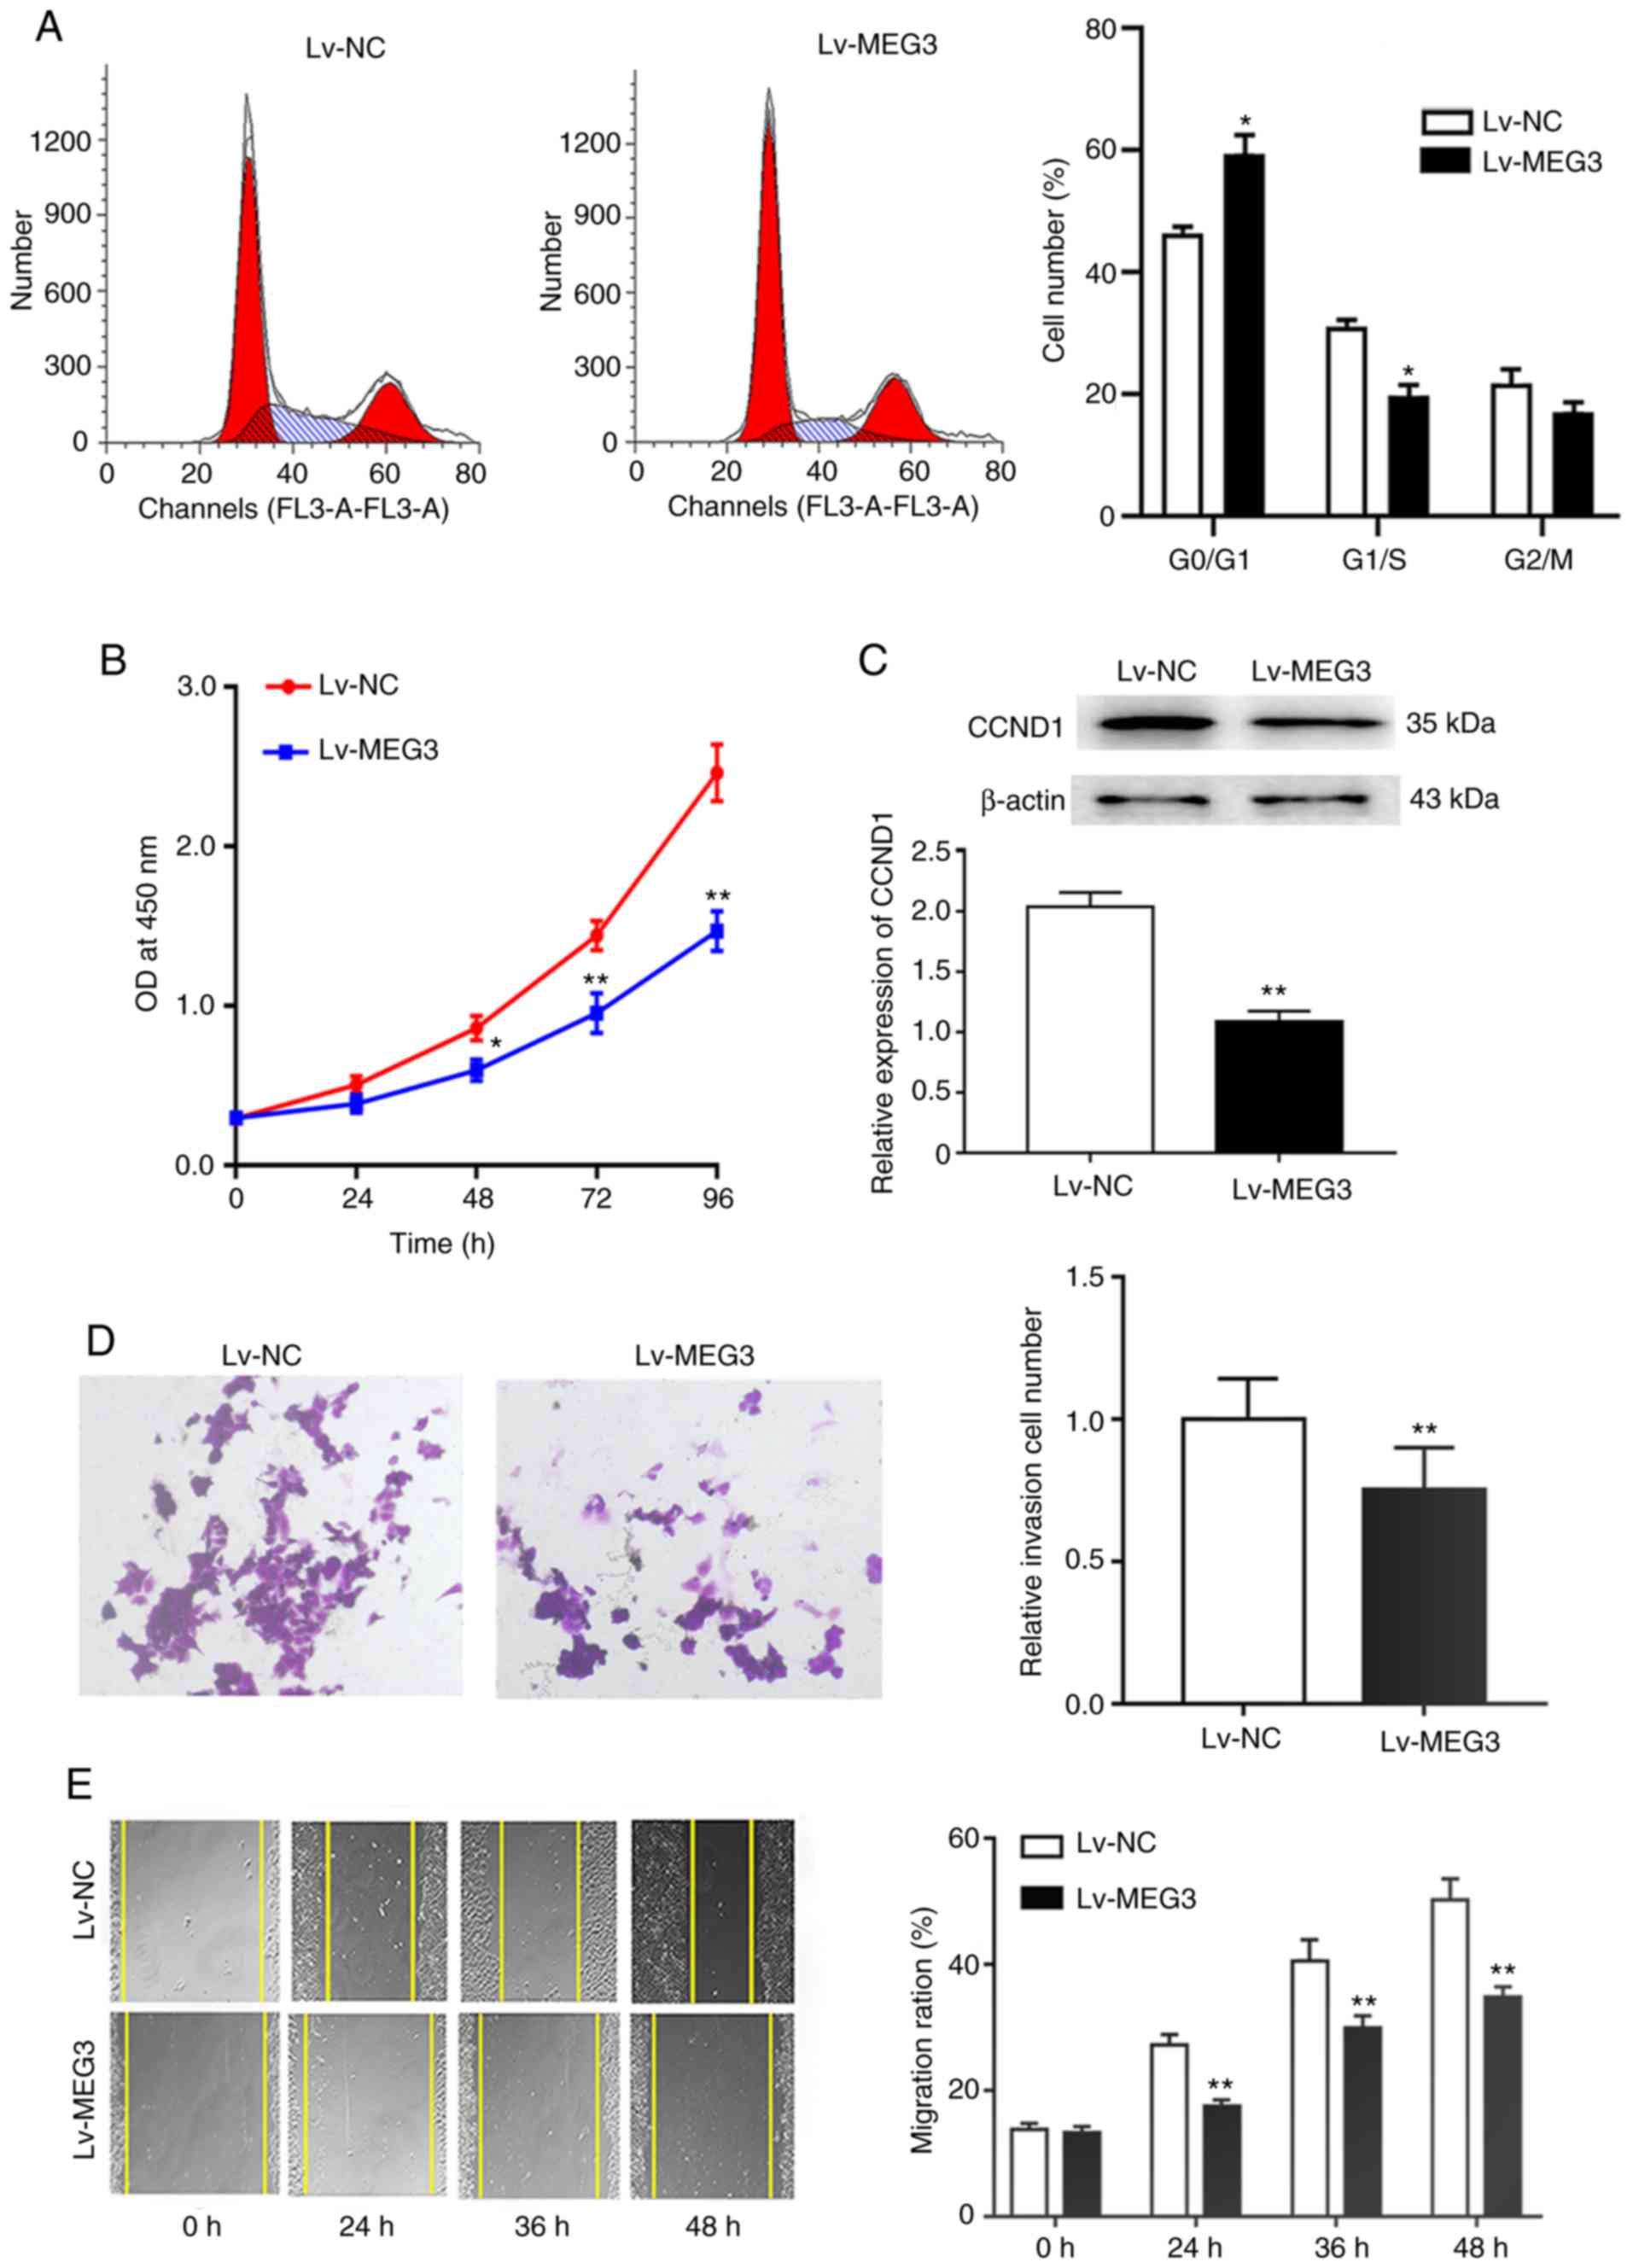
Ectopic expression of MEG3 suppresses
proliferation, migration and invasion in EC109 cells
To further elucidate the role of MEG3 in ESCC cell
proliferation and cell cycle progression, Lv-MEG3 was stably
transfected into EC109 cells. The results of the CCK-8 assay
indicated that the ectopic expression of MEG3 obviously inhibited
the proliferation of EC109 cells at 48, 72 and 96 h (Fig. 3B). Consistently with these results,
cell cycle analysis demonstrated that the ectopic expression of
MEG3 increased the proportion of cells in the G1 phase and
decreased the proportion of cells in the S phase of the cell cycle
(P<0.05; Fig. 3A). Furthermore,
western blotting confirmed that CCND1, a key regulator of G1-to-S
phase progression, was significantly decreased in the Lv-MEG3 group
(Fig. 3C), which suggested that the
ectopic expression of MEG3 inhibited cell proliferation likely
through induction of G1 arrest by inhibiting CCND1. Moreover,
Transwell migration and wound healing assays revealed that the
ectopic expression of MEG3 markedly inhibited cell invasion and
migration (Fig. 3D and E). These
findings demonstrated that MEG3 suppressed the proliferation and
motility of EC109 cells.
Identification of DEGs after
overexpression of MEG3
DEGs in EC109 cells were identified after MEG3 was
overexpressed through transfection with Lv-MEG3. In total, 177
genes (23 upregulated and 154 downregulated) were found to be
differentially expressed in a microarray conducted for 3 pairs of
EC109 cells treated with Lv-MEG3 or Lv-NC (the threshold was set as
FC >2.0 or <0.5). The 23 upregulated and the top 30
downregulated genes are listed in Table II. Scatter and volcano plots were
used to assess gene expression variations between the Lv-MEG3 and
Lv-NC groups (Fig. S1A and B). The
relative expression levels of mRNAs among the matched samples were
determined by hierarchical cluster analysis (Fig. S1C).
| Table II.All upregulated and top 30
downregulated genes in EC109 cells treated with Lv-NC and
Lv-MEG3. |
Table II.
All upregulated and top 30
downregulated genes in EC109 cells treated with Lv-NC and
Lv-MEG3.
| A, Upregulated
genes |
|---|
|
|---|
| Gene symbol | Fold-change |
|---|
| CPA4 | 4.385887 |
| PI3 | 3.580093 |
| FABP5 | 3.568358 |
| DKK1 | 3.321403 |
| TFPI2 | 3.189393 |
| IFIT1 | 3.157332 |
| UBASH3B | 2.757315 |
| ABCG2 | 2.652196 |
| C11orf86 | 2.631208 |
| PRSS23 | 2.463662 |
| EHF | 2.462474 |
| STXBP6 | 2.364241 |
| NRXN3 | 2.362532 |
| PLK2 | 2.298191 |
| WDR4 | 2.250309 |
| RPS26 | 2.215377 |
| TNFRSF21 | 2.16497 |
| HSPA8 | 2.148415 |
| DDX6 | 2.095377 |
| PGBD3 | 2.058019 |
| DNAJA1 | 2.032604 |
| AKR1C1 | 2.032215 |
| FAM98A | 2.01734 |
|
| B, Downregulated
genes |
|
| Gene
symbol |
Fold-change |
|
| INHBE | 0.072167 |
| ASNS | 0.144524 |
| NUPR1 | 0.14478 |
| DDIT3 | 0.168082 |
| ECM2 | 0.191233 |
| PCK2 | 0.192793 |
| CARS | 0.198939 |
| TRIB3 | 0.208346 |
| SV2B | 0.25678 |
| CLGN | 0.303193 |
| AK7 | 0.320877 |
| PHGDH | 0.33101 |
| GDPD1 | 0.331847 |
| CEBPG | 0.332314 |
| PXK | 0.348479 |
| PRUNE2 | 0.36287 |
| ARG2 | 0.368233 |
| ATF4 | 0.372629 |
| GARS | 0.3881 |
| PRG4 | 0.39037 |
| MARS | 0.393337 |
| PSAT1 | 0.403129 |
| GPT2 | 0.409617 |
| AARS | 0.410432 |
| TUBE1 | 0.41201 |
| DBNDD2 | 0.42243 |
| SARS | 0.42896 |
| VEGFA | 0.446095 |
| TSPAN19 | 0.461047 |
| TRIM2 | 0.461611 |
GO, KEGG pathway and PPI network
analysis
Recent findings have identified numerous candidate
oncogenes and tumor suppressor genes functioning in the one-carbon
metabolism pathway. However, the expression levels of these
molecules in ESCC remain unclear. To illustrate the functions of
MEG3 in EC109 cells, Cytoscape 3.6 software was used to extract
DEGs between the Lv-MEG3 and Lv-NC groups, and the STRING database
was utilized to provide PPI information (18).
GO enrichment analysis demonstrated that these genes
were significantly enriched in terms of serine family amino acid
biosynthetic process, cellular response to glucose starvation and
neutral amino acid transmembrane transporter activity (Fig. S2 and Table III). The most significant terms of
the KEGG pathway included amino acid biosynthesis, aminoacyl-tRNA
biosynthesis, serine and threonine metabolism, vitamin B6
metabolism, aspartate and glutamate metabolism and
mitogen-activated protein kinase (MAPK) signaling pathway (Fig. S2; Table IV). The PPI network suggested that
PSAT1, PHGDH, ASNS, ASRS, MARS, ATF4 and VEGFA were significant
genes, and they were considered as hub genes (Fig. S3).
| Table III.Top 10 enrichment GO terms (BP, CC
and MF) for the target genes of mRNAs. |
Table III.
Top 10 enrichment GO terms (BP, CC
and MF) for the target genes of mRNAs.
| GO ID | Term | Ontology | Count | Enrichment
factor | P-value |
|---|
| GO:0009070 | Serine family amino
acid biosynthetic process | BP | 4 | 29.73 | 1.47E-06 |
| GO:0042149 | Cellular response
to glucose starvation | BP | 4 | 16.4 | 1.84E-05 |
| GO:0009069 | Serine family amino
acid metabolic process | BP | 4 | 14.86 | 2.82E-05 |
| GO:0006418 | tRNA aminoacylation
for protein translation | BP | 5 | 12.39 | 1.23E-05 |
| GO:0043039 | tRNA
aminoacylation | BP | 5 | 11.66 | 1.7E-05 |
| GO:0043620 | Regulation of
DNA-templated transcription in response | BP | 5 | 11.22 | 2.08E-05 |
|
| to stress |
|
|
|
|
| GO:0086001 | Cardiac muscle cell
action potential | BP | 4 | 11.06 | 0.000103 |
| GO:0046626 | Regulation of
insulin receptor signaling pathway | BP | 4 | 10.81 | 0.000113 |
| GO:0043618 | Regulation of
transcription from RNA polymerase II | BP | 4 | 10.12 | 0.000151 |
|
| promoter in
response to stress |
|
|
|
|
| GO:0030968 | Endoplasmic
reticulum unfolded protein response | BP | 9 | 9.31 | 2.42E-07 |
| GO:0005829 | Cytosol | CC | 38 | 1.41 | 0.00357 |
| GO:0015175 | Neutral amino acid
transmembrane transporter activity | MF | 4 | 14.86 | 2.82E-05 |
| GO:0030170 | Pyridoxal phosphate
binding | MF | 4 | 9.15 | 0.000236 |
| GO:0015179 | L-amino acid
transmembrane transporter activity | MF | 4 | 8.97 | 0.000256 |
| GO:0015171 | Amino acid
transmembrane transporter activity | MF | 4 | 5.73 | 0.001781 |
| GO:0008083 | Growth factor
activity | MF | 5 | 3.69 | 0.005921 |
| GO:0046943 | Carboxylic acid
transmembrane transporter activity | MF | 4 | 3.63 | 0.0118 |
| GO:0000982 | RNA polymerase II
core promoter proximal region | MF | 9 | 3.3 | 0.001183 |
|
| sequence-specific
DNA binding transcription factor |
|
|
|
|
|
| activity |
|
|
|
|
| GO:0008236 | Serine-type
peptidase activity | MF | 5 | 3.23 | 0.01106 |
| GO:0017171 | Serine hydrolase
activity | MF | 5 | 3.2 | 0.01163 |
| GO:0001077 | RNA polymerase II
core promoter proximal region sequence-specific DNA binding
transcription factor activity involved in positive regulation of
transcription | MF | 6 | 3.17 | 0.007246 |
| Table IV.KEGG pathway enrichment analysis in
DEGs. |
Table IV.
KEGG pathway enrichment analysis in
DEGs.
| Pathway name | P-value | Genes | FDR |
|---|
| Biosynthesis of
amino acids | 0.0010 | CTH, ARG2, PHGDH,
PSAT1, GPT2, CBS | 1.24121 |
| Biosynthesis of
antibiotics | 0.0016 | CTH, ARG2, GFPT1,
PHGDH, GGPS1, PSAT1, PCK2, AK7, CBS | 1.96588 |
| Aminoacyl-tRNA
biosynthesis | 0.0050 | CARS, SARS, AARS,
GARS, MARS | 5.84549 |
| Glycine, serine and
threonine metabolism | 0.0078 | CTH, PHGDH, PSAT1,
CBS | 8.98694 |
| MAPK signaling
pathway | 0.0518 | ATF4, FGF12,
CACNA1D, GADD45A, MAP2K6, DDIT3, HSPA8 | 46.9549 |
| Alanine, aspartate
and glutamate metabolism | 0.0523 | GFPT1, ASNS,
GPT2 | 47.3064 |
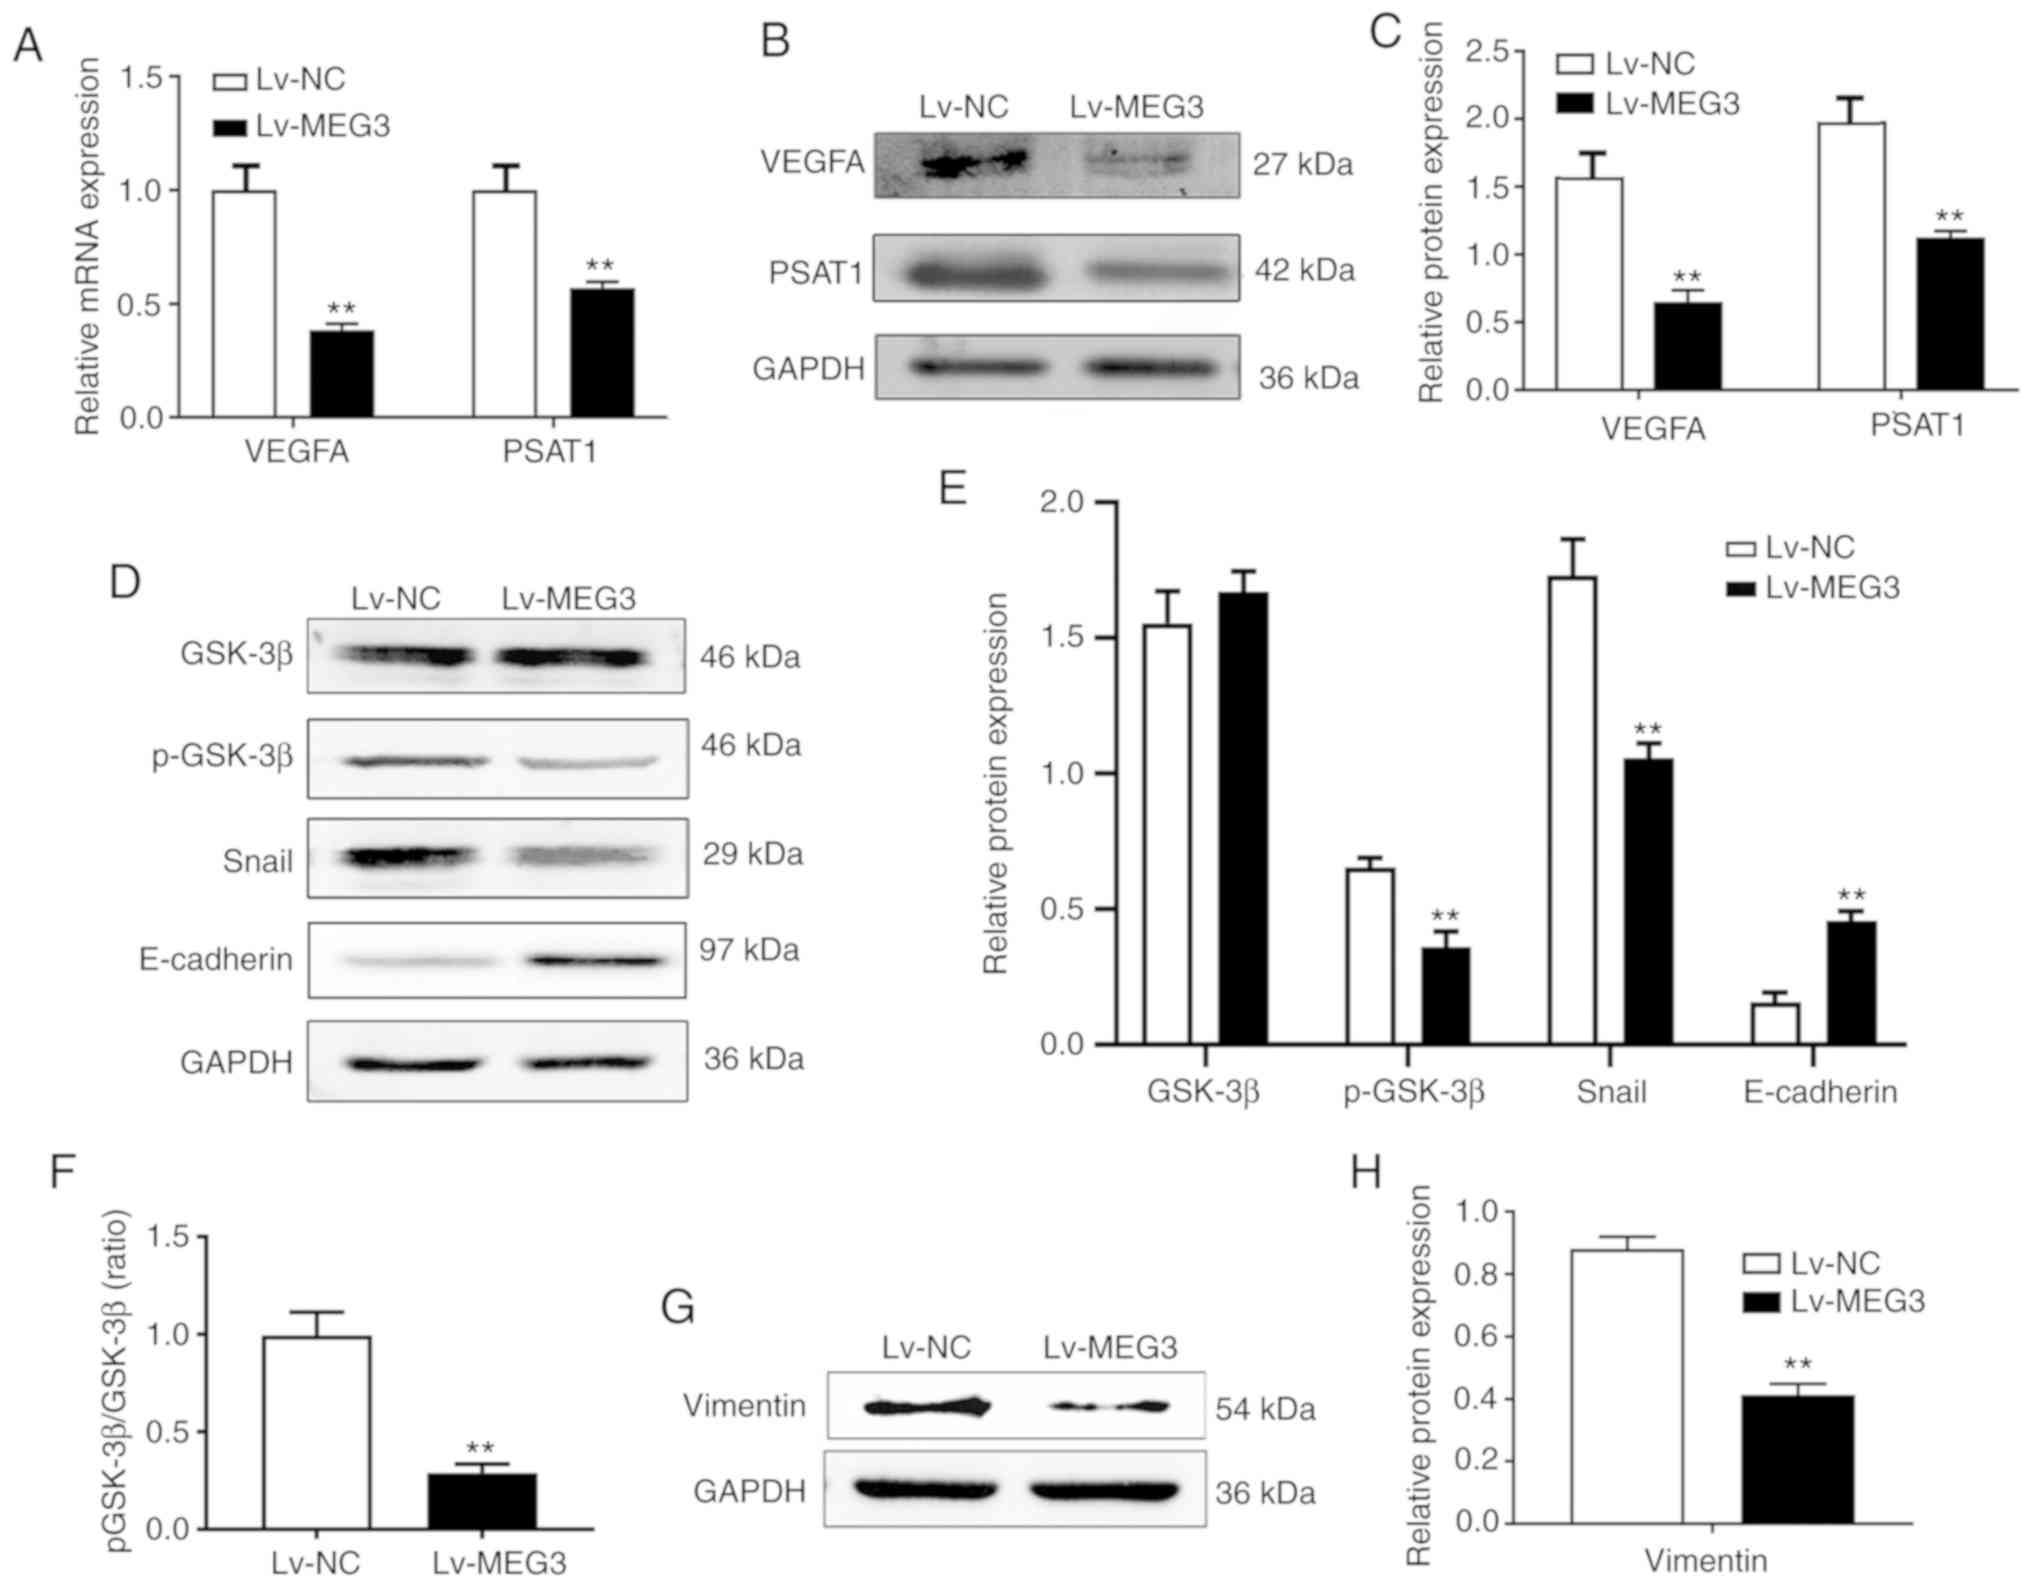
Validation of DEGs by RT-qPCR analysis
and western blotting
Among these hub genes, PSAT1 was considered to be an
important regulator of the serine family amino acid biosynthetic
process, which contributed to the invasion and migration of ESCC
cells (19,20). VEGFA was associated with tumor
angiogenesis (21). Hence, these
two genes were selected for verification of DEGs. As shown in
Fig. 4A-C, RT-qPCR and western blot
assays revealed that the ectopic expression of MEG3 significantly
downregulated the mRNA and protein expression of PSAT1 and VEGFA in
EC109 cells, which was consistent with the results of microarray
analysis (FC >2.0 or <0.5; P<0.05; Table II).
MEG3 inhibits the PSAT1-dependent
GSK-3β/Snail signaling pathway
Accumulating evidence has demonstrated that the
phenotypic changes of increased motility and invasiveness of cancer
cells are associated with EMT. The GSK-3β/Snail signaling pathway
plays an important role in the EMT process. GSK-3β has been
reported to regulate Snail activity, and Snail triggers the EMT
process by repressing E-cadherin expression (22). Sun et al reported that PSAT1
may activate the GSK-3β/Snail signaling pathway (23). To further confirm the role of
MEG3-mediated suppression of PSAT1 and its correlation with the
GSK-3β/Snail signaling pathway, western blotting was performed. The
results revealed that the ectopic expression of MEG3 significantly
downregulated the level of the active form of GSK-3β (p-GSK-3β),
but did not affect the total GSK-3β level (Fig. 4D and E). Overexpression of MEG3 also
significantly downregulated the mean ratio of p-GSK-3β to total
GSK-3β compared with the control group (Fig. 4F). In addition, ectopic expression
of MEG3 in EC109 cells suppressed the molecular alterations that
are characteristic of EMT (downregulation of the mesenchymal
markers Snail and vimentin, and upregulation of the epithelial
marker E-cadherin; Fig. 4D-H).
Since the downregulation of PSAT1 is triggered by the
overexpression of MEG3, it was inferred that MEG3 inhibits the
PSAT1-dependent GSK-3β/Snail signaling pathway in EC109 cells.
Ectopic expression of MEG3 inhibits
xenograft ESCC growth and PSAT1 expression in vivo
To demonstrate the effects of MEG3 on cancer cell
dynamics in vivo, a xenograft tumor model in nude mice was
constructed. MEG3-overexpressing (Lv-MEG3) and control cells
(Lv-NC) were injected into the back flank of nude mice. The results
demonstrated that ectopic expression of MEG3 significantly
inhibited tumor growth (Fig. 5A-C).
The maximum percentage weight loss from start to end point in the
experimental group was 10.51%, while in the control group it was
5.58%. Overexpression of MEG3 decreased PSAT1 expression and
increased E-cadherin expression (Fig.
5D and E), indicating that MEG3 is involved in the regulation
of EMT in vivo.
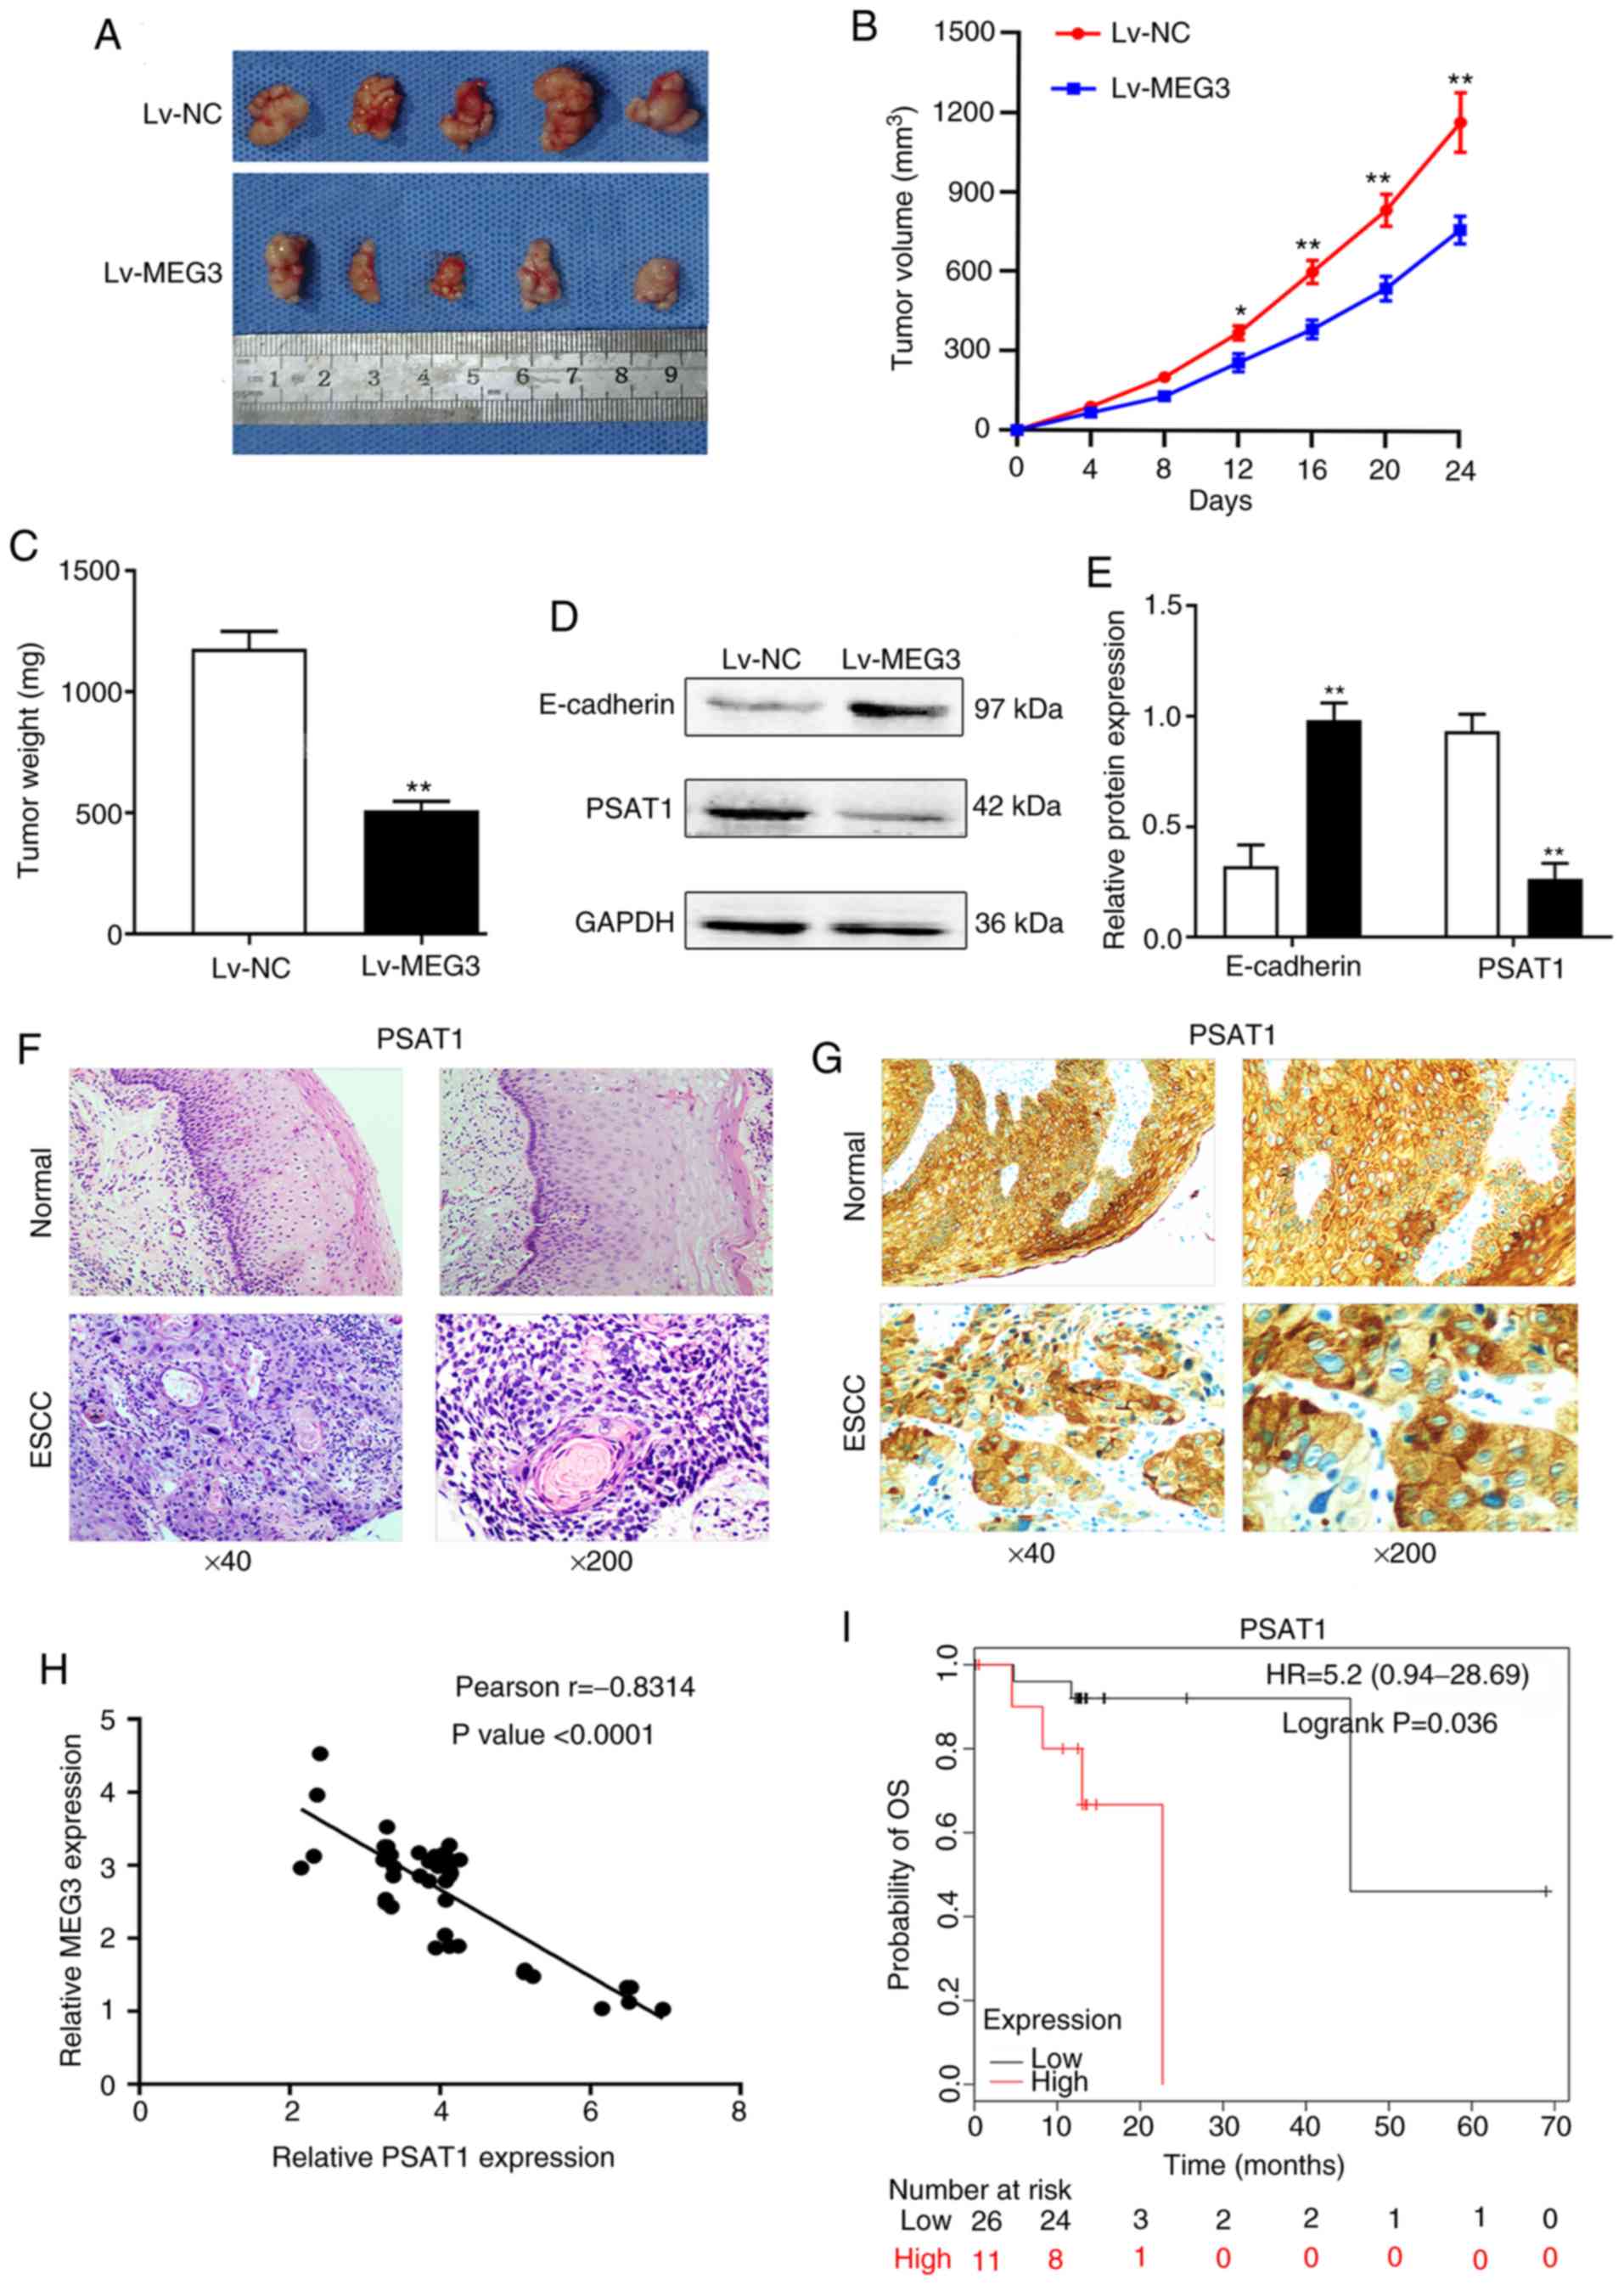 | Figure 5.Ectopic expression of MEG3 disrupted
tumor growth and PSAT1 expression in vivo, as was also shown
by the association assay between MEG3 and PSAT1 in human ESCC. (A)
In vivo resected tumors. Tumor (B) volume and (C) weight
were significantly lower for cells with ectopic expression of MEG3
compared with Lv-NC cells. Mice were injected with Lv-MEG3 or Lv-NC
cells and housed for 24 days. Tumor size was measured at weekly
intervals. The results represent the mean ± SD of 5 mice in each
group. (D and E) The protein levels of PSAT1 and E-cadherin were
detected by western blotting in the tumor tissues. Ectopic MEG3
increased E-cadherin expression, but decreased PSAT1 expression.
(F) Hematoxylin and eosin staining was performed on serial sections
of ESCC and adjacent normal tissues. (G) Representative
immunohistochemical staining for PSAT1 in ESCC samples and adjacent
normal esophageal tissues. Positive staining (brown) was detected
in tumor cells, but not in adjacent normal esophageal tissues.
Original magnification ×40, full, left; magnification ×100, partial
enlargement, right. (H) Relative expression of MEG3 and PSAT1 in 43
ESCC tissues, as determined by reverse transcription-quantitative
PCR assay. The correlation between MEG3 and PSAT1 mRNA levels was
determined by Pearson's correlation coefficient analysis. (I)
Kaplan-Meier survival curves of patients with ESCC. The overall
survival rates in patients with ESCC exhibiting low (n=59) or high
(n=20) PSAT1 protein levels were significantly different (P=0.036).
*P<0.05 and **P<0.01 compared with the Lv-NC group. MEG3,
maternally expressed gene 3; Lv, lentiviral vector; NC, negative
control; ESCC, esophageal squamous cell carcinoma; PSAT1,
phosphoserine aminotransferase 1. |
Expression of MEG3 and PSAT1 in
clinical ESCC tissues and association with prognosis
To investigate the clinical relevance of MEG3 and
PSAT1 in the progression of ESCC, and to further validate the
microarray results, the present study focused on clinical
relevance. After the mRNA levels of MEG3 were evaluated in 43 pairs
of ESCC, the expression levels of PSAT1 were also examined by
immunohistochemical staining. The results demonstrated that the
expression levels of PSAT1 were markedly upregulated in ESCC
tissues compared with those in adjacent normal tissues (Fig. 5G). Spearman's analysis revealed that
the expressions of MEG3 and PSAT1 were negatively correlated in
ESCC tissues (Pearson's r=−0.8314; P<0.0001; Fig. 5H). The survival analysis of patients
using the Kaplan-Meier plotter website data (http://kmplot.com/analysis/) revealed that higher
expression levels of PSAT1 tended to be correlated with a worse OS
in Asian ESCC patients (hazard ratio=5.2; P=0.036; Fig. 5I). Taken together, these results
indicate that MEG3 inhibits PSAT1 expression, and PSAT1 exerts a
carcinogenic effect on ESCC.
Discussion
MEG3 has been proposed to play a biological role in
various diseases, particularly cancer. Recent studies demonstrated
that MEG3 is involved in the regulation of cancer-related pathways,
and contributes to cell proliferation, metabolism, tumor
progression and metastasis (9–14). In
the present study, the expression and role of MEG3 in ESCC were
assessed, and the mechanisms underlying its activity were
investigated. The results demonstrated that MEG3 is downregulated
in ESCC cell lines and tissues, and a lower level of MEG3
expression was associated with lymph node metastasis, TNM stage and
poor prognosis in patients with ESCC. Ectopic expression of MEG3
inhibits cell viability and invasion in vitro and tumor
formation by EC109 cells in vivo.
To explore the molecular mechanisms through which
MEG3 regulates EMT in ESCC, the microarray results and KEGG pathway
analysis were used, which demonstrated that biosynthesis of amino
acids, aminoacyl-tRNA biosynthesis, serine and threonine
metabolism, MAPK signaling pathway, alanine, and aspartate and
glutamate metabolism were markedly enriched. Notably, another study
also indicated that some aminoacyl-tRNA synthetases act as secreted
cytokines to regulate angiogenesis and play a critical role in the
tumor microenvironment (24).
Emerging evidence indicates that serine and threonine metabolism,
as well as alanine, aspartate and glutamate metabolism, are
associated with tumor progression (25,26).
The underlying mechanisms likely involve the regulation of the
synthesis of proliferation-related proteins (27). Among those, one-carbon metabolism, a
system of regulating cellular nutrient status, plays an important
role in cancer (28,29). PSAT1, an enzyme that catalyzes the
conversion of phosphoserine to serine, is highly expressed in
various tumor tissues (19,30–34).
Since PSAT1 was a hub gene in the PPI network and was identified as
a DEG in the present study, the mechanism of MEG3 regulating EMT
through PSAT1 was further investigated in EC109 cells.
E-cadherin mediates cell-cell adhesion, a
characteristic that is lost during carcinogenesis. Decreased
E-cadherin, and elevated Snail and vimentin expression are the most
significant characteristics of EMT (35–38).
Several signaling pathways, including MAPK/ERK, PI3K/AKT/GSK-3β and
Wnt/β-catenin, are involved in EMT in ESCC (5,6,23,39,40).
Liu et al reported that PSAT1 activates the GSK-3β/Snail
signaling pathway and promotes the phosphorylation of GSK-3β. The
latter further activates Snail and inhibits E-cadherin expression,
leading to EMT in ESCC (20,31).
In agreement with previous studies, the present study demonstrated
that ectopic expression of MEG3 suppressed the migration and
invasion of ESCC cells, and also decreased PSAT1 expression.
Moreover, overexpression of MEG3 not only inhibited the
phosphorylation of GSK-3β, Snail and vimentin expression, but also
increased E-cadherin expression in vitro. In addition, the
present study demonstrated that ectopic expression of MEG3
suppressed tumor growth, alongside PSAT1 downregulation and
E-cadherin upregulation, indicating that MEG3 suppresses EMT by
inhibiting the PSAT1-dependent GSK-3β/Snail signaling pathway in
ESCC cells.
Based on the results of the in vitro studies,
the expression and significance of PAST1 was examined in ESCC
tissues to confirm the findings in EC109 cell lines. The
immunohistochemical results revealed that PSAT1 expression in tumor
tissues was obviously higher compared with that in adjacent normal
tissues, and MEG3 expression was significantly negatively
correlated with PSAT1. The potential involvement of MEG3 and PSAT1
was confirmed by the Kaplan-Meier plotter website data in ESCC.
Survival analysis of patients in the Asian population demonstrated
that higher expression levels of PSAT1 were associated with poor
prognosis. To the best of our knowledge, the present study was the
first to demonstrate that MEG3 negatively regulates PSAT1
expression and the GSK-3β/Snail signaling pathway in vitro
and in vivo, which may help improve our understanding of the
anticancer mechanism of action of MEG3.
Notably, Dong et al reported that MEG3
inhibited EMT by competitively binding to miR-9 in YES2 cells
(13). Xu et al demonstrated
that the MEG3/miR-21 axis participates in the regulation of EMT in
gastric cancer (41). In the
present study, MEG3 inhibited EMT by inhibiting the PSAT1-dependent
GSK-3β/Snail signaling pathway, suggesting that the mechanism of
MEG3 regulating EMT varies across different cells, and there may be
multiple mechanisms involved in the same cell type (7,36–38).
The precise mechanism through which MEG3 downregulates PSAT1 and
EMT requires further investigation. In addition, only a limited
number of samples were examined in the present study. Future
studies will include larger sample sizes to validate the
correlation analysis.
In conclusion, the findings of the present study
validated that MEG3 expression was decreased in human ESCC tissues,
and was associated with tumor TNM stage and poor prognosis. The
microarray results revealed that ectopic expression of MEG3 led to
changes in major biological functions, including compound metabolic
process and transcription. Furthermore, MEG3 appears to exert its
effects through inhibiting the PSAT1-dependent GSK-3β/Snail
signaling pathway in ESCC cells.
Supplementary Material
Supporting Data
Acknowledgements
Not applicable.
Funding
The present study was supported by the Guangdong
Provincial Key Laboratory of Infectious Diseases and Molecular
Immunopathology and the Department of Education, Guangdong
Government, under the Top-tier University Development Scheme for
Research and Control of Infectious Diseases.
Availability of data and materials
The datasets used and/or analyzed during the present
study are available from the corresponding author on reasonable
request.
Authors' contributions
MKL performed the experimental work and contributed
to figure preparation and writing of the manuscript. LXL
contributed to gene microarray analysis and participated in the
experiments. WYZ, HLZ and RPC assisted with the animal and
molecular biology experiments. JLF contributed to data analysis.
LFW designed and supervised the experiments. All the authors have
read and approved the final manuscript.
Ethics approval and consent to
participate
The clinical experiments were approved by the Ethics
Committee of the Second Affiliated Hospital of Shantou University
Medical College. Written informed consent was obtained from all the
participants.
Patient consent for publication
Not applicable.
Competing interests
All the authors declare that they have no competing
interests.
References
|
1
|
Bray F, Ferlay J, Soerjomataram I, Siegel
RL, Torre LA and Jemal A: Global cancer statistics 2018: GLOBOCAN
estimates of incidence and mortality worldwide for 36 cancers in
185 countries. CA Cancer J Clin. 68:394–424. 2018. View Article : Google Scholar : PubMed/NCBI
|
|
2
|
Wang SM, Abnet CC and Qiao YL: What have
we learned from Linxian esophageal cancer etiological studies?
Thorac Cancer. 10:1036–1042. 2019. View Article : Google Scholar : PubMed/NCBI
|
|
3
|
Xing L, Liang Y, Zhang J, Wu P, Xu D, Liu
F, Yu X, Jiang Z, Song X, Zang Q and Wang W: Definitive
chemoradiotherapy with capecitabine and cisplatin for elder
patients with locally advanced squamous cell esophageal cancer. J
Cancer Res Clin Oncol. 140:867–872. 2014. View Article : Google Scholar : PubMed/NCBI
|
|
4
|
Liu C, Tian X, Sun HB, Wang ZF, Jiang LF
and Li ZX: MiR-601 inhibits the proliferation and metastasis of
esophageal squamous cell carcinoma (ESCC) by targeting HDAC6. Eur
Rev Med Pharmacol Sci. 23:1069–1076. 2019.PubMed/NCBI
|
|
5
|
Hu X, Zhai Y, Kong P, Cui H, Yan T, Yang
J, Qian Y, Ma Y, Wang F, Li H, et al: FAT1 prevents epithelial
mesenchymal transition (EMT) via MAPK/ERK signaling pathway in
esophageal squamous cell cancer. Cancer Lett. 397:83–93. 2017.
View Article : Google Scholar : PubMed/NCBI
|
|
6
|
Yang JH, Wylie-Sears J and Bischoff J:
Opposing actions of Notch1 and VEGF in post-natal cardiac valve
endothelial cells. Biochem Biophys Res Commun. 374:512–516. 2008.
View Article : Google Scholar : PubMed/NCBI
|
|
7
|
Thiery JP, Acloque H, Huang RYJ and Nieto
MA: Epithelial-mesenchymal transitions in development and disease.
Cell. 139:871–890. 2009. View Article : Google Scholar : PubMed/NCBI
|
|
8
|
Zhang H, Liu L, Wang Y, Zhao G, Xie R, Liu
C, Xiao X, Wu K, Nie Y, Zhang H and Fan D: KLF8 involves in
TGF-beta-induced EMT and promotes invasion and migration in gastric
cancer cells. J Cancer Res Clin Oncol. 139:1033–1042. 2013.
View Article : Google Scholar : PubMed/NCBI
|
|
9
|
Zhou Y, Zhang X and Klibanski A: MEG3
noncoding RNA: A tumor suppressor. J Mol Endocrinol. 48:R45–R53.
2012. View Article : Google Scholar : PubMed/NCBI
|
|
10
|
Liu LX, Deng W, Zhou XT, Chen RP, Xiang
MQ, Guo YT, Pu ZJ, Li R, Wang GF and Wu LF: The mechanism of
adenosine-mediated activation of lncRNA MEG3 and its antitumor
effects in human hepatoma cells. Int J Oncol. 48:421–429. 2016.
View Article : Google Scholar : PubMed/NCBI
|
|
11
|
Zhang Z, Liu T, Wang K, Qu X, Pang Z, Liu
S, Liu Q and Du J: Down-regulation of long non-coding RNA MEG3
indicates an unfavorable prognosis in non-small cell lung cancer:
Evidence from the GEO database. Gene. 630:49–58. 2017. View Article : Google Scholar : PubMed/NCBI
|
|
12
|
Tan J, Xiang L and Xu G: LncRNA MEG3
suppresses migration and promotes apoptosis by sponging miR-548d-3p
to modulate JAK-STAT pathway in oral squamous cell carcinoma. IUBMB
Life. 71:882–890. 2019. View
Article : Google Scholar : PubMed/NCBI
|
|
13
|
Dong Z, Zhang A, Liu S, Lu F, Guo Y, Zhang
G, Xu F, Shi Y, Shen S, Liang J and Guo W: Aberrant
methylation-mediated silencing of lncRNA MEG3 functions as a ceRNA
in esophageal cancer. Mol Cancer Res. 15:800–810. 2017. View Article : Google Scholar : PubMed/NCBI
|
|
14
|
Pu Z, Wu L, Guo Y, Li G, Xiang M, Liu L,
Zhan H, Zhou X and Tan H: LncRNA MEG3 contributes to
adenosine-induced cytotoxicity in hepatoma HepG2 cells by
downregulated ILF3 and autophagy inhibition via regulation
PI3K-AKT-mTOR and beclin-1 signaling pathway. J Cell Biochem.
120:18172–18185. 2019. View Article : Google Scholar : PubMed/NCBI
|
|
15
|
Tai LW, Pan Z, Sun L, Li H, Gu P, Wong
SSC, Chung SK and Cheung CW: Suppression of Pax2 attenuates
allodynia and hyperalgesia through ET-1-ETAR-NFAT5 signaling in a
rat model of neuropathic pain. Neuroscience. 384:139–151. 2018.
View Article : Google Scholar : PubMed/NCBI
|
|
16
|
Zhou XT, Pu ZJ, Liu LX, Li GP, Feng JL,
Zhu HC and Wu LF: Inhibition of autophagy enhances
adenosine-induced apoptosis in human hepatoblastoma HepG2 cells.
Oncol Rep. 41:829–838. 2019.PubMed/NCBI
|
|
17
|
Huang ZL, Chen RP, Zhou XT, Zhan HL, Hu
MM, Liu B, Wu GD and Wu LF: Long non-coding RNA MEG3 induces cell
apoptosis in esophageal cancer through endoplasmic reticulum
stress. Oncol Rep. 37:3093–3099. 2017. View Article : Google Scholar : PubMed/NCBI
|
|
18
|
Szklarczyk D, Franceschini A, Wyder S,
Forslund K, Heller D, Huerta-Cepas J, Simonovic M, Roth A, Santos
A, Tsafou KP, et al: STRING v10: Protein-protein interaction
networks, integrated over the tree of life. Nucleic Acids Res.
43((Database Issue)): D447–D452. 2015. View Article : Google Scholar : PubMed/NCBI
|
|
19
|
Yan S, Jiang H, Fang S, Yin F, Wang Z, Jia
Y, Sun X, Wu S, Jiang T and Mao A: MicroRNA-340 inhibits esophageal
cancer cell growth and invasion by targeting phosphoserine
aminotransferase 1. Cell Physiol Biochem. 37:375–386. 2015.
View Article : Google Scholar : PubMed/NCBI
|
|
20
|
Liu B, Jia Y, Cao Y, Wu S, Jiang H, Sun X,
Ma J, Yin X, Mao A and Shang M: Overexpression of phosphoserine
aminotransferase 1 (PSAT1) predicts poor prognosis and associates
with tumor progression in human esophageal squamous cell carcinoma.
Cell Physiol Biochem. 39:395–406. 2016. View Article : Google Scholar : PubMed/NCBI
|
|
21
|
Sabbah M, Emami S, Redeuilh G, Julien S,
Prévost G, Zimber A, Ouelaa R, Bracke M, De Wever O and Gespach C:
Molecular signature and therapeutic perspective of the
epithelial-to-mesenchymal transitions in epithelial cancers. Drug
Resist Updat. 11:123–151. 2008. View Article : Google Scholar : PubMed/NCBI
|
|
22
|
Xu W, Yang Z and Lu N: A new role for the
PI3K/Akt signaling pathway in the epithelial-mesenchymal
transition. Cell Adh Migr. 9:317–324. 2015. View Article : Google Scholar : PubMed/NCBI
|
|
23
|
Sun C, Zhang X, Chen Y, Jia Q, Yang J and
Shu Y: MicroRNA-365 suppresses cell growth and invasion in
esophageal squamous cell carcinoma by modulating phosphoserine
aminotransferase 1. Cancer Manag Res. 10:4581–4590. 2018.
View Article : Google Scholar : PubMed/NCBI
|
|
24
|
Kim S, You S and Hwang D: Aminoacyl-tRNA
synthetases and tumorigenesis: More than housekeeping. Nat Rev
Cancer. 11:708–718. 2011. View
Article : Google Scholar : PubMed/NCBI
|
|
25
|
Man S, Li J, Fan W, Chai H, Liu Z and Gao
W: Inhibition of pulmonary adenoma in diethylnitrosamine-induced
rats by Rhizoma paridis saponins. J Steroid Biochem Mol Biol.
154:62–67. 2015. View Article : Google Scholar : PubMed/NCBI
|
|
26
|
Lane AN, Tan J, Wang Y, Yan J, Higashi RM
and Fan TWM: Probing the metabolic phenotype of breast cancer cells
by multiple tracer stable isotope resolved metabolomics. Metab Eng.
43:125–136. 2017. View Article : Google Scholar : PubMed/NCBI
|
|
27
|
Amelio I, Cutruzzolá F, Antonov A,
Agostini M and Melino G: Serine and glycine metabolism in cancer.
Trends Biochem Sci. 39:191–198. 2014. View Article : Google Scholar : PubMed/NCBI
|
|
28
|
Antonov A, Agostini M, Morello M, Minieri
M, Melino G and Amelio I: Bioinformatics analysis of the serine and
glycine pathway in cancer cells. Oncotarget. 5:11004–11013. 2014.
View Article : Google Scholar : PubMed/NCBI
|
|
29
|
Possemato R, Marks KM, Shaul YD, Pacold
ME, Kim D, Birsoy K, Sethumadhavan S, Woo HK, Jang HG, Jha AK, et
al: Functional genomics reveal that the serine synthesis pathway is
essential in breast cancer. Nature. 476:346–350. 2011. View Article : Google Scholar : PubMed/NCBI
|
|
30
|
The UniProt Consortium: UniProt: The
universal protein knowledgebase. Nucleic Acids Res. 45:D158–D169.
2017. View Article : Google Scholar : PubMed/NCBI
|
|
31
|
Dai J, Wei R, Zhang P and Kong B:
Overexpression of microRNA-195-5p reduces cisplatin resistance and
angiogenesis in ovarian cancer by inhibiting the PSAT1-dependent
GSK3β/β-catenin signaling pathway. J Transl Med. 17:1902019.
View Article : Google Scholar : PubMed/NCBI
|
|
32
|
Basurko MJ, Marche M, Darriet M and
Cassaigne A: Phosphoserine aminotransferase, the second
step-catalyzing enzyme for serine biosynthesis. IUBMB Life.
48:525–529. 1999. View Article : Google Scholar : PubMed/NCBI
|
|
33
|
Baek JY, Jun DY, Taub D and Kim YH:
Characterization of human phosphoserine aminotransferase involved
in the phosphorylated pathway of L-serine biosynthesis. Biochem J.
373:191–200. 2003. View Article : Google Scholar : PubMed/NCBI
|
|
34
|
Vié N, Copois V, Bascoul-Mollevi C, Denis
V, Bec N, Robert B, Fraslon C, Conseiller E, Molina F, Larroque C,
et al: Overexpression of phosphoserine aminotransferase PSAT1
stimulates cell growth and increases chemoresistance of colon
cancer cells. Mol Cancer. 7:142008. View Article : Google Scholar : PubMed/NCBI
|
|
35
|
Mishra R: Glycogen synthase kinase 3 beta:
Can it be a target for oral cancer. Mol Cancer. 9:1442010.
View Article : Google Scholar : PubMed/NCBI
|
|
36
|
Singh A and Settleman J: EMT, cancer stem
cells and drug resistance: An emerging axis of evil in the war on
cancer. Oncogene. 29:4741–4751. 2010. View Article : Google Scholar : PubMed/NCBI
|
|
37
|
Kiweler N, Brill B, Wirth M, Breuksch I,
Laguna T, Dietrich C, Strand S, Schneider G, Groner B, Butter F, et
al: The histone deacetylases HDAC1 and HDAC2 are required for the
growth and survival of renal carcinoma cells. Arch Toxicol.
92:2227–2243. 2018. View Article : Google Scholar : PubMed/NCBI
|
|
38
|
Kiweler N, Wünsch D, Wirth M,
Mahendrarajah N, Schneider G, Stauber RH, Brenner W, Butter F and
Krämer OH: Histone deacetylase inhibitors dysregulate DNA repair
proteins and antagonize metastasis-associated processes. J Cancer
Res Clin Oncol. 146:343–356. 2020. View Article : Google Scholar : PubMed/NCBI
|
|
39
|
Jin Y, Xu K, Chen Q, Wang B, Pan J, Huang
S, Wei Y and Ma H: Simvastatin inhibits the development of
radioresistant esophageal cancer cells by increasing the
radiosensitivity and reversing EMT process via the PTEN-PI3K/AKT
pathway. Exp Cell Res. 362:362–369. 2018. View Article : Google Scholar : PubMed/NCBI
|
|
40
|
Coussens LM, Fingleton B and Matrisian LM:
Matrix metalloproteinase inhibitors and cancer: Trials and
tribulations. Science. 295:2387–2392. 2002. View Article : Google Scholar : PubMed/NCBI
|
|
41
|
Xu G, Meng L, Yuan D, Li K, Zhang Y, Dang
C and Zhu K: MEG3/miR-21 axis affects cell mobility by suppressing
epithelial-mesenchymal transition in gastric cancer. Oncol Rep.
40:39–48. 2018.PubMed/NCBI
|