Introduction
Lung cancer accounts for nearly 20% of
cancer-related deaths worldwide, and the high incidence and
mortality of lung cancer, with 2.1 million new cases and 1.8
million deaths in 2018, indicate the importance of etiological and
therapeutic research (1). In all
lung cancer cases, non-small cell lung cancer (NSCLC) accounts for
approximately 80% of the cases (2).
Radiotherapy, as a critical treatment for inoperable and
postsurgical NSCLC patients, has been the main focus in the past
decades (3).
MicroRNA (miR) functions as either a tumor
suppressor or oncogene due to its direct involvement in cancer
initiation and progression through regulation of the expression of
essential cancer-related genes (4–6).
MicroRNA-7 (miR-7) has been identified as a tumor suppressor in
several human cancers. In studies with 41 and 128 pairs of cancer
and adjacent tissues, Xiong et al (7) and Su et al (8), respectively, revealed that miR-7 was
decreased in NSCLC. miR-7 also increased the radiosensitivity of
human cancer cells by enhancing the epidermal growth factor
receptor (EGFR) signaling pathway. Lee et al revealed that
targeting the miR-7-EGFR network overcame the resistance of X-ray
radiotherapy (9). EGFR is expressed
in various normal tissues, such as the skin, lung, liver and colon,
and the potential pan-effects of EGFR targets require the
identification of additional methods by which to regulate
radiosensitivity (10). Thus, it is
highly valuable to identify more miR-7 target genes as therapeutic
targets. However, the regulatory mechanisms of miR-7 and its target
genes remain unclear in the radiosensitivity of NSCLC.
Specific protein 1 (SP1) has been revealed to play
critical roles in tumorigenesis, promote the repair of DNA
double-strand breaks (DSBs) and regulate the radiosensitivity of
tumors (11). Following SP1
silencing, cells were revealed to be more sensitive to DNA damage,
and the foci degradation of γ-H2AX was delayed (12). In addition, SP1 silencing has been
revealed to result in abnormal chromosome accumulation, suggesting
that SP1 plays a vital role in DSB repair because SP1 often
accumulates at damaged sites of DNA (13). Multiple genes involved in the cell
cycle, differentiation, and oncogenesis are regulated by the SP1
protein (14). In lung cancer
cells, SP1 overexpression influenced the chemotherapeutic
resistance by upregulating the expression of the ATP-binding
cassette transporter G2 (ABCG2) (15). Tumor suppressor p53-binding protein
1 (TP53BP1) participates in the cellular response to DNA damage and
plays an essential role in DNA repair (16,17)
Ward created a TP53BP1-deficient mouse model and found that mice
lacking TP53BP1 were sensitive to radiation. Yang et al
confirmed that the suppression of BMI-1 (B-cell-specific Moloney
murine leukaemia virus integration site-1) increased the
radiosensitivity of esophageal carcinoma through regulation of
TP53BP1 (18). As a transcription
regulator, SP1 is involved in the regulation of downstream gene
expression, and the binding sites of SP1 were predicted to be
within the promoter region of TP53BP1 (http://genexplain.com/transfac/) (19). However, SP1 has not been
investigated in the radioresistance of NSCLC. Additionally, it
remains unclear whether miR-7 has a regulatory effect on SP1 and
TP53BP1 in NSCLC.
Herein, it was hypothesized that miR-7 increased
radiosensitivity in NSCLC by downregulating SP1 and TP53BP1.
Materials and methods
Cell lines
A549 and SK-MES-1 cells were purchased from the
Institute of Biochemistry and Cell Biology, Chinese Academy of
Sciences, China. In addition, 293T cells were obtained from Dr Yu
Tao, a researcher from China Medical University. A549
(adenocarcinoma) cells were grown in F-12 medium, and SK-MES-1
(squamous carcinoma) cells were grown in MEM medium. Additionally,
293T cells were grown in DMEM medium. All cells were grown at 37°C
in a humidified atmosphere of 5% CO2. All the media
contained 10% fetal bovine serum (FBS), and were obtained from
Gibco; Thermo Fisher Scientific, Inc.
Tissue collection
The Biomedical Ethics Committee of the Fourth
Affiliated Hospital of China Medical University approved the
present study (Institutional Review Board-approved protocol no.
2014-039). All relevant patients provided written informed consent,
and the collection of specimens was performed according to the
Declaration of Helsinki. In total, 95 matched paraffin sections and
8 pairs of NSCLC tissues and adjacent normal tissues (≥5 cm from
the NSCLC tissue) were obtained from patients who received surgical
resection at The Fourth Affiliated Hospital to China Medical
University from May 2008 to June 2018. All patients provided
informed consent and did not undergo radiotherapy or chemotherapy
before the operation. The age of the patients ranged from 31–76
years old, with a median age of 63±8.96 years, including 24 females
and 71 males. Staging was performed according to the UICC/AJCC (8th
edition) TNM staging system for lung cancer (20). Organizational credit types were
determined according to the standards provided by the World Health
Organization (2015) (21). The
selection criteria were as follows: i) all paraffin specimens were
NSCLC with a definite pathological diagnosis after operation; and
ii) all samples had complete clinical data.
RNA extraction, reverse
transcription-quantitative PCR (RT-qPCR) for miRNA expression, and
mRNA expression
Total RNA from tissues and cells was extracted with
the Eastep Super Total RNA Extraction Kit (Promega Corporation).
Every step was performed on ice and according to the protocol of
the kit. The 175 mg/ml tissue lysate was prepared from the tissue
preserved in liquid nitrogen. We collected 3–5×10⁶ cells
or 150 µl tissue lysate from the logarithmic growth period into an
EP tube. Then, 300 µl RNA lysate was added to the EP tube, which
was followed by centrifugation at 12,000 × g for 5 min at 4°C. The
upper liquid was absorbed and added to a new EP tube, followed by
the addition of anhydrous ethanol, mixing, and the addition of the
mixture to the centrifugal column/collection tube. The sample was
set aside and centrifuged at 12,000 × g, for 5 min at 4°C,
according to the described steps, the filtrate was discarded, and
50 µl DNA enzyme I incubation liquid was added to the centrifugal
column. The sample was incubated on ice for 15 min, followed by the
addition of 600 µl RNA to the centrifugal column and centrifugation
twice. The centrifugation column was moved to the elution tube, and
10–30 µl of nuclease-free water was added to the center of the
centrifugal column membrane and allowed to sit on ice for 2 min. It
was then centrifuged at 12,000 × g for 1 min at 4 °C to obtain RNA.
The purity and concentration of the A260/A280 ratio of RNA detected
using a spectrophotometer was between 1.9–2.1, and the
concentration was higher than 0.1 µg/µl. For miRNA expression,
total RNA (1–3 µg) was converted to cDNA using the Hairpin-it
microRNA and U6 snRNA Normalization RT-PCR Quantitation Kit
(Shanghai GenePharma Co., Ltd.). For each sample, quantitative PCR
(qPCR) was performed in triplicate on an ABI 7500 thermocycler
(Applied Biosystems; Thermo Fisher Scientific, Inc.) after reverse
transcription. For mRNA expression, the total RNA (0.5 µg) was
converted to cDNA for each sample using the Primer Script RT
Reagent Kit (Takara Biotechnology Co., Ltd). In each sample,
RT-qPCR was performed in triplicate with SYBR Premix Ex Taq II
(Takara Biotechnology Co., Ltd). The sequences of the
oligonucleotide primers are summarized in Table I. The primer oligonucleotides were
purchased from Takara Biotechnology Co., Ltd. qPCR for miRNA,
thermocycling conditions were as follows: 95°C for 3 min and 40
cycles at 95°C for 12 sec, and 62°C for 40 sec. qPCR for mRNA
thermocycling conditions were as follows: 95°C for 30 sec and 40
cycles at 95°C for 5 sec, and 60°C for 34 sec. All data were
analyzed using 2−ΔΔCq method (22)
 | Table I.The sequences of oligonucleotide
primers. |
Table I.
The sequences of oligonucleotide
primers.
| Gene | Oligonucleotide
primers |
|---|
| miR-7 | F:
5′-ACGTTGGAAGACTAGTGATTT-3′ |
|
| R:
5′-TATGGTTGTTCTGCTCTCTGTCTC-3′ |
| U6 | F:
5′-ATTGGAACGATACAGAGAAGATT-3′ |
|
| R:
5′-GGAACGCTTCACGAATTTG-3′ |
| SP1 | F:
5′-GACTAGGGCTGCAAGTAGTGAGGA-3′ |
|
| R:
5′-GGAAACTGGAGCACTGGGTAGAC-3′ |
| TP53BP1 | F:
5′-AGCAGGAGCTGGCTATATCCTTGA-3′ |
|
| R:
5′-GACAATGCTGATCCGCAATTAGAA-3′ |
| GAPDH | F:
5′-TCCTGTGGCATCCACGAAACT-3′ |
|
| R:
5′-GAAGCATTTGCGGTGGACGAT-3′ |
SP1 expression and the correlation
with TP53BP1
UALCAN (23)
(http://ualcan.path.uab.edu/) was used to
obtain SP1 transcript and protein expression data of lung
adenocarcinoma (LUADC) and lung squamous cell cancer (LUSCC). The
GEPIA database (24) (http://gepia.cancer-pku.cn) was used to collect
correlation data between SP1 and TP53BP1 in LUADC, LUSCC, and lung
tissues.
miRNA target prediction
Putative target genes of miR-7 were identified using
five miRNA databases: TargetScan (25) (http://www.targetscan.org/mamm_31/); PicTar (26) (https://pictar.mdc-berlin.de); RNAhybrid (27) (https://bibiserv.cebitec.uni-bielefeld.de/rnahybrid/);
miRanda (28) (http://www.microrna.org/microrna/home.do); and miRbase
(29) (http://www.mirbase.org).
Luciferase assay
The pGL3-conSP1-3′-UTR-Wt1 (1152–1159),
pGL3-conSP1-3′-UTR-Wt2 (4319–4325), pGL3-con-SP1-3′-UTR-Mut1, and
pGL3-con-SP1-3′-UTR-Mut2 reporter plasmids, as well as the control
Renilla luciferase pRL-TK vector were purchased from
Genomeditech. The LV-hsa-miR-7 and negative control CON238
(Ubi-MCS-SV40-EGFP-IRES-puromycin) were used to establish
miR-7-overexpressing and control 293T cells. The reporter plasmids
were transfected into 293T cells with Lipofectamine 2000 (Thermo
Fisher Scientific, Inc). After 48 h, the cells were collected,
lysed and centrifuged in 12,000 × g, and the supernatant was
collected. The Dual-Luciferase Reporter Assay System (Promega
Corporation) was used to perform the luminescence analysis.
Lentivirus transfection
LV-hsa-miR-7 (miR-7), negative control CON238
(Ubi-MCS-SV40-EGFP-IRES-puromycin), LV-hsa-miR-7-inhibitor
(miR-7-inhibitor) and negative control CON137
(hU6-MCS-Ubiquitin-EGFP-IRES-puromycin) were designed and
synthesized by Shanghai GenePharma Co., Ltd. The LV-shRNA against
SP1 mRNA (sh-SP1), control pGMLV-SC5 RNAi
(U6-CMV-EGFP-PGK-Puromycin), LV-SP1-overexpression, and
overexpression control PGMLV-4931 (CMV-MCS-3Flag-PGK-Puromycin)
were designed and synthesized by Genomeditech. The manufacturer's
protocol was followed to transfect the cells when the confluence
rate was 30–50%. The transfection efficiency was detected using
fluorescence microscopy. Western blotting or real-time PCR were
used to measure the expression efficiency. RNA was extracted 24 h
later and total proteins 48 or 72 h later after transfection. The
target sequence of short hairpin RNA for miR-7 was:
5′-TTCTCCGAACGTGTCACGT-3′ Furthermore, the sequences of the
oligonucleotide primers for hsa-miR-7 were as follows: Forward (F),
5′-GAGGATCCCCGGGTACCGGCCAAGCAAACTTCTCATTTCTC-3′ and reverse (R),
5′-CACACATTCCACAGGCTAGGGAATTGAAAGTTGTTAATATTTG-3′. The target
sequence of short hairpin RNA for SP1 was:
5′-GCGTTTCTGCAGCTACCTTGA-3′ and the sequences of the
oligonucleotide primers for SP1 were as follows: F,
5′-CCGCTCGAGGCCACCATGAGCG-3′ and R,
5′-CCGGAATTCgtGAAGCCATTGCCACTGATATTAATGG-3′
Cell proliferation assay
Cells were seeded in a 96-well plate (2,000
cells/well). Two groups were established, namely the irradiated and
non-irradiated groups, and each group had five replicates. After
adherence, cells were subjected to irradiation with 2 Gy, as well
as at 0, 24, 48, and 72 h after irradiation, or with 2, 4, 6, and 8
Gy at 24 h after irradiation, after which 10 µl of the Cell
Counting Kit-8 (CCK-8) reagent (Dojindo Molecular Technologies,
Inc.) was added to each well followed by a 1- to 4-h incubation and
determination of the absorbance at 450 nm on a microplate reader.
Cell survival was calculated according to the following formula:
Cell viability = (OD value in the irradiation group - OD of
blank)/(OD in the non-irradiation group - OD of blank). A cell
proliferation curve was generated based on the results.
Clonogenic assay
Exponential growth phase A549 cells were seeded into
six-well plates at 300, 500, 800, 1,200, and 2,000 cells/well in
triplicate. The cells were irradiated with a single dose of
radiation (0, 2, 4, 6, and 8 Gy) (Varian 2300EX at a dose rate of 5
Gy/min; 6 MVX; SSD, 100 cm; Varian Medical Systems) separately
after 24 h. Then, the incubated cells were allowed to undergo
colony formation at 37°C in a 5% CO2 atmosphere. After
incubation for ~14 days, 20% methanol and 0.5% (v/v) crystal violet
were added to the plates for 20 min at room temperature to fix and
stain the colonies. The cells were observed under a dissecting
light microscope (magnification, ×100), and the colonies containing
>50 cells were counted. The survival fraction (SF) were
calculated as follows: SF = (number of colonies/number of cells
plated)irradiated/(number of colonies/number of cells
plated)non-irradiated (30) The SF in each group was also analyzed
using GraphPad Prism 5.0 (GraphPad Software, Inc.) as previously
described (31).
Wound-healing assay
Cell migration was measured using the wound-healing
assay. Cells (0.5×10⁶ cells/well) were seeded into
six-well plates, and when the confluency of the cells was optimal,
a line was generated through the entire center of the well by
scraping the cells with a 10-µl tip. The cells were then cultured
in medium with 2% FBS for 48 h. Light microscopic images
(magnification, ×100) of the cultures were obtained at 0, 24, and
48 h, and then the open wound area was assessed using ImageJ
software (version 1.52q; National Institutes of Health). The open
wound areas at 0 h in each group were used as the reference point,
and the wound area at 24 and 48 h was divided by the area at 0 h,
and the resulting relative wound areas were compared.
Transwell invasion assay
Cells were seeded into 6-well plates
(0.5×10⁶ cells/well), and two groups, namely the
irradiation group and non-irradiation group, were established
according to the experimental requirements. After adherence, the
cells were irradiated with 0 and 2 Gy, and the culture medium was
replaced with serum-free medium for 12 h. Cells were then digested,
washed, and suspended in complete medium, and the cell density was
adjusted to 1×10⁴/ml. Matrigel (50 µl; BD Bioesciences)
was added to the upper chambers of the 24-well 8-µm Transwell
plates (Corning-Costar; Corning, Inc.). Suspended cells (200
µl/well) were then added to the upper chamber, and 700 µl of medium
containing 10% FBS was added to the lower chamber. Cells were
incubated at 5% CO2 and 37°C. After 48 h of culture, the
medium was discarded, and the cells were fixed with 20% methanol
and stained with crystal violet 0.5% (v/v) for 20 min at room
temperature. After washing the cells, images were obtained using a
light microscope (magnification, ×400), and the results were
analyzed.
Western blot analysis
Protein was extracted from the cells. Cells were
lysed in RIPA buffer (Thermo Fisher Scientific, Inc.) containing a
protease and phosphatase inhibitor cocktail and incubated at 4°C
for 30 min. Cells (5×10⁶) and RIPA buffer were added to
the EP tube and mixed evenly; the mixed solution was placed on ice
for 5 min to lyse the cells, followed by centrifugation at 13,000 ×
g for 10 min at 4°C. The supernatant was removed to a new EP tube.
To extract the protein from the tissue, first the tissue was cut
into small pieces, the RIPA buffer was added, and the tissue was
disrupted with an ultrasonic homogenizer. The mixture was placed on
ice for 15 min for complete lysis and then centrifuged at 13,000 ×
g for 10 min at 4°C and removal of the supernatant to a new EP
tube. A BCA kit (Thermo Fisher Scientific, Inc) was used for
protein quantification. Additionally, 50 µg protein was subjected
to 10% SDS-PAGE at a constant 120 V, 120 mA current and transferred
to a polyvinylidene fluoride (PVDF) membrane (EMD Millipore). The
membranes were blocked in 5% (w/v) bovine serum albumin (BSA;
Sigma-Aldrich; Merck KGaA) for 2 h at room temperature and
incubated at 4°C overnight with primary antibodies against SP1
(1:2,000 dilution; cat. no. H00006667-M05; Novus Biologicals,
Ltd.), TP53BP1 (1:1,000 dilution; product code ab172580; Abcam) and
GAPDH (1:2,000 dilution; product code ab8245; Abcam) On the
following day, membranes were incubated with anti-mouse (SP1 and
GAPDH) or anti-rabbit (TP53BP1) IgG HRP-labeled secondary
antibodies (1:10,000 dilution; product codes ab205719 and ab205718,
respectively; Abcam) for 1 h at room temperature. Chemiluminescent
detection was performed using the SuperSignal West Pico
Chemiluminescent Substrate (product no. NCI5079; Thermo Scientific,
Inc.). ImageJ software (version 1.52q; National Institutes of
Health) was used for densitometric analysis.
Immunohistochemical (IHC)
staining
All paraffin specimens were cut into 4-µm serial
sections to generate 3 pieces per sample. Sections were attached to
the anti-slipping slides and processed in a thermostat (60°C) for
60 min. Two sections were used for immunohistochemical staining,
and one section was used as a negative control. IHC staining was
performed by a two-step procedure, the paraffin-embedded sections
were deparaffinized using xylene and rehydrated using a series of
solutions of decreasing alcohol concentrations. Sections were
placed in boiling citrate buffer for antigen retrieval, and 3%
H2O2 was used to block endogenous peroxidase
activity. The primary antibody against SP1 (1:200 dilution; product
code ab124804; Abcam) was used to incubate sections overnight at
4°C. The following day, the sections were washed and incubated with
rabbit specific IHC polymer detection kit HRP/DAB (product code
ab209101; Abcam) at room temperature for 10 min, followed by
hematoxylin counter-staining for 30 sec. Images were obtained using
a light microscope (magnification, ×100). Pathologists performed a
blinded assessment of the IHC staining. Brownish-yellow granular
precipitates in the nuclei were considered positive. The following
scoring system was used: 3, >60% of tumor cells were stained as
positive; 2, 41 to 60% of tumor cells were stained positive; 1, 11
to 40% of tumor cells were stained positive; and 0, <10% of
tumor cells were stained positive. If the score was equal to 3, the
grade of specimen was classified as overexpression of SP1 (32).
Statistical analysis
The mean ± SEM from two or three independent
experiments was used to express the data, and GraphPad Prism 5.0
software (GraphPad Software, Inc.) and SPSS 20.0 software (IBM
Corp.) were used to perform statistical analyses. ANOVA was used
for multigroup comparisons, and multiple comparisons between two
groups were performed using analysis of variance and least
significant difference (LSD) post hoc tests (Figs. 4D and E and 6D and E). Multiple comparison between two
groups were performed using Tukey's test (Figs. 2C, 3A and 5A).
To determine the SP1 expression differences between tumor tissue
and non-tumor tissue, McNemar's test was used to analyze the data
in Table II. To determine the
associations between SP1 and clinicopathological features, Fisher's
exact test was used to analyze the data in Table III. A paired t-test was used to
compare tumor vs. adjacent normal tissue (Fig. 1). An unpaired Student's t-test was
conducted to compare two groups (Figs.
2B and D, 3B, 4A-C, 5B and
C, 6A-C and 7, except 7E). Spearman's test was used to analyze
the correlation coefficient (Fig.
7E). A P-value <0.05 was considered to indicate a
statistically significant difference
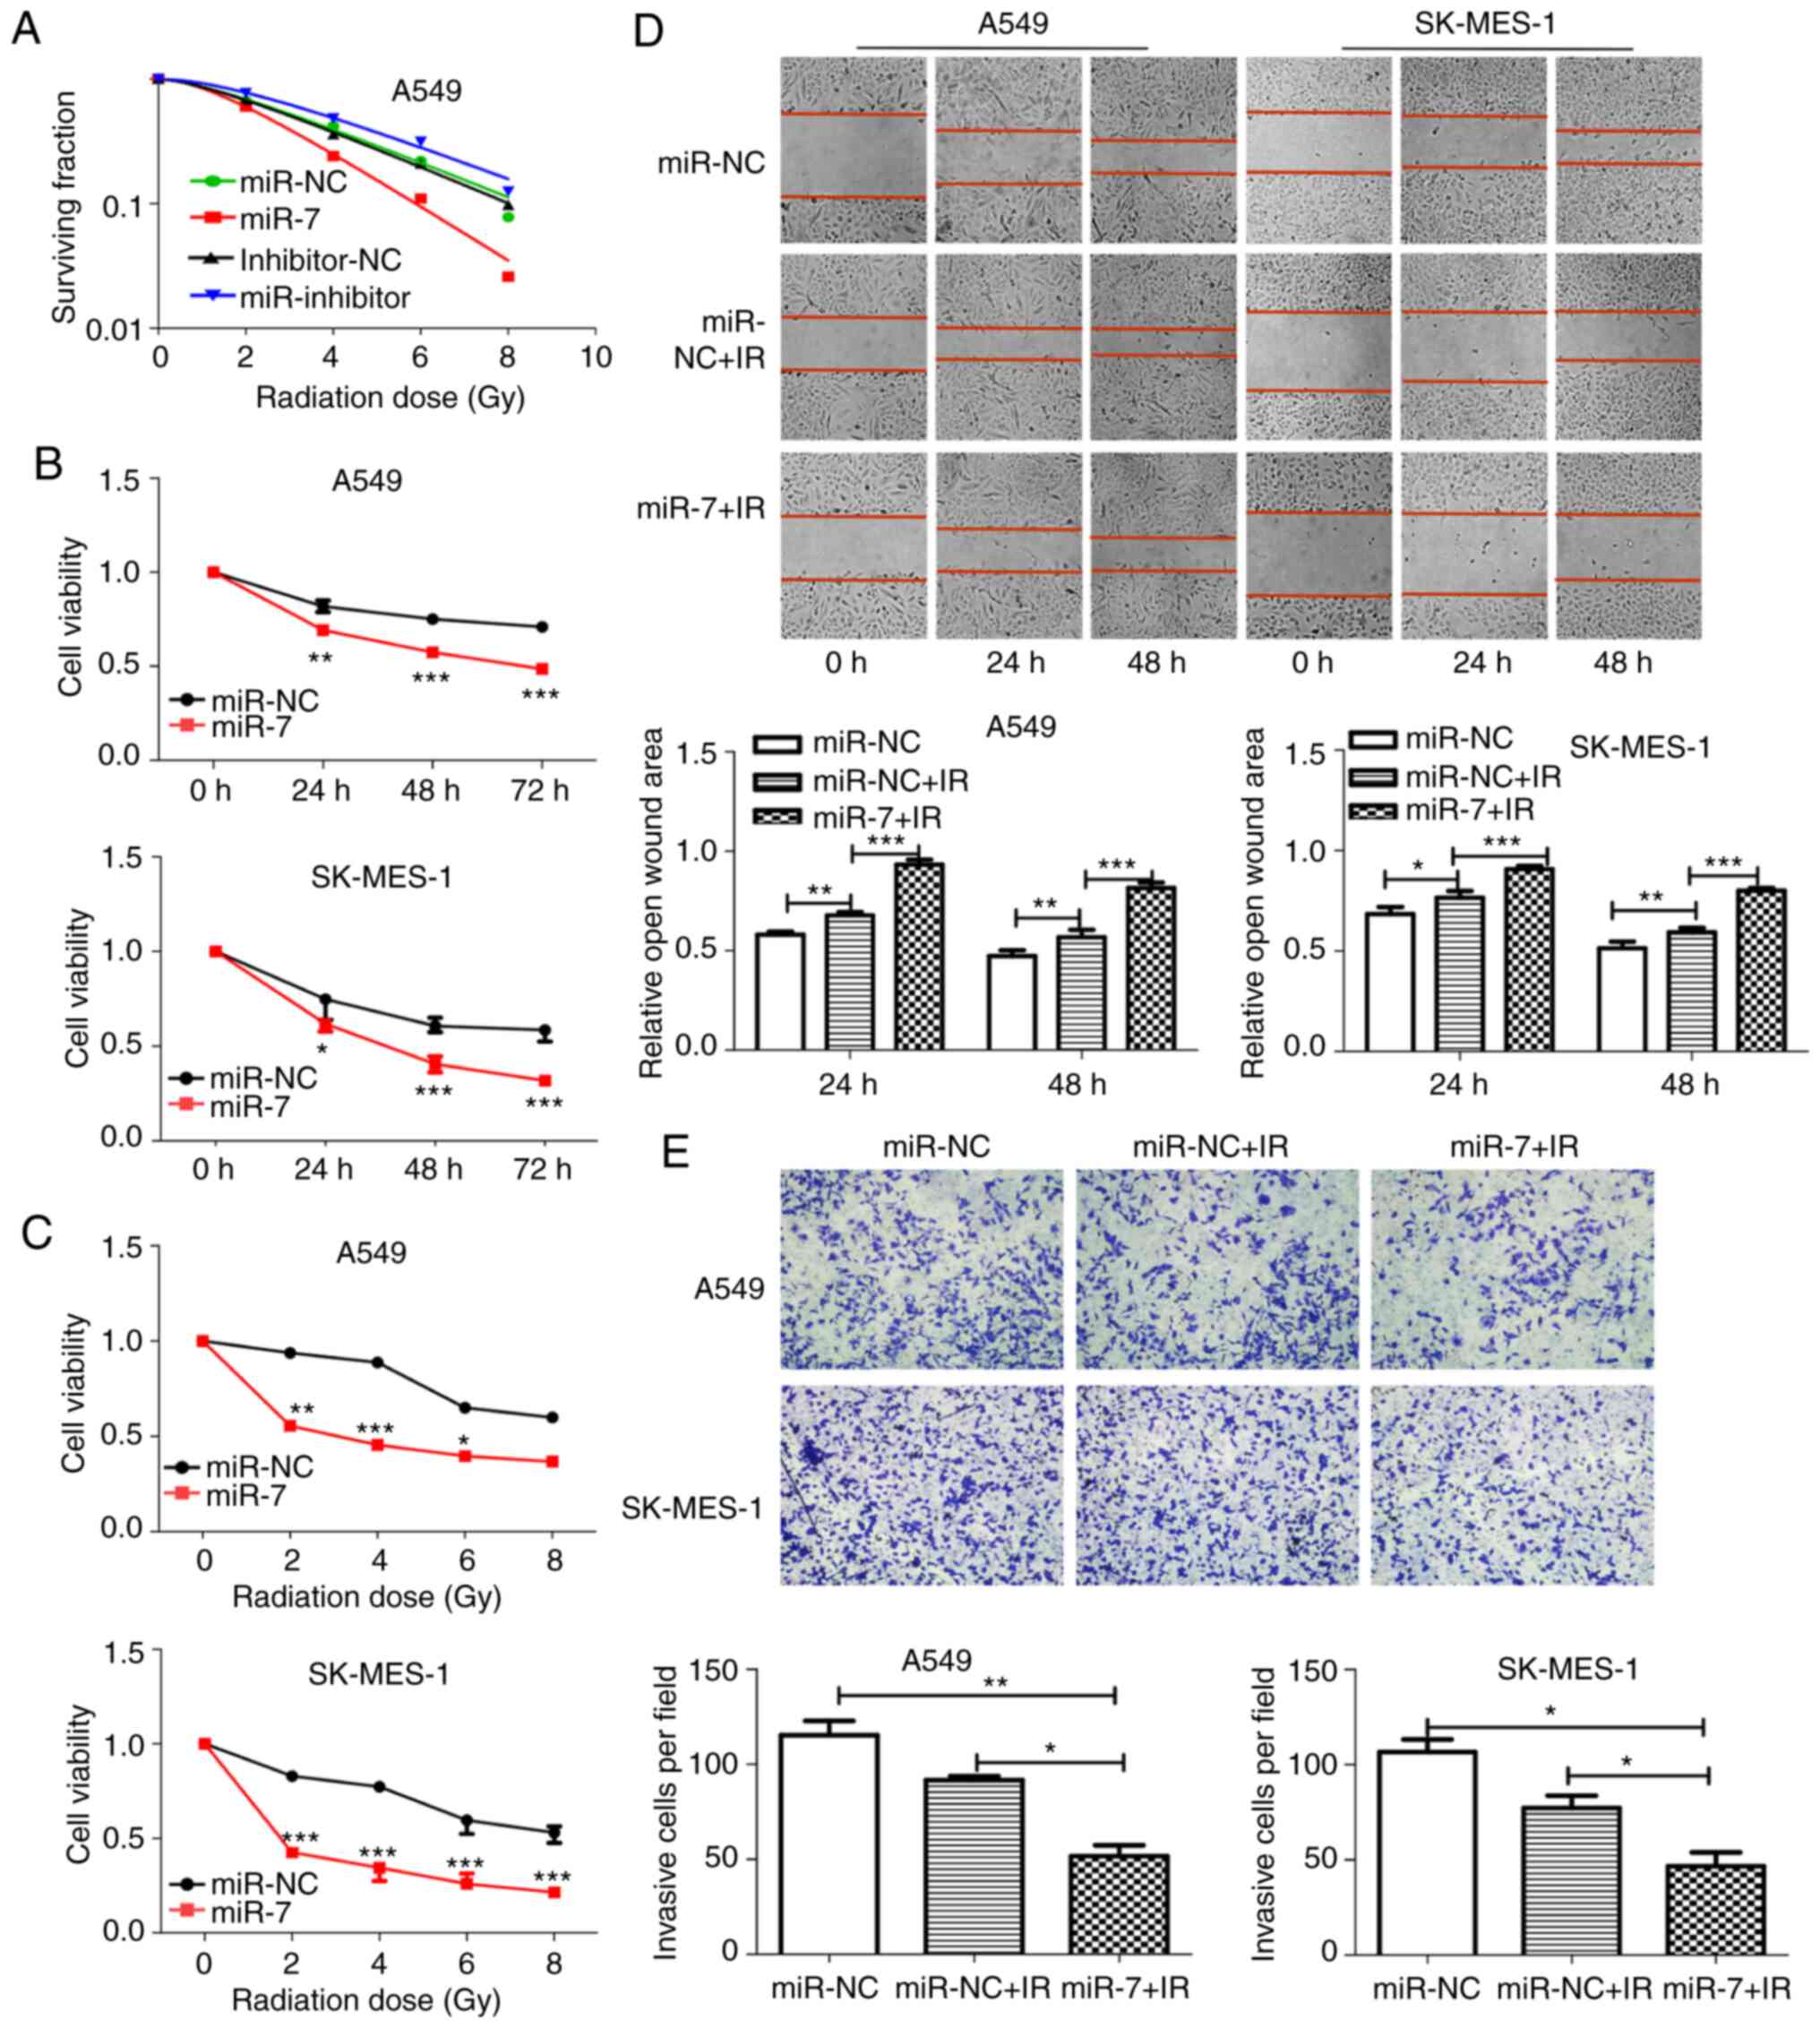 | Figure 4.miR-7 enhances radiosensitivity of
NSCLC cells. (A) Clonogenic cell survival curves were generated.
miR-7 overexpression decreased survival fractions of A549 cells
after irradiation (SER=1.54), and inhibition of miR-7 increased the
survival fraction (SER=0.89). (B and C) Cell proliferation assays
revealed that miR-7-overexpressing cells had decreased viability
with (B) time course (0, 24, 48 and 72 h) and (C) increasing
radiation dose (0, 2, 4, 6 and 8 Gy) after 2 Gy irradiation. The
24-h time-point was selected as the representative time-point in C.
(D) Wound healing (magnification, ×100) and (E) Transwell invasion
(magnification, ×400) assays demonstrated that miR-7 combined with
irradiation significantly inhibited the migration and invasion of
NSCLC cells. *P<0.05, **P<0.01 and ***P<0.001. miR-7,
microRNA-7; NSCLC, non-small cell lung cancer; SER, sensitivity
enhancement ratio. |
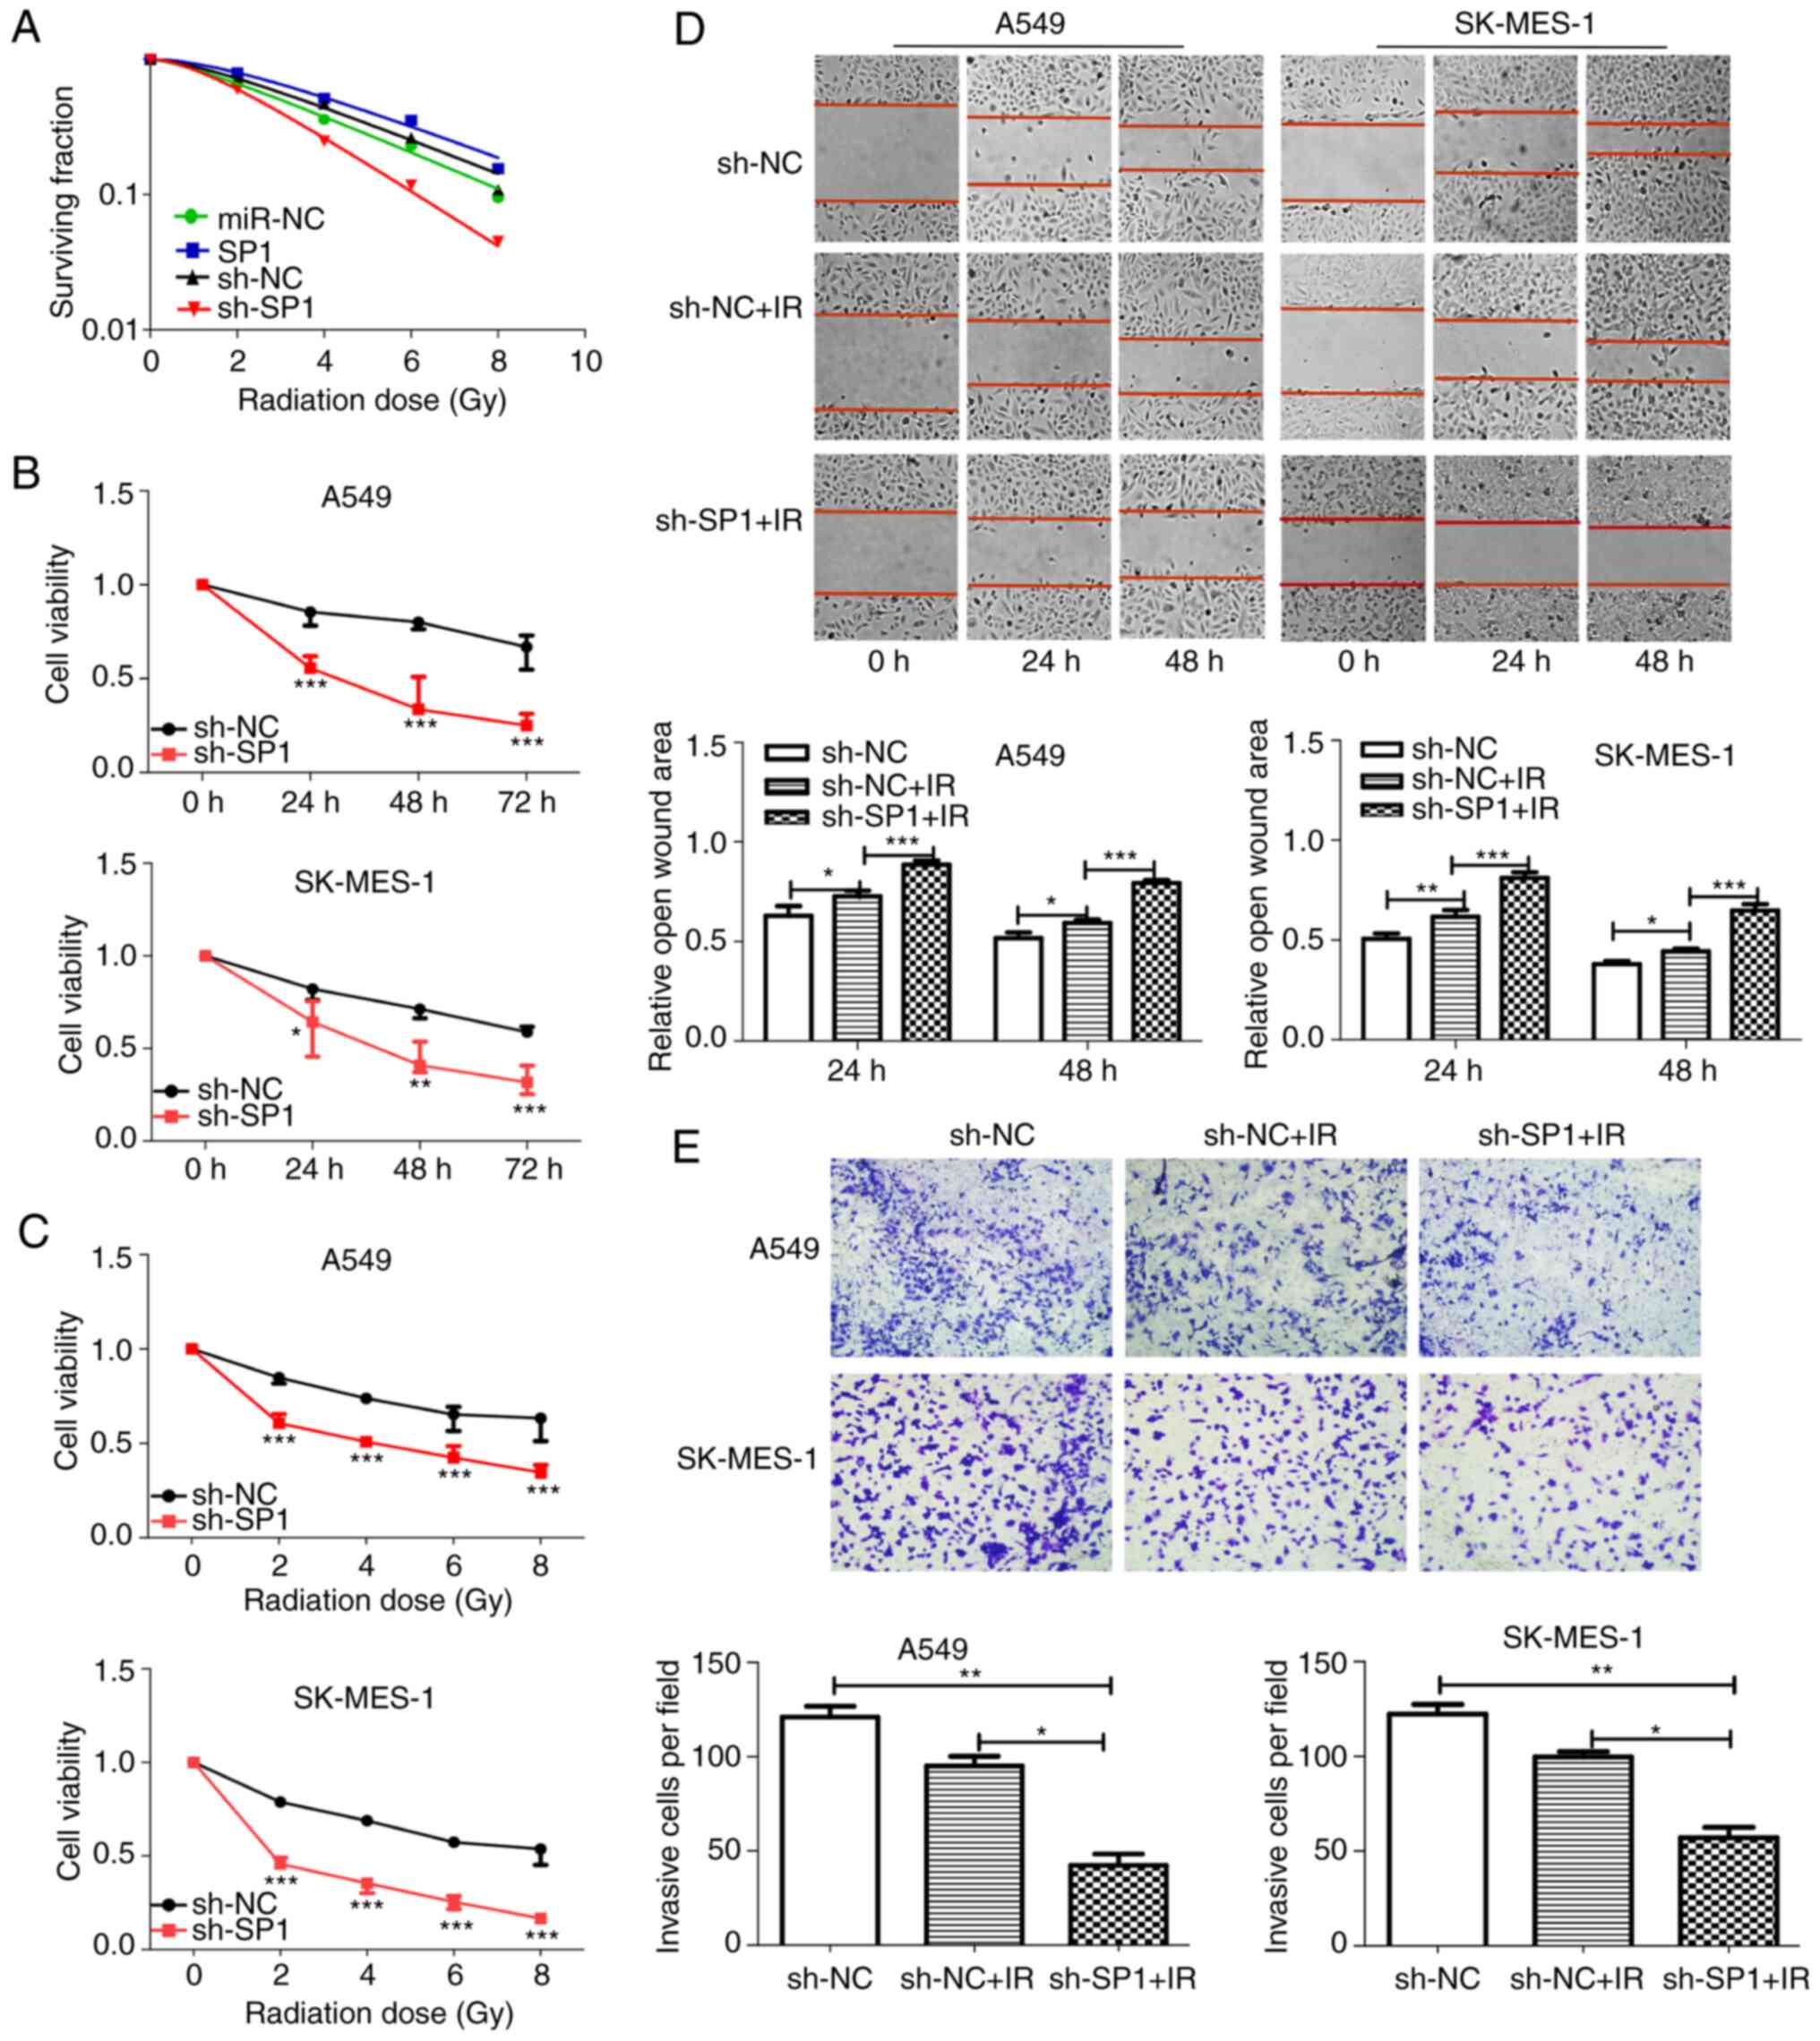 | Figure 6.sh-SP1 enhances radiosensitivity of
NSCLC cells. (A) Clonogenic cell survival curves were generated.
The SP1-knockdown A549 cells decreased survival fractions after
irradiation (SER=1.59), and overexpression of SP1 increased the
survival fraction (SER=0.88). (B and C) Cell proliferation assays
revealed that SP1-knockdown cells had decreased viability with B)
time course (0, 24, 48 and 72 h) and (C) increasing radiation dose
(0, 2, 4, 6 and 8 Gy) after 2 Gy irradiation. The 24-h time-point
was selected as the representative time-point in C. (D) Wound
healing (magnification, ×100) and (E) Transwell invasion
(magnification, ×400) assays demonstrated that knockdown of SP1
combined with irradiation significantly inhibited the migration and
invasion of NSCLC cells. *P<0.05, **P<0.01 and ***P<0.001.
SP1, specific protein 1; sh, shRNA; NSCLC, non-small cell lung
cancer; SER, sensitivity enhancement ratio. |
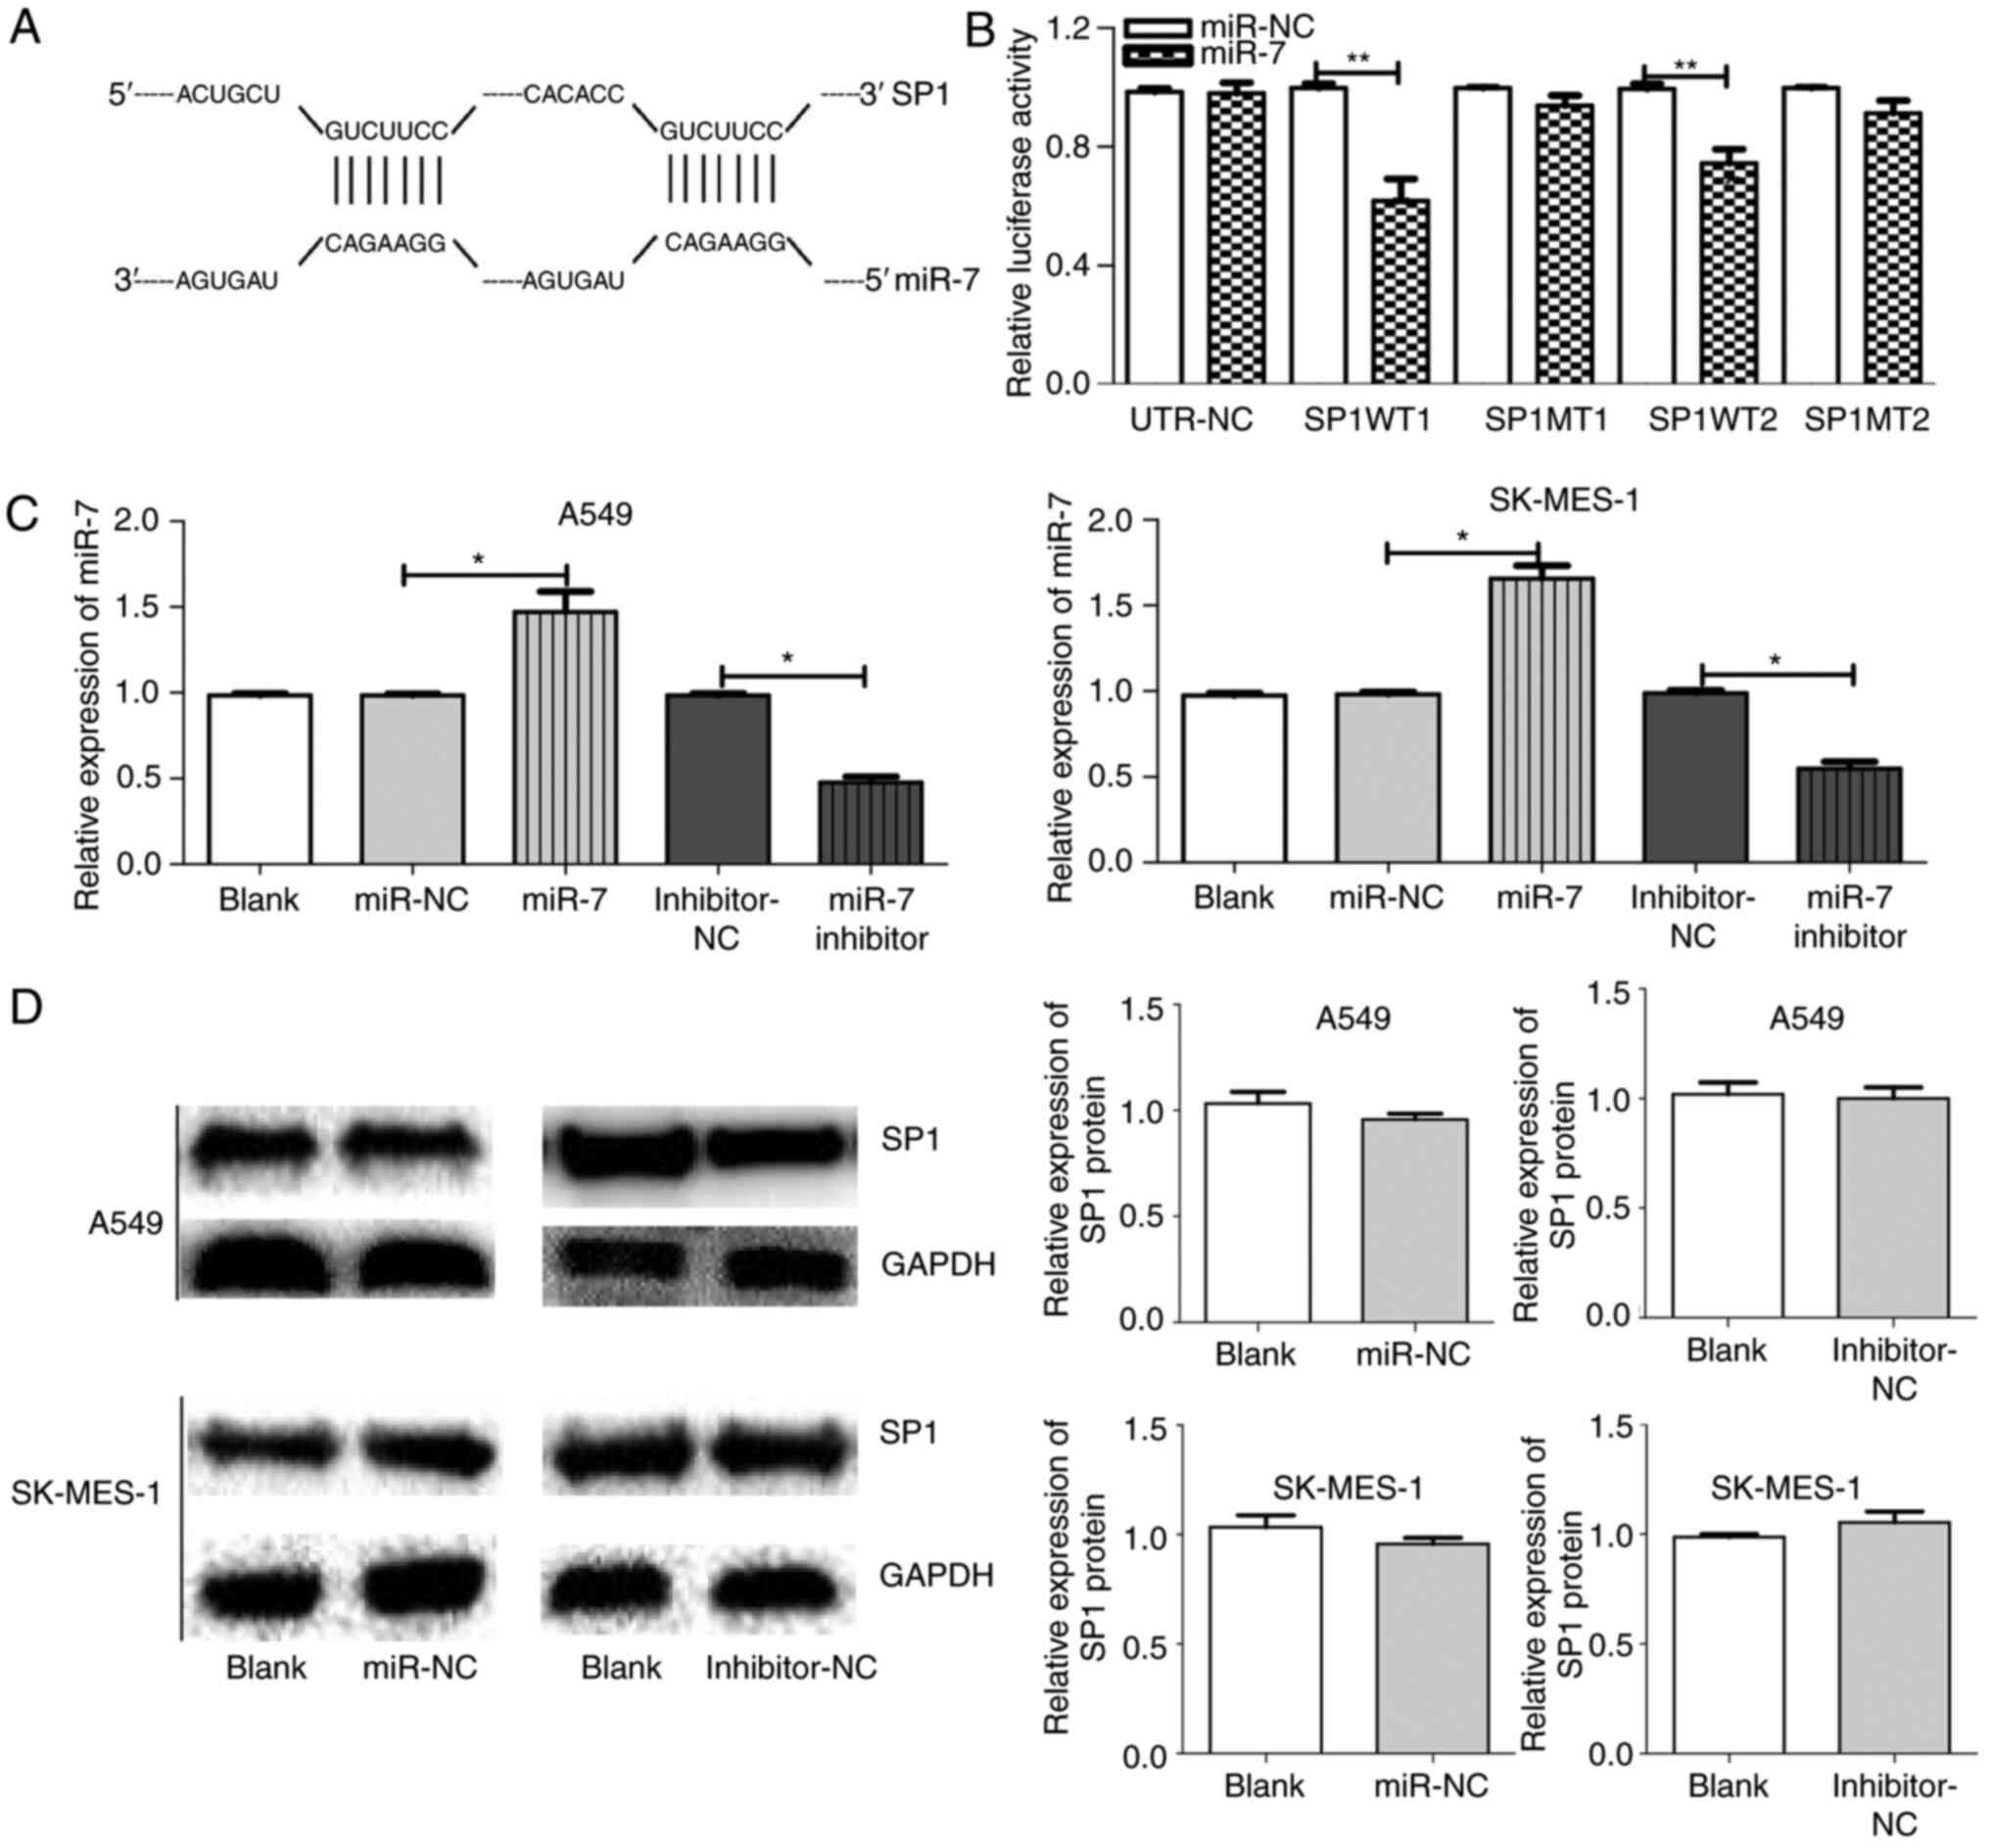 | Figure 2.SP1 is a direct target of miR-7 in
NSCLC. (A) Prediction of TargetScan; the binding sites of SP1 and
miR-7 (1152–1159 and 4319–4325). (B) Luciferase reporter assays
indicated that miR-7 targeted SP1 3′-UTR in A549 and SK-MES-1
cells. (C) The miR-7 expression between groups in A549 and SK-MES-1
cells after transfection with blank, miR-NC, miR-7, inhibitor-NC,
or miR-7 inhibitor. (D) SP1 expression between groups in A549 and
SK-MES-1 cells after transfection with miR-NC, inhibitor-NC, or
blank. *P<0.05, **P<0.01 and. SP1, specific protein 1; miR-7,
microRNA-7; NSCLC, non-small cell lung cancer; NC, negative
control. |
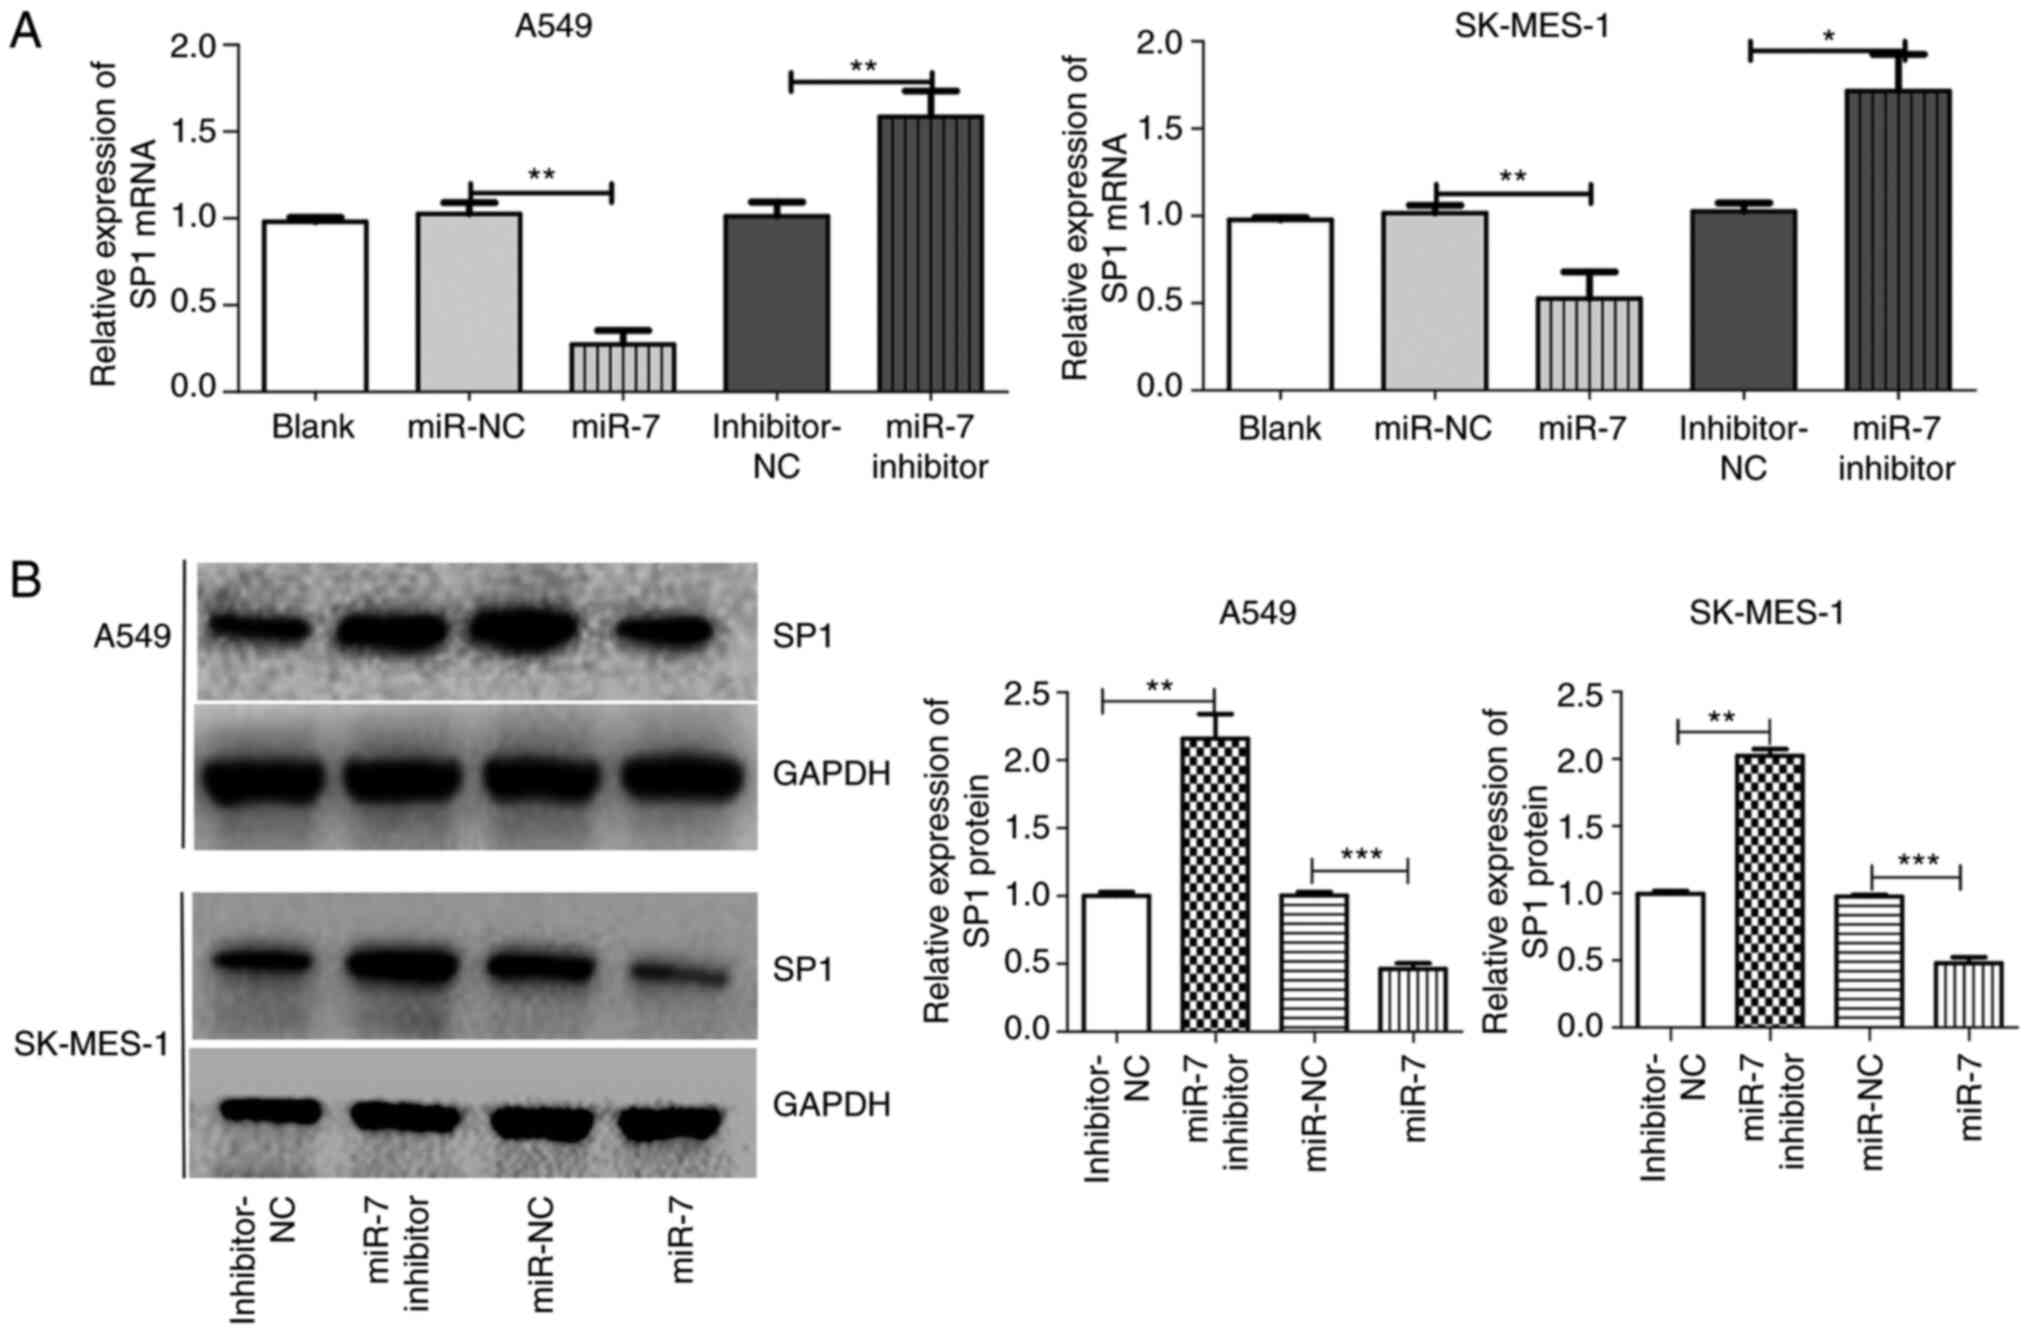 | Figure 3.SP1 is a direct target of miR-7 in
NSCLC. (A) SP1 mRNA expression between groups in A549 and SK-MES-1
cells after transfection with blank, miR-NC, miR-7, inhibition-NC
or miR-7 inhibition. (B) SP1 protein expression between groups in
A549 and SK-MES-1 cells after transfection with inhibitor-NC, miR-7
inhibitor, miR-NC or miR-7. *P<0.05, **P<0.01 and
***P<0.001. SP1, specific protein 1; miR-7, microRNA-7; NSCLC,
non-small cell lung cancer; NC, negative control. |
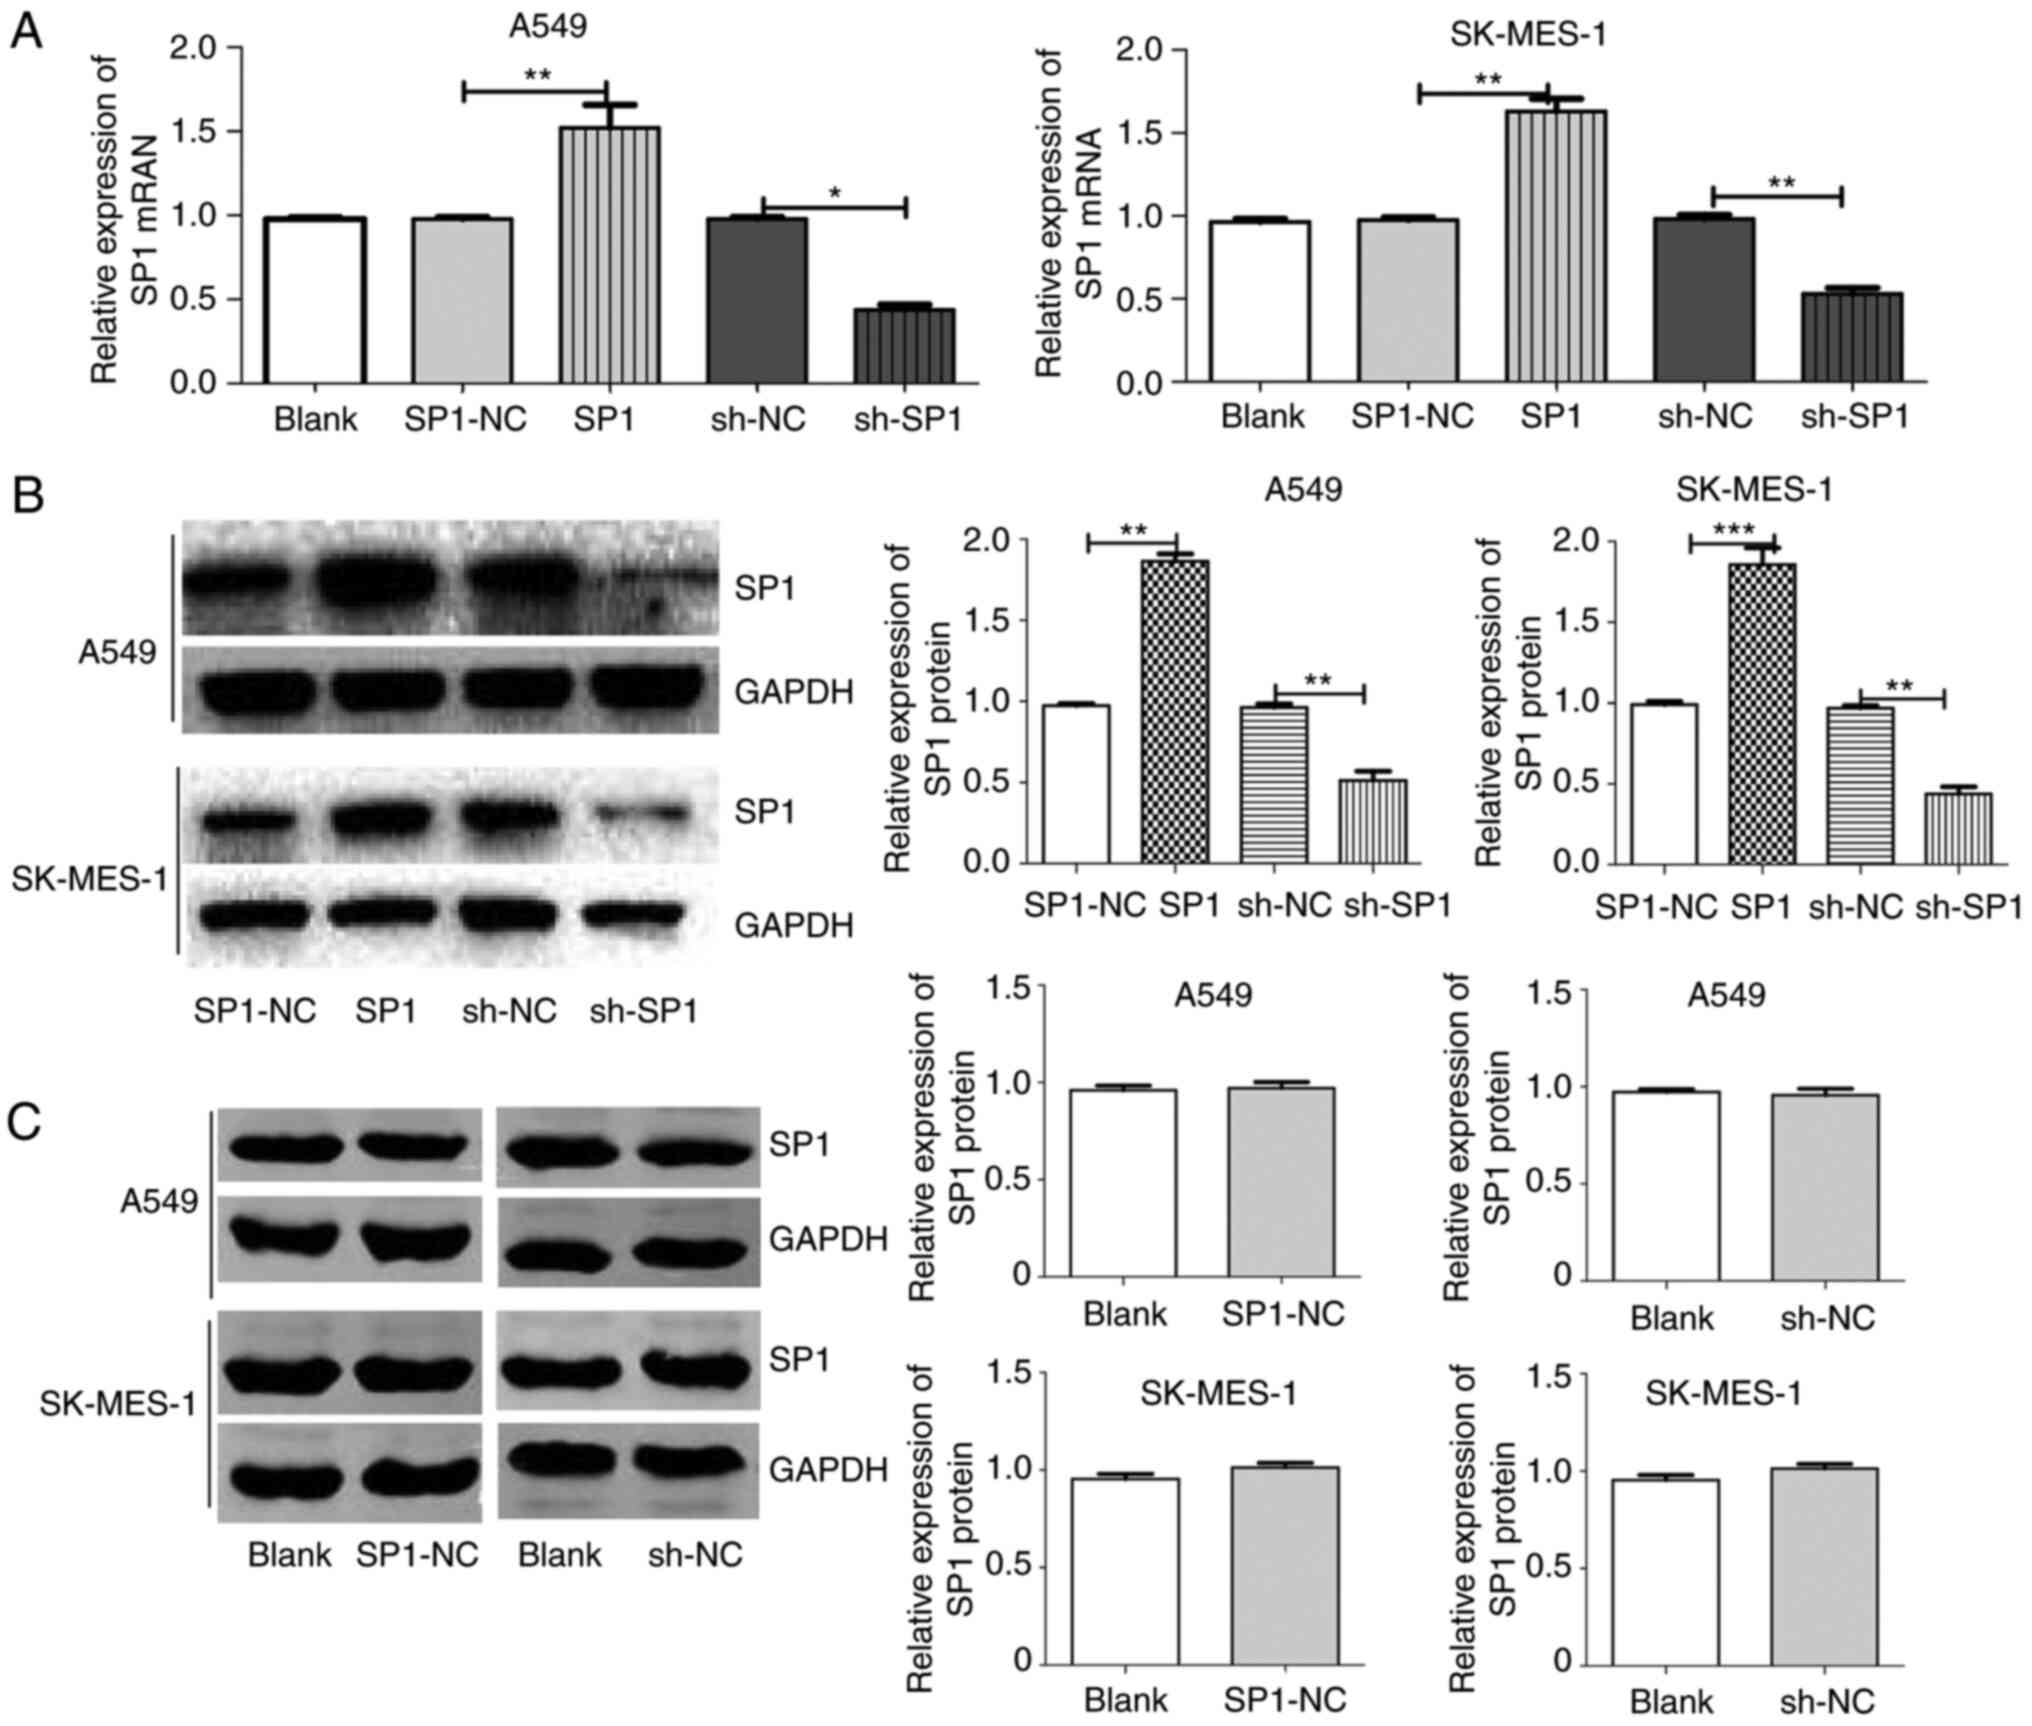 | Figure 5.SP1 expression after SP1
overexpression and knockdown transfection. (A) SP1 mRNA expression
between groups in A549 and SK-MES-1 cells after transfection with
blank, SP1-NC, SP1, sh-NC or sh-SP1. (B) SP1 protein expression
between groups in A549 and SK-MES-1 cells after transfection with
SP1-NC, SP1, sh-NC or sh-SP1. (C) SP1 protein expression between
groups in A549 and SK-MES-1 cells after transfection with blank,
SP1-NC or sh-NC. *P<0.05, **P<0.01 and ***P<0.001. SP1,
specific protein 1; NC, negative control; sh, shRNA. |
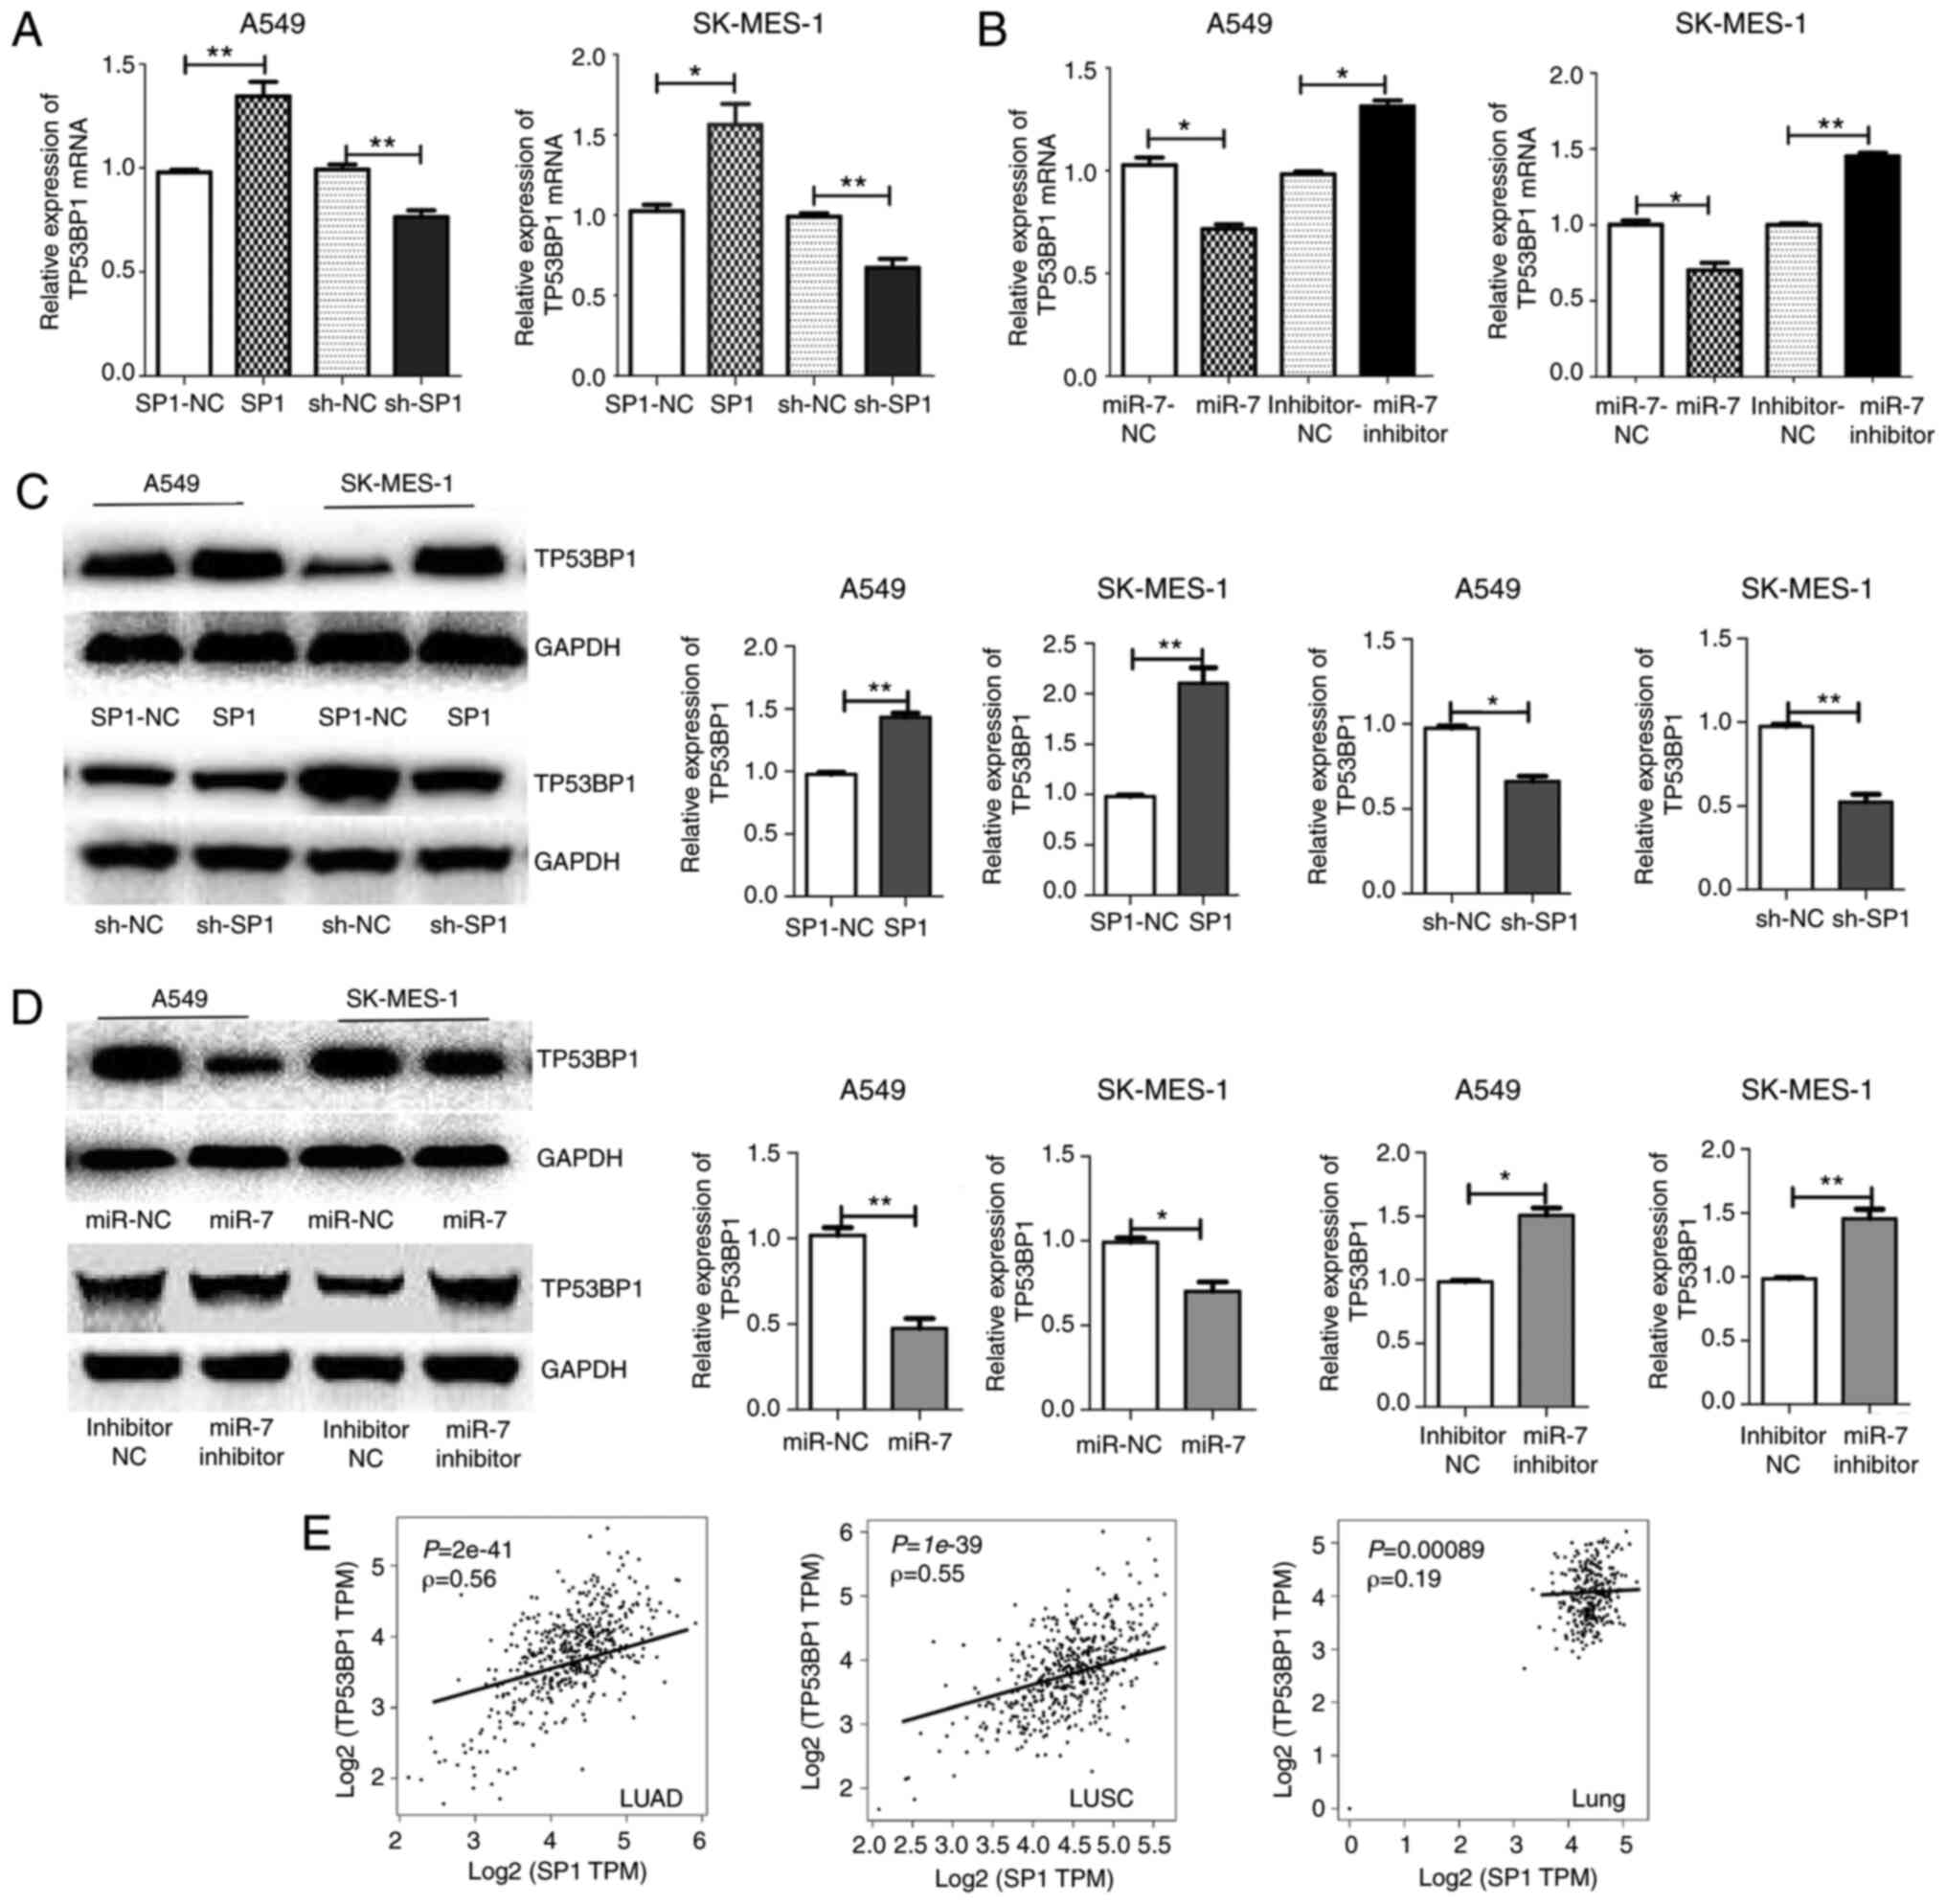 | Figure 7.miR-7 regulates TP53BP1 through SP1.
The (A and B) mRNA and (C and D) protein levels of TP53BP1 in A549
and SK-MES-1 cells are higher with upregulation of SP1 or
downregulation of miR-7, and are lower with downregulation of SP1
or upregulation of miR-7 compared with the negative control. (E)
The correlation coefficient (Spearman's test) between SP1 and
TP53BP1 in LUAD, LUSC, and lung tissue from GEPIA, revealed that
SP1 was correlated with the TP53BP1 in lung cancer tissue.
*P<0.05, **P<0.01. miR-7, microRNA-7; TP53BP1, tumor
suppressor p53-binding protein 1; SP1, specific protein 1; LUADC,
lung adenocarcinoma; LUSC, lung squamous cell carcinoma. |
| Table II.Expression of SP1 protein in
carcinoma and adjacent tissues. |
Table II.
Expression of SP1 protein in
carcinoma and adjacent tissues.
|
|
| Cancer | Adjacent
normal |
|
|---|
|
|
|
|
|
|
|---|
| Cancer type | N | Low | High | Low | High |
P-valuea |
|---|
| NSCLCb | 95 | 36 | 59 | 67 | 28 |
<0.001 |
| LUADb | 49 | 17 | 32 | 32 | 17 |
<0.001 |
| LUSCc | 46 | 19 | 27 | 35 | 11 | 0.002 |
| Table III.Associations between SP1 expression
and clinicopathologic parameters of NSCLC patients. |
Table III.
Associations between SP1 expression
and clinicopathologic parameters of NSCLC patients.
|
|
| SP1 expression |
|
|---|
|
|
|
|
|
|---|
| Parameters | No. of cases | Low | High |
P-valuea |
|---|
| Sex | Male (n=71) | 27 | 44 | 0.963 |
|
| Female (n=24) | 9 | 15 |
|
| Age (years) | <60 (n=28) | 10 | 18 | 0.821 |
|
| >60 (n=67) | 26 | 41 |
|
| Smoking | No (n=29) | 9 | 20 | 0.441 |
|
NSCLC | Yes (n=66) | 27 | 39 |
|
|
| No (n=24) | 9 | 15 | 0.769 |
|
LUAD | Yes (n=25) | 8 | 17 |
|
|
| No (n=5) | 0 | 5 | 0.041 |
|
LUSC | Yes (n=41) | 19 | 22 |
|
| Pathology | LUAD (n=49) | 17 | 32 | 0.533 |
|
| LUSC (n=46) | 19 | 27 |
|
|
Differentiation | Low (n=32) | 5 | 27 | 0.002 |
|
NSCLC | High (n=63) | 31 | 32 |
|
|
LUAD | Low (n=21) | 4 | 17 | 0.040 |
|
| High (n=28) | 13 | 15 |
|
|
LUSC | Low (n=11) | 1 | 10 | 0.016 |
|
| High (n=35) | 8 | 17 |
|
| T stage | T1+T2 (n=71) | 28 | 43 | 0.635 |
|
| T3+T4 (n=24) | 8 | 16 |
|
| Lymph node | Negative
(n=52) | 17 | 35 | 0.292 |
|
| Positive
(n=43) | 19 | 24 |
|
| TNM stage | I+II (N=67) | 24 | 43 | 0.643 |
|
| III (N=28) | 12 | 16 |
|
Results
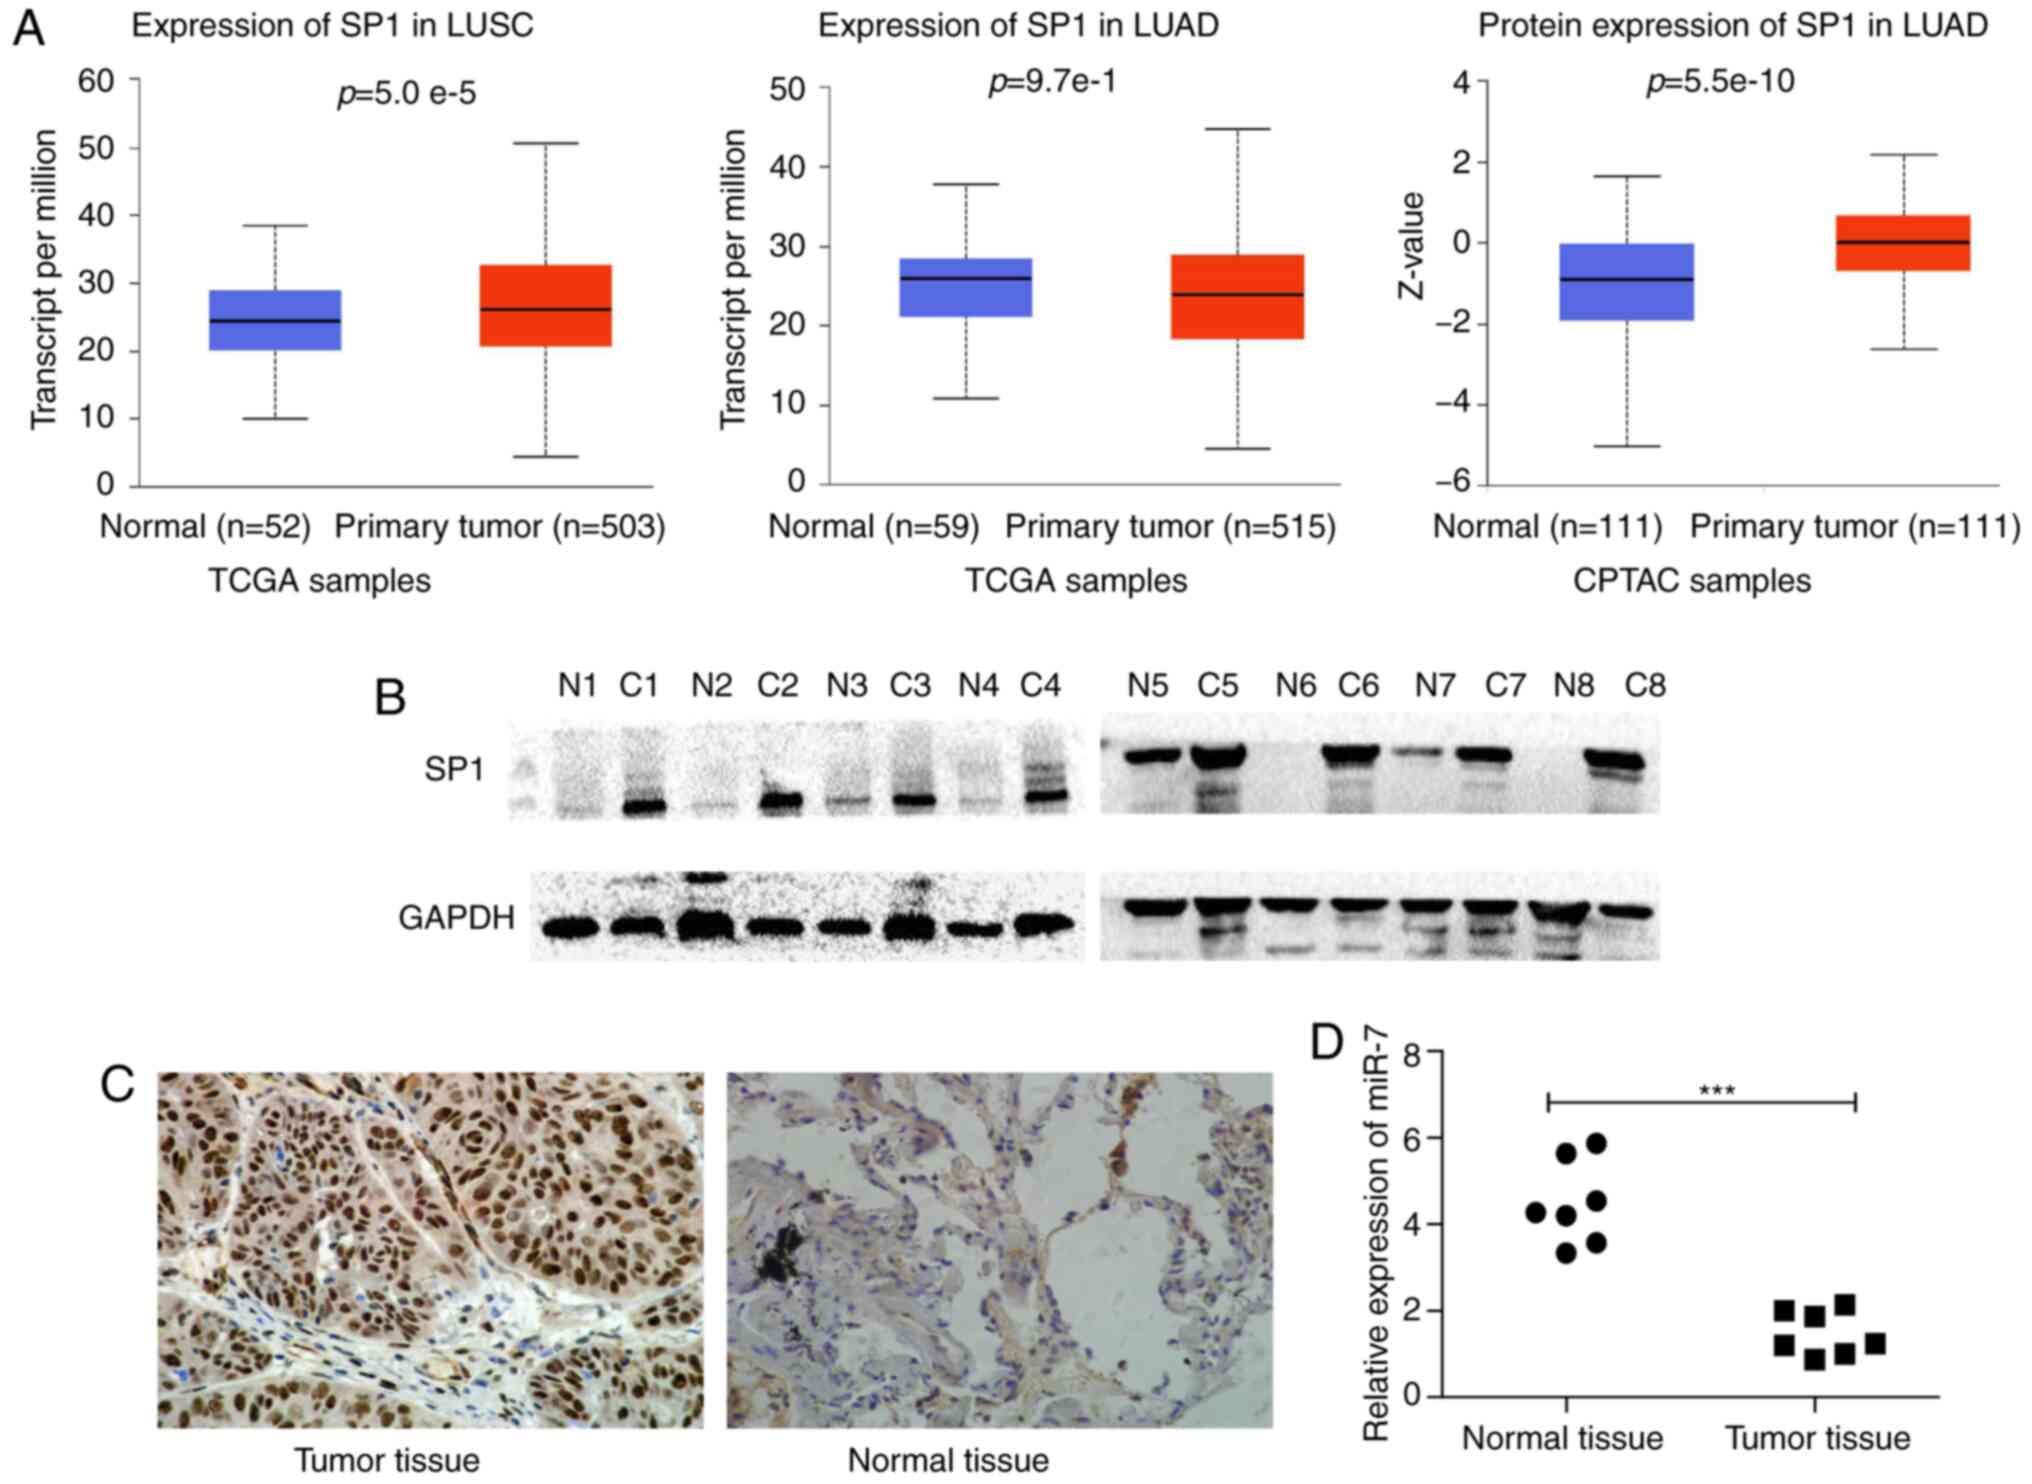
Expression and clinical
characteristics of SP1 in NSCLC
SP1 expression information obtained from UALCAN
revealed that SP1 was highly expressed in NSCLC tissues compared
with normal samples. (Fig. 1A). We
detected SP1 expression in 8 pairs of matched NSCLC and
paracancerous tissues by western blotting. SP1 expression in cancer
tissues was markedly higher than in paracancerous normal tissues
(Fig. 1B). Furthermore, SP1
expression in 95 pairs of paraffin-embedded NSCLC tissues was
detected by IHC and the results revealed that the expression of SP1
in NSCLC was significantly higher than that in normal tissues
(Fig. 1C). The expression of SP1 in
NSCLC (LUAD, LUSC or together) was significantly higher than that
in paracancerous tissues (Table
II).
According to SP1 expression, 95 patients with NSCLC
were divided into low and high groups. The results revealed that
the expression of SP1 was correlated with the degree of tumor
differentiation (LUAD P=0.040, LUSC P=0.016 and NSCLC P=0.002) and
with smoking the status in LUSC (P=0.041) (Table III).
SP1 emerges as a target of miR-7
Through bioinformatics analysis, SP1 was predicted
as a target of miR-7 in all five databases (miRanda, TargetScan,
PicTar, miRbase and RNAhybrid). It was also determined that miR-7
expression was low (Fig. 1D) and
SP1 expression was high (Fig. 1A-C)
in NSCLC tumor tissue compared to normal tissue. The predicted
binding site between miR-7 and the 3′UTR of SP1 included the
following bases: 1152–1159 and 4319–4325 (Fig. 2A). The wild-type (WT-3′UTR) and
mutant (MT-3′UTR) sequences of the SP1 3′UTR were cloned into a
luciferase plasmid, and the generated plasmids were transfected
into 293T cells to investigate whether the 3′UTR of SP1 was a
functional target of miR-7. As anticipated, miR-7 suppressed the
luciferase activity of SP1 WT-3′UTR, but it did not affect the
luciferase activity of SP1 MUT-3′UTR. These results indicated that
miR-7 directly acted on the 3′UTR of SP1, thereby playing a
negative role in regulating the expression of SP1 (Fig. 2B). At the first transfection, the
cells of the transfected NC group were compared with the blank
cells, and the expression levels of miR-7 (Fig. 2C) and SP1 (Figs. 2D and 3A) were examined. No statistical
differences in the expression of miR-7 were found compared with the
control blank, and no difference in the expression of SP1 in terms
of both mRNA and protein levels was identified. A549 and SK-MES-1
cells were transfected with miR-7 and miR-7 inhibitor, and the
transfection efficiency was assessed by qPCR (Fig. 2C). The SP1 expression was assessed
by qPCR (Fig. 3A) and western
blotting (Fig. 3B). Western
blotting and qPCR analyses revealed increased expression of SP1 in
miR-7-depleted cells and decreased expression of SP1 in
miR-7-overexpressing cells at the protein and mRNA levels. All data
indicated that SP1 is a downstream target of miR-7 in NSCLC
cells.
miR-7 increases the radiosensitivity
of NSCLC by suppressing tumor cell growth, migration and
invasion
The role of miR-7 in the radiosensitivity of NSCLC
cells was explored. miR-7-overexpressing A549 cells had decreased
clone formation compared with control cells after irradiation
(Fig. S1). The survival fractions
of miR-7-overexpressing A549 cells were markedly decreased after
irradiation (Fig. 4A, SER=1.54). In
contrast, inhibition of miR-7 increased the survival fraction
(Fig. 4A, SER=0.89). The CCK-8
assay (Fig. 4B and C),
wound-healing assay (Fig. 4D), and
Transwell invasion (Fig. 4E) assays
revealed that miR-7-overexpressing cells had decreased viability,
migration ability, and invasion ability compared with control cells
after irradiation. These findings indicated that miR-7 enhanced
radiosensitivity in NSCLC cells.
Knockdown of SP1 by shRNA increases
the radiosensitivity of NSCLC by suppressing tumor cell growth,
migration, and invasion
The role of SP1 in the radiosensitivity of NSCLC
cells was investigated. SP1-expressing and sh-SP1 lentiviral
vectors were transfected into A549 and SK-MES-1 cells, and the
transfection efficiency was assessed by qPCR (Fig. 5A) and western blotting (Fig. 5B). At the first transfection, the
cells of the transfected NC group were compared with the blank
cells, the expression levels of SP1 (Fig. 5A and C) were examined. No
statistical differences in the expression of SP1 in terms of mRNA
and protein levels were found. SP1-knockdown A549 cells had
decreased clone formation compared with control cells after
irradiation (Fig. S2). The
survival fractions of SP1-knockdown A549 cells were markedly
decreased after irradiation (Fig.
6A, SER=1.59). In contrast, overexpression of SP1 significantly
increased the survival fraction (Fig.
6A, SER=0.88). The CCK-8 (Fig. 6B
and C), wound-healing (Fig.
6D), and Transwell invasion (Fig.
6E) assays revealed that sh-SP1 cells had decreased viability,
migration ability, and invasion ability compared with control cells
after irradiation. The aforementioned findings indicated that the
depletion of SP1 enhanced radiosensitivity in NSCLC cells.
miR-7 suppresses the expression of the
DNA repair protein TP53BP1 by downregulating SP1
A549 and SK-MES-1 cells were transfected with miR-7,
miR-7 inhibitor, SP1, and sh-SP1, and TP53BP1 expression levels
were then assessed. The mRNA and protein expression levels of
TP53BP1 were decreased after overexpression of miR-7 or
downregulation of SP1 in both A549 and SK-MES-1 cells compared with
control cells. TP53BP1 expression increased with the inhibition of
miR-7 or the overexpression of SP1 (Fig. 7A-D). The correlation between SP1 and
TP53BP1 in LUAD, LUSC, and lung tissues from GEPIA revealed that
SP1 was correlated with TP53BP1 in lung cancer tissue (Fig. 7E). These finding indicated that the
miR-7-induced increase in radiosensitivity may occur, in part,
through the inhibition of SP1 and subsequent reduction of TP53BP1
expression.
Discussion
Radioresistance is a major issue in radiotherapy,
which is a primary method for treating malignant tumors, however,
the underlying reasons remain poorly understood. Numerous studies
supported that miRNAs mediate the radiosensitivity of cancer cells
by regulating target genes. In nasopharyngeal carcinoma cells,
miR-210 has been revealed to negatively regulate radiosensitivity
(33). In human cervical carcinoma
cells, miR-218 was revealed to promote radiation-induced apoptosis,
increasing the radiosensitivity (34). miR-214 promoted radiosensitivity by
inhibiting autophagy that was mediated by autophagy-related gene 12
(ATG12) in colorectal cancer (35).
In recent years, several studies have demonstrated that miR-7 plays
an antitumor role in tumorigenesis, including pancreatic (36), lung (7), thyroid (37), and gastric cancer (38). Concurrently, miR-7 has been revealed
to reduce the levels of EGFR and AKT by activating the
EGFR/PI3K/AKT signaling pathway, which delays radiation-induced DNA
DSBs and increases the radiosensitivity of A549 cells, laryngeal
squamous cell carcinoma SQ20B cells, breast cancer MDA-MB-468 cells
and malignant glioma U251 and U87 cells (9).
The present results revealed that miR-7 combined
with radiation had a significant inhibitory effect on NSCLC cell
proliferation, migration and invasion. miR-7 increased
radiosensitivity in NSCLC, suggesting that miR-7 may be a potential
target for assisting NSCLC radiotherapy. Notably, it was revealed
that miR-7 directly targeted SP1, which led to changes in the
expression of SP1 downstream genes, such as TP53BP1, in NSCLC
cells.
SP1 has been revealed to be aberrantly expressed and
activated in tumor tissues, and to participate in the regulation of
cancer cell biological functions, such as proliferation, invasion,
and angiogenesis (39). SP1 may
promote cancer progression by altering the expression of other
genes. For instance, Liu et al reported that SP1 binds to
the promoter region of lncRNA SNHG14, resulting in the
overexpression of lncRNA SNHG14 in clear cell renal carcinoma
(40). Zhang et al revealed
that the SP1-induced upregulation of the lncRNA LUCAT1 promoted
cervical cancer cell proliferation, migration and invasion
(41). SP1 is also a microRNA
target gene involved in the regulation of radiosensitivity. Kang
et al validated SP1 as a target gene of miR-24 and found
that the miR-24/SP1 pathway was involved in the regulation of cell
viability and radiosensitivity of nasopharyngeal carcinoma cells
(42). In their study, however, the
expression of SP1 in human nasopharyngeal carcinoma was not
studied, and they used transient transfection to overexpress the
microRNA and knock down SP1. In the present study, SP1 expression
was detected in NSCLC tissue and transfected cells with lentivirus
to obtain stably transfected cell lines. In the present study, SP1
was upregulated in NSCLC tissue and was related to the
differentiation degree of tumor tissue. Additionally, SP1 has been
revealed as a target of the DNA damage response pathway and may
play a role in modulating the cellular response to DNA damage
(11). It has been reported that
SP1 is involved in DSB repair through a mechanism that is
independent of its sequence-directed transcriptional effects. SP1
is rapidly recruited to the region immediately adjacent to sites of
DNA DSBs. Cells are more sensitive to DNA damage when SP1 is
depleted as they show a delayed resolution of γ-H2AX foci with an
accumulation of chromosomal abnormalities, suggesting that SP1
plays a role in DSB repair (12).
Proliferation, migration and invasion are important
for tumorigenesis, and play a vital role in influencing tumor
recurrence and metastasis (43–45).
Radiation affects tumor cells in numerous aspects, including cell
proliferation, colony formation, apoptosis rate, cell invasion, as
well as other biological responses (46,47).
The inhibition of tumor cell proliferation, migration and invasion
by radiotherapy is of great value for controlling the progression
of tumor cells (47,48). Therefore, to investigate the role of
miR-7 and SP1 combined with radiation in cell proliferation,
migration and invasion, cell proliferation, clonogenic, scratch
wound healing and Transwell invasion assays were performed.
Overexpression of miR-7 or depletion of SP1 inhibited the
proliferation, migration, and invasion of NSCLC, which was enhanced
by combination with irradiation.
Overexpression of miR-7 and silencing of SP1 had the
same radiosensitization effect. Therefore, miR-7 may increase the
X-ray sensitivity of NSCLC cells through the negative regulation of
SP1.
DSB repair is an essential protective pathway for
the genome to maintain stability after external injury, and it is
also the main pathway for the restoration of cancer cells after
radiotherapy and the main factor affecting the radiosensitivity of
tumor cells (49,50). TP53BP1 is one of the critical
regulatory proteins in DNA DSB repair, and it plays an essential
role in regulating damage repair balance and maintaining genomic
stability (51,52).
In the present study it was demonstrated that the
binding sites of miR-7 were in the 3′UTR of SP1 and that SP1 was
directly downregulated by miR-7. Upregulated/downregulated miR-7
and SP1 were evaluated to ascertain whether they could regulate
radiosensitivity. It was revealed that the radiosensitivity was
increased by upregulation of miR-7 or downregulation of SP1. The
results illustrated the relationship of miR-7 and SP1 with
radiosensitivity. Especially after miR-7 was
upregulated/downregulated, the mRNA and protein expression of SP1
inversely changed following miR-7 expression. The consequential
results, such as clonogenic formation, proliferation, migration and
invasion, were all altered following the transfection. However, we
did not perform rescue experiments, which is a limitation of our
study.
Concurrently, the binding sites of SP1 were
predicted in the promoter region of TP53BP1, and PCR and western
blot experiments confirmed the positive regulation of SP1 on
TP53BP1. Therefore, it was concluded that the overexpression of
miR-7 decreases the expression of SP1, downregulates the
transcription of TP53BP1, reduces TP53BP1 protein, and increases
the radiosensitivity of NSCLC.
miR-7 was revealed to increase the radiosensitivity
of human cancer cells. The present study focused not only on miR-7
but also on SP1. As a transcription factor, SP1 alters the
expression of downstream genes. The analysis of SP1 and TP53BP1 in
LUAD and LUSC from GEPIA revealed that SP1 was correlated with
TP53BP1 in lung cancer tissue. SP1, as a member of the SP
transcription factor family, contains a special zinc finger
DNA-binding domain. This zinc finger DNA-binding domain binds to
the promoter and enhancer regions at the sites with GC boxes,
thereby regulating numerous housekeeping genes (53). SP1 may regulate TP53BP1 by binding
to the zinc finger domain. Binding sites of SP1 were predicted in
the promoter region of TP53BP1, and PCR and western blot
experiments confirmed the positive regulation of TP53BP1 by SP1.
However, we did not perform a luciferase reporter assay to verify
the SP1-binding sites on TP53BP1, which is a limitation of the
present study.
In conclusion, it was revealed that miR-7 directly
targeted SP1 to increase radiosensitivity in NSCLC. Moreover, SP1
reduced radiosensitivity, in part, through the regulation of
TP53BP1. The results revealed that the miR-7/SP1/TP53BP1 axis may
play a pivotal role in NSCLC radiosensitivity.
Supplementary Material
Supporting Data
Acknowledgements
The authors thank all participating patients. We
would also like to thank Dr Zhou Yuan from the Department of
Thoracic Surgery at The Fourth Affiliated Hospital of China Medical
University for helping to collect the specimens as well as Dr Li
Hong and Dr Xu Huihui at the Department of Pathology of The Fourth
Affiliated Hospital of China Medical University for their help in
preparing and evaluating the specimens.
Funding
The present study was supported by grants from the
Clinical Capability Construction Project for Liaoning Provincial
Hospital (grant no. LNCCC-B08-2014), and the Youth Backbone Support
Program of China Medical University (grant no. QGZ2018064).
Availability of data and materials
Upon reasonable request, the datasets used in this
study can be obtained from the corresponding author.
Authors' contributions
YZ, YY, GG, and LL guided the study design,
performed analysis of data, interpreted data, and supervised of the
study. GG and GS performed most of the experiments and statistical
analysis. GG drafted the manuscript. LL, GS, and JW carried out the
experiments and sample collection. Each author revised the article
critically for important intellectual content. The final manuscript
was approved by all authors.
Ethics approval and consent to
participate
The Biomedical Ethics Committee of the Fourth
Affiliated Hospital of China Medical University approved the
present study (Institutional Review Board-approved protocol no.
2014-039). All relevant patients provided written informed consent.
The authors are responsible for all aspects of the work. It is
ensured that a proper investigation was performed and that issues
were resolved to ensure the accuracy and completeness of this
study.
Patient consent for publication
Not applicable.
Competing interests
The authors declare that they have no competing
interests.
References
|
1
|
Bray F, Ferlay J, Soerjomataram I, Siegel
RL, Torre LA and Jemal A: Global cancer statistics 2018: GLOBOCAN
estimates of incidence and mortality worldwide for 36 cancers in
185 countries. CA Cancer J Clin. 68:394–424. 2018. View Article : Google Scholar : PubMed/NCBI
|
|
2
|
Siegel RL, Miller KD and Jemal A: Cancer
statistics, 2018. CA Cancer J Clin. 68:7–30. 2018. View Article : Google Scholar : PubMed/NCBI
|
|
3
|
Koh PK, Faivre-Finn C, Blackhall FH and De
Ruysscher D: Targeted agents in non-small cell lung cancer (NSCLC):
Clinical developments and rationale for the combination with
thoracic radiotherapy. Cancer Treat Rev. 38:626–640. 2012.
View Article : Google Scholar : PubMed/NCBI
|
|
4
|
Chen K and Rajewsky N: The evolution of
gene regulation by transcription factors and microRNAs. Nat Rev
Genet. 8:93–103. 2007. View
Article : Google Scholar : PubMed/NCBI
|
|
5
|
Redis RS, Berindan-Neagoe I, Pop VI and
Calin GA: Non-coding RNAs as theranostics in human cancers. J Cell
Biochem. 113:1451–1459. 2012.PubMed/NCBI
|
|
6
|
Cherni I and Weiss GJ: miRNAs in lung
cancer: Large roles for small players. Future Oncol. 7:1045–1055.
2011. View Article : Google Scholar : PubMed/NCBI
|
|
7
|
Xiong S, Zheng Y, Jiang P, Liu R, Liu X,
Qian J, Gu J, Chang L, Ge D and Chu Y: PA28gamma emerges as a novel
functional target of tumour suppressor microRNA-7 in non-small-cell
lung cancer. Br J Cancer. 110:353–362. 2014. View Article : Google Scholar : PubMed/NCBI
|
|
8
|
Su C, Han Y, Zhang H, Li Y, Yi L, Wang X,
Zhou S, Yu D, Song X, Xiao N, et al: CiRS-7 targeting miR-7
modulates the progression of non-small cell lung cancer in a manner
dependent on NF-κB signalling. J Cell Mol Med. 22:3097–3107. 2018.
View Article : Google Scholar : PubMed/NCBI
|
|
9
|
Lee KM, Choi EJ and Kim IA: microRNA-7
increases radiosensitivity of human cancer cells with activated
EGFR-associated signaling. Radiother Oncol. 101:171–176. 2011.
View Article : Google Scholar : PubMed/NCBI
|
|
10
|
Yano S, Kondo K, Yamaguchi M, Richmond G,
Hutchison M, Wakeling A, Averbuch S and Wadsworth P: Distribution
and function of EGFR in human tissue and the effect of EGFR
tyrosine kinase inhibition. Anticancer Res. 23:3639–3650.
2003.PubMed/NCBI
|
|
11
|
Beishline K, Kelly CM, Olofsson BA, Koduri
S, Emrich J, Greenberg RA and Azizkhan-Clifford J: Sp1 facilitates
DNA double-strand break repair through a nontranscriptional
mechanism. Mol Cell Biol. 32:3790–3799. 2012. View Article : Google Scholar : PubMed/NCBI
|
|
12
|
Olofsson BA, Kelly CM, Kim J, Hornsby SM
and Azizkhan-Clifford J: Phosphorylation of Sp1 in response to DNA
damage by ataxia telangiectasia-mutated kinase. Mol Cancer Res.
5:1319–1330. 2007. View Article : Google Scholar : PubMed/NCBI
|
|
13
|
Iwahori S, Yasui Y, Kudoh A, Sato Y,
Nakayama S, Murata T, Isomura H and Tsurumi T: Identification of
phosphorylation sites on transcription factor Sp1 in response to
DNA damage and its accumulation at damaged sites. Cell Signal.
20:1795–1803. 2008. View Article : Google Scholar : PubMed/NCBI
|
|
14
|
Luo J, Wang X, Xia Z, Yang L, Ding Z, Chen
S, Lai B and Zhang N: Transcriptional factor specificity protein 1
(SP1) promotes the proliferation of glioma cells by up-regulating
midkine (MDK). Mol Biol Cell. 26:430–439. 2015. View Article : Google Scholar : PubMed/NCBI
|
|
15
|
Yang WJ, Song MJ, Park EY, Lee JJ, Park
JH, Park K, Park JH and Kim HP: Transcription factors Sp1 and Sp3
regulate expression of human ABCG2 gene and chemoresistance
phenotype. Mol Cells. 36:368–375. 2013. View Article : Google Scholar : PubMed/NCBI
|
|
16
|
Schultz LB, Chehab NH, Malikzay A and
Halazonetis TD: P53 binding protein 1 (53bp1) is an early
participant in the cellular response to DNA double-strand breaks. J
Cell Biol. 151:1381–1390. 2000. View Article : Google Scholar : PubMed/NCBI
|
|
17
|
Rappold I, Iwabuchi K, Date T and Chen J:
Tumor suppressor p53 binding protein 1 (53BP1) is involved in DNA
damage-signaling pathways. J Cell Biol. 153:613–620. 2001.
View Article : Google Scholar : PubMed/NCBI
|
|
18
|
Yang XX, Ma M, Sang MX, Zhang XY, Liu ZK,
Song H and Zhu SC: BMI-1 suppression increases the radiosensitivity
of oesophageal carcinoma via the PI3K/Akt signaling pathway. Oncol
Rep. 39:667–678. 2018.PubMed/NCBI
|
|
19
|
Wingender E, Schoeps T, Haubrock M, Krull
M and Dönitz J: TFClass: Expanding the classification of human
transcription factors to their mammalian orthologs. Nucleic Acids
Res. 46:D343–D347. 2018. View Article : Google Scholar : PubMed/NCBI
|
|
20
|
Kay FU, Kandathil A, Batra K, Saboo SS,
Abbara S and Rajiah P: Revisions to the tumor, node, metastasis
staging of lung cancer (8th edition): Rationale, radiologic
findings and clinical implications. World J Radiol. 9:269–279.
2017. View Article : Google Scholar : PubMed/NCBI
|
|
21
|
Travis WD: The 2015 WHO classification of
lung tumors. Pathologe. 35 (Suppl 2):1882014. View Article : Google Scholar : PubMed/NCBI
|
|
22
|
Livak KJ and Schmittgen TD: Analysis of
relative gene expression data using real-time quantitative PCR and
the 2(-Delta Delta C(T)) method. Methods. 25:402–408. 2001.
View Article : Google Scholar : PubMed/NCBI
|
|
23
|
Chandrashekar DS, Bashel B, Balasubramanya
SAH, Creighton CJ, Ponce-Rodriguez I, Chakravarthi BVSK and
Varambally S: UALCAN: A portal for facilitating tumor subgroup gene
expression and survival analyses. Neoplasia. 19:649–658. 2017.
View Article : Google Scholar : PubMed/NCBI
|
|
24
|
Tang Z, Li C, Kang B, Gao G, Li C and
Zhang Z: GEPIA: A web server for cancer and normal gene expression
profiling and interactive analyses. Nucleic Acids Res. 45:W98–W102.
2017. View Article : Google Scholar : PubMed/NCBI
|
|
25
|
Lewis BP, Burge CB and Bartel DP:
Conserved seed pairing, often flanked by adenosines, indicates that
thousands of human genes are microRNA targets. Cell. 120:15–20.
2005. View Article : Google Scholar : PubMed/NCBI
|
|
26
|
Chen K and Rajewsky N: Natural selection
on human microRNA binding sites inferred from SNP data. Nat Genet.
38:1452–1456. 2006. View
Article : Google Scholar : PubMed/NCBI
|
|
27
|
Rehmsmeier M, Steffen P, Hochsmann M and
Giegerich R: Fast and effective prediction of microRNA/target
duplexes. RNA. 10:1507–1517. 2004. View Article : Google Scholar : PubMed/NCBI
|
|
28
|
Betel D, Wilson M, Gabow A, Marks DS and
Sander C: The microRNA.org resource: Targets and expression.
Nucleic Acids Res. 36:D149–D153. 2008. View Article : Google Scholar : PubMed/NCBI
|
|
29
|
Griffiths-Jones S, Grocock RJ, van Dongen
S, Bateman A and Enright AJ: miRBase: MicroRNA sequences, targets
and gene nomenclature. Nucleic Acids Res. 34:D140–D144. 2006.
View Article : Google Scholar : PubMed/NCBI
|
|
30
|
Cui X, Xiao D, Cui Y and Wang X:
Exosomes-derived long non-coding RNA HOTAIR reduces laryngeal
cancer radiosensitivity by regulating microRNA-454-3p/E2F2 axis.
Onco Targets Ther. 12:10827–10839. 2019. View Article : Google Scholar : PubMed/NCBI
|
|
31
|
Du M, Wang J, Chen H, Wang S, Chen L, Xu
Y, Su F and Lu X: MicroRNA-200a suppresses migration and invasion
and enhances the radiosensitivity of NSCLC cells by inhibiting the
HGF/c-Met signaling pathway. Oncol Rep. 41:1497–1508.
2019.PubMed/NCBI
|
|
32
|
Lin RK, Wu CY, Chang JW, Juan LJ, Hsu HS,
Chen CY, Lu YY, Tang YA, Yang YC, Yang PC and Wang YC:
Dysregulation of p53/Sp1 control leads to DNA methyltransferase-1
overexpression in lung cancer. Cancer Res. 70:5807–5817. 2010.
View Article : Google Scholar : PubMed/NCBI
|
|
33
|
Li BY, Luo Y, Zhao WS, Zhang L, Zhou HJ,
Zou YC and Zhang T: MicroRNA-210 negatively regulates the
radiosensitivity of nasopharyngeal carcinoma cells. Mol Med Rep.
16:1401–1408. 2017. View Article : Google Scholar : PubMed/NCBI
|
|
34
|
Yuan W, Xiaoyun H, Haifeng Q, Jing L,
Weixu H, Ruofan D, Jinjin Y and Zongji S: MicroRNA-218 enhances the
radiosensitivity of human cervical cancer via promoting radiation
induced apoptosis. Int J Med Sci. 11:691–696. 2014. View Article : Google Scholar : PubMed/NCBI
|
|
35
|
Hu JL, He GY, Lan XL, Zeng ZC, Guan J,
Ding Y, Qian XL, Liao WT, Ding YQ and Liang L: Inhibition of
ATG12-mediated autophagy by miR-214 enhances radiosensitivity in
colorectal cancer. Oncogenesis. 7:162018. View Article : Google Scholar : PubMed/NCBI
|
|
36
|
Xia J, Cao T, Ma C, Shi Y, Sun Y, Wang ZP
and Ma J: miR-7 suppresses tumor progression by directly targeting
MAP3K9 in pancreatic cancer. Mol Ther Nucleic Acids. 13:121–132.
2018. View Article : Google Scholar : PubMed/NCBI
|
|
37
|
Yue K, Wang X, Wu Y, Zhou X, He Q and Duan
Y: microRNA-7 regulates cell growth, migration and invasion via
direct targeting of PAK1 in thyroid cancer. Mol Med Rep.
14:2127–2134. 2016. View Article : Google Scholar : PubMed/NCBI
|
|
38
|
Zhao X, Dou W, He L, Liang S, Tie J, Liu
C, Li T, Lu Y, Mo P, Shi Y, et al: MicroRNA-7 functions as an
anti-metastatic microRNA in gastric cancer by targeting
insulin-like growth factor-1 receptor. Oncogene. 32:1363–1372.
2013. View Article : Google Scholar : PubMed/NCBI
|
|
39
|
Chang WC and Hung JJ: Functional role of
post-translational modifications of Sp1 in tumorigenesis. J Biomed
Sci. 19:942012. View Article : Google Scholar : PubMed/NCBI
|
|
40
|
Liu G, Ye Z, Zhao X and Ji Z: SP1-induced
up-regulation of lncRNA SNHG14 as a ceRNA promotes migration and
invasion of clear cell renal cell carcinoma by regulating N-WASP.
Am J Cancer Res. 7:2515–2525. 2017.PubMed/NCBI
|
|
41
|
Zhang L, Liu SK, Song L and Yao HR:
SP1-induced up-regulation of lncRNA LUCAT1 promotes proliferation,
migration and invasion of cervical cancer by sponging miR-181a.
Artif Cells Nanomed Biotechnol. 47:556–564. 2019.PubMed/NCBI
|
|
42
|
Kang M, Xiao J, Wang J, Zhou P, Wei T,
Zhao T and Wang R: MiR-24 enhances radiosensitivity in
nasopharyngeal carcinoma by targeting SP1. Cancer Med. 5:1163–1173.
2016. View Article : Google Scholar : PubMed/NCBI
|
|
43
|
Li R, Peng C, Zhang X, Wu Y, Pan S and
Xiao Y: Roles of Arf6 in cancer cell invasion, metastasis and
proliferation. Life Sci. 182:80–84. 2017. View Article : Google Scholar : PubMed/NCBI
|
|
44
|
Yilmaz M and Christofori G: Mechanisms of
motility in metastasizing cells. Mol Cancer Res. 8:629–642. 2010.
View Article : Google Scholar : PubMed/NCBI
|
|
45
|
Banyard J, Chung I, Migliozzi M, Phan DT,
Wilson AM, Zetter BR and Bielenberg DR: Identification of genes
regulating migration and invasion using a new model of metastatic
prostate cancer. BMC Cancer. 14:3872014. View Article : Google Scholar : PubMed/NCBI
|
|
46
|
Duan XM, Liu XN, Li YX, Cao YQ, Silayiding
A, Zhang RK and Wang JP: MicroRNA-498 promotes proliferation,
migration, and invasion of prostate cancer cells and decreases
radiation sensitivity by targeting PTEN. Kaohsiung J Med Sci.
35:659–671. 2019. View Article : Google Scholar : PubMed/NCBI
|
|
47
|
Pordanjani SM and Hosseinimehr SJ: The
role of NF-κB inhibitors in cell response to radiation. Curr Med
Chem. 23:3951–3963. 2016. View Article : Google Scholar : PubMed/NCBI
|
|
48
|
Yan J, Jiang Y, Lu J, Wu J and Zhang M:
Inhibiting of proliferation, migration, and invasion in lung cancer
induced by silencing interferon-induced transmembrane protein 1
(IFITM1). Biomed Res Int. 2019:90854352019. View Article : Google Scholar : PubMed/NCBI
|
|
49
|
Scully R, Panday A, Elango R and Willis
NA: DNA double-strand break repair-pathway choice in somatic
mammalian cells. Nat Rev Mol Cell Biol. 20:698–714. 2019.
View Article : Google Scholar : PubMed/NCBI
|
|
50
|
Jeggo PA and Löbrich M: How cancer cells
hijack DNA double-strand break repair pathways to gain genomic
instability. Biochem J. 471:1–11. 2015. View Article : Google Scholar : PubMed/NCBI
|
|
51
|
Iwabuchi K, Li B, Massa HF, Trask BJ, Date
T and Fields S: Stimulation of p53-mediated transcriptional
activation by the p53-binding proteins, 53BP1 and 53BP2. J Biol
Chem. 273:26061–26068. 1998. View Article : Google Scholar : PubMed/NCBI
|
|
52
|
Bunting SF, Callén E, Wong N, Chen HT,
Polato F, Gunn A, Bothmer A, Feldhahn N, Fernandez-Capetillo O, Cao
L, et al: 53BP1 inhibits homologous recombination in
Brca1-deficient cells by blocking resection of DNA breaks. Cell.
141:243–254. 2010. View Article : Google Scholar : PubMed/NCBI
|
|
53
|
Lee JA, Suh DC, Kang JE, Kim MH, Park H,
Lee MN, Kim JM, Jeon BN, Roh HE, Yu MY, et al: Transcriptional
activity of Sp1 is regulated by molecular interactions between the
zinc finger DNA binding domain and the inhibitory domain with
corepressors, and this interaction is modulated by MEK. J Biol
Chem. 280:28061–28071. 2005. View Article : Google Scholar : PubMed/NCBI
|