Introduction
Esophageal cancer (ESCA), as a complex disease
harboring numerous pathogenic factors, is the sixth leading cause
of cancer-associated death worldwide (1). There are two main histological types,
including esophageal squamous cell carcinoma (ESCC) and esophageal
adenocarcinoma, which exhibit completely distinct geographical
distributions and primary risk factors (2). Patients with ESCC account for >90%
of all patients with ESCA in China (3). The prognosis of patients with ESCA
remains poor, with a 5-year survival rate of only 25% (4), which is primarily due to the
late-stage at diagnosis and distant metastasis. Thus, there is an
urgent requirement to identify novel prognostic markers and new
molecular targets to improve the prognosis and therapeutic efficacy
in patients with ESCC.
Long non-coding (lnc)RNAs are considered to be a
novel class of transcripts, that are >200 nucleotides in length,
do not have any protein-coding potential (5), and are typically transcribed by RNA
polymerase II, which mirrors that of protein-coding genes (6). Currently, lncRNAs consist of five
different molecular types according to their genomic location on
the chromosome, including sense, antisense, intronic, intergenic
and bidirectional lncRNAs (7–9).
lncRNAs have been associated with the regulation of numerous
essential biological processes, such as allosterically manipulating
enzymatic activity, shaping chromosome conformation, functioning as
regulators of histone methylation and imprinting genomic loci
(9–11). Recently, lncRNAs have been
associated with tumor initiation, progression and metastasis
(12,13), and play important roles in the
survival, growth, differentiation, apoptosis and regulating signal
pathways in a number of tumors (14–18).
Notably, lncRNAs have been found to be novel prognostic markers and
therapeutic targets for numerous types of cancer (19,20).
Prostate androgen regulated transcript 1 (PART1) is predominately
expressed in the prostate and is transcriptionally regulated by
androgens in prostate cancer cells (21). At present, PART1, as a novel lncRNA,
has been associated with tumor progression, metastasis and
chemotherapy resistance (22,23).
In addition, PART1 has been found to be involved in the regulation
of several signaling pathways, such as the PTEN/AKT signaling
pathway (24), the microRNA
(miR)-150-5p/LRG1 axis (22) and
the miR-429/SHCBP1 regulatory network (25), suggesting that targeting PART1 may
be a novel and promising therapeutic strategy in patients with
cancer. Therefore, elucidation of the function of PART1 and its
molecular mechanisms, may provide further understanding and enable
treatment in a clinical setting for different types of cancer.
However, to date, the functions and molecular mechanisms of PART1
in ESCC remain unclear.
Recently, forkhead box protein P2 (FOXP2) has been
verified to be a tumor suppressor (26). Notably, FOXP2 suppresses the
transcriptional activity of numerous downstream target genes, via
its zinc finger domain, further affecting tumor progression
(26,27). In addition, FOXP2 was found to be
essential for the suppression of cell growth by regulating p21 in
osteosarcoma cells (28). These
findings suggest that FOXP2 may function as a key regulator in
various types of cancer by regulating its target genes.
In the present study, the expression level of PART1
in ESCC tissues and cells was investigated, and the clinical value
of PART1 in TNM stage, lymph node metastasis and the prognosis of
patients with ESCC was also determined. In addition, FOXP2 was
found to be a transcription factor, that regulated the expression
level of PART1 by binding to its promoter region and acted as a
competing endogenous (ce)RNA by sponging miR-18a-5p to promote the
expression level of SRY-box transcription factor 6 (SOX6), which
further triggered the inactivation of the β-catenin/c-myc signal
axis, resulting in the suppression of cell proliferation and
invasion in ESCC. Collectively, the PART1/miR-18a-5p/SOX6/β-catenin
signaling axis uncovered in the present study may be a novel
therapeutic target for patients with ESCC.
Materials and methods
Bioinformatics analysis
The GEO GSE111011 dataset (https://www.ncbi.nlm.nih.gov/gds/?term=GSE111011)
was downloaded to analyze the levels of PART1 and SOX6 in patients
with ESCC, from tumor and paired normal samples. The GEO GSE43732
(29) was used to investigate the
miR-18a-5p expression in ESCC samples. The StarBase online database
v2.0 (30) was also used to
investigate the levels of PART1 and miR-18a-5p in patients with
ESCA and in normal samples. Correlation analysis between PART1 and
SOX6, as well as the prognostic value of SOX6 was also examined
using the StarBase database. The upstream promoter sequence of
PART1 was detected using the promoter analysis tools, UCSC
(http://genome.ucsc.edu/) and JASPAR 2020
(http://jaspar.genereg.net/), while the
lncATLAS online software (http://lncatlas.crg.eu/) was used to predict the
subcellular localization of PART1. Targetscan and miRDB online
software programs were used to predict the possible binding sites
of miR-18a-5p in the SOX6 3′-untranslated region (UTR).
Tissue samples
A total of 75 ESCC samples and paired adjacent
normal tissues were obtained from the Affiliated Cancer Hospital of
Zhengzhou University (Henan, China) from 2015 to 2019, including 49
males and 26 females; 40 cases ≥60 years of age, and 35 cases
<60 years. Tissue samples were confirmed using hematoxylin and
eosin staining by experienced pathologists from the Affiliated
Cancer Hospital of Zhengzhou University (Henan, China). Informed
consent was provided by each patient and the utilization of all the
samples was approved by the Research and Ethics Committee of the
Affiliated Cancer Hospital of Zhengzhou University (Henan, China)
(approval no. 2019016).
Cell lines and cell culture
The human ESCC cell lines (Eca109, EC9706, TE1,
KYSE70 and KYSE450) and the normal Het-1A esophageal epithelial
cell line were purchased from the Chinese Academy of Sciences Cell
Bank, and were cultured in RMPI-1640 medium, supplemented with 10%
fetal bovine serum (FBS) (Gibco; Invitrogen; Thermo Fisher
Scientific, Inc.) in a humidified incubator with 5%
CO2.
Cell transfection
Small interfering (si)RNAs (50 nM) (Table I), miR-18a-5p mimic (50 nM, forward
(F), 5′-UAAGGUGCAUCUAGUGCAGAUAG-3′ and reverse (R),
5′-AUCUGCACUAGAUGCACCUUAUU-3′); negative control (NC, F,
5′-UUCUCCGAACGUGUCACGUTT-3′ and R, 5′-ACGUGACACGUUCGGAGAATT-3′);
miR-18a-5p inhibitor (50 nM, 5′-CUAUCUGACUAGAUGCACCUUA-3′); NC
inhibitor (50 nM, 5′-UUCUCCGAACGUGUCACGUTT-3′) (Shanghai
GenePharma, Co., Ltd.), pcDNA3.1 (2.5 µg), and
pcDNA3.1-PART1/FOXP2/SOX6 (2.5 µg) (TsingKe Biological Technology)
were transfected into the Eca109 and EC9706 cell lines when cells
reached approximately 80% confluence using Lipofectamine™ 2000
(Invitrogen; Thermo Fisher Scientific, Inc.) at room temperature
for about 20 min according to the manufacturer's instructions. The
subsequent experiment was performed 48 h after transfection.
 | Table I.Sequences of the siRNA and si-NC used
for synthesis. |
Table I.
Sequences of the siRNA and si-NC used
for synthesis.
| siRNAs | Sense (5′-3′) | Antisense
(5′-3′) |
|---|
| PART1 siRNA#1 |
GAGUUGACUUUGUGUUAUACA |
UAUAACACAAAGUCAACUCUG |
| PART1 siRNA#2 |
GGUGUGAAAUAAAGGUUAAUG |
UUAACCUUUAUUUCACACCUU |
| PART1 siRNA#3 |
GAAAGUUGUUGAAUAUAAACU |
UUUAUAUUCAACAACUUUCAU |
| FOXP2 siRNA#1 |
CGACAGAGACAAUAAGCAACA |
UUGCUUAUUGUCUCUGUCGCA |
| FOXP2 siRNA#2 |
GGCUAGACCUCACUACUAACA |
UUAGUAGUGAGGUCUAGCCCU |
| FOXP2 siRNA#3 |
GCAGCAACAACAACAACAACA |
UUGUUGUUGUUGUUGCUGCUG |
| SOX6 siRNA#1 |
GGAUCUCGCUGGAAAUCAAUG |
UUGAUUUCCAGCGAGAUCCUA |
| SOX6 siRNA#2 |
AGAACAGAUUGCGAGACAACA |
UUGUCUCGCAAUCUGUUCUUG |
| SOX6 siRNA#3 |
GAAUGGAAUCAGAGAAUAAUA |
UUAUUCUCUGAUUCCAUUCUU |
| Si-NC |
UUCUCCGAACGUGUCACGUTT |
ACGUGACACGUUCGGAGAATT |
Cell counting Kit-8 (CCK-8) assay
Cell proliferation of the ESCC cell lines, with
various treatments was performed in triplicate according to the
manufacturer's protocol, then the ESCC cells (~2,000 cells/well)
were seeded into a 96-well plate. At the time of measurement, CCK-8
reagent (Beyotime Institute of Biotechnology) was added to the
corresponding wells, and the absorbance (450 nm) was measured using
a microplate reader (Thermo Fisher Scientific, Inc.).
Matrigel assay
Cell invasion was investigated using a Transwell
chamber harboring Matrigel (BD Biosciences). Briefly, the Eca109
and EC9706 cell lines (1×10⁵) were added to the upper
layer of the chamber and 20% FBS was added to the lower chamber.
Afterwards, the invasive cells were fixed with methanol, followed
by staining with 0.1% crystal violet at room temperature for 15
min, 48 h following transfection. Finally, the number of invasive
cells was determined at ×200 magnification under a light microscope
(Leica, Germany). The results were from three independent repeated
experiments.
Reverse transcription-quantitative PCR
(RT-qPCR)
Total RNA was isolated using TRIzol®
(Invitrogen; Thermo Fisher Scientific, Inc.) according to the
manufacturer's instructions. For PART1, SOX6 and FOXP2 expression
analysis, RT-qPCR was performed using the Quant One-Step RT-qPCR
kit (SYBR Green, FP303) (Tiangen Biotech Co., Ltd.) and an ABI 7500
series PCR machine (Applied Biosystems; Thermo Fisher Scientific,
Inc.), with the following specific primers: PART1 forward,
5′-CCAGAGCCAGCCAATCACTT-3′ and reverse 5′-CTGTCCTTTTCCCCTCCGAC-3′;
SOX6 forward, 5′-AAGATGCAGAGGGAGGTGC-3′ and reverse,
5′-GGTTGCTTCTCCTGGTTGGA-3′; FOXP2 forward,
5′-GCAGCCAATTAGATGCTGGC-3′ and reverse 5′-ATCATGGCCACTGACACAGG-3′,
GAPDH forward, 5′-CGGAGTCAACGGATTTGGTCGTAT-3′; and reverse
5′-AGCCTTCTCCATGGTGGTGAAGAC-3′). PCR reaction conditions were as
follows: 95°C for 30 sec, 30 cycles (95°C for 5 sec, 50°C for 30
sec, and 72°C for 30 sec). For the miR-18a-5p assay, total RNA was
reverse transcribed using the miRcute Plus miRNA First-Strand cDNA
kit (cat. no. KR211; Tiangen Biotech Co., Ltd.). RT-qPCR for
miR-18a-5p was performed using the miRcute Plus miRNA qPCR kit
(SYBR Green) (FP411; Tiangen Biotech Co., Ltd.) using the following
specific forward primers, with the reverse primers from the kit:
miR-18a-5p forward, 5′-TAAGGTGCATCTAGTGCAGATAG-3′; and U6 forward,
5′-CTCGCTTCGGCAGCACA-3′). PCR reaction conditions were as follows:
95°C for 15 min in one cycle, 40 cycles (95°C for 5 sec, 60°C for
30 sec). The experiments were normalized to U6. Relative gene
expression was analyzed using the 2−∆∆Cq method
(31). The results were from three
independent repeated experiments.
Subcellular fractionation
A cell nucleus and cytoplasm RNA isolation kit
(Beibei, Biotech, Co., Ltd.) was used to extract the nuclear and
cytoplasmic RNA, respectively, according to the manufacturer's
instructions. Then, RT-qPCR was performed to detect the levels of
PART1, U6 and GAPDH. The results were from three independent
repeated experiments.
Promoter activity assay
The fragments, containing wild-type (WT) or mutant
(MUT) binding sites of FOXP2 in the PART1 transcript were
constructed using the pGL3-basic vector (Promega Corp.). The
pGL3-PART1-promoter-WT and pGL3-PART1-promoter-MUT vectors along
with pcDNA3.1 and pcDNA3.1-FOXP2 were transfected into the Eca109
and EC9706 cell lines. Luciferase activity was determined 48 h
following transfection using a Luciferase Reporter Assay System
(Promega, Corp.). The results were from three independent repeated
experiments.
Dual-luciferase reporter assay
A dual-luciferase reporter assay system was
performed to investigate the interaction between miR-18a-5p and
PART1 or SOX6 in the Eca109 and EC9706 cell lines. Recombinant
vectors, pmirGLO-PART1-WT and pmirGLO-PART1-MUT, as well as
pmirGLO-SOX6-WT and pmirGLO-SOX6-MUT (TsingKe Biological
Technology) along with the miR-18a-5p mimic and NC mimic were
transfected into the Eca109 and EC9706 cell lines using
Lipofectamine™ 2000, respectively. Luciferase activity was
determined using the Dual-Luciferase Reporter Assay System (Promega
Corp.), 48 h following transfection, according to the
manufacturer's protocol. The results were from three independent
repeated experiments.
RNA immunoprecipitation (RIP)
A RIP assay was performed in the Eca109 and EC9706
cell lines using a RNA-binding protein IP kit (EMD Millipore)
according to the manufacturer's protocol. Briefly, RIP lysates were
prepared from the Eca109 and EC9706 cell lines transfected with
miR-18a-5p mimic or NC mimic, and then subjected to IP using either
5 µl normal mouse IgG or 5 µl anti-ago2 antibody and the Mana RIP™
RNA-binding Protein IP kit. PART1 and miR-18a-5p enriched on the
beads was determined using RT-qPCR and corresponding specific
primers. The results were from three independent repeated
experiments.
Western blot analysis
Total proteins were extracted from the ESCC cell
lines using RIPA lysis (Beijing Solarbio Science and Technology
Co., Ltd.), while the concentration was measured using the Bradford
method. The proteins were separated using 10% SDS-PAGE, transferred
to PVDF membranes (EMD Millipore), and then blocked with skimmed
milk and incubated with primary antibodies against SOX6 (cat. no.
ab84880), β-catenin (cat. no. ab22656), c-myc (cat. no. ab17355)
and β-actin (cat. no. ab8226) (1:200 dilution, Abcam) overnight at
room temperature. Subsequently, the membrane was incubated with the
secondary antibody (cat. no. TA130005) (1:5,000 dilution, OriGene
Technologies, Inc.). Finally, enhanced chemiluminescence reagents
(Beyotime Institutes of Biotechnology) were used to develop the
protein signal. The quantification of the blots was analyzed using
ImageJ software (v.1.8.0) (National Institutes of Health, USA). The
data were from three independent repeated experiments.
Statistical analysis
GraphPad Prism v8.0 software (GraphPad Software,
Inc.) was used to analyze all the experimental data. Data are
presented as the mean with standard deviation. The association
between PART1, SOX6 and miR-18a-5p and the clinicopathological
features of the ESCC cases were determined using a χ2
test. High and low expression was based on the median value. When
the expression level was more than the median value, the level was
defined as high expression; when the expression level was less than
the median value, low expression was indicated. Spearman was used
to investigate the non-parametric data, and Pearson was performed
to analyze the parametric data. Survival analysis was performed
using the log-rank test, and survival curves were drawn using
Kaplan-Meier. For the matched samples, the data were analyzed using
Wilcoxon signed rank, and for non-matched samples, the data were
compared by Mann-Whitney test. Comparison between two groups was
determined using a Student's t-test, and the comparison of >3
groups was determined using one-way ANOVA, and then Bonferroni test
was selected for further statistical assay when data sets contained
>3 groups. P<0.05 was considered to indicate a statistically
significant difference.
Results
Low expression level of PART1 and SOX6
in ESCC tissues and cells is associated with prognosis in the
patients with ESCC
To investigate the level of PART1 and SOX6 in ESCC
tissues and cells, as well as their clinical value, The Cancer
Genome Atlas (TCGA) database, and the GEO dataset were analyzed.
The data from TCGA database and GEO dataset revealed that the level
of PART1 in ESCA tissues was significantly lower compared with that
in normal tissues (P<0.05) (Fig. 1A
and B), which was further verified using RT-qPCR in 75 ESCC
samples and matched adjacent normal samples (P<0.0001) (Fig. 1C). In addition, the GEO GSE111011
dataset revealed that ESCC tissues exhibited lower SOX6 mRNA
expression levels compared with that in paired adjacent normal
tissues (P<0.001) (Fig. 1D), and
similar results were found using RT-qPCR in 75 ESCC samples and
matched adjacent normal samples (P<0.0001) (Fig. 1E). Furthermore, RT-qPCR demonstrated
that the ESCC cell lines (Eca109, EC9706, TE1, KYSE70 and KYSE450)
had significantly lower levels of PART1 and SOX6 compared with
those in the Het-1A normal esophageal epithelial cell line
(P<0.01) (Fig. 1F and G).
Correlation analysis showed that PART1 expression level was
positively correlated with SOX6 expression level in ESCA tissues
(Fig. 1H and I). To further
determine the association between PART1 and SOX6 levels with
prognosis in patients with ESCC, a log-rank test was used. The
results revealed that patients with low levels of PART1 and SOX6
exhibited shorter survival times compared with those with high
expression levels of PART1 and SOX6 (Fig. 1J-L). The data suggest that PART1 and
SOX6 may participate in the development and progression of ESCC and
may be novel prognostic factors in patients with ESCC.
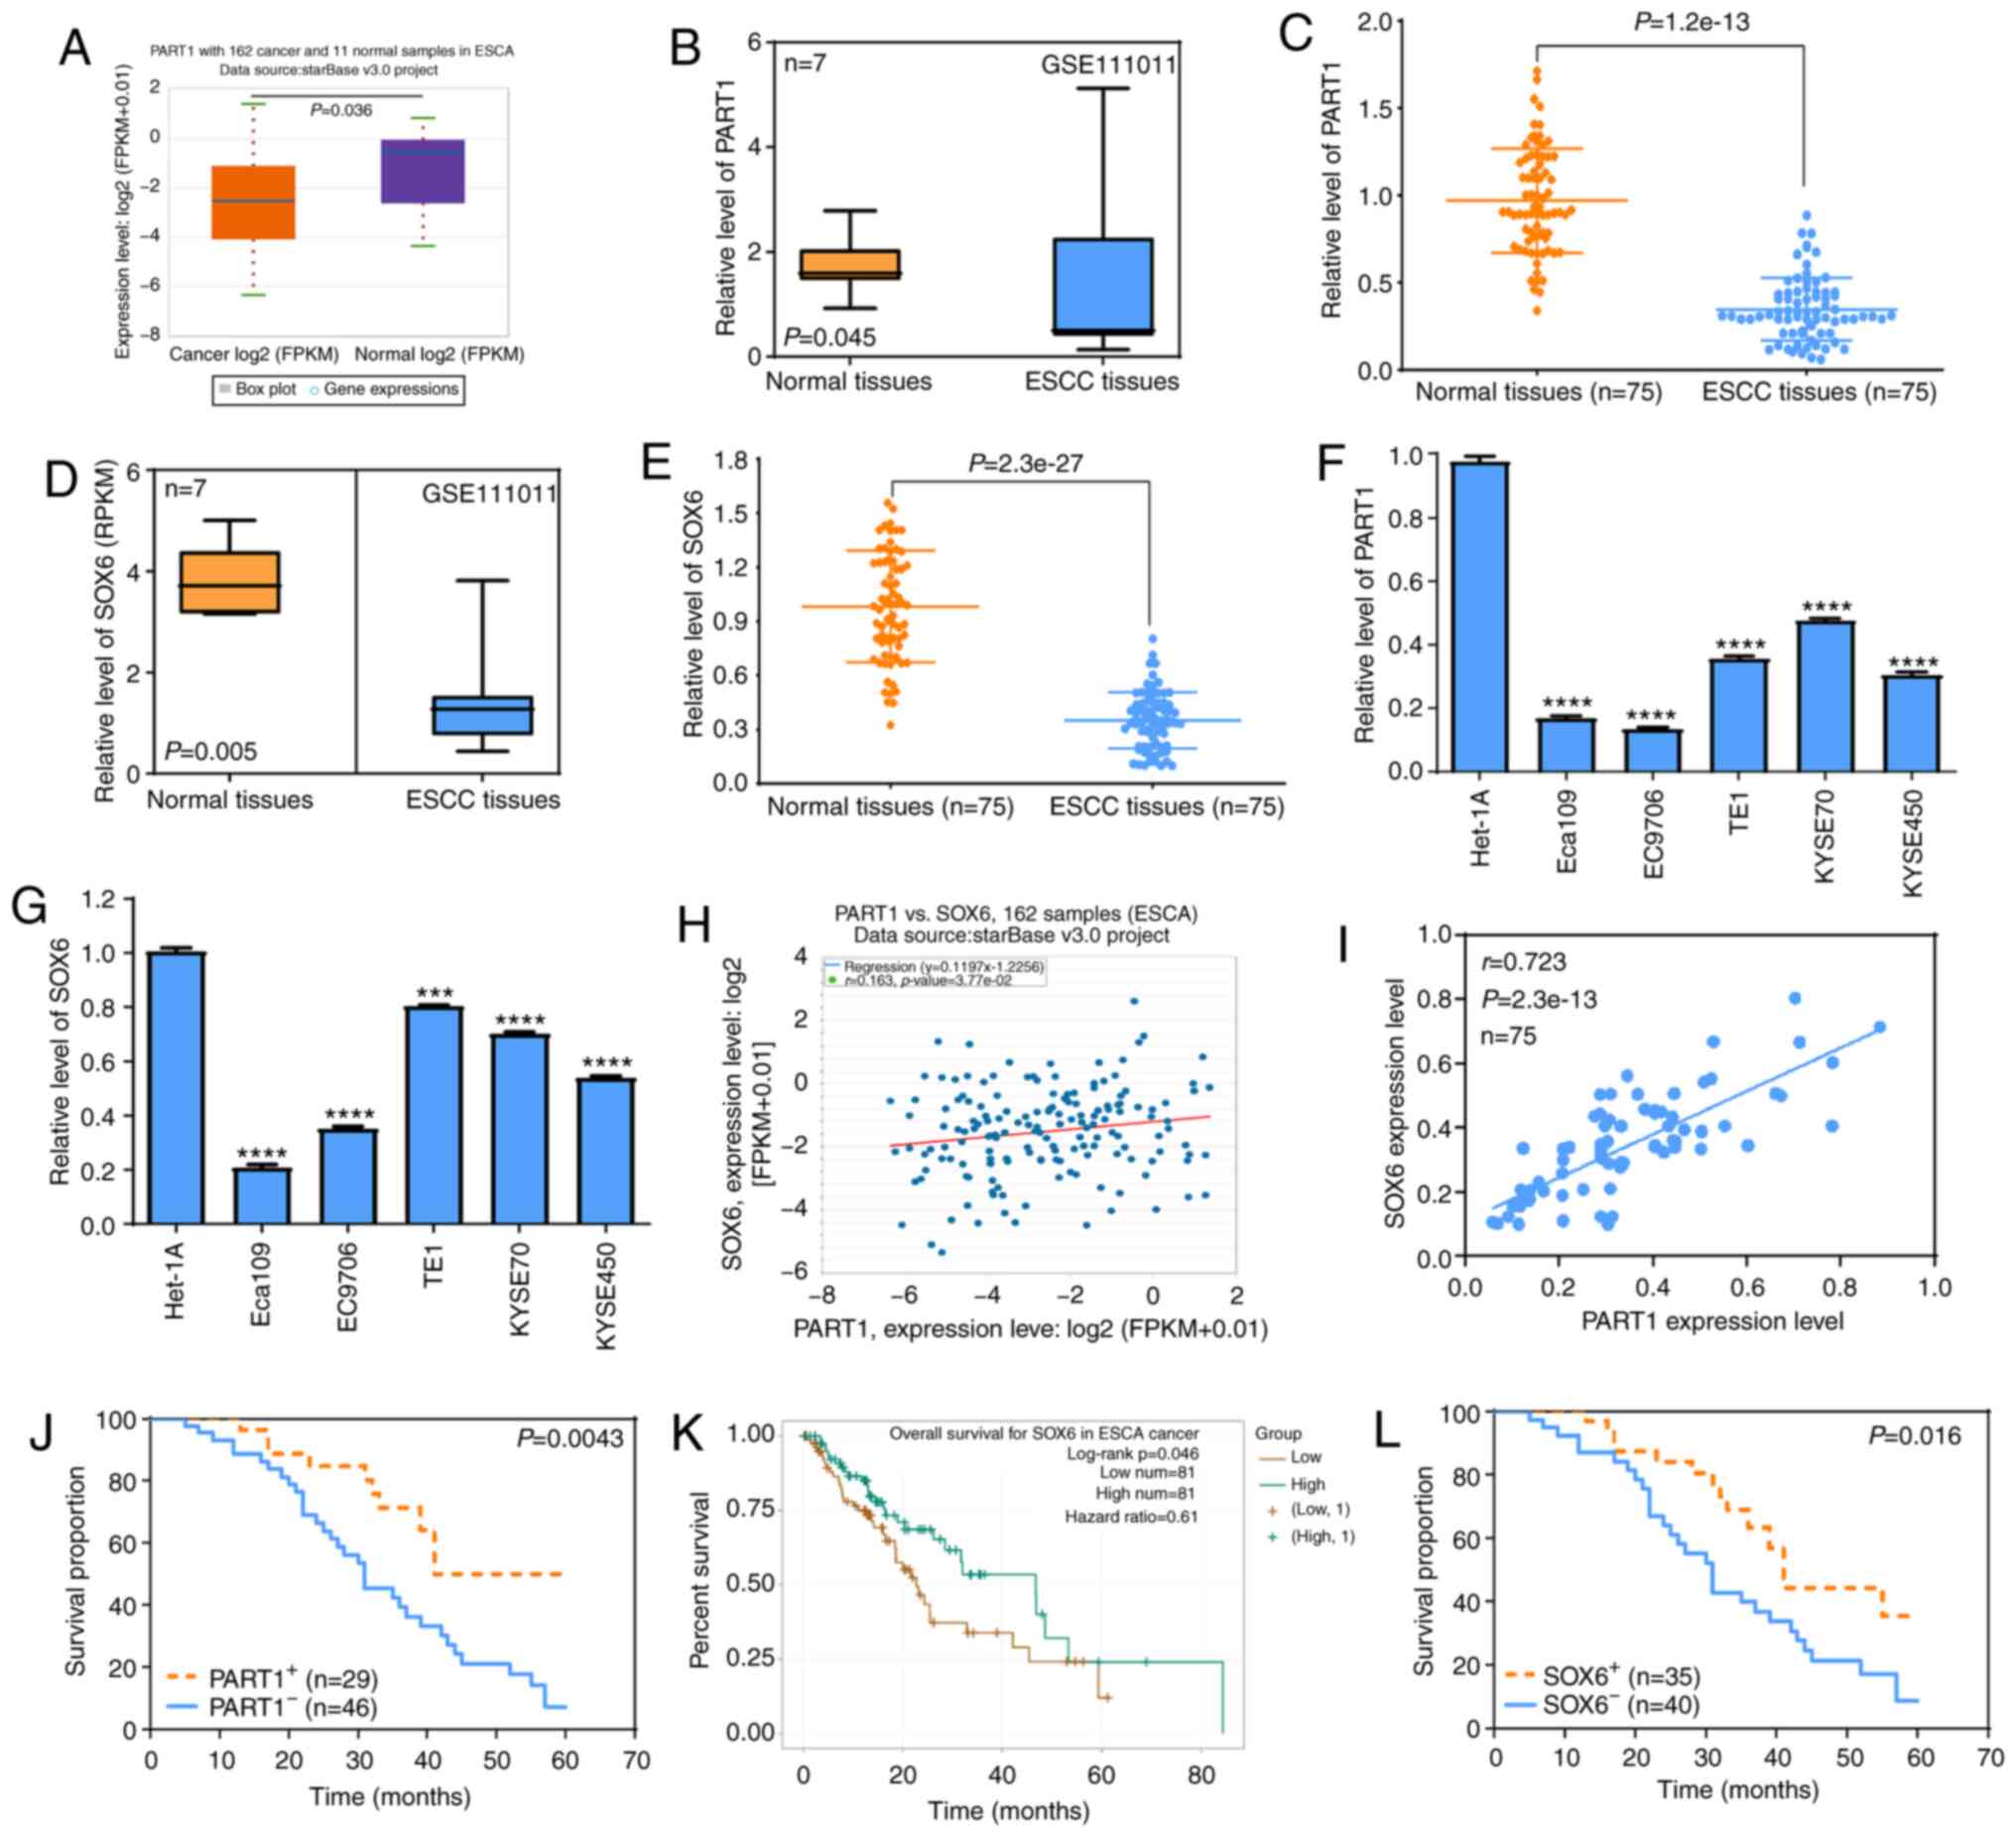 | Figure 1.Expression levels of PART1 and SOX6
in ESCC tissues and cells are associated with prognosis in patients
with ESCC. (A) StarBase online software was used to determine the
expression level of PART1 in 162 ESCA and 11 normal tissues. (B)
GEO GSE111011 dataset was analyzed to determine the expression
level of PART1 in 7 ESCC and matched normal tissues. P<0.05, as
investigated by paired t-test. (C) RT-qPCR assay was used to
determine the expression level of PART1 in 75 ESCC and paired
normal tissues. The data were investigated by Wilcoxon
matched-pairs signed-rank sum test. (D) The GEO GSE111011 dataset
was used to detect the expression level of SOX6 in 7 ESCC and
matched normal tissues, which was investigated by paired t-test.
(E) RT-qPCR assay was used to investigate the expression level of
SOX6 in 75 ESCC and paired normal tissues, which was examined by
paired t-test. (F and G) Expression levels of PART1 and SOX6 in the
ESCC cell lines (Eca109, EC9706, TE1, KYSE70 and KYSE450) and the
Het-1A normal esophageal epithelial cell line. ****P<0.0001 vs.
Het-1A, which was examined by one-way ANOVA and Bonferroni test.
(H) The StarBase online software was used to investigate the
correlation between PART1 and SOX6 mRNA expression levels in ESCA
tissues. (I) Spearman's correlation results between PART1 and SOX6
mRNA expression levels in 75 ESCC and matched adjacent normal
samples. (J) Log-rank test was used to determine the association
between PART1 expression level and the survival times in patients
with ESCC. (K) The StarBase online software was used to investigate
the association between SOX6 expression level and prognosis in
patients with ESCC. (L) Log-rank test was used to investigate the
association between SOX6 expression level and the survival times in
patients with ESCC. RT-qPCR, reverse transcription-quantitative
PCR; ESCA, esophageal cancer; ESCC, esophageal squamous cell
carcinoma; PART1, prostate androgen regulated transcript 1; SOX6,
SRY-box transcription factor 6. |
Associations between PART1 and SOX6
levels and the clinicopathological features and prognosis in
ESCC
To further investigate the roles of PART1 and SOX6
in ESCC development and progression, GraphPad Prism v8.0 software
was used to investigate the association between PART1 and SOX6
level and the clinicopathological features in the patients with
ESCC. It was found that low expression levels of PART1 and SOX6
were both associated with higher TNM stage and positive lymph node
metastasis (all P<0.05); however, there was no association with
sex, age, tumor diameter and differentiation degree (all P>0.05)
(Tables II and III). The data suggest that PART1 and
SOX6 may be novel predictive factors for TNM stage and lymph node
metastasis in ESCC.
| Table II.Associations of PART1 expression with
clinicopathological features in the ESCC cases (N=75). |
Table II.
Associations of PART1 expression with
clinicopathological features in the ESCC cases (N=75).
|
|
| PART1
expression |
|
|
|---|
|
|
|
|
|
|
|---|
| Features | n | High | Low | χ2 | P-value |
|---|
| Sex |
|
|
|
|
|
|
Male | 49 | 18 | 31 | 0.222 | 0.637 |
|
Female | 26 | 11 | 15 |
|
|
| Age (years) |
|
|
|
|
|
|
<60 | 35 | 16 | 19 |
|
|
|
≥60 | 40 | 13 | 27 | 1.374 | 0.241 |
| Tumor diameter
(cm) |
|
|
|
|
|
|
<4 | 50 | 21 | 29 |
|
|
| ≥4 | 25 | 8 | 17 | 0.703 | 0.402 |
| Differentiation
degree |
|
|
|
|
|
|
High/moderate | 44 | 20 | 24 |
|
|
|
Poor | 31 | 9 | 22 | 2.068 | 0.150 |
| TNM staging |
|
|
|
|
|
|
I–II | 40 | 21 | 19 |
|
|
|
III–IV | 35 | 8 | 27 | 6.916 | 0.009 |
| Lymph node
metastasis |
|
|
|
|
|
|
Yes | 23 | 4 | 19 |
|
|
| No | 52 | 25 | 27 | 6.331 | 0.012 |
| Table III.Associations of SOX6 expression with
clinicopathological features in the ESCC cases (N=75). |
Table III.
Associations of SOX6 expression with
clinicopathological features in the ESCC cases (N=75).
|
|
| SOX6
expression |
|
|
|---|
|
|
|
|
|
|
|---|
| Features | n | High | Low | χ2 | P-value |
|---|
| Sex |
|
|
|
|
|
|
Male | 49 | 20 | 29 | 1.944 | 0.163 |
|
Female | 26 | 15 | 11 |
|
|
| Age (years) |
|
|
|
|
|
|
<60 | 35 | 19 | 16 |
|
|
|
≥60 | 40 | 16 | 24 | 1.531 | 0.216 |
| Tumor diameter
(cm) |
|
|
|
|
|
|
<4 | 50 | 26 | 24 |
|
|
| ≥4 | 25 | 9 | 16 | 1.714 | 0.190 |
| Differentiation
degree |
|
|
|
|
|
|
High/moderate | 44 | 24 | 20 |
|
|
|
Poor | 31 | 11 | 20 | 2.655 | 0.103 |
| TNM staging |
|
|
|
|
|
|
I–II | 40 | 25 | 15 |
|
|
|
III–IV | 35 | 10 | 25 | 8.634 | 0.003 |
| Lymph node
metastasis |
|
|
|
|
|
|
Yes | 23 | 6 | 17 |
|
|
| No | 52 | 29 | 23 | 5.645 | 0.018 |
lncRNA PART1 is a direct
transcriptional target of FOXP2 in the ESCC cell lines
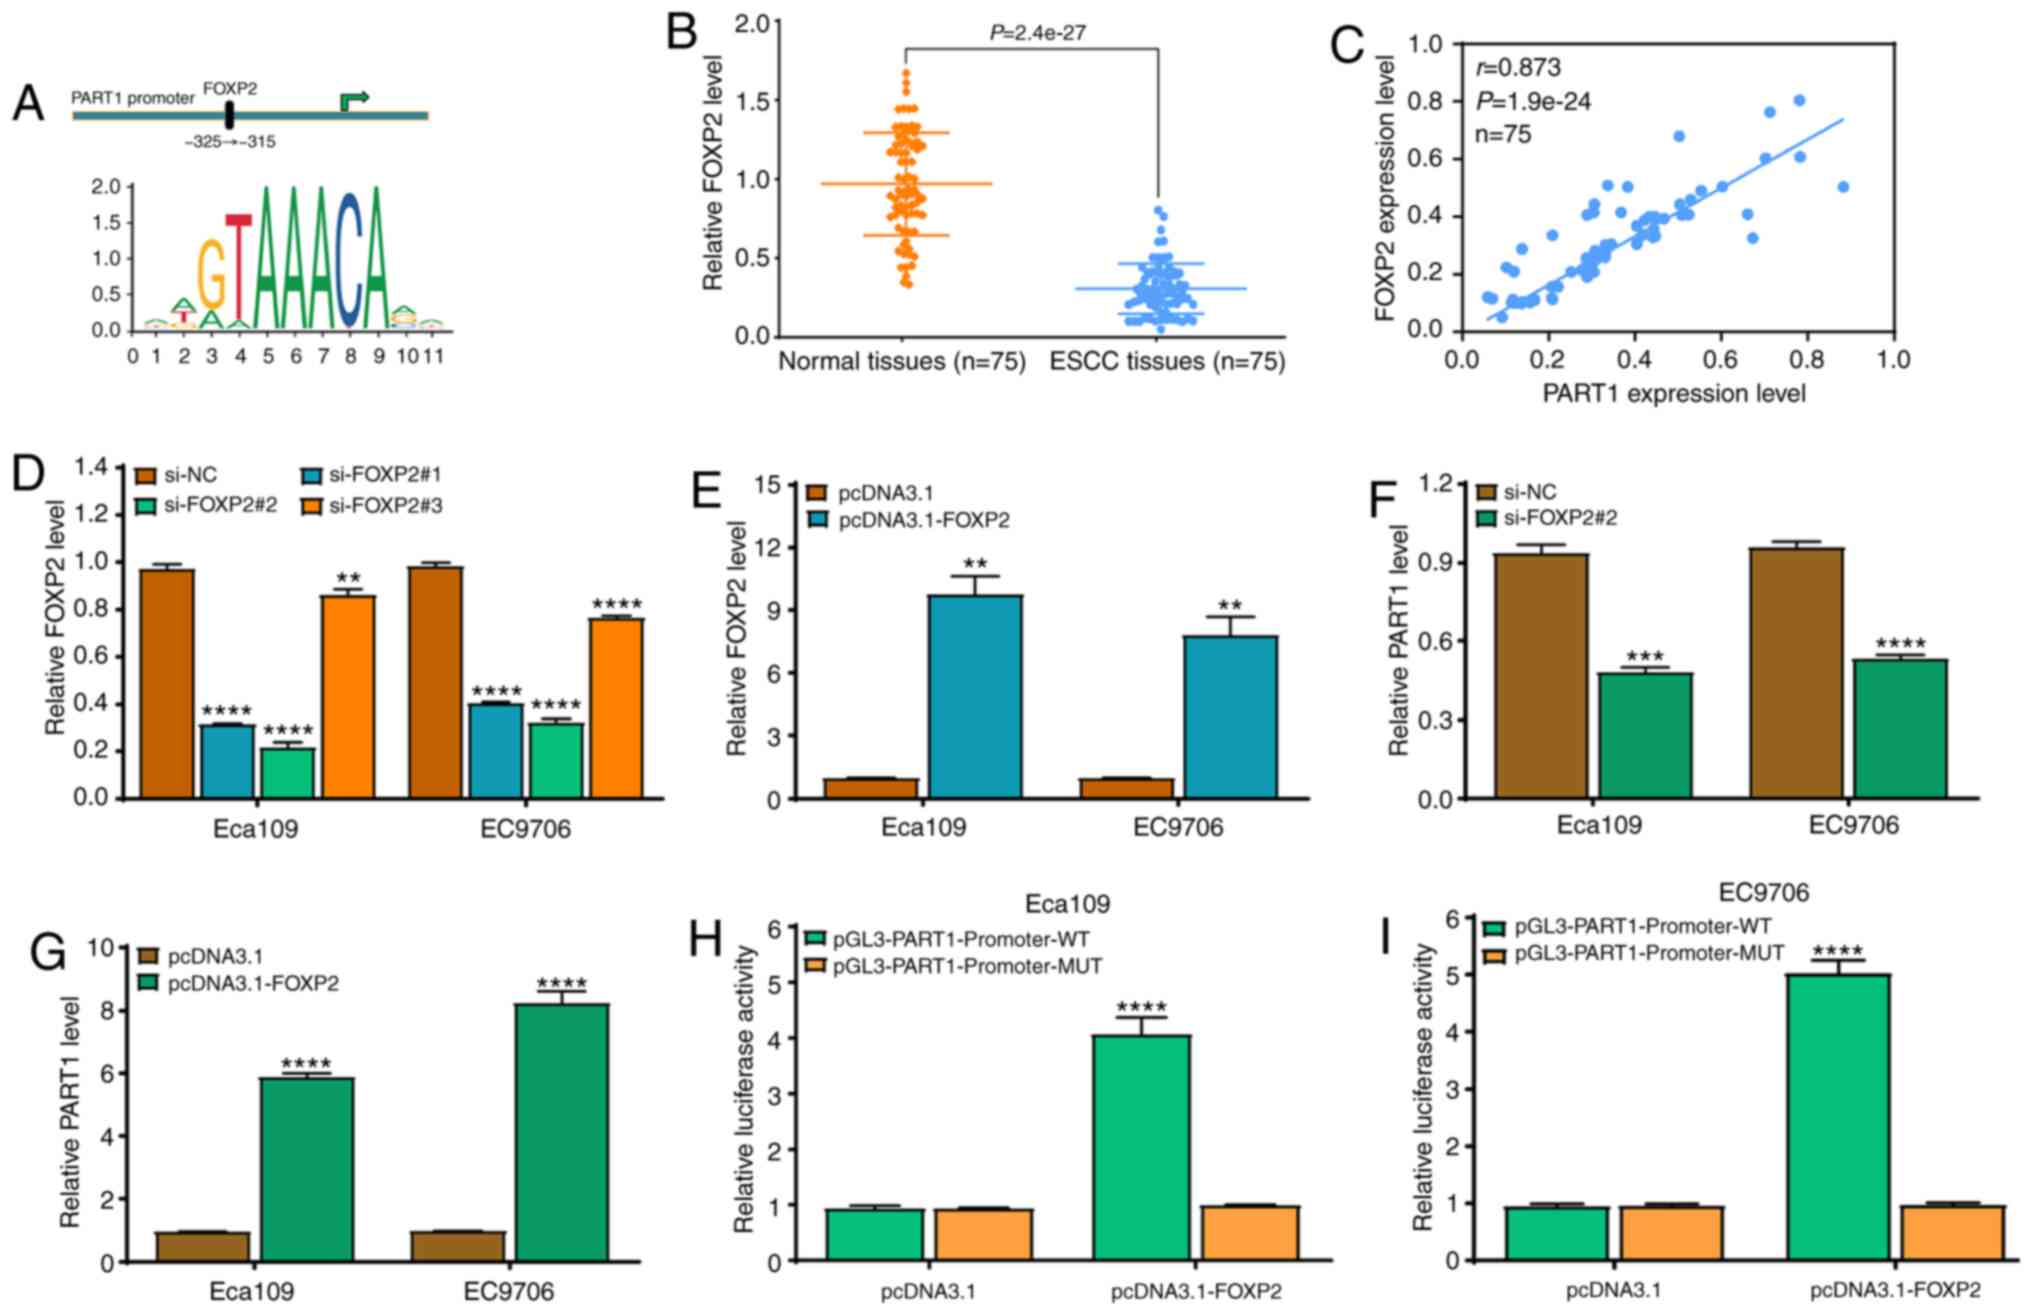
To further investigate which factor affects PART1
expression in ESCC, direct targets of PART1 were determined. The
upstream promoter sequence (~2 kb upstream) of PART1 was detected
using promoter analysis tools (UCSC and JASPAR) and the binding
site of FOXP2 (ATGTAAACAAT) was found to be within the upstream
promoter region of PART1 (Fig. 2A).
To preliminarily investigate the expression level of FOXP2 in ESCC,
RT-qPCR was used and the results revealed that the FOXP2 mRNA
expression level in 75 ESCC tissues was significantly lower
compared with that in the matched adjacent normal tissues (Fig. 2B). Correlation analysis demonstrated
that PART1 level was positively correlated with FOXP2 mRNA
expression level in the ESCA tissues (Fig. 2C). Further investigation revealed
that the expression level of FOXP2 was significantly reduced by
FOXP2 siRNAs (si-FOXP2#1 and #2), and si-FOXP2#2 was more effective
at reducing FOXP2 expression level in the ESCC cell lines (Fig. 2D), whereas pcDNA3.1-FOXP2
significantly increased the expression level of FOXP2 in the ESCC
cell lines (Fig. 2E). Based on
these results, si-FOXP2#2 significantly suppressed the expression
level of PART1 in the ESCC cell lines; however, FOXP2 upregulation
significantly increased the expression level of PART1 (Fig. 2F and G). Then, it was investigated
whether FOXP2 directly binds to the predicted promoter region in
PART1. The fragments containing WT or MUT binding sites were
constructed using the pGL3-basic vector. As expected, the
luciferase activity was notably enhanced following co-transfection
with pcDNA3.1-FOXP2 and pGL3-PART1-promoter-WT in the Eca109 and
EC9706 cell lines; however, there was no effect following
co-transfection with pcDNA3.1-FOXP2 and pGL3-PART1-promoter-MUT
(Fig. 2H and I). These data suggest
that the PART1 expression level may be affected by FOXP2 in ESCC
cells.
 | Figure 2.Transcriptional factor, FOXP2,
regulates PART1 expression level in the ESCC cell lines. (A) A
predicted FOXP2 binding site in the PART1 promoter region. (B)
RT-qPCR assay was used to analyze the expression level of FOXP2 in
75 ESCC and matched normal tissues. P<0.0001, as investigated by
paired t-test. (C) Spearman's correlation result between PART1 and
FOXP2 mRNA expression levels in 75 ESCC and matched normal samples.
(D) A total of 3 siRNAs targeting FOXP2 were used to downregulate
FOXP2 expression level in the ESCC cell lines and validated using
RT-qPCR; si-FOXP2#2 was the most effective. **P<0.01 and
****P<0.0001 vs. the si-NC group. (E) pcDNA3.1-FOXP2
significantly promoted the expression level of FOXP2 in the ESCC
cell lines as determined by RT-qPCR. **P<0.01 vs. the pcDNA3.1
group; the data were examined by one-way ANOVA and Bonferroni test.
(F) si-FOXP2#2 significantly downregulated the expression level of
PART1 in the ESCC Eca109 and EC9706 cell lines as determined by
RT-qPCR. ***P<0.001 and ****P<0.0001 vs. the si-NC group. (G)
pcDNA3.1-FOXP2 significantly promoted the expression level of PART1
in the ESCC cell lines as determined by RT-qPCR. ****P<0.0001
vs. the pcDNA3.1 group. (H and I) Luciferase reporter assay was
used to determine the luciferase activity in pGL3-PART1-promoter-WT
or pGL3-PART1-promoter-MUT in the FOXP2-overexpressing (H) Eca109
and (I) EC9706 cell lines. ****P<0.0001 vs. MUT. RT-qPCR,
reverse transcription-quantitative PCR; WT, wild-type; MUT, mutant;
si, small interfering; NC, negative control; ESCC, esophageal
squamous cell carcinoma; PART1, prostate androgen regulated
transcript 1. (E-I) All data were examined by independent-sample
t-test. |
lncRNA PART1 suppresses cell
proliferation and invasion in the ESCC cell lines
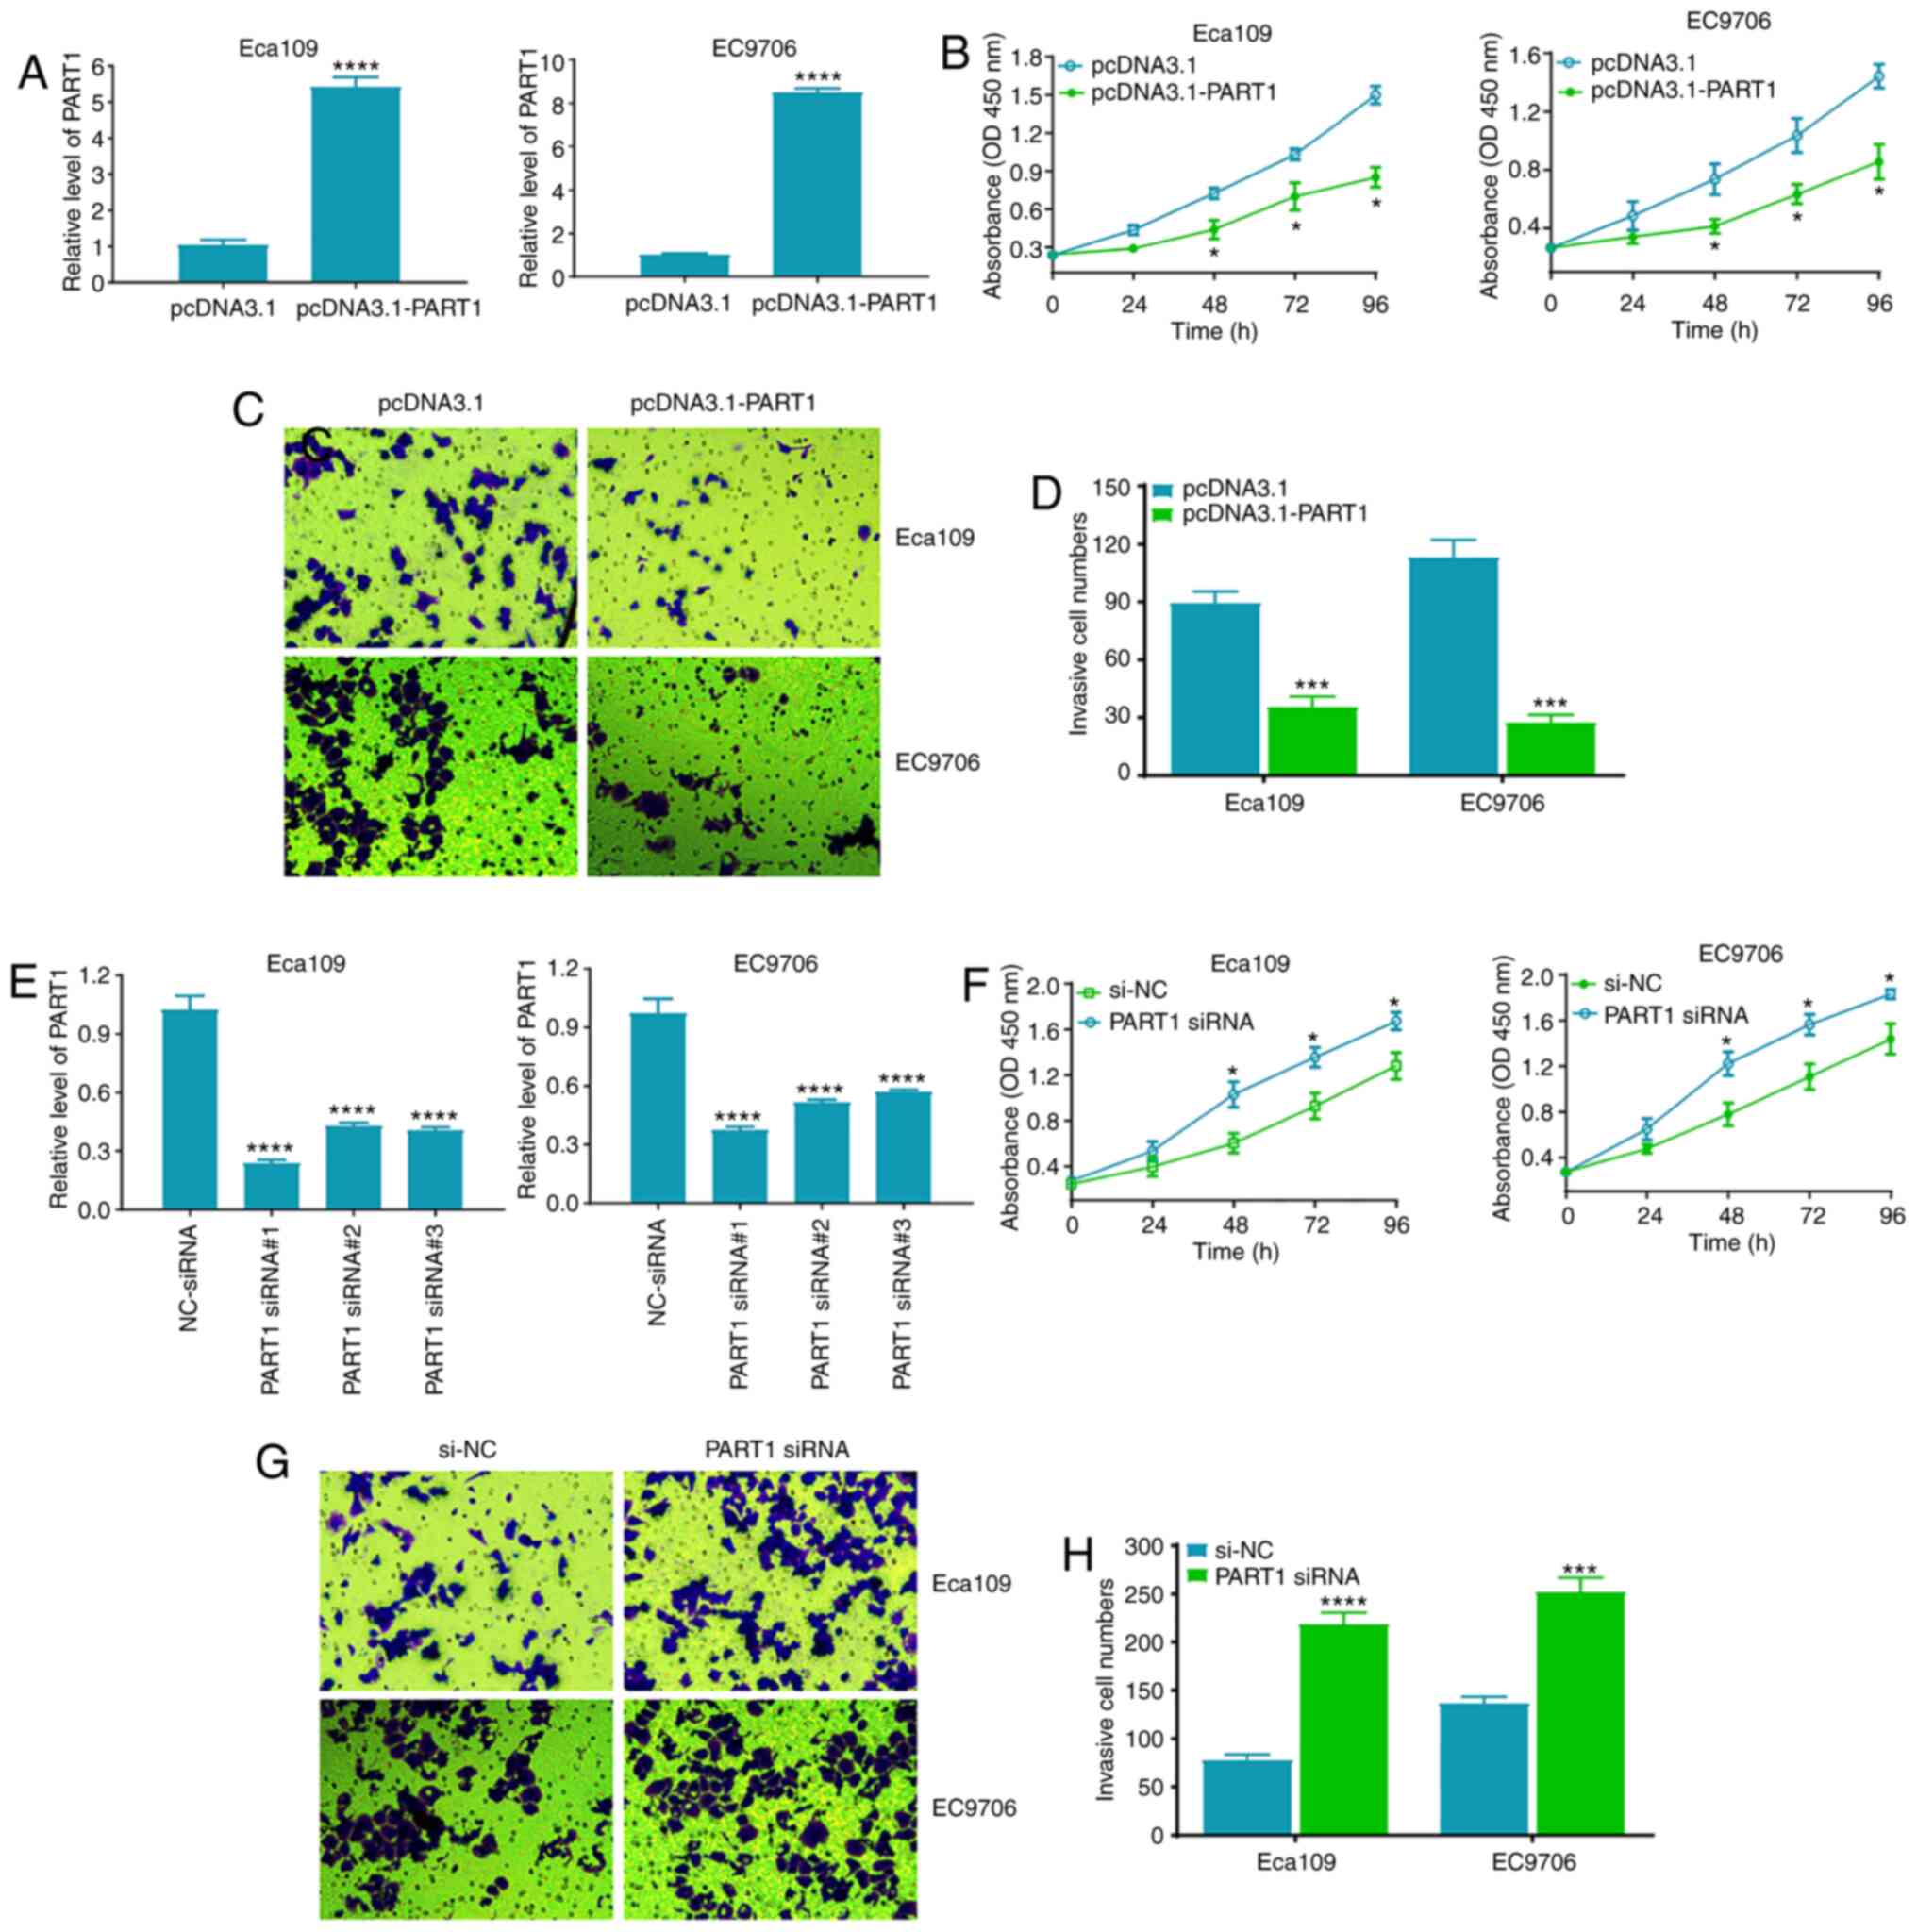
To investigate the role of PART1 in the
proliferation and invasion of the ESCC cell lines, CCK-8 and
Matrigel assays were used. It was found that pcDNA3.1-PART1
significantly upregulated PART1 expression level in the Eca109 and
EC9706 cell lines (P<0.0001) (Fig.
3A). In addition, PART1 upregulation markedly suppressed the
cell proliferation of the Eca109 and EC9706 cell lines compared
with that in the pcDNA3.1 group (P<0.05) (Fig. 3B). The Matrigel assay, using a
Transwell chamber, revealed that PART1 overexpression significantly
inhibited cell invasion in the Eca109 and EC9706 cell lines
(Fig. 3C and D). Conversely, three
siRNAs against PART1 were used to downregulate the expression level
of PART1 in the Eca109 and EC9706 cell lines, as expected, all
three PART1 siRNAs significantly reduced the expression level of
PART1, in which PART1 siRNA#1 was the most effective (Fig. 3E). A further CCK-8 assay
demonstrated that PART1 downregulation significantly promoted cell
proliferation in the Eca109 and EC9706 cell lines (P<0.05)
(Fig. 3F). Meanwhile, PART1
knockdown accelerated cell invasion in the Eca109 and EC9706 cell
lines (Fig. 3G and H). These data
suggest that PART1 plays a pivotal role in the regulation of cell
proliferation and invasion of the ESCC cell lines.
 | Figure 3.Exogenous expression of PART1
suppresses ESCC cell proliferation and invasion. (A) RT-qPCR assay
was used to analyze PART1 expression level in the Eca109 and EC9706
cell lines, 48 h following transfection with pcDNA3.1 and
pcDNA3.1-PART1. (B) CCK-8 assay was used to analyze cell
proliferation in the Eca109 and EC9706 cell lines, at 24, 48, 72
and 96 h following transfection with pcDNA3.1 and pcDNA3.1-PART1.
(C) A Matrigel assay was used to analyze invasion ability in the
Eca109 and EC9706 cell lines, 48 h following transfection with
pcDNA3.1 and pcDNA3.1-PART1. (D) Statistical analysis of the number
of invasive cells in the Eca109 and EC9706 cell lines transfected
with pcDNA3.1 and pcDNA3.1-PART1. *P<0.05, ***P<0.001 and
****P<0.0001 vs. the pcDNA3.1 group. (E) RT-qPCR assay was used
to analyze PART1 expression level in the Eca109 and EC9706 cell
lines, 48 h following transfection with si-NC and PART1 siRNA#1, 2
and 3, and the data were examined by one-way ANOVA and Bonferroni
test. (F) CCK-8 assay was used to analyze cell proliferation in the
Eca109 and EC9706 cell lines, at 24, 48, 72 and 96 h following
transfection with si-NC and PART1 siRNA. (G) Matrigel assay was
used to analyze invasion in the Eca109 and EC9706 cell lines, 48 h
following transfection with si-NC and PART1 siRNA. (H) Statistical
analysis of the number of invasive cells in the Eca109 and EC9706
cell lines transfected with si-NC and PART1 siRNA. *P<0.05,
***P<0.001 and ****P<0.0001 vs. the si-NC group. CCK-8, Cell
Counting Kit-8; RT-qPCR, reverse transcription-quantitative PCR;
si, small interfering; NC, negative control; ESCC, esophageal
squamous cell carcinoma; PART1, prostate androgen regulated
transcript 1. (A-D and F-H) All data were examined by
independent-sample t-test. |
miR-18a-5p is the direct target of
PART1 in the ESCC cell lines
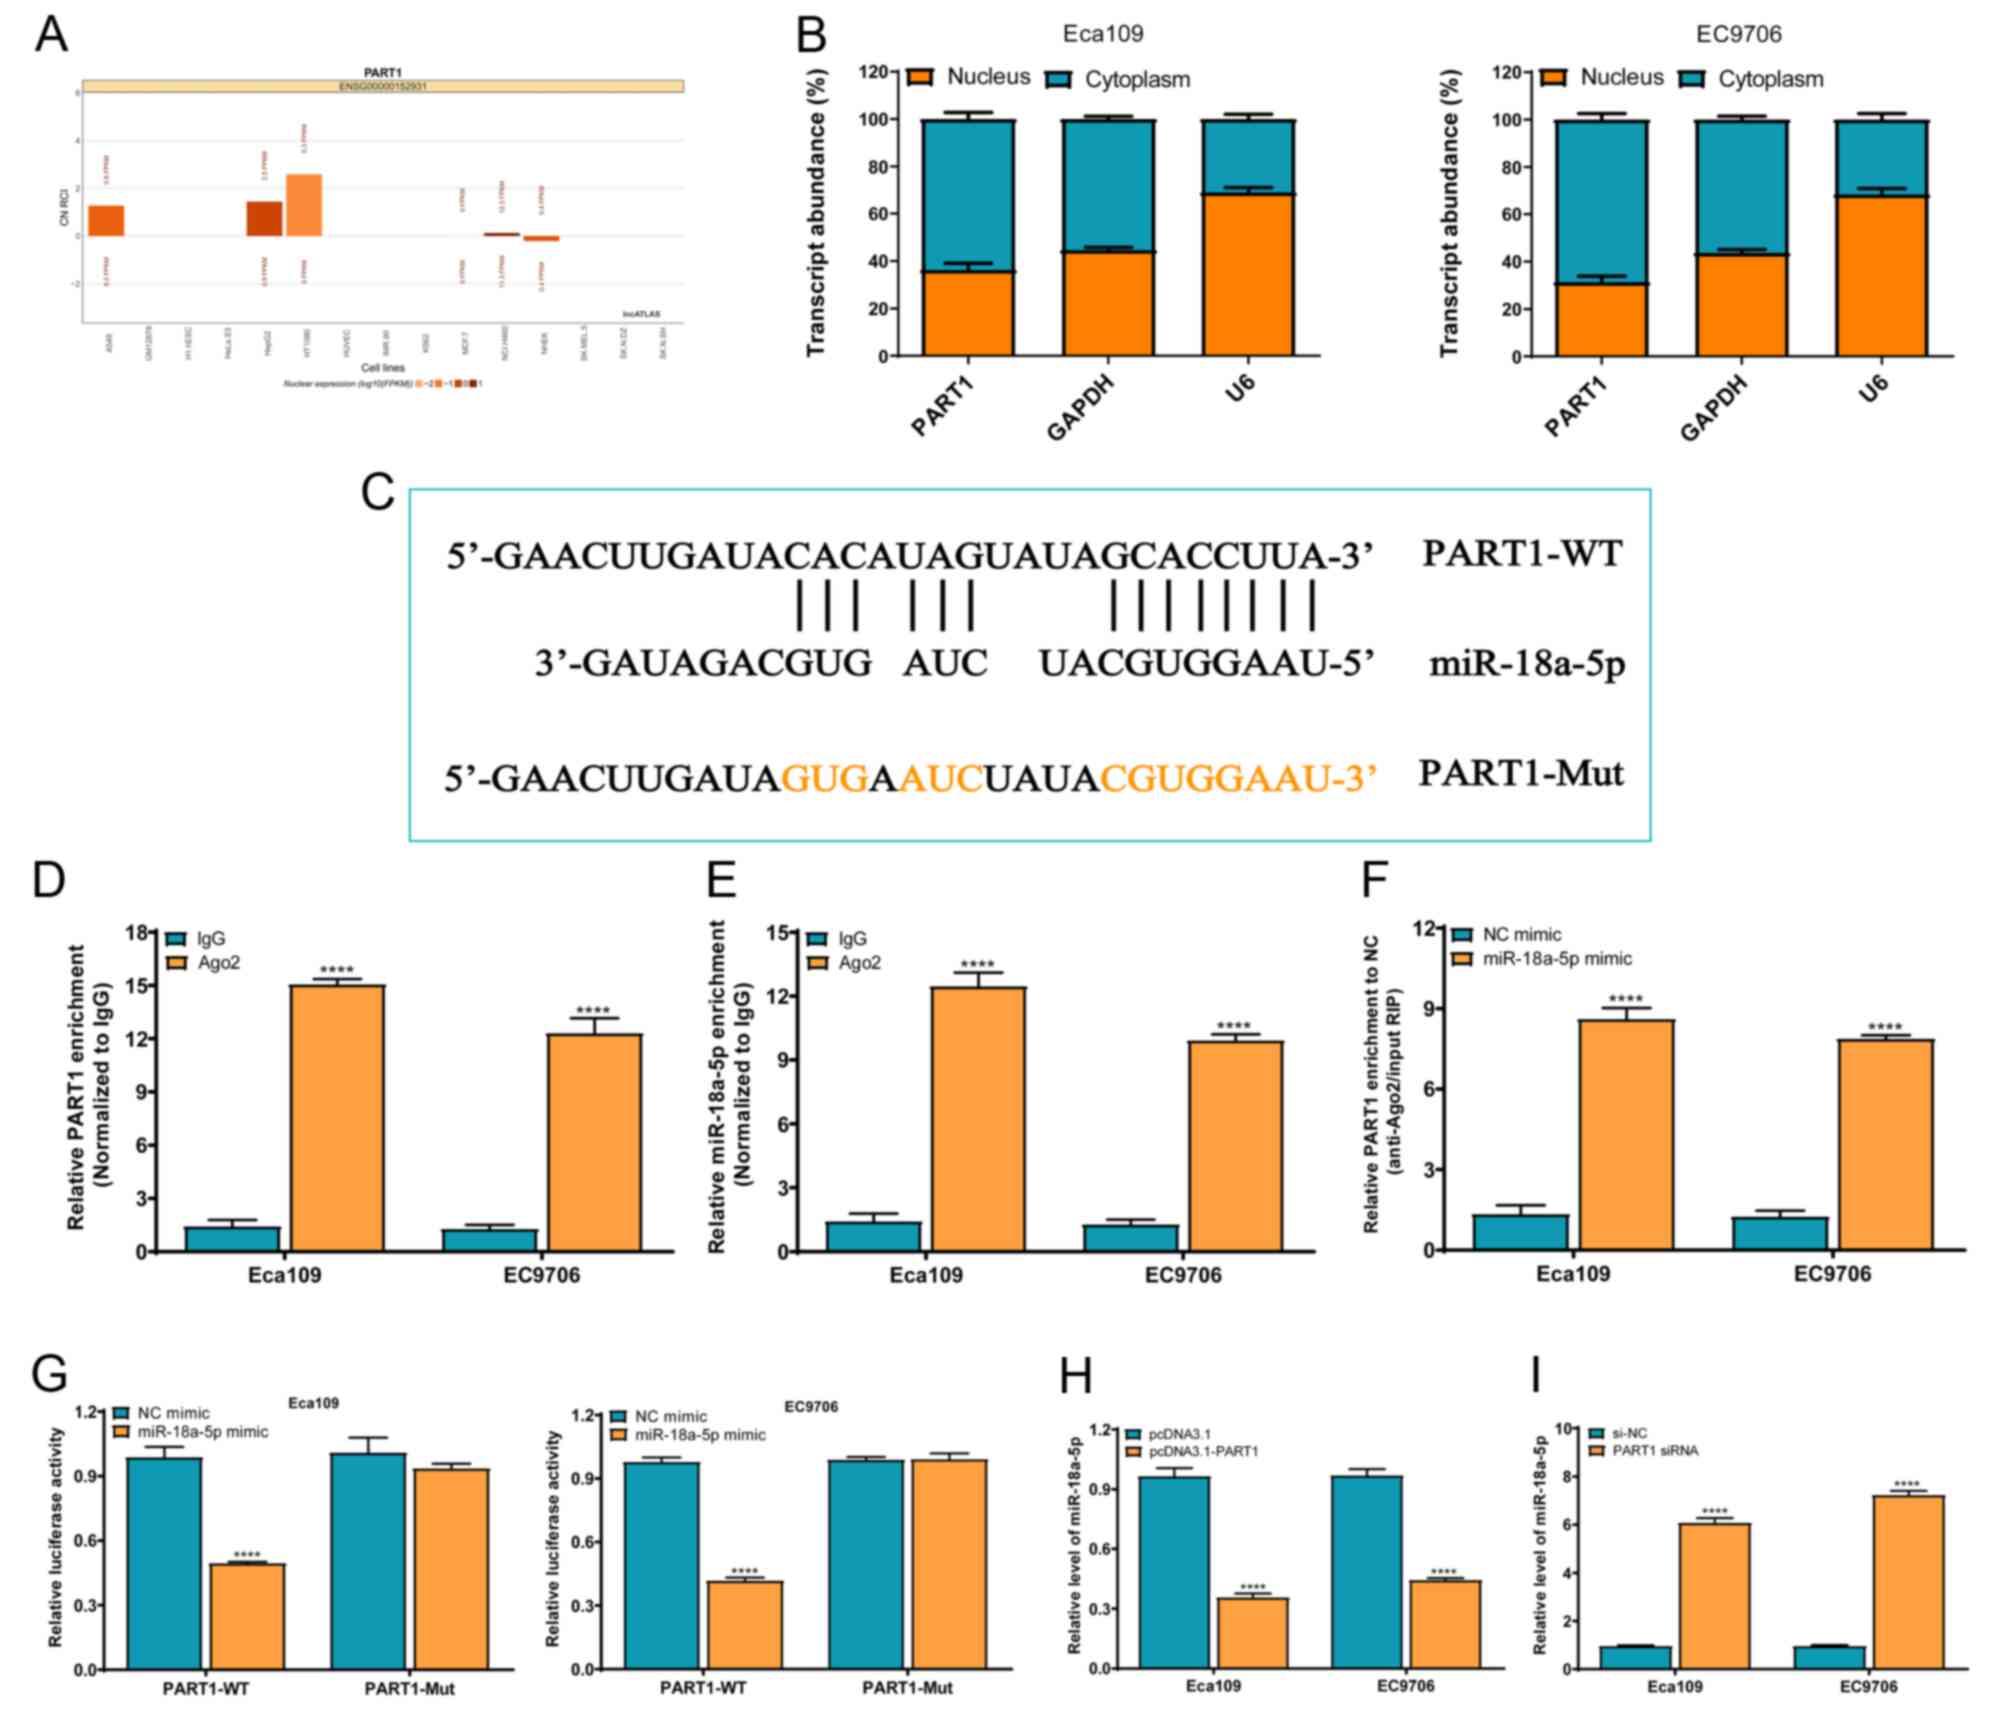
To investigate the underlying molecular mechanism of
PART1 in ESCC progression, lncATLAS online software was used to
predict the subcellular localization of PART1. The data revealed
that PART1 was primarily localized in the cytoplasm in most of the
indicated cell types (Fig. 4A). To
validate the predicted result, RT-qPCR was used in the ESCC cell
lines. The results demonstrated that PART1 was principally
localized in the cytoplasm of the Eca109 and EC9706 cell lines
(Fig. 4B). According to the
localization of PART1, a proposed ceRNA function of PART1 was
suggested. The possible binding sites of miRNA in PART1 were
predicted using the LncBase Predicted v.2 software, integrated in
DIANA Tools, in which miR-18a-5p was found to contain a target site
and was investigated further in the present study (Fig. 4C). To preliminarily elucidate
whether PART1 could bind to miR-18a-5p in the ESCC cell lines, an
Ago2-RIP experiment was used to verify the direct interaction
between PART1 and miR-18a-5p. The results showed that PART1 and
miR-18a-5p expression levels in the anti-Ago2 antibody group were
significantly higher compared with that in the IgG group
(P<0.0001) (Fig. 4D and E).
Notably, PART1 enrichment in the miR-18a-5p mimic group was
significantly higher compared with that in the NC mimic group
(P<0.0001) (Fig. 4F). These
findings suggested that PART1 and miR-18a-5p exhibited a direct
interaction in the ESCC cell lines via the Ago2-dependent pathway.
In additon, a dual-luciferase reporter assay revealed that the
relative luciferase intensity was significantly reduced following
co-transfection with PART1-WT and miR-18a-5p mimic, but not in the
PART1-MUTgroup, in the Eca109 and EC9706 cell lines (Fig. 4G). Simultaneously, PART1
overexpression significantly reduced the expression level of
miR-18a-5p (Fig. 4H), whereas PART1
silencing significantly promoted miR-18a-5p expression in the
Eca109 and EC9706 cell lines (Fig.
4I). These findings indicated that PART1 directly regulated the
expression level of miR-18a-5p in the ESCC cell lines.
SOX6 is the direct target of
miR-18a-5p in the ESCC cell lines
It is well-known that miRNA functions as either an
oncogene or tumor suppressor, depending on its downstream target
gene. To further investigate the role of miR-18a-5p in ESCC
progression, its expression level and downstream target genes were
determined. The StarBase online software was used to investigate
the expression level of miR-18a-5p in 162 ESCA tissues and 11
normal samples, and it was found that miR-18a-5p expression level
was markedly higher compared with that in normal samples (Fig. 5A), which was further verified using
the GEO GSE43732 dataset in 119 ESCC samples and matched adjacent
normal samples (Fig. 5B). To
validate the data from bioinformatics analysis, RT-qPCR was used to
detect the miR-18a-5p expression level in 75 ESCC samples and
paired adjacent normal samples. It was found that 75 ESCC samples
displayed higher expression level of miR-18a-5p compared with that
in the paired adjacent normal samples (P<0.0001) (Fig. 5C), and similar data were obtained
from a panel of ESCC cell lines and the Het-1A normal esophageal
epithelial cell line (Fig. 5D).
Notably, the miR-18a-5p expression level was associated with TNM
stage and lymph node metastasis in patients with ESCC (Table IV). These findings suggested that
miR-18a-5p may participate in ESCC development and progression. To
further investigate its downstream target genes, Targetscan and
miRDB online software programs were used to predict the possible
binding sites of miR-18a-5p in the SOX6 3′-untranslated region
(UTR) (Fig. 5E). A dual-luciferase
reporter assay revealed that the relative luciferase intensity was
significantly reduced by co-transfecting with SOX6-WT and
miR-18a-5p mimic, but not in the SOX6-MUT group, in the Eca109 and
EC9706 cell lines (Fig. 5F).
Correlation analysis revealed that the miR-18a-5p expression level
was negatively correlated with the SOX6 expression level in the 75
ESCC samples (Fig. 5G). In
addition, miR-18a-5p inhibitor significantly suppressed miR-18a-5p
expression in the Eca109 and EC9706 cell lines (Fig. 5H), whereas miR-18a-5p mimic
significantly promoted miR-18a-5p expression level in the Eca109
and EC9706 cell lines (Fig. 5I).
Simultaneously, the miR-18a-5p inhibitor significantly increased
the mRNA expression level of SOX6 in the Eca109 and EC9706 cell
lines (Fig. 5J), whereas miR-18a-5p
mimic significantly suppressed the mRNA expression level of SOX6 in
the Eca109 and EC9706 cell lines (Fig.
5K). These findings indicated that miR-18a-5p directly affected
the expression level of SOX6 in the ESCC cell lines.
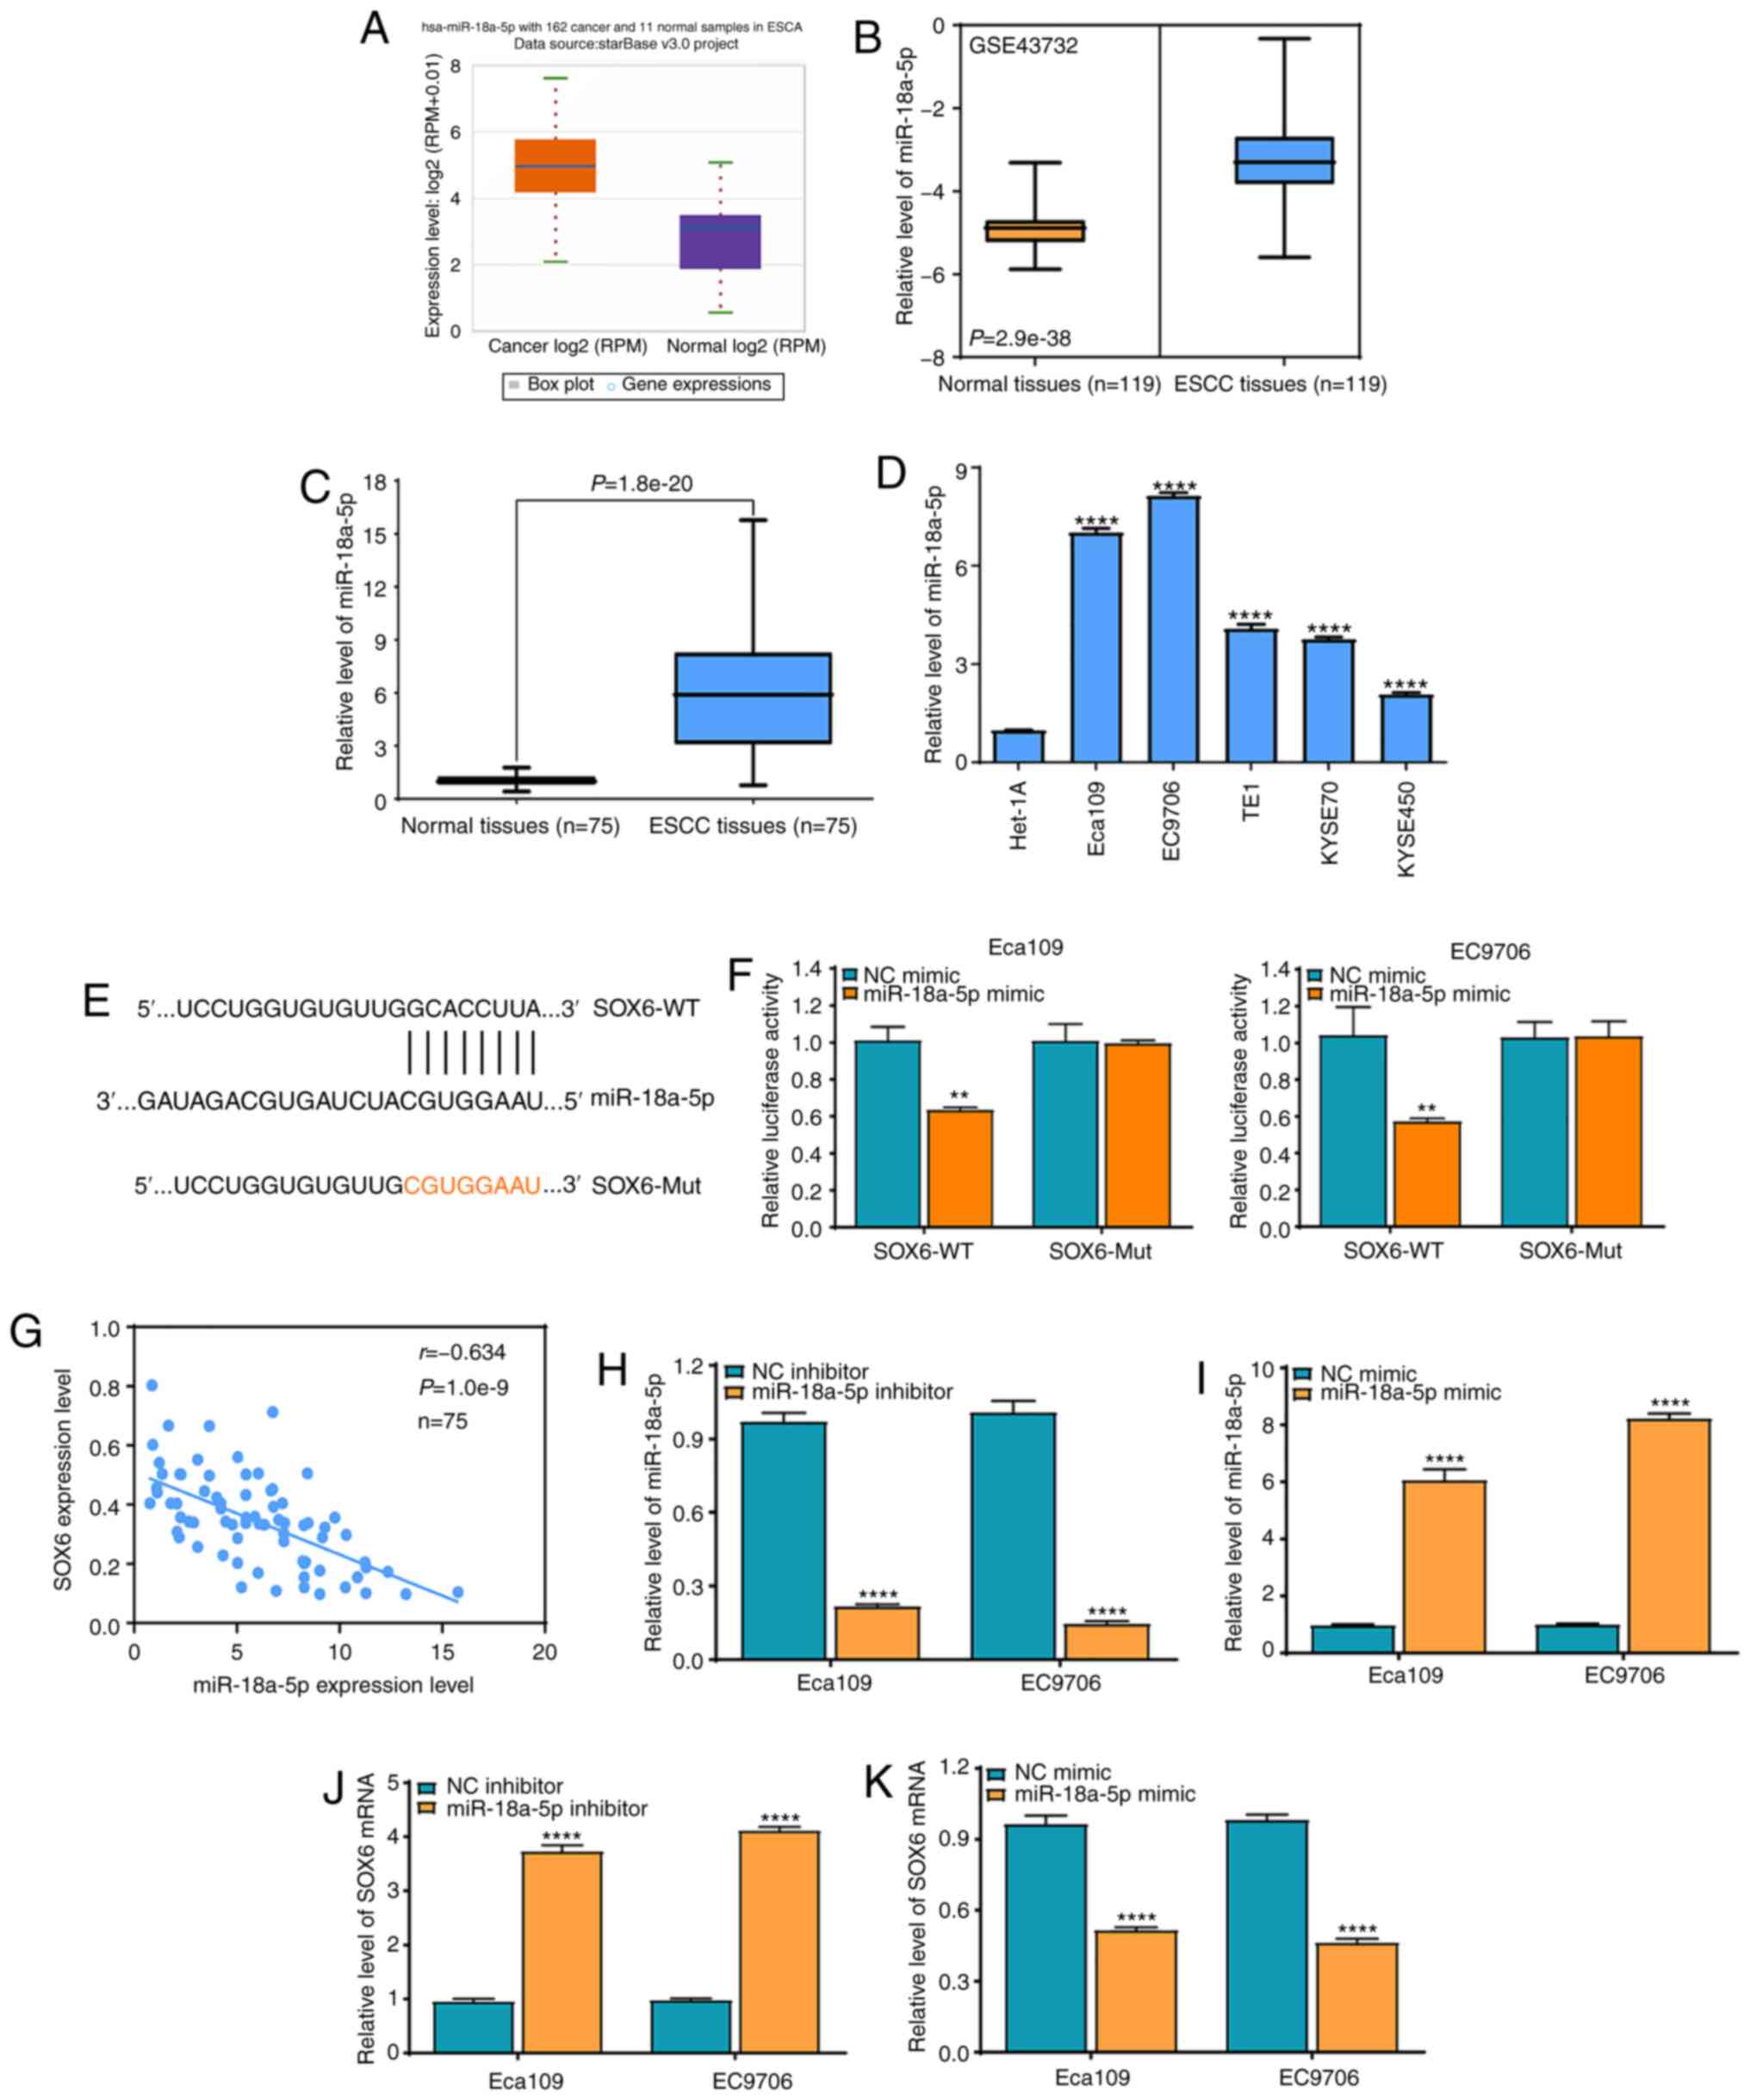 | Figure 5.SOX6 is a direct molecular target of
miR-18a-5p in the ESCC cell lines. (A) StarBase online software was
used to analyze the expression level of miR-18a-5p in 162 ESCA and
11 normal samples. (B) The GEO GSE43732 dataset was used to analyze
the expression level of miR-18a-5p in 119 ESCC and matched adjacent
normal specimens. (C) RT-qPCR assay was used to analyze the
expression level of miR-18a-5p in 75 ESCC and paired adjacent
normal tissues. (D) RT-qPCR was used to analyze the expression
level of miR-18a-5p in the ESCC cell lines (Eca109, EC9706, TE1,
KYSE70 and KYSE450) and the Het-1A normal esophageal epithelial
cell line. ****P<0.0001 vs. the Het-1A cell line. Data were
examined by one-way ANOVA and Bonferroni test. (E) TargetScan and
miRDB databases were used to predict the potential binding sites
between miR-18a-5p and SOX6. (F) A dual-luciferase reporter assay
was performed to investigate the interaction between miR-18a-5p and
SOX6. **P<0.01 vs. NC mimic. (G) Pearson correlation test
analysis between miR-18a-5p and SOX6 mRNA expression levels in 75
ESCC and matched adjacent normal samples. (H) miR-18a-5p inhibitor
significantly suppressed the miR-18a-5p expression level in the
Eca109 and EC9706 cell lines. ****P<0.0001 vs. the NC inhibitor.
(I) miR-18a-5p mimic significantly enhanced the miR-18a-5p
expression level in the Eca109 and EC9706 cell lines.
****P<0.0001 vs. the NC mimic. (J) miR-18a-5p downregulation
significantly promoted the expression level of SOX6 in the Eca109
and EC9706 cell lines. ****P<0.0001 vs. the NC inhibitor. (K)
miR-18a-5p overexpression significantly suppressed the expression
level of SOX6 in the Eca109 and EC9706 cell lines. ****P<0.0001
vs. the NC mimic. si, small interfering; NC, negative control; WT,
wild-type; MUT, mutant; miR, microRNA; ESCC, esophageal squamous
cell carcinoma; SOX6, SRY-box transcription factor 6. (B and C)
Data were analyzed using paired t-test; (F and H-K) All data were
examined by independent-sample t-test. |
| Table IV.Associations of miR-18a-5p expression
with clinicopathological features in the ESCC cases (N=75). |
Table IV.
Associations of miR-18a-5p expression
with clinicopathological features in the ESCC cases (N=75).
|
|
| miR-18a-5p
expression |
|
|
|---|
|
|
|
|
|
|
|---|
| Features | n | High | Low | χ2 | P-value |
|---|
| Sex |
|
|
|
|
|
|
Male | 49 | 36 | 13 | 1.943 | 0.163 |
|
Female | 26 | 15 | 11 |
|
|
| Age (years) |
|
|
|
|
|
|
<60 | 35 | 20 | 15 |
|
|
|
≥60 | 40 | 31 | 9 | 3.555 | 0.059 |
| Tumor diameter
(cm) |
|
|
|
|
|
|
<4 | 50 | 32 | 18 |
|
|
| ≥4 | 25 | 19 | 6 | 1.103 | 0.294 |
| Differentiation
degree |
|
|
|
|
|
|
High/moderate | 44 | 28 | 16 |
|
|
|
Poor | 31 | 23 | 8 | 0.932 | 0.334 |
| TNM staging |
|
|
|
|
|
|
I–II | 40 | 23 | 17 |
|
|
|
III–IV | 35 | 28 | 7 | 4.343 | 0.037 |
| Lymph node
metastasis |
|
|
|
|
|
|
Yes | 23 | 20 | 3 |
|
|
| No | 52 | 31 | 21 | 5.478 | 0.019 |
Role of the PART1/miR-18a-5p/SOX6
signaling axis in cell proliferation and invasion of the ESCC cell
lines
To investigate the potential role of the
PART1/miR-18a-5p/SOX6 signaling axis in cell proliferation and
invasion of the ESCC cell lines, miR-18a-5p inhibitor or mimic
alone, combined with PART1 siRNA and SOX6 siRNA or pcDNA3.1-PART1
and pcDNA3.1-SOX6 were used to transfect the Eca109 and EC9706 cell
lines, and then CCK-8 and Matrigel assays were performed. It was
found that miR-18a-5p inhibitor significantly blocked cell
proliferation and invasion in the Eca109 and EC9706 cell lines,
which was partly reversed by PART1 and SOX6 siRNA (Fig. 6A-C). Notably, miR-18a-5p inhibitor
triggered the upregulation of SOX6 proteins and the downregulation
of β-catenin and c-myc proteins, which was also partly reversed by
PART1 and SOX6 siRNA (Fig. 6D).
Conversely, miR-18a-5p mimic markedly accelerated cell
proliferation and invasion, while pcDNA3.1-PART1 and pcDNA3.1-SOX6
both notably suppressed the promoting effect of miR-18a-5p mimic on
cell proliferation and invasion in the Eca109 and EC9706 cell lines
(Fig. 6E-G). Notably, miR-18a-5p
mimic triggered the downregulation of SOX6 proteins and the
upregulation of β-catenin and c-myc proteins, which was also partly
reversed by pcDNA3.1-PART1 and pcDNA3.1-SOX6 (Fig. 6H). These data suggest that the
PART1/miR-18a-5p/SOX6/β-catenin signaling axis may be a novel
therapeutic strategy in patients with ESCC.
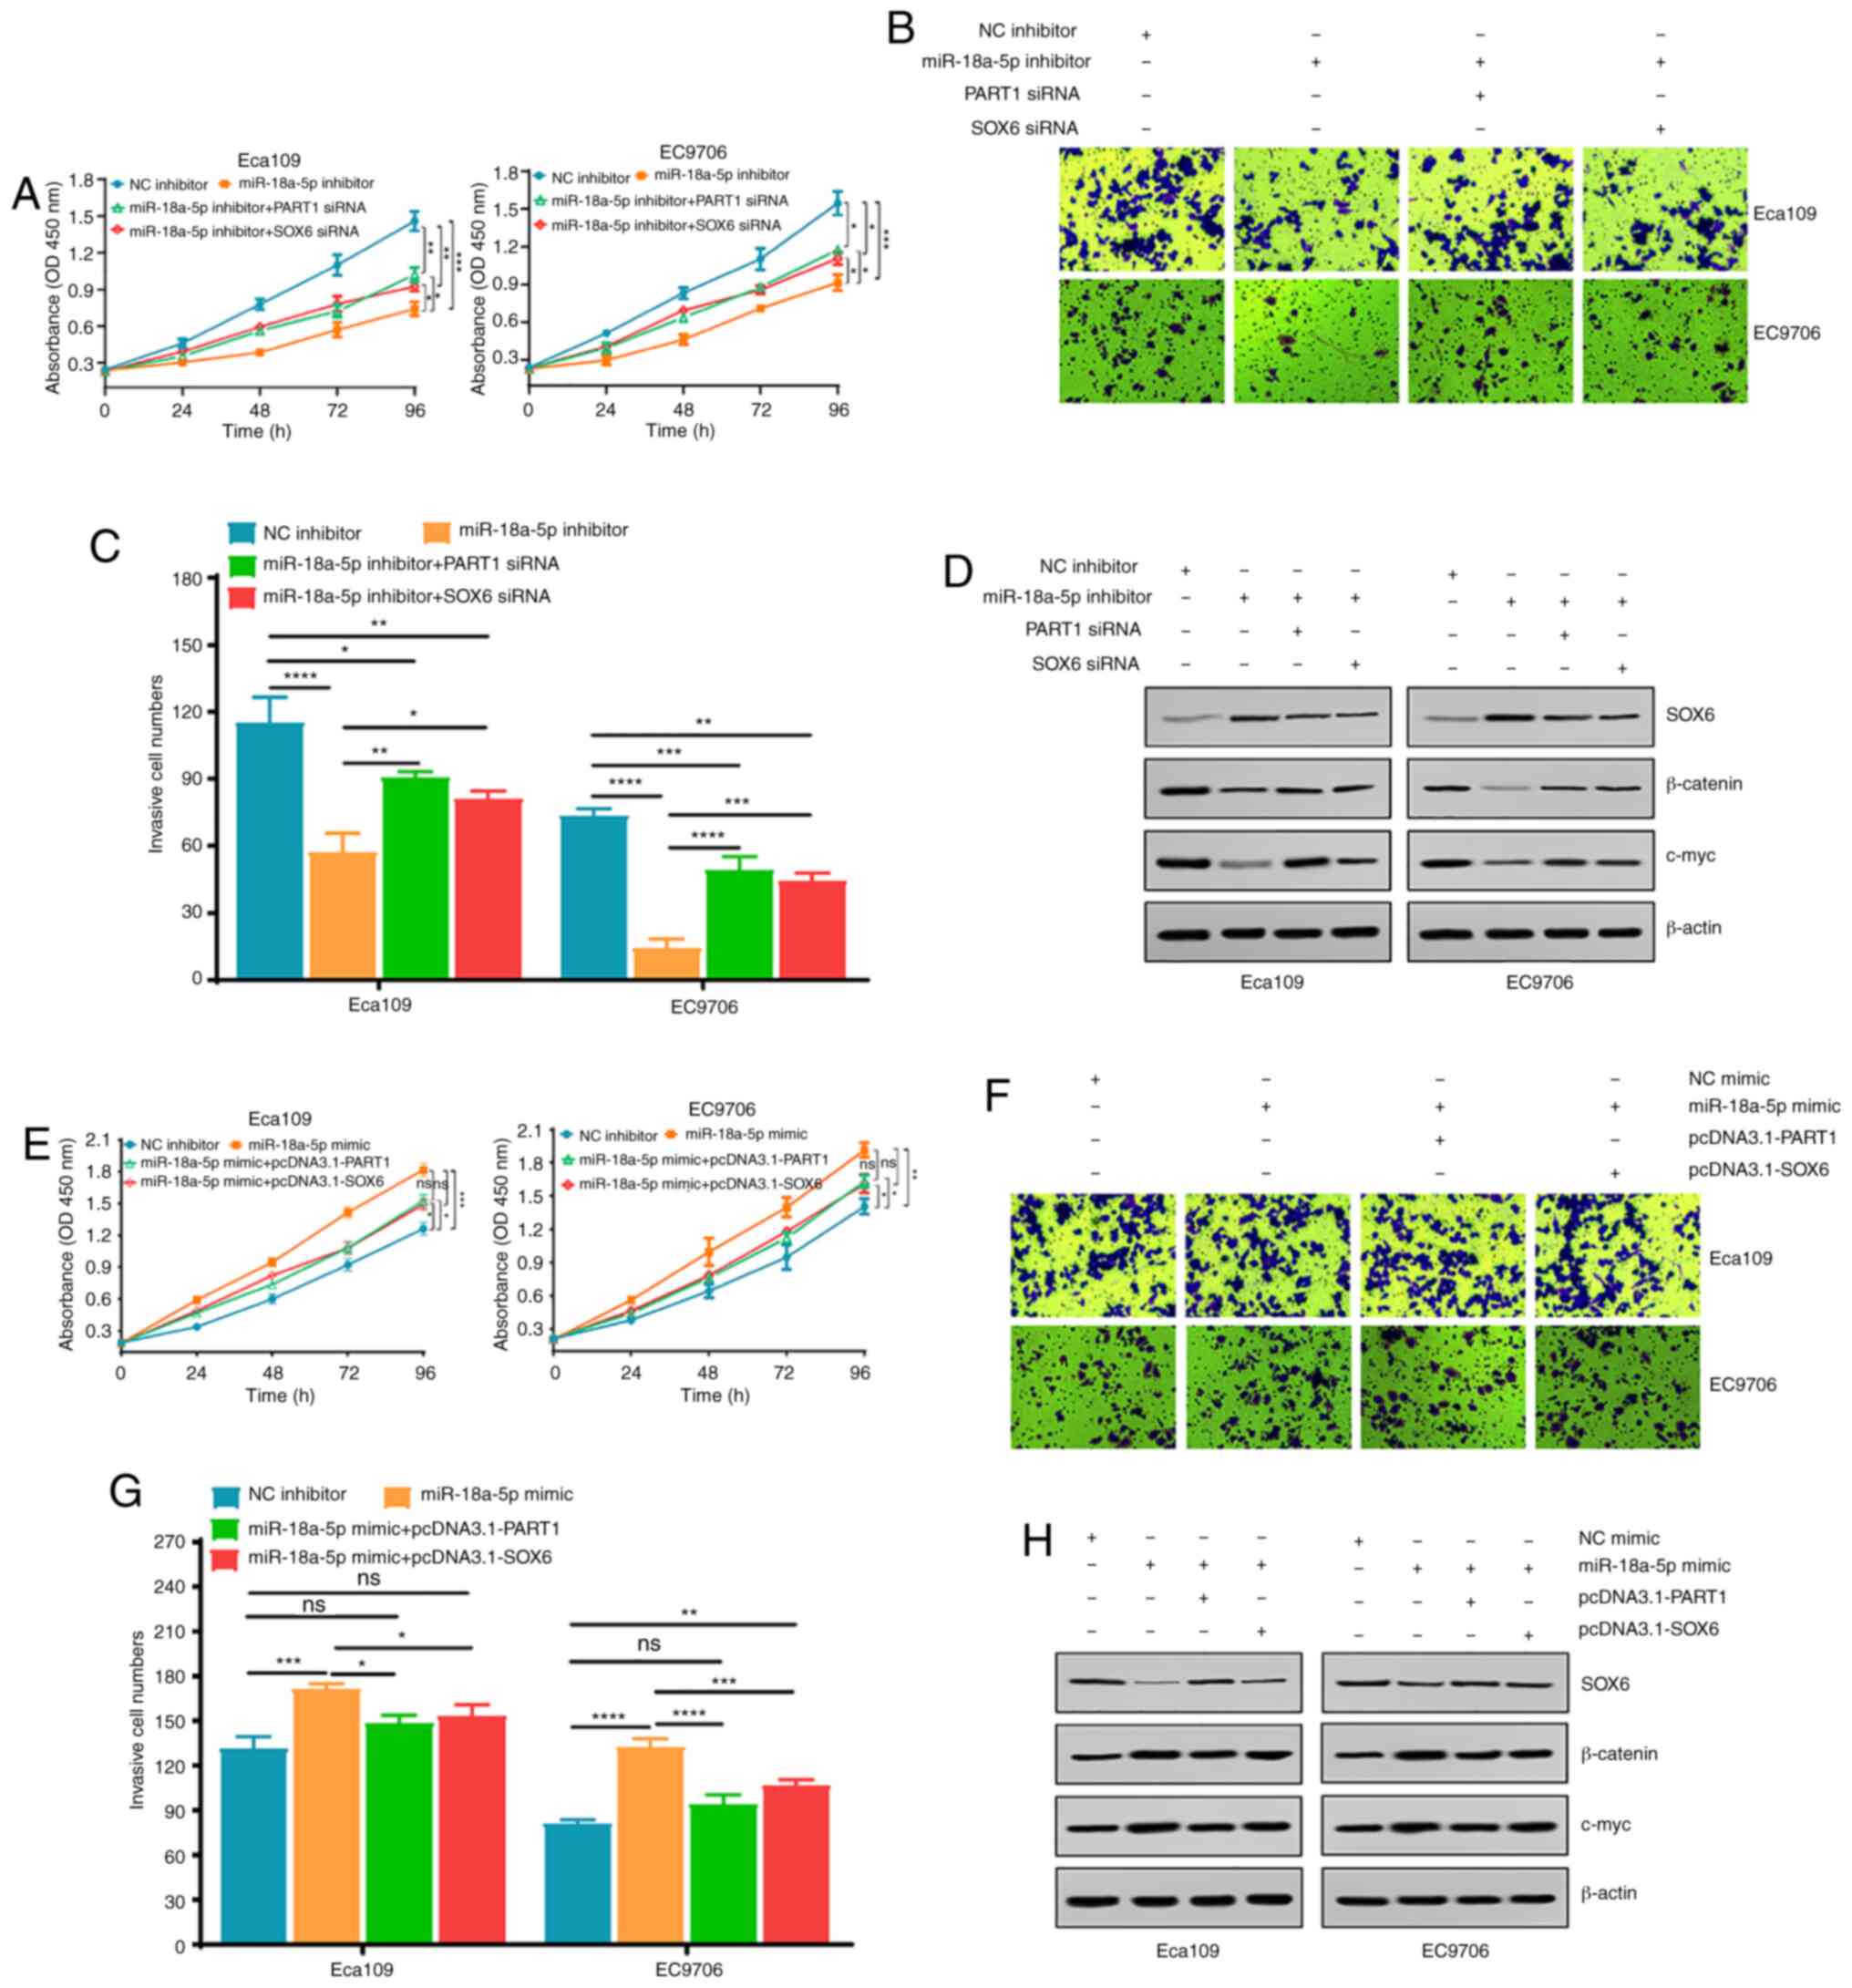 | Figure 6.Biological functions exerted by
miR-18a-5p are dependent on the expression levels of PART1 and SOX6
in the ESCC cell lines. (A) ESCC cell proliferation was assessed
using a CCK-8 assay in the NC inhibitor, miR-18a-5p inhibitor,
miR-18a-5p inhibitor plus PART1 siRNA and miR-18a-5p inhibitor plus
SOX6 siRNA groups. (B) Cell invasion ability was detected using
Matrigel assay in various ESCC cell lines in the different
experimental groups. (C) Quantification of cell invasive in
different ESCC cell lines and experimental groups. (D) Western blot
analysis of SOX6, β-catenin and c-myc protein expression levels in
the different experimental groups. *P<0.05, **P<0.01,
***P<0.001 and ****P<0.0001. (E) ESCC cell proliferation was
assessed using a CCK-8 assay in NC mimic, miR-18a-5p mimic,
miR-18a-5p mimic plus pcDNA3.1-PART1 and miR-18a-5p mimic plus
pcDNA3.1-SOX6 groups. (F) Cell invasion ability was detected using
a Matrigel assay in various ESCC cell lines and the different
experimental groups. (G) Quantification of cell invasive in the
different ESCC cell lines and the experimental groups. (H) Western
blot analysis of SOX6, β-catenin and c-myc protein expression level
in the different experimental groups. *P<0.05, **P<0.01,
***P<0.001 and ****P<0.0001; ns, not significant. CCK-8, Cell
Counting Kit-8; si, small interfering; NC, negative control; miR,
microRNA; ESCC, esophageal squamous cell carcinoma; PART1, prostate
androgen regulated transcript 1; SOX6, SRY-box transcription factor
6. (A, C, E and G) All data were examined by one-way ANOVA and
Bonferroni test. |
Discussion
An increasing number of studies have demonstrated
that lncRNAs play a pivotal role in tumor progression and may be
novel diagnostic and therapeutic opportunities for numerous
patients with cancer. For example, HOTAIR, as a
chromatin-regulating lncRNA, was found to function as an oncogene,
and its overexpression has been associated with tumor progression,
invasion and metastasis (32,33).
ANRIL overexpression was associated with rapid tumor progression
and shortened survival times in patients with nasopharyngeal
carcinoma (34) and hepatocellular
carcinoma (35). In addition,
prostate androgen regulated transcript 1 (PART1) was found to be
significantly upregulated in non-small cell lung cancer (NSCLC),
and was associated with shorter overall survival times; therefore,
it could serve as an independent prognostic marker in patients with
NSCLC with stage I–III (36). Jin
et al (24) found that there
was a low expression level of PART1 in glioma tissues, which was
confirmed using TCGA database and RT-qPCR. PART1, at high
expression levels, was associated with advanced stage and
predicated poor survival time in patients with prostate cancer
(37). These data highlighted the
clinical value of lncRNAs in tumors, particularly in diagnosis and
for prognosis. Currently, the expression level and the potential
clinical value of PART1 in ESCC remain elusive. In the present
study, PART1 was found to be expressed at low levels in ESCC
tissues and cells, and a low expression level was associated with
TNM stage and lymph node metastasis. Notably, patients with ESCC
and low PART1 expression level had poorer survival times compared
with those with high PART1 expression levels. Combined with
previous reports, it is hypothesized that differential expression
patterns of PART1 in different types of tumor are dependent on the
various tumor types. Overall, the data from the present study
supports PART1, as a potential molecular marker for prognosis in
patients with ESCC.
Transcriptional regulation of lncRNAs is important
for lncRNA expression level in numerous types of tumor. A number of
lncRNAs that have been identified to be abnormally expressed were
found to be regulated by either a tumor suppressor, oncogenic
pathways or other transcriptional factors, such as myc, p53 and
NF-κB (38–40). In pancreatic cancer,
hypoxia-inducible factor-1α induced the transcription of
lncRNA-BX111 in the presence of hypoxia, which contributed to the
hypoxia-induced epithelial-mesenchymal transition progression by
regulating the expression level of ZEB1 (12). In addition, the E2F transcription
factor was found to bind to the core promoter region of TINCR to
induce the expression of TINCR in gastric carcinoma, which was
verified using in vivo chromatin IP (41). To address the possible reason for
the low expression level of PART1 in ESCC tissues and cells, the
UCSC and JASPAR online software programs were used to predict the
binding site of FOXP2, within the upstream promoter region of
PART1, and was further confirmed using a reporter assay in the
current study. Increasing evidence has demonstrated that FOXP2
plays important roles in cell proliferation, invasion and
metastasis in a variety of different tumors (42,43),
which suggest that FOXP2 is associated with tumor development and
progression. To preliminarily investigate the function of FOXP2 in
ESCC, the low expression level of FOXP2 was verified using TCGA
database, and was further confirmed using RT-qPCR in 75 ESCC
tissues and matched adjacent normal tissues. Notably, the PART1
level was positively correlated with FOXP2 mRNA expression level in
ESCA tissues, and FOXP2 downregulation markedly suppressed the
expression level of PART1; however, FOXP2 upregulation
significantly increased the expression level of PART1. These data
indicated that the transcription factor, FOXP2 is a direct inducer
of PART1 in ESCC, and the FOXP2/PART1 signaling axis may be a novel
therapeutic target; however, the functions and molecular mechanisms
involved require further investigation.
It is well known that lncRNAs widely participate in
the regulation of cell proliferation, invasion and metastasis in a
large number of tumors. Sun et al (37) found that PART1 downregulation
repressed cell proliferation and promoted cell apoptosis in
prostate cancer. Furthermore, PART1 functions as a tumor suppressor
by sponging miR-190a-3p to inactivate the PTEN/AKT signaling
pathway in glioma (24). To further
uncover the function of PART1 in ESCC cell proliferation and
invasion, PART1 siRNA knockdown and pcDNA3.1-PART1 overexpression
was used to investigate the role of PART1 in cell proliferation and
invasion in the ESCC cell lines. It was found that PART1
downregulation significantly promoted cell proliferation and
invasion, whereas PART1 upregulation markedly suppressed cell
proliferation and invasion in the ESCC cell lines. These findings
suggest that PART1 exerts a tumor-suppressive role in ESCC cell
lines and may be a promising therapeutic target in patients with
ESCC.
Determining the regulatory role of lncRNAs as key
players is important to understand the etiology of several types of
tumor (44). To further investigate
the regulatory mechanisms of PART1 in ESCC, a localization assay
was performed using the lncATLAS online predictive software and
RT-qPCR. It was found that PART1 was primarily localized in the
cytoplasm of the ESCC cell lines, which further identified the
possible function of PART1 as a ceRNA. Further investigation
revealed that miR-18a-5p and PART1 were both enriched using an
anti-Ago2 antibody, and miR-18a-5p mimic significantly increased
the accumulation of PART1 in the ESCC cell lines, suggesting that
miR-18a-5p and PART1 both appear in the RNA-induced silencing
complex. In addition, the binding of miR-18a-5p and PART1 was
confirmed using a dual-luciferase reporter assay, in which, PART1
downregulation promoted the miR-18a-5p expression level and PART1
upregulation suppressed the miR-18a-5p expression level in the ESCC
cell lines. These findings suggest that PART1 could affect the
expression level of miR-18a-5p using a ceRNA mechanism.
Recently, miR-18a-5p has been reported to
participate in tumor progression, and may be a potential biomarker
for the diagnosis and prognosis in a variety of different tumors
(45–47). To further investigate the function
of miR-18a-5p in ESCC development and progresion, it was found that
miR-18a-5p was highly expressed in ESCC tissues and cells, and its
high expression level was associated with TNM stage and lymph node
metastasis in patients with ESCC, sugesting that miR-18a-5p
functions as a tumor oncogene in ESCC. Further investigation
revealed that SOX6 was confirmed as the downstream target gene of
miR-18a-5p in the ESCC cell lines, and its expression level was
negatively correlated with the miR-18a-5p expression level in 75
ESCC samples. In addition, miR-18a-5p inhibitor significantly
promoted the expression level of SOX6, whereas miR-18a-5p mimic
notably downregulated the expression level of SOX6. These findings
suggest that SOX6 is a direct target gene of miR-18a-5p in the ESCC
cell lines. To further elucidate the underlying function of
miR-18a-5p in cell proliferation and invasion, CCK-8 and Matrigel
assays were used and the results demonstrated that miR-18a-5p
inhibitor notably blocked cell proliferation and invasion in the
Eca109 and EC9706 cell lines, which was partly reversed by PART1
siRNA and SOX6 siRNA, while converse data were found when
miR-18a-5p mimic was combined with pcDNA3.1-PART1 or pcDNA3.1-SOX6.
These data highlight the important role of the
PART1/miR-18a-5p/SOX6 signaling axis in ESCC development and
progression.
Several reports have demonstrated that SOX6
downregulaion is found in ESCC, hepatocellular carcinoma and
pancreatic cancer, and is assocuated with the promotion of tumor
progression (48–50). Notably, SOX6 was found to be able to
bind to the armadillo repeats 1–4 of β-catenin to intercept its
oncogenic activities (51), and
c-myc was found to be a pivotal downstream target of β-catenin and
to regulate thousands of genes (52). Based on the aforementioned research,
we hypothesized that PART1 absorbs miR-18a-5p to enhance the
expression level of SOX6, which further results in the inhibition
of the β-catenin/c-myc signaling axis in ESCC. To further
investigate the aforementioned hypothesis, the alterations of
β-catenin and its downstream gene, c-myc, were investigated in this
signaling axis. It was found that miR-18a-5p inhibitor triggered
the upregulation of SOX6 proteins and the downregulation of
β-catenin and c-myc proteins, which was also in part reversed by
PART1 siRNA and SOX6 siRNA, and the inverse effect was exhibited
following the utilization of miR-18a-5p mimic combined with
pcDNA3.1-PART1 or pcDNA3.1-SOX6. The data in the present study
suggest that the PART1/miR-18a-5p/SOX6/β-catenin signaling axis may
be involved in ESCC development and progression, and may be a
promising therapeutic target in patients with ESCC.
In conclusion, the data in the present study
revealed that PART1 was expressed at low levels in ESCC tissues and
cells, and low expression levels were associated with TNM stage,
lymph node metastasis and poor prognosis in patients with ESCC.
PART1 was found to be a direct transcriptional target of the
transcriptional factor, FOXP2, in the ESCC cell lines. PART1
overexpression and knockdown suppressed and promoted cell
proliferation and invasion, respectively, in the Eca109 and EC9706
cell lines. PART1 was found to function as a ceRNA to sponge
miR-18a-5p further resulting in the elevation of SOX6 expression
levels, which triggered the downregulation of β-catenin and c-myc
proteins, and thus, suppressed ESCC progression. The findings from
the present study suggest that targeting the
PART1/miR-18a-5p/SOX6/β-catenin signaling axis may be a novel
therapeutic strategy for patients with ESCC.
Acknowledgements
Not applicable.
Funding
This work was supported by Key R&D and Promotion
Projects in Henan Province (no. 182102310380), the Natural Science
Foundation of Henan Province (no. 182300410377) and the Key
Scientific Research Projects of Henan Higher Education Institutions
(no. 17A180016).
Availability of data and materials
The data that support the findings of this study are
available from the corresponding author upon reasonable
request.
Authors' contributions
SY conceived the research idea and supervised this
study. YZ performed the majority of experiments and interpreted the
data. QZ collected the clinical samples and performed data
analysis. HL, NW and XZ assisted with all the experiments and
revised the manuscript. HL carried out the bioinformatics assay. YZ
prepared the manuscript. All authors discussed the study, read and
approved the final manuscript. All contributing authors agreed to
the submission of this manuscript for publication.
Ethics approval and consent to
participate
This study was reviewed and approved by the Research
and Ethics Committee of the Affiliated Cancer Hospital of Zhengzhou
University (Zhengzhou, China) (approval no. 2019016). The study was
conducted in accordance with the International Ethical Guidelines
for Biomedical Research Involving Human Subjects. All subjects
provided informed consent to participate in the study.
Patient consent for publication
Not applicable.
Competing interests
The authors declare that they have no competing
interests.
References
|
1
|
Jemal A, Bray F, Center MM, Ferlay J, Ward
E and Forman D: Global cancer statistics. CA Cancer J Clin.
61:69–90. 2011. View Article : Google Scholar : PubMed/NCBI
|
|
2
|
Abnet CC, Arnold M and Wei WQ:
Epidemiology of esophageal squamous cell carcinoma.
Gastroenterology. 154:360–373. 2018. View Article : Google Scholar : PubMed/NCBI
|
|
3
|
Yang H, Liu H, Chen Y, Zhu C, Fang W, Yu
Z, Mao W, Xiang J, Han Y, Chen Z, et al: Neoadjuvant
chemoradiotherapy followed by surgery versus surgery alone for
locally advanced squamous cell carcinoma of the esophagus
(NEOCRTEC5010): A phase III multicenter, randomized, open-label
clinical trial. J Clin Oncol. 36:2796–2803. 2018. View Article : Google Scholar : PubMed/NCBI
|
|
4
|
Herskovic A, Russell W, Liptay M, Fidler
MJ and Al-Sarraf M: Esophageal carcinoma advances in treatment
results for locally advanced disease: Review. Ann Oncol.
23:1095–1103. 2012. View Article : Google Scholar : PubMed/NCBI
|
|
5
|
Morris KV and Mattick JS: The rise of
regulatory RNA. Nat Rev Genet. 15:423–437. 2014. View Article : Google Scholar : PubMed/NCBI
|
|
6
|
Parasramka MA, Maji S, Matsuda A, Yan IK
and Patel T: Long non-coding RNAs as novel targets for therapy in
hepatocellular carcinoma. Pharmacol Ther. 161:67–78. 2016.
View Article : Google Scholar : PubMed/NCBI
|
|
7
|
Ulitsky I and Bartel DP: LincRNAs:
Genomics, evolution, and mechanisms. Cell. 154:26–46. 2013.
View Article : Google Scholar : PubMed/NCBI
|
|
8
|
Ma L, Bajic VB and Zhang Z: On the
classification of long non-coding RNAs. RNA Biol. 10:925–933. 2013.
View Article : Google Scholar : PubMed/NCBI
|
|
9
|
Rinn JL and Chang HY: Genome regulation by
long noncoding RNAs. Annu Rev Biochem. 81:145–166. 2012. View Article : Google Scholar : PubMed/NCBI
|
|
10
|
Ponting CP, Oliver PL and Reik W:
Evolution and functions of long noncoding RNAs. Cell. 136:629–641.
2009. View Article : Google Scholar : PubMed/NCBI
|
|
11
|
Rinn JL, Kertesz M, Wang JK, Squazzo SL,
Xu X, Brugmann SA, Goodnough LH, Helms JA, Farnham PJ, Segal E and
Chang HY: Functional demarcation of active and silent chromatin
domains in human HOX loci by noncoding RNAs. Cell. 129:1311–1323.
2007. View Article : Google Scholar : PubMed/NCBI
|
|
12
|
Deng SJ, Chen HY, Ye Z, Deng SC, Zhu S,
Zeng Z, He C, Liu ML, Huang K, Zhong JX, et al: Hypoxia-induced
lncRNA-BX111 promotes metastasis and progression of pancreatic
cancer through regulating ZEB1 transcription. Oncogene.
37:5811–5828. 2018. View Article : Google Scholar : PubMed/NCBI
|
|
13
|
Lin C, Zhang S, Wang Y, Wang Y, Nice E,
Guo C, Zhang E, Yu L, Li M, Liu C, et al: Functional role of a
novel long noncoding RNA TTN-AS1 in esophageal squamous cell
carcinoma progression and metastasis. Clin Cancer Res. 24:486–498.
2018. View Article : Google Scholar : PubMed/NCBI
|
|
14
|
Pandey GK, Mitra S, Subhash S, Hertwig F,
Kanduri M, Mishra K, Fransson S, Ganeshram A, Mondal T, Bandaru S,
et al: The risk-associated long noncoding RNA NBAT-1 controls
neuroblastoma progression by regulating cell proliferation and
neuronal differentiation. Cancer Cell. 26:722–737. 2014. View Article : Google Scholar : PubMed/NCBI
|
|
15
|
Damas ND, Marcatti M, Come C, Christensen
LL, Nielsen MM, Baumgartner R, Gylling HM, Maglieri G, Rundsten CF,
Seemann SE, et al: SNHG5 promotes colorectal cancer cell survival
by counteracting STAU1-mediated mRNA destabilization. Nat Commun.
7:138752016. View Article : Google Scholar : PubMed/NCBI
|
|
16
|
Wang K, Long B, Zhou LY, Liu F, Zhou QY,
Liu CY, Fan YY and Li PF: CARL lncRNA inhibits anoxia-induced
mitochondrial fission and apoptosis in cardiomyocytes by impairing
miR-539-dependent PHB2 downregulation. Nat Commun. 5:35962014.
View Article : Google Scholar : PubMed/NCBI
|
|
17
|
Peng WX, Koirala P and Mo YY:
lncRNA-mediated regulation of cell signaling in cancer. Oncogene.
36:5661–5667. 2017. View Article : Google Scholar : PubMed/NCBI
|
|
18
|
Schmitt AM and Chang HY: Long noncoding
RNAs in cancer pathways. Cancer Cell. 29:452–463. 2016. View Article : Google Scholar : PubMed/NCBI
|
|
19
|
Xiao G, Li Y, Wang Y, Zhao B, Zou Z, Hou
S, Jia X, Liu X, Yao Y, Wan J and Xiong H: lncRNA PRAL is closely
related to clinical prognosis of multiple myeloma and the
bortezomib sensitivity. Exp Cell Res. 370:254–263. 2018. View Article : Google Scholar : PubMed/NCBI
|
|
20
|
Qiu L, Tang Q, Li G and Chen K: Long
non-coding RNAs as biomarkers and therapeutic targets: Recent
insights into hepatocellular carcinoma. Life Sci. 191:273–282.
2017. View Article : Google Scholar : PubMed/NCBI
|
|
21
|
Lin B, White JT, Ferguson C, Bumgarner R,
Friedman C, Trask B, Ellis W, Lange P, Hood L and Nelson PS:
PART-1: A novel human prostate-specific, androgen-regulated gene
that maps to chromosome 5q12. Cancer Res. 60:858–863.
2000.PubMed/NCBI
|
|
22
|
Lou T, Ke K, Zhang L, Miao C and Liu Y:
lncRNA PART1 facilitates the malignant progression of colorectal
cancer via miR-150-5p/LRG1 axis. J Cell Biochem. 121:4271–4281.
2020. View Article : Google Scholar : PubMed/NCBI
|
|
23
|
Kang M, Ren M, Li Y, Fu Y, Deng M and Li
C: Exosome-mediated transfer of lncRNA PART1 induces gefitinib
resistance in esophageal squamous cell carcinoma via functioning as
a competing endogenous RNA. J Exp Clin Cancer Res. 37:1712018.
View Article : Google Scholar : PubMed/NCBI
|
|
24
|
Jin Z, Piao L, Sun G, Lv C, Jing Y and Jin
R: Long non-coding RNA PART1 exerts tumor suppressive functions in
glioma via sponging miR-190a-3p and inactivation of PTEN/AKT
pathway. Onco Targets Ther. 13:1073–1086. 2020. View Article : Google Scholar : PubMed/NCBI
|
|
25
|
Xuan C, Jin M, Wang L, Xue S, An Q, Sun Q,
Wang L and Gao Y: PART1 and hsa-miR-429-Mediated SHCBP1 expression
is an independent predictor of poor prognosis in glioma patients.
Biomed Res Int. 2020:17670562020. View Article : Google Scholar : PubMed/NCBI
|
|
26
|
Kim JH, Hwang J, Jung JH, Lee HJ, Lee DY
and Kim SH: Molecular networks of FOXP family: Dual biologic
functions, interplay with other molecules and clinical implications
in cancer progression. Mol Cancer. 18:1802019. View Article : Google Scholar : PubMed/NCBI
|
|
27
|
Herrero MJ and Gitton Y: The untold
stories of the speech gene, the FOXP2 cancer gene. Genes Cancer.
9:11–38. 2018. View Article : Google Scholar : PubMed/NCBI
|
|
28
|
Gascoyne DM, Spearman H, Lyne L, Puliyadi
R, Perez-Alcantara M, Coulton L, Fisher SE, Croucher PI and Banham
AH: The forkhead transcription factor FOXP2 is required for
regulation of p21WAF1/CIP1 in 143B osteosarcoma cell growth arrest.
PLoS One. 10:e01285132015. View Article : Google Scholar : PubMed/NCBI
|
|
29
|
Chen Z, Li J, Tian L, Zhou C, Gao Y, Zhou
F, Shi S, Feng X, Sun N, Yao R, et al: miRNA expression profile
reveals a prognostic signature for esophageal squamous cell
carcinoma. Cancer Lett. 350:34–42. 2014. View Article : Google Scholar : PubMed/NCBI
|
|
30
|
Li JH, Liu S, Zhou H, Qu LH and Yang JH:
StarBase v2.0: Decoding miRNA-ceRNA, miRNA-ncRNA and protein-RNA
interaction networks from large-scale CLIP-Seq data. Nucleic Acids
Res. 42((Database Issue)): D92–D97. 2014. View Article : Google Scholar : PubMed/NCBI
|
|
31
|
Livak KJ and Schmittgen TD: Analysis of
relative gene expression data using real-time quantitative PCR and
the 2(-Delta Delta C(T)) method. Methods. 25:402–408. 2001.
View Article : Google Scholar : PubMed/NCBI
|
|
32
|
Tsai MC, Manor O, Wan Y, Mosammaparast N,
Wang JK, Lan F, Shi Y, Segal E and Chang HY: Long noncoding RNA as
modular scaffold of histone modification complexes. Science.
329:689–693. 2010. View Article : Google Scholar : PubMed/NCBI
|
|
33
|
Hajjari M and Salavaty A: HOTAIR: An
oncogenic long non-coding RNA in different cancers. Cancer Biol
Med. 12:1–9. 2015.PubMed/NCBI
|
|
34
|
Zou ZW, Ma C, Medoro L, Chen L, Wang B,
Gupta R, Liu T, Yang XZ, Chen TT, Wang RZ, et al: lncRNA ANRIL is
up-regulated in nasopharyngeal carcinoma and promotes the cancer
progression via increasing proliferation, reprograming cell glucose
metabolism and inducing side-population stem-like cancer cells.
Oncotarget. 7:61741–61754. 2016. View Article : Google Scholar : PubMed/NCBI
|
|
35
|
Hua L, Wang CY, Yao KH, Chen JT, Zhang JJ
and Ma WL: High expression of long non-coding RNA ANRIL is
associated with poor prognosis in hepatocellular carcinoma. Int J
Clin Exp Pathol. 8:3076–3082. 2015.PubMed/NCBI
|
|
36
|
Li M, Zhang W, Zhang S, Wang C and Lin Y:
PART1 expression is associated with poor prognosis and tumor
recurrence in stage I–III non-small cell lung cancer. J Cancer.
8:1795–1800. 2017. View Article : Google Scholar : PubMed/NCBI
|
|
37
|
Sun M, Geng D, Li S, Chen Z and Zhao W:
lncRNA PART1 modulates toll-like receptor pathways to influence
cell proliferation and apoptosis in prostate cancer cells. Biol
Chem. 399:387–395. 2018. View Article : Google Scholar : PubMed/NCBI
|
|
38
|
Hung T, Wang Y, Lin MF, Koegel AK, Kotake
Y, Grant GD, Horlings HM, Shah N, Umbricht C, Wang P, et al:
Extensive and coordinated transcription of noncoding RNAs within
cell-cycle promoters. Nat Genet. 43:621–629. 2011. View Article : Google Scholar : PubMed/NCBI
|
|
39
|
Huarte M, Guttman M, Feldser D, Garber M,
Koziol MJ, Kenzelmann-Broz D, Khalil AM, Zuk O, Amit I, Rabani M,
et al: A large intergenic noncoding RNA induced by p53 mediates
global gene repression in the p53 response. Cell. 142:409–419.
2010. View Article : Google Scholar : PubMed/NCBI
|
|
40
|
Guttman M, Amit I, Garber M, French C, Lin
MF, Feldser D, Huarte M, Zuk O, Carey BW, Cassady JP, et al:
Chromatin signature reveals over a thousand highly conserved large
non-coding RNAs in mammals. Nature. 458:223–227. 2009. View Article : Google Scholar : PubMed/NCBI
|
|
41
|
Xu TP, Wang YF, Xiong WL, Ma P, Wang WY,
Chen WM, Huang MD, Xia R, Wang R, Zhang EB, et al: E2F1 induces
TINCR transcriptional activity and accelerates gastric cancer
progression via activation of TINCR/STAU1/CDKN2B signaling axis.
Cell Death Dis. 8:e28372017. View Article : Google Scholar : PubMed/NCBI
|
|
42
|
Chen MT, Sun HF, Li LD, Zhao Y, Yang LP,
Gao SP and Jin W: Downregulation of FOXP2 promotes breast cancer
migration and invasion through TGFβ/SMAD signaling pathway. Oncol
Lett. 15:8582–8588. 2018.PubMed/NCBI
|
|
43
|
Wu J, Liu P, Tang H, Shuang Z, Qiu Q,
Zhang L, Song C, Liu L, Xie X and Xiao X: FOXP2 promotes tumor
proliferation and metastasis by Targeting GRP78 in triple-negative
breast cancer. Curr Cancer Drug Targets. 18:382–389. 2018.
View Article : Google Scholar : PubMed/NCBI
|
|
44
|
Wapinski O and Chang HY: Long noncoding
RNAs and human disease. Trends Cell Biol. 21:354–361. 2011.
View Article : Google Scholar : PubMed/NCBI
|
|
45
|
Wang H, Wei X, Wu B, Su J, Tan W and Yang
K: Tumor-educated platelet miR-34c-3p and miR-18a-5p as potential
liquid biopsy biomarkers for nasopharyngeal carcinoma diagnosis.
Cancer Manag Res. 11:3351–3360. 2019. View Article : Google Scholar : PubMed/NCBI
|
|
46
|
Li Y, He ZC, Liu Q, Zhou K, Shi Y, Yao XH,
Zhang X, Kung HF, Ping YF and Bian XW: Large intergenic non-coding
RNA-RoR inhibits aerobic glycolysis of glioblastoma cells via Akt
pathway. J Cancer. 9:880–889. 2018. View Article : Google Scholar : PubMed/NCBI
|
|
47
|
Liang C, Zhang X, Wang HM, Liu XM, Zhang
XJ, Zheng B, Qian GR and Ma ZL: MicroRNA-18a-5p functions as an
oncogene by directly targeting IRF2 in lung cancer. Cell Death Dis.
8:e27642017. View Article : Google Scholar : PubMed/NCBI
|
|
48
|
Qin YR, Tang H, Xie F, Liu H, Zhu Y, Ai J,
Chen L, Li Y, Kwong DL, Fu L and Guan XY: Characterization of
tumor-suppressive function of SOX6 in human esophageal squamous
cell carcinoma. Clin Cancer Res. 17:46–55. 2011. View Article : Google Scholar : PubMed/NCBI
|
|
49
|
Wang J, Ding S, Duan Z, Xie Q, Zhang T,
Zhang X, Wang Y, Chen X, Zhuang H and Lu F: Role of p14ARF-HDM2-p53
axis in SOX6-mediated tumor suppression. Oncogene. 35:1692–1702.
2016. View Article : Google Scholar : PubMed/NCBI
|
|
50
|
Jiang W, Yuan Q, Jiang Y, Huang L, Chen C,
Hu G, Wan R, Wang X and Yang L: Identification of Sox6 as a
regulator of pancreatic cancer development. J Cell Mol Med.
22:1864–1872. 2018. View Article : Google Scholar : PubMed/NCBI
|
|
51
|
Iguchi H, Urashima Y, Inagaki Y, Ikeda Y,
Okamura M, Tanaka T, Uchida A, Yamamoto TT, Kodama T and Sakai J:
SOX6 suppresses cyclin D1 promoter activity by interacting with
beta-catenin and histone deacetylase 1, and its down-regulation
induces pancreatic beta-cell proliferation. J Biol Chem.
282:19052–19061. 2007. View Article : Google Scholar : PubMed/NCBI
|
|
52
|
Kim J, Woo AJ, Chu J, Snow JW, Fujiwara Y,
Kim CG, Cantor AB and Orkin SH: A Myc network accounts for
similarities between embryonic stem and cancer cell transcription
programs. Cell. 143:313–324. 2010. View Article : Google Scholar : PubMed/NCBI
|