Introduction
Hepatocellular carcinoma (HCC) is the fifth most
common cancer in the world and the third leading cause of death
from cancer, with a global annual mortality of >780,000 deaths
(1,2).
The poor overall survival rate of patients with HCC is primarily
caused by late diagnosis of the disease, which precludes
therapeutic radical surgery for the majority of patients (3) because of the high potential for
metastasis and recurrence. The prognosis for patients suitable for
radical surgical resection is still poor (4,5). However,
the molecular mechanism underlying the development and progression
of liver cancer remain largely unknown. Greater understanding of
the transcriptional activation of oncogene signaling pathways and
the control of cancer-associated genes may improve early diagnosis
and prognosis, thus potentially decreasing adverse clinical
outcomes for patients with liver cancer.
The spindle and kinetochore-associated (SKA) protein
complex is essential for accurate chromosome segregation during
mitosis, and comprises two copies of the SKA1, SKA2 and SKA3
proteins (6–10). SKA3, a novel kinetochore protein, may
directly mediate kinetochore-microtubule interactions (8). SKA3 was first identified by screening
for overexpressed genes in colorectal cancer (11,12). SKA3
is located at chromosome 13q12.11 and may be involved in malignant
transformation (11–13). Overexpression of SKA3 has been
implicated in breast and prostate cancer and is associated with
increased aggressiveness in carcinoma (13,14).
Deregulation of SKA3 increases the proliferation of colorectal
cancer cells and promotes G2/M arrest and entry into S
phase of the cell division cycle (11). These findings suggested that SKA3
serves an important role in the development and progression of
human malignant tumors. However, the expression pattern, clinical
relevance and potential molecular mechanism of SKA3 in liver cancer
are still controversial and remain to be explored.
The present study evaluated the prognostic
significance of SKA3 expression in HCC using The Cancer Genome
Atlas (TCGA) database. Cell cycle-associated genes and pathways
that were altered in response to changes in SKA3 expression levels
were further evaluated using gene sets enrichment analysis (GSEA).
We analyzed the expression of SKA3 in liver cancer. Then, we
specifically knocked down and overexpressed SKA3, and assessed the
effect on cell proliferation, cell cycle, and tumor formation
ability in liver cancer cells. Collectively, the present study
revealed that SKA3 may be a potential diagnostic and prognostic
marker in liver cancer and an effective target for the treatment
this disease.
Materials and methods
Patients and tissue samples
The present study used paraffin-embedded HCC samples
from 110 patients who underwent curative hepatectomy. Patients
should fulfill the following criteria: No evidence of extrahepatic
metastasis, main portal vein infiltration/thrombosis, and eligible
for curative hepatectomy. Exclusion criteria for this study
included: Rehepatectomy, preoperative combination with other tumors
or prior history of other tumors. The samples had been clinically
and histologically diagnosed at the Third Affiliated Hospital of
Sun Yat-sen University (Guangzhou, China) between January 2011 and
December 2012. A total of 10 HCC and 3 normal tissue samples were
frozen and stored in liquid nitrogen and these tissues to
investigate the mRNA and protein levels of SKA3. A total of three
normal liver specimens obtained from the edge of the liver were
used to isolate normal primary human hepatocytes. The HCC samples
were obtained from patients: 99 (90%) men and 11 (10%) women. The
median age of the patients was 54 years (range, 31–76 years). The
patients were followed up from 1–77 months, with a median of 23
months. Clinicopathological information is summarized in Table I. All clinical specimens were obtained
with informed consent and the study was approved by the Clinical
Research Ethics Committee of the Third Affiliated Hospital of Sun
Yat-sen University. Informed written consent was obtained from all
patients. Tumor stages were determined according to the HCC TNM
staging system of the 8th American Joint Committee on Cancer (AJCC)
in January 2018 (15).
 | Table I.Clinicopathological characteristics
of patients with hepatocellular carcinoma. |
Table I.
Clinicopathological characteristics
of patients with hepatocellular carcinoma.
| Characteristic | Number of
cases |
|---|
| Sex |
|
|
Male | 99 |
|
Female | 11 |
| Age, years |
|
|
>45 | 72 |
|
≤45 | 38 |
| Clinical stage |
|
| I | 66 |
| II | 26 |
|
III | 12 |
| IV | 6 |
| T
classification |
|
| T1 | 52 |
| T2 | 21 |
| T3 | 15 |
| T4 | 22 |
| N
classification |
|
| N0 | 97 |
| N1 | 13 |
| M
classification |
|
|
Yes | 6 |
| No | 104 |
| Cirrhosis |
|
|
Yes | 67 |
| No | 43 |
| Hepatitis B
antigen |
|
|
Yes | 100 |
| No | 10 |
| Outcome |
|
|
Survival | 32 |
|
Mortality | 78 |
Cell lines and transfection
Hep3B, Huh7, SK-Hep1, HepG2, MHCC97-H, MHCC97-L,
SNU-387 and SNU-475 liver cancer cells were obtained from the Cell
Bank of Shanghai Institute of Biology, Chinese Academy of Science
(Shanghai, China). Normal primary human hepatocytes were isolated
from liver specimens using a standardized two-step collagenase
perfusion technique (16,17). High yield and high activity normal
liver cells were obtained. All cells were cultured in DMEM,
supplemented with 1% penicillin-streptomycin (both Invitrogen;
Thermo Fisher Scientific, Inc.) and 10% FBS (HyClone; GE Healthcare
Life Sciences) at 37°C with 5% CO2. Cells were
sub-cultured every 1–2 days to maintain logarithmic growth. Huh7
and HepG2 were transfected with short hairpin (sh)RNA against SKA3
to knock down SKA3, and lentivirus overexpressing vector to
increase the expression of SKA3. Vector and non-specific scramble
shRNA were used as negative controls. The plasmids for expression
of SKA3, SKA3-specific shRNA, and their relevant lentiviruses were
obtained from Shanghai GeneChem, Co., Ltd. The cells were incubated
in a humidified 5% CO2 atmosphere for 24 h at 37°C.
Finally, the diluted virus was replaced with fresh medium and
incubated for another 48 h under the same conditions. Subsequently,
the transfection efficiency was examined by western blotting. Liver
cancer cells were transduced with individual types of lentivirus at
a multiplicity of infection (MOI) of 10 in the presence of 5 µg/ml
puromycin [Hanheng Biotechnology (Shanghai) Co., Ltd.]. The two
SKA3 sequence were: shSKA3#1, GATCTGTCTGATCCTCCTGTT; and shSKA3#2,
CCACAGGCAGTGAACAACTAT. According to the manufacturer's
instructions, liver cancer cells were transfected using Block
Lentiviral shRNA Expression system (Invitrogen; Thermo Fisher
Scientific, Inc.). Subsequent experiments were performed 48 h after
transfection.
RNA extraction and reverse
transcription-quantitative (RT-q)PCR
Total RNA from cell lines, 11 fresh tissue samples
and tissue from athymic nude mice were extracted using
TRIzol® reagent (Invitrogen; Thermo Fisher Scientific,
Inc.) according to the manufacturer's instruction. The cDNA
synthesis was performed according to the manufacturer's
instructions (Invitrogen; Thermo Fisher Scientific, Inc.). PCR
reaction conditions for all assays were 95°C for 2 min, followed by
40 cycles of amplification (95°C for 10 sec, 60°C for 20 sec and
72°C for 20 sec). RT-qPCR was performed using the following
primers: SKA3, forward, 5′-TACACGAGCAAGAAGCCATTAAC-3′ and reverse,
5′-GGATACGATGTACCGCTCAAGT-3′; p21, forward,
5′-CGATGCCAACCTCCTCAACGA-3′ and reverse,
5′-TCGCAGACCTCCAGCATCCA-3′; and Cyclin D1, forward,
5′-AACTACCTGGACCGCTTCCT-3′ and reverse, 5′-CCACTTGAGCTTGTTCACCA-3′.
GAPDH was used as the endogenous control with the following
primers: Forward, 5′-ACAACTTTGGTATCGTGGAAGG-3′ and reverse,
5′-GCCATCACGCCACAGTTTC-3′. Expression levels were normalized to
those of GAPDH and calculated as 2−[(Cq of genes)-(Cq of
GAPDH)], where Cq represents the threshold cycle for each
transcript (18). All experiments
were repeated three times.
Western blotting
Western blotting was performed as described
previously (18). The following
antibodies (all 1:1,000) were used: SKA3 (cat. no. ab118560;
Abcam), anti-p-Rb (cat. no. D20B12; Cell Signaling Technology,
Inc.), anti-Rb (cat. no. D20; Cell Signaling Technology, Inc.) and
α-tubulin (cat. no. ab7291; Abcam) as an internal loading control.
The expression levels of SKA3 were detected using enhanced
chemiluminescence detection system (Amersham; Cytiva) according to
the manufacturer's instructions.
Immunohistochemistry (IHC)
IHC and SKA3 expression scoring were performed as
previously reported (19). Image-Pro
Plus version 6.0 software (Media Cybernetics, Inc.) was used to
judge the area and density of the dyed region, and the integrated
optical density (IOD) value of the IHC section. The intensity of
staining was graded as follows: 0 (no staining), 1 (weak staining,
light yellow), 2 (moderate staining, yellow brown), and 3 (strong
staining, brown). The proportion of tumor cells was scored as
follows: 0 (no positive tumor cells), 1 (<10% positive tumor
cells), 2 (10–50% positive tumor cells), 3 (50–75% positive tumor
cells), and 4 (>75% positive tumor cells). The staining index
(SI) was calculated by the product of the staining intensity score
and the proportion of positive tumor cell score. The optimal
cut-off value was determined: SI score ≥6 was considered to
indicate high SKA3 expression, while a score <6 indicated low
expression.
Cell proliferation assay
Cell proliferation was measured via MTT assay
(Sigma-Aldrich; Merck KGaA). In brief, treated and untreated Huh7
and HepG2 cells were inoculated into 96-well plates. The cells were
incubated with 20 µl 5 mg/ml MTT solution in a humid atmosphere
containing 5% CO2 at 37°C for 4 h. The OD was measured
at 490 nm using a spectrophotometer following cell lysis and
dissolution of methoxypyrine in 150 µl DMSO. The calculation
formula of proliferation inhibition rate was as follows:
Proliferation inhibition
rate=ODsample/ODcontrol. All experiments were
repeated three times, and the mean values were plotted to construct
cell proliferation inhibition curves.
Colony formation assay
Both non-transfected and transfected Huh7 and HepG2
cells were seeded in 6-well plates at a density of 1,000
cells/well. After 12 days, cells were fixed with 4%
paraformaldehyde for 30 min and stained with 0.1% crystal violet
for 30 min at 37°C. Next, the plates were washed gently with PBS,
then air dried and the stained colonies were photographed under an
inverted light microscope (×200 magnification; Leica Biosystems).
The colonies were counted in 10 randomly chosen microscope fields.
The experiments were repeated three times.
Cell cycle distribution analysis
Propidium iodide (PI) staining was used to analyze
DNA content. Treated and untreated Huh7 and HepG2 cells were washed
with PBS and fixed in ice-cold ethanol at −20°C overnight. and
stained with staining solution containing 20 µg/ml PI and 100 µg/ml
RNase (both Sigma-Aldrich; Merck KGaA) for 20 min at 4°C. A FACScan
flow cytometer (BD Biosciences) was used to analyze DNA content and
FlowJo version 7.6 software (FlowJo LLC) was used to determine the
percentage of cells in G1/G0, S and
G2/M phase. The experiments were repeated three
times.
Luciferase reporter gene assay
Cells were seeded in 24-well plates in triplicate
and allowed to stand for 24 h. E2F 3′-untranslated region (UTR) was
cloned into the downstream region of the luciferase gene in the
pGME2F-Lu luciferase vector. For the reporter assay, the E2F
luciferase reporter plasmid pGME2F-Lu Genomeditech Inc.), 1 ng
pRL-TK Renilla plasmid (Promega Corporation), and a SKA3 mimic,
SKA3 inhibitor or SKA3 control vector were transfected into cells
using Lipofectamine 2000 Reagent (Invitrogen; Thermo Fisher
Scientific, Inc.). The primer sequences of E2F 5′-3′ UTR were
5′-GGCCCGAUCGAUGUUUUCCTT-3′ (forward) and
5′-GGAAAACAUCGAUCGGGCCTT-3′ (reverse). Following 48 h transfection,
cells were lyzed and luciferase activity was measured using
Dual-Luciferase Reporter Assay kit (Promega Corporation) according
to the manufacturer's instructions. Data were standardized to
Renilla luciferase activity.
TCGA data processing and GSEA
In order to investigate the expression levels of
SKA3 in liver tissue, data from TCGA (tcgadata.nci.nih.gov/tcga/) was analyzed. Gene
expression levels and clinical data of patients were integrated
according to their barcode ID. In order to determine the biological
pathways underlying the effect of SKA3 in liver cancer, GSEA, a
method of using biological knowledge to analyze and interpret
microarray and data (20), was
conducted using GSEA version 2.0 of the Broad Institute (21). GSEA firstly generated an ordered gene
list according to correlation with SKA3 expression, then a
pre-defined gene set enrichment score (ES) was obtained to refute
the hypothesis that its members are randomly distributed in the
ordered list. The BENPORATH_PROLIFERATION gene set (C2. BENPORATH.
V3.0) biological process database from the Molecular Signatures
Database was used for enrichment analysis (22). P-value was calculated using an
arrangement of 1,000 random samples. A false discovery rate (FDR)
<25% and nominal P-value <0.05 were considered to indicate a
statistically significant difference.
Anchorage-independent growth ability
assay
Complete medium agar (1%; Sigma-Aldrich; Merck KGaA)
mixture was poured into the wells of a 6-well plate. Following
solidification, cells (1×10³) were digested with trypsin
and suspended in 2 ml medium supplemented with 0.3% agar, and then
spread on the bottom layer. Following incubating at 37°C, 5%
CO2 for 10 days, colony size was measured with an ocular
micrometer and colonies with a diameter >0.1 mm were counted.
The experiment was performed independently three times.
Tumor xenograft models
For in vivo tumor proliferation assays, a
subcutaneous HCC model was established. Twenty six-week-old male
BALB/c (nu/nu) mice (average weight, 15 g) were supplied by Beijing
Weitong Lihua Laboratory Animal Technology Co., Ltd. The mice were
raised in the animal facility at Sun Yat-sen University (Guangzhou,
China) under specific pathogen-free laboratory with a 12 h
light/dark cycle at 22±2°C and 60±5% humidity, provided with free
access to food and water. The mice were randomly divided into four
groups (n=5/group) and injected with 2×10⁶ Huh7 cells
transfected with empty vector, SKA3, scramble or shSKA3#2. Tumor
volume was monitored by measuring the length (L) and width (W) at
3-day intervals for 4 weeks and calculated using the equation
(LxW2)/2. At 4 weeks following liver cancer cell
inoculation, all animals were euthanized with 100% CO2
infused at 30% volume/minute displacement and then subjected to
cervical dislocation in accordance with AVMA institutional
guidelines (23). Respiratory and
cardiac arrest and pupil dilation were considered to indicate
animal death. The tumor tissues were dissected, weighed and
subjected to pathological examination. The mean animal weight
before tumor excision was 21.3±2.2 g. Animal experiments were
approved by the Institutional Animal Ethics Committee at Sun
Yat-sen University (no. 2017-047).
Statistical analysis
Statistical analysis was performed using SPSS 21.0
(IBM Corp.) statistical software. Each experiment was performed at
least in triplicate. All the data are generally expressed as the
mean ± SEM or counts and and percentages. A chi-square test and
Fisher's exact test were used to assess the association between
SKA3 expression and clinicopathological factors. Pearson's
correlation analysis was used to evaluate the relationship between
SKA3 and clinical pathologic factors. The differences between
groups were analyzed by two-tailed Student's t-test or one-way
ANOVA followed by Tukey's honestly significant difference post hoc
test. Survival curves were constructed via the Kaplan-Meier method
and compared with log-rank test. Univariate and multivariate Cox
regression analysis was used to evaluate the significance of
variables for survival. P<0.05 was considered to indicate a
statistically significant difference.
Results
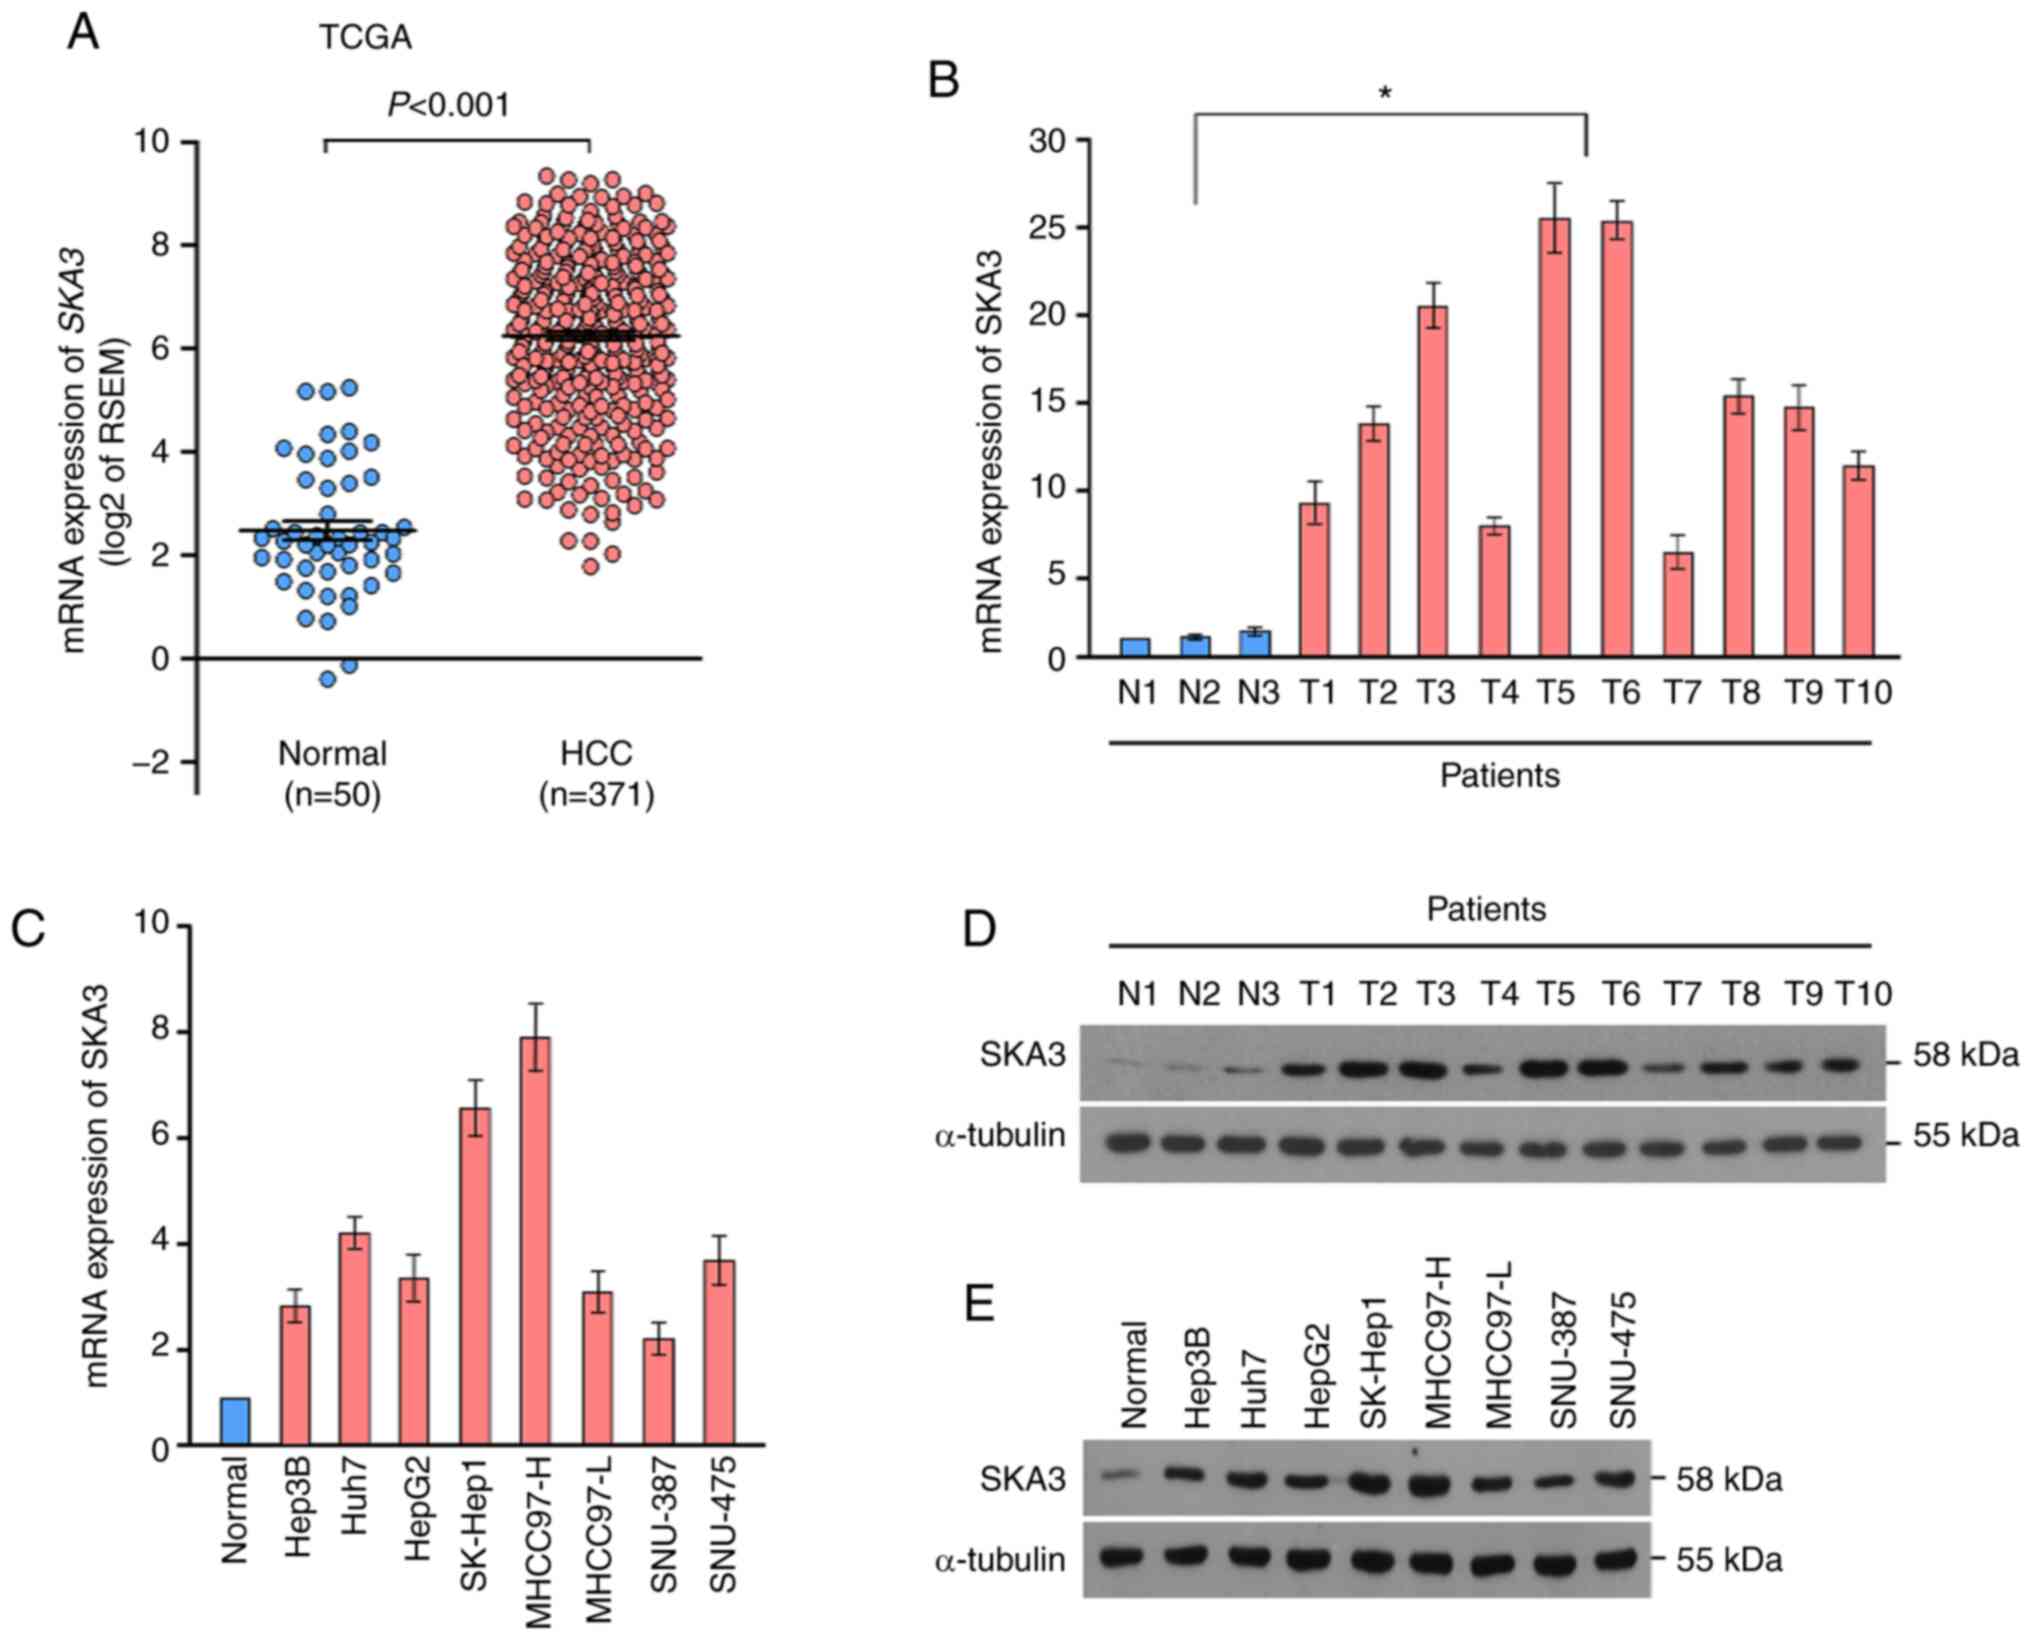
SKA3 is upregulated in HCC
SKA3 expression levels were extracted from TCGA
liver cancer cohorts and were revealed to be significantly
increased in HCC tissue compared with normal liver tissue (Fig. 1A). Furthermore, RT-qPCR was performed
to evaluate mRNA expression levels of SKA3 in 10 solid tumor and
three normal liver tissue samples from patients. SKA3 mRNA
expression levels were significantly elevated in HCC tumors
compared with normal tissue (Fig.
1B). SKA3 mRNA levels in all cultured liver cancer cell lines
were also significantly higher than those in the normal hepatocyte
lines (Fig. 1C). In order to
investigate whether SKA3 was also upregulated at the protein level,
western blotting was performed. The protein levels of SKA3 in
clinical HCC tissue and cultured liver cancer cell lines were
upregulated compared with their normal counterparts (Fig. 1D and E). These results indicated that
SKA3 is overexpressed in HCC at both the mRNA and protein
level.
Association between SKA3 expression
levels and clinical features of HCC
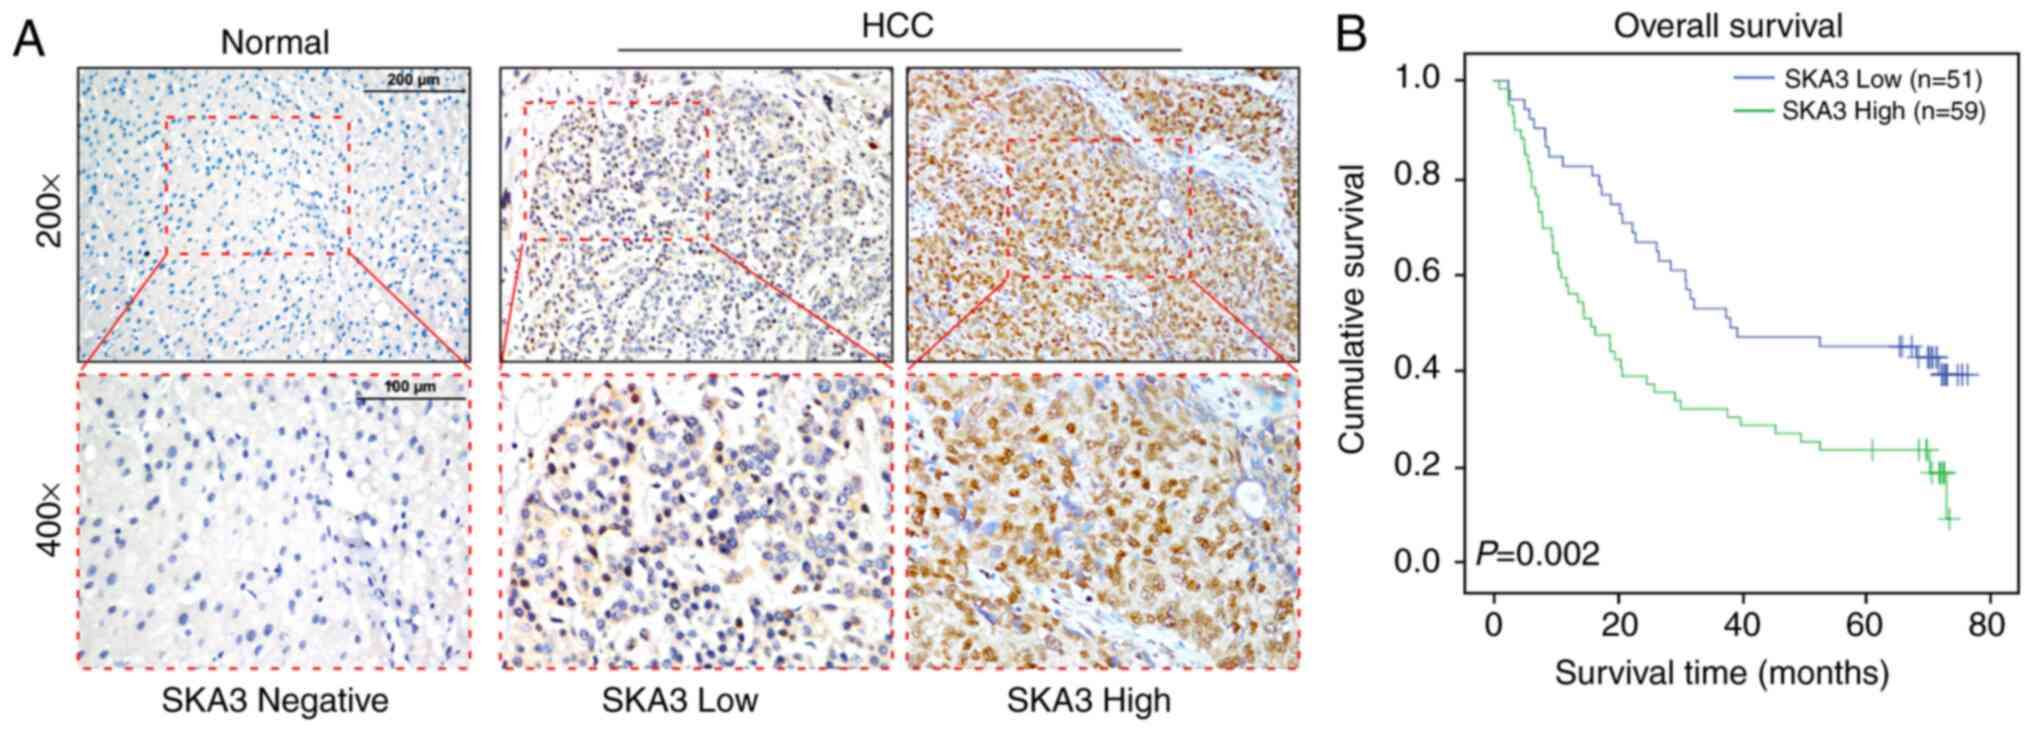
In order to determine the clinical significance of
SKA3 in liver cancer, the expression levels of SKA3 were studied in
110 paraffin-embedded liver cancer tissue samples using IHC
analysis. Samples including 66 cases of stage I, 26 cases of stage
II, 12 cases of stage III and 6 cases of stage IV tumor (Table I). As shown in Table II, SKA3 was positively expressed in
105 samples (95.5%), with high expression in 59 samples (53.6%) and
low expression in 51 samples (46.4%). Correlations between SKA3
expression levels and clinicopathological characteristics of HCC
were evaluated using Chi-square test and Pearson's correlation
analysis (Tables III and IV). Kaplan-Meier survival analysis and
log-rank test were used to evaluate the association between SKA3
expression levels and prognosis. Survival status of patients with
high and low expression levels of SKA3 was analyzed (Fig. 2A). The overall survival time of
patients with HCC with high levels of SKA3 was shorter than those
of patients with low levels of SKA3 (Fig.
2B; log-rank P-value=0.002). Univariate and multivariate Cox
regression analysis demonstrated that SKA3 expression and clinical
stage were independent prognostic factors for patients with HCC
(Table V).
| Table II.Expression levels of SKA3 in
hepatocellular carcinoma. |
Table II.
Expression levels of SKA3 in
hepatocellular carcinoma.
| Expression of
SKA3 | Number of cases
(%) |
|---|
| Negative | 5 (4.5) |
| Positive | 105 (95.5) |
| Low | 51 (46.4) |
| High | 59 (53.6) |
| Table III.Correlation between SKA3 expression
levels and clinicopathological characteristics of hepatocellular
carcinoma. |
Table III.
Correlation between SKA3 expression
levels and clinicopathological characteristics of hepatocellular
carcinoma.
|
| SKA3 |
|
|
|---|
|
|
|
|
|
|---|
| Characteristic | Low | High | Chi-square test
P-value | Fisher's Exact test
P-value |
|---|
| Sex |
|
| 0.566 | 0.752 |
|
Male | 45 | 54 |
|
|
|
Female | 6 | 5 |
|
|
| Age, years |
|
| 0.878 | 1.000 |
|
>45 | 33 | 39 |
|
|
|
≤45 | 18 | 20 |
|
|
| Clinical stage |
|
| 0.084 | 0.121 |
|
I/II | 46 | 46 |
|
|
|
III/IV | 5 | 13 |
|
|
| T
classification |
|
| 0.013a | 0.016a |
|
T1/2 | 40 | 33 |
|
|
|
T3/4 | 11 | 26 |
|
|
| N
classification |
|
| 0.073 | 0.084 |
| N0 | 48 | 49 |
|
|
| N1 | 3 | 10 |
|
|
| M
classification |
|
| 0.134 | 0.213 |
| No | 50 | 54 |
|
|
|
Yes | 1 | 5 |
|
|
| Cirrhosis |
|
| 0.230 | 0.246 |
|
Yes | 28 | 39 |
|
|
| No | 23 | 20 |
|
|
| Hepatitis B
antigen |
|
| 0.809 | 1.000 |
|
Yes | 46 | 54 |
|
|
| No | 5 | 5 |
|
|
| Outcome |
|
| 0.009a | 0.012a |
|
Survival | 21 | 11 |
|
|
|
Mortality | 30 | 48 |
|
|
| Table IV.Pearson's correlation analysis
between SKA3 and clinicopathological factors. |
Table IV.
Pearson's correlation analysis
between SKA3 and clinicopathological factors.
|
| SKA3 expression
levels |
|---|
|
|
|
|---|
| Variable | Pearson
correlation | P-value |
|---|
| Sex | 0.055 | 0.570 |
| Age | 0.015 | 0.879 |
| Clinical stage | 0.165 | 0.085 |
| T
classification | 0.237 | 0.012a |
| N
classification | 0.171 | 0.074 |
| M
classification | 0.143 | 0.136 |
| Cirrhosis | 0.114 | 0.234 |
| Hepatitis B
antigen | 0.023 | 0.811 |
| Outcome | 0.247 | 0.009a |
| Table V.Univariate and multivariate Cox
regression analysis of prognostic parameters in patients with
hepatocellular carcinoma. |
Table V.
Univariate and multivariate Cox
regression analysis of prognostic parameters in patients with
hepatocellular carcinoma.
|
| Univariate
analysis | Multivariate
analysis |
|---|
|
|
|
|
|---|
| Parameter | Number of
patients | P-value | Regression
coefficient (SEM) | P-value | Relative risk | 95% CI |
|---|
| Clinical stage |
|
|
|
|
|
|
|
I/II | 92 | <0.001 | 1.307 (0.284) | <0.001 | 3.120 | 1.766–5.512 |
|
III/IV | 18 |
|
|
|
|
|
| Expression of
SKA3 |
|
|
|
|
|
|
|
Low | 51 | 0.003 | 0.708 (0.234) | 0.023 | 1.733 | 1.079–2.781 |
|
High | 59 |
|
|
|
|
|
SKA3 promotes proliferation of liver
cancer cells
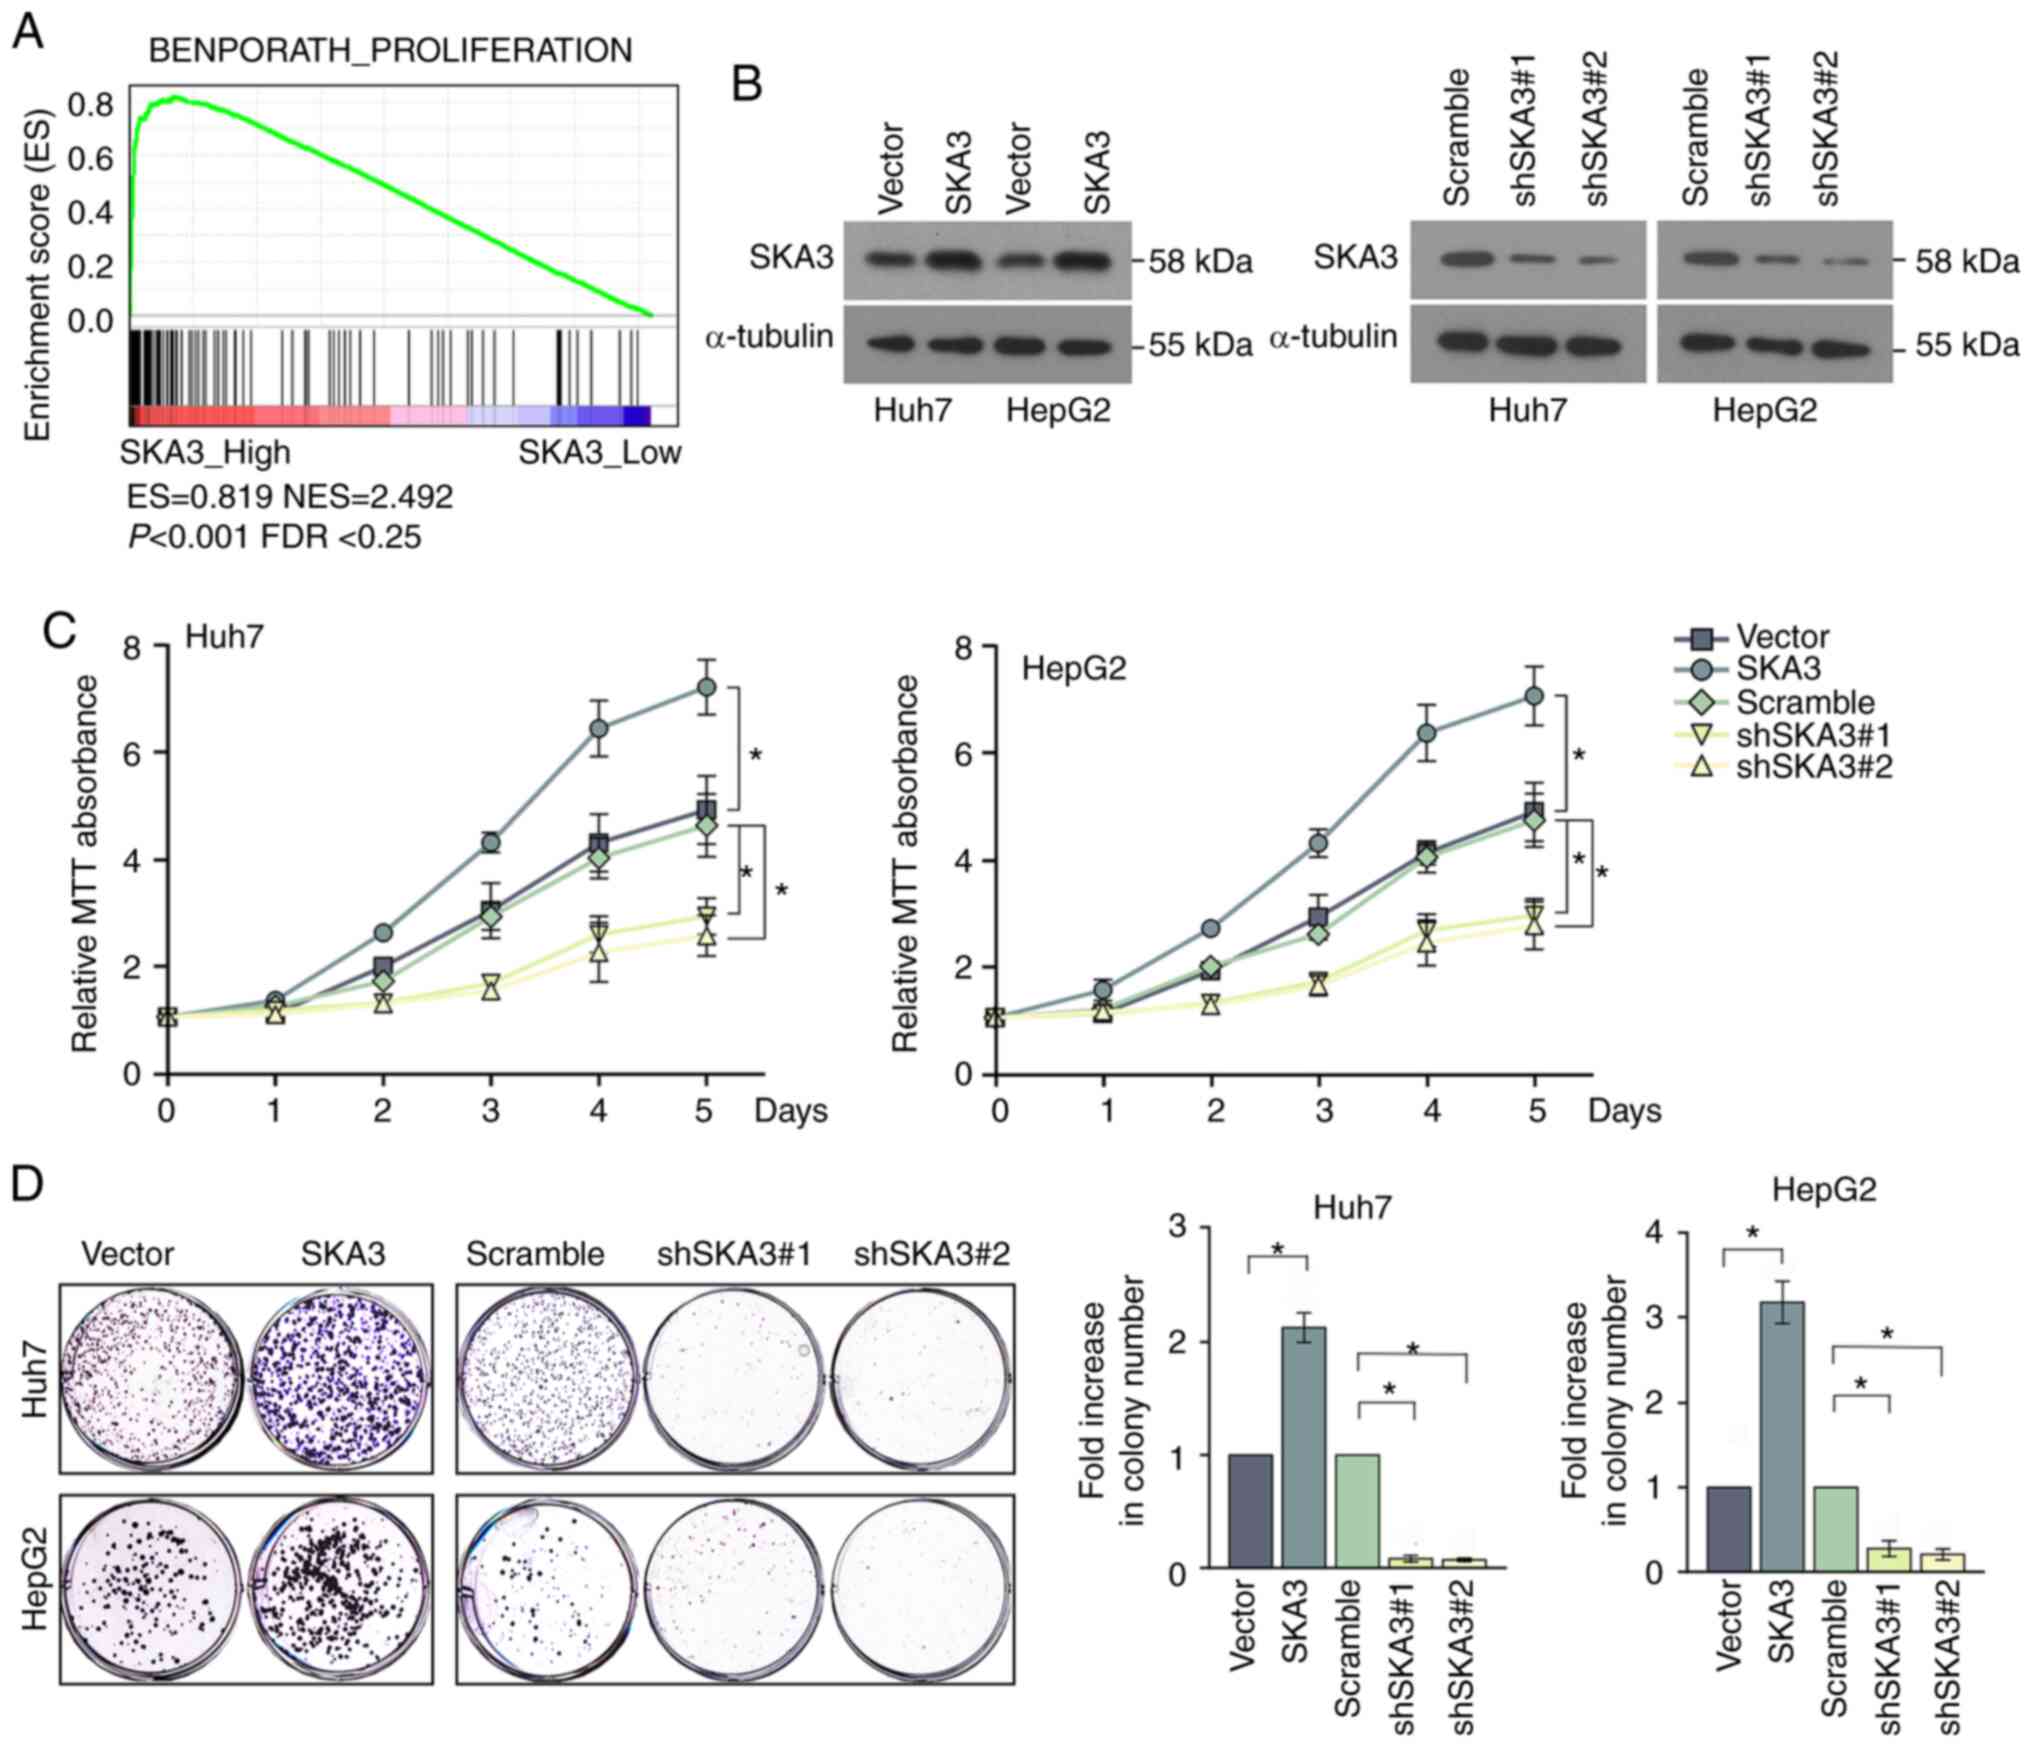
In order to study the potential signaling pathways
that contribute to SKA3-mediated proliferation of liver cancer
cells, GSEA was used to identify associated signaling pathways.
Gene expression level profiles of patients with low and high
expression of SKA3 in the TCGA HCC cohort (371 patients, divided by
the median expression of SKA3 mRNA) were compared. In the
BENPORATH_PROLIFERATION gene set, the proliferation pathway was
significantly enriched in the SKA3_High group (Fig. 3A). In order to evaluate the function
of SKA3 in vitro, Huh7 and HepG2 cells were transfected with
SKA3-expressing lentivirus to overexpress SKA3, or shRNA to silence
SKA3. The efficiency of the overexpression and knockdown of SKA3
expression was examined by western blotting (Fig. 3B). In addition, in order to explore
the association between the expression of SKA3 and the
proliferation ability of HCC cells, MTT assay was performed.
Knockdown of SKA3 significantly decreased the proliferation rate,
and overexpression of SKA3 resulted in increased proliferation
compared with the corresponding control liver cancer cell lines,
both in Huh7 and HepG2 cells (Fig.
3C). The results demonstrated that SKA3 affected the
proliferation of liver cancer cells. Colony formation assays were
performed to evaluate the colony formation function of SKA3 in
vitro, which demonstrated that silencing SKA3 colony formation,
whereas overexpression of SKA3 increased colony formation (Fig. 3D).
SKA3 promotes cell cycle
progression
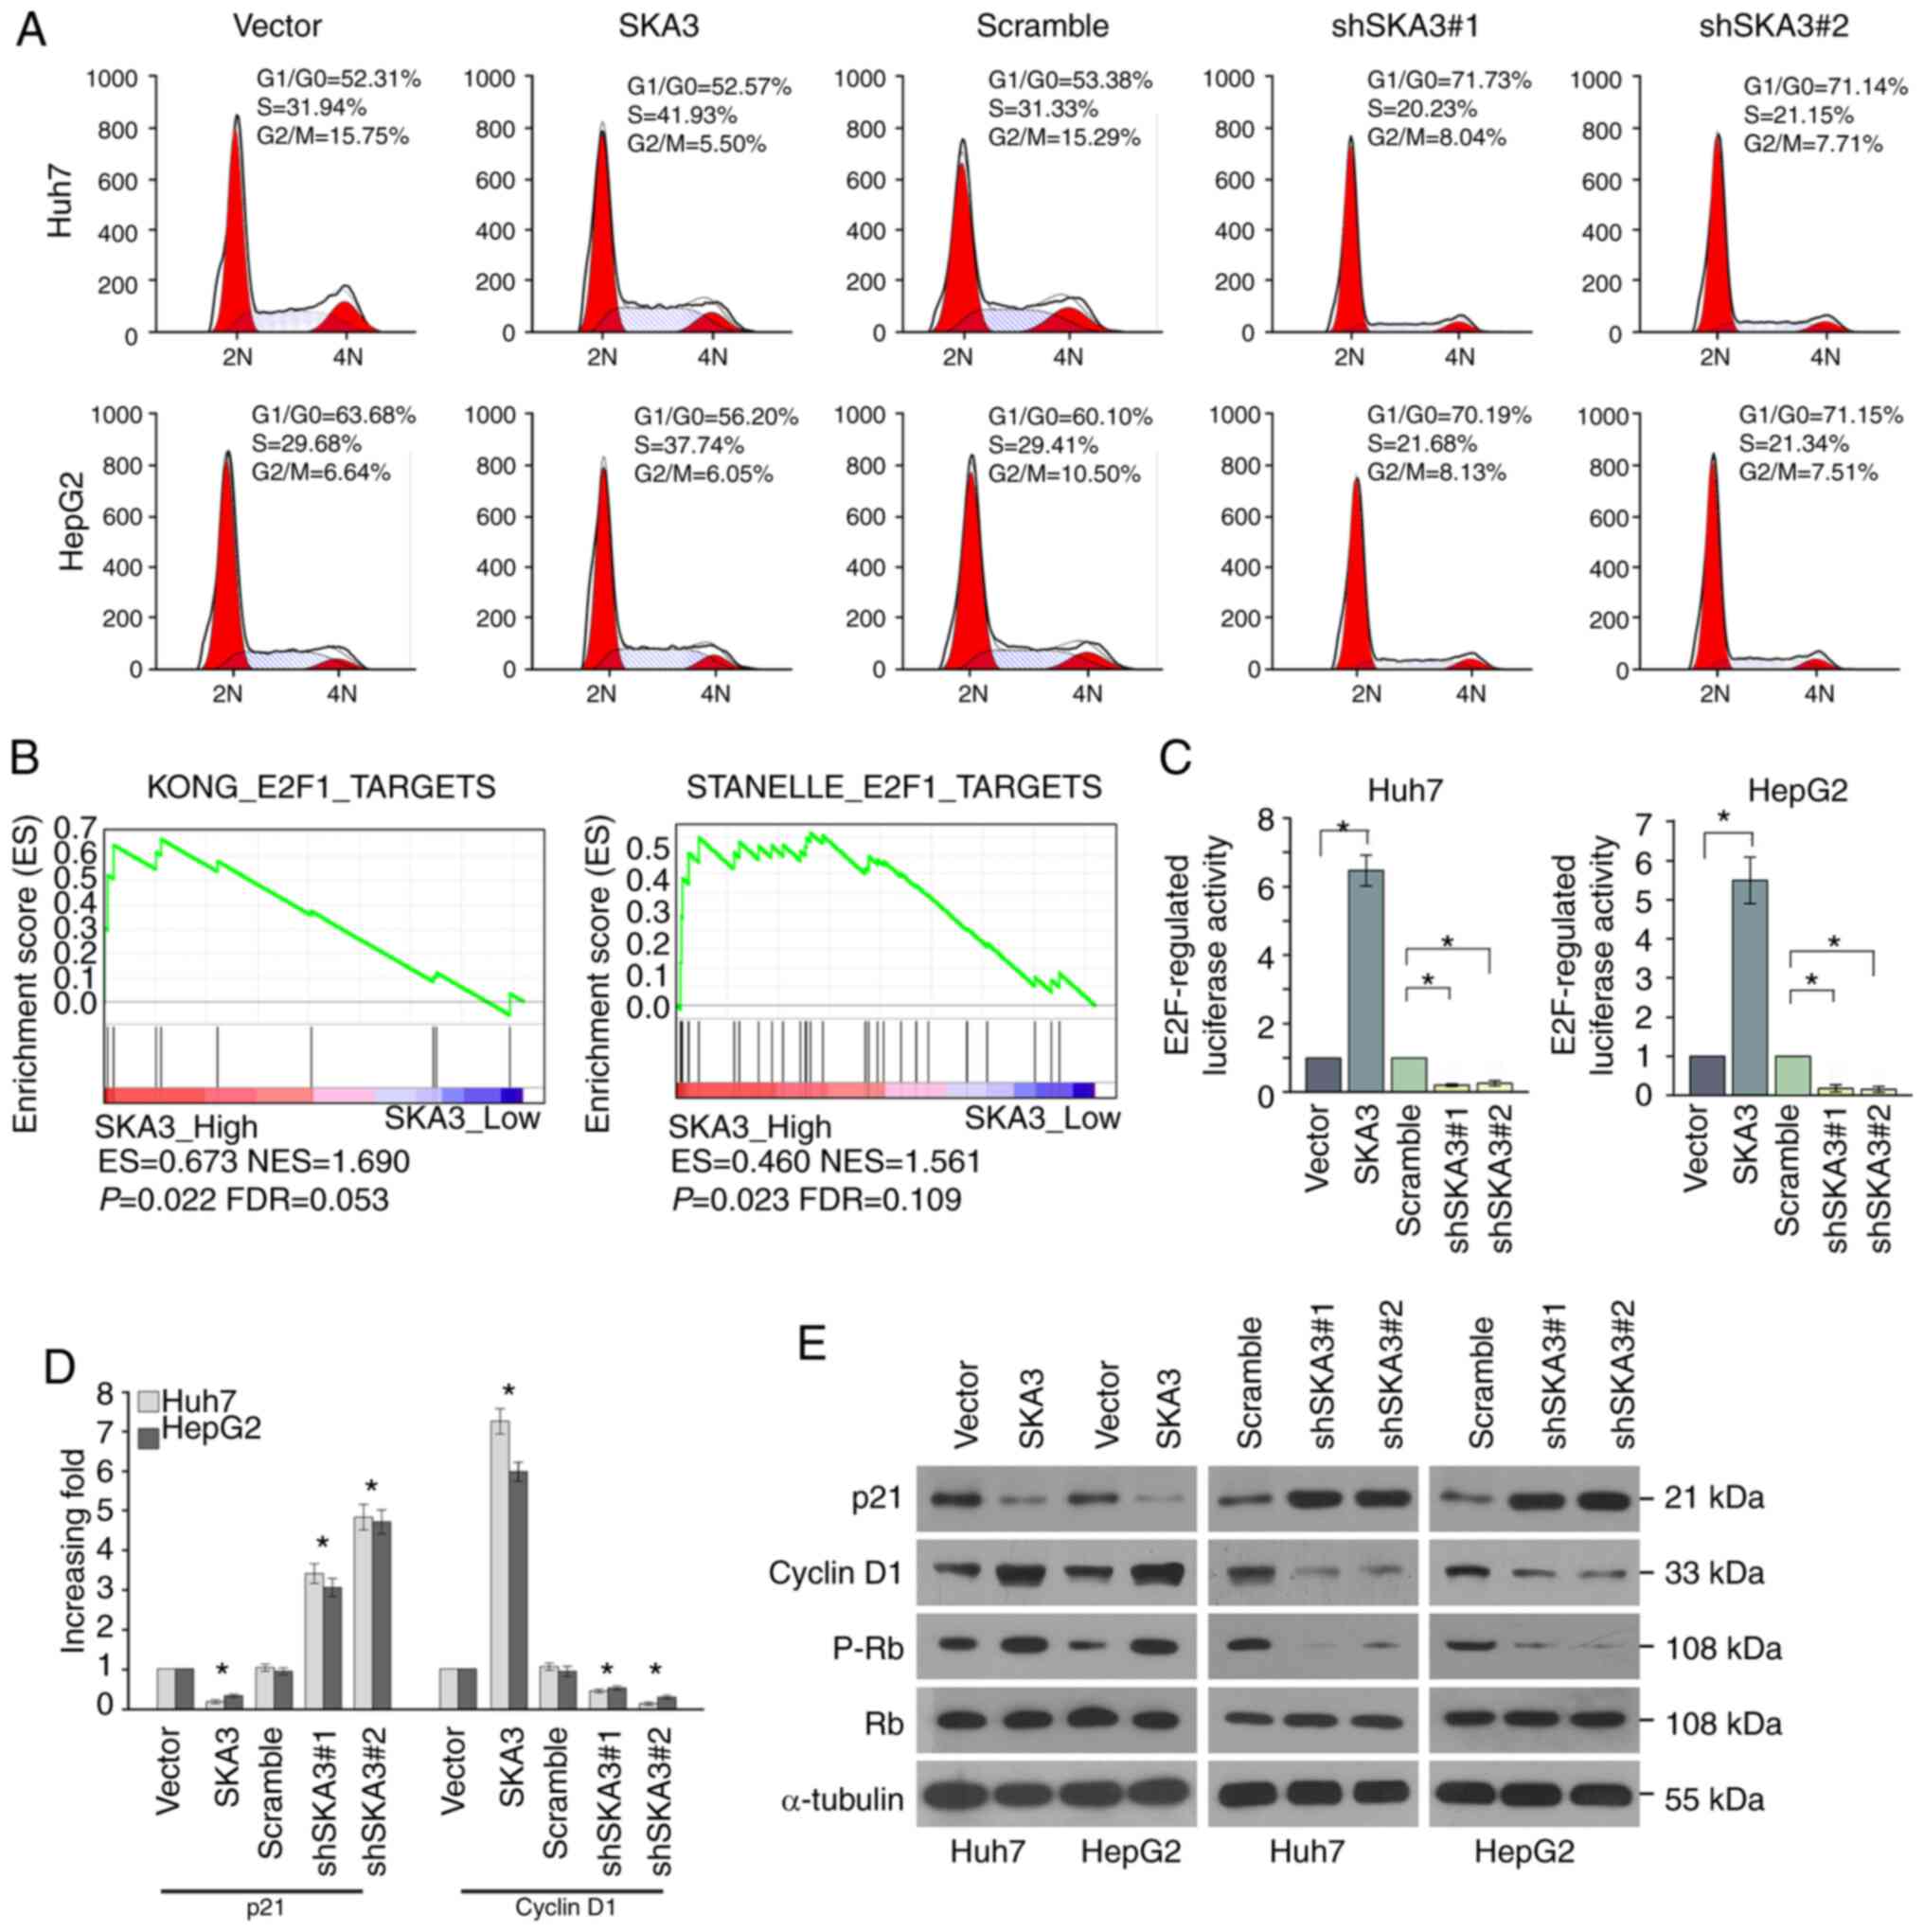
Flow cytometry analysis was performed to determine
whether the effect of SKA3 on the proliferation of liver cancer
cells was affected by cell cycle arrest. The results showed that
shRNA-transfected liver cancer cells were arrested at the
G1/G0 phase and the percentage of cells in
S-phase decreased, whereas in cells transfected with
SKA3-expressing lentivirus, the percentage of cells in S-phase
increased (Fig. 4A). GSEA analysis
showed that high expression of SKA3 was associated with E2F1 and
its target genes (Fig. 4B).
Luciferase reporter activity assay revealed that the luciferase
activity of the wild-type E2F-regulated 3′UTR was significantly
upregulated by 6.5-fold, whereas knockdown of SKA3 significantly
inhibited luciferase activity by 80% in Huh7 and HepG2 cells
(Fig. 4C). Protein p21 inhibits the
activity of the cyclin D1 complex, which results in decreased
phosphorylation of Rb, in turn inhibiting the release of E2F1 from
the Rb-E2F1 inhibitory complex, followed by enhanced expression of
E2F1 target genes (24). In order to
investigate whether mRNA and protein levels of associated cell
cycle regulatory oncogenes are also upregulated in liver cancer
cell lines with overexpressed and silenced SKA3, RT-qPCR and
western blot analysis were performed. RT-qPCR demonstrated
significant upregulation of p21 and downregulation of cyclin D1 in
Huh7 and HepG2 cells overexpressing SKA3 (Fig. 4D). Western blotting revealed that the
levels of cyclin D1 and p-Rb were elevated in liver cancer cells
transfected with SKA3 and downregulated in liver cancer cells
transfected with shSKA3, whereas levels of p21 were downregulated
in liver cancer cells transfected with SKA3 and elevated in liver
cancer cells transfected with shSKA3 (Fig. 4E). These results demonstrated that
expression of SKA3 facilitated cell cycle progression in liver
cancer cells.
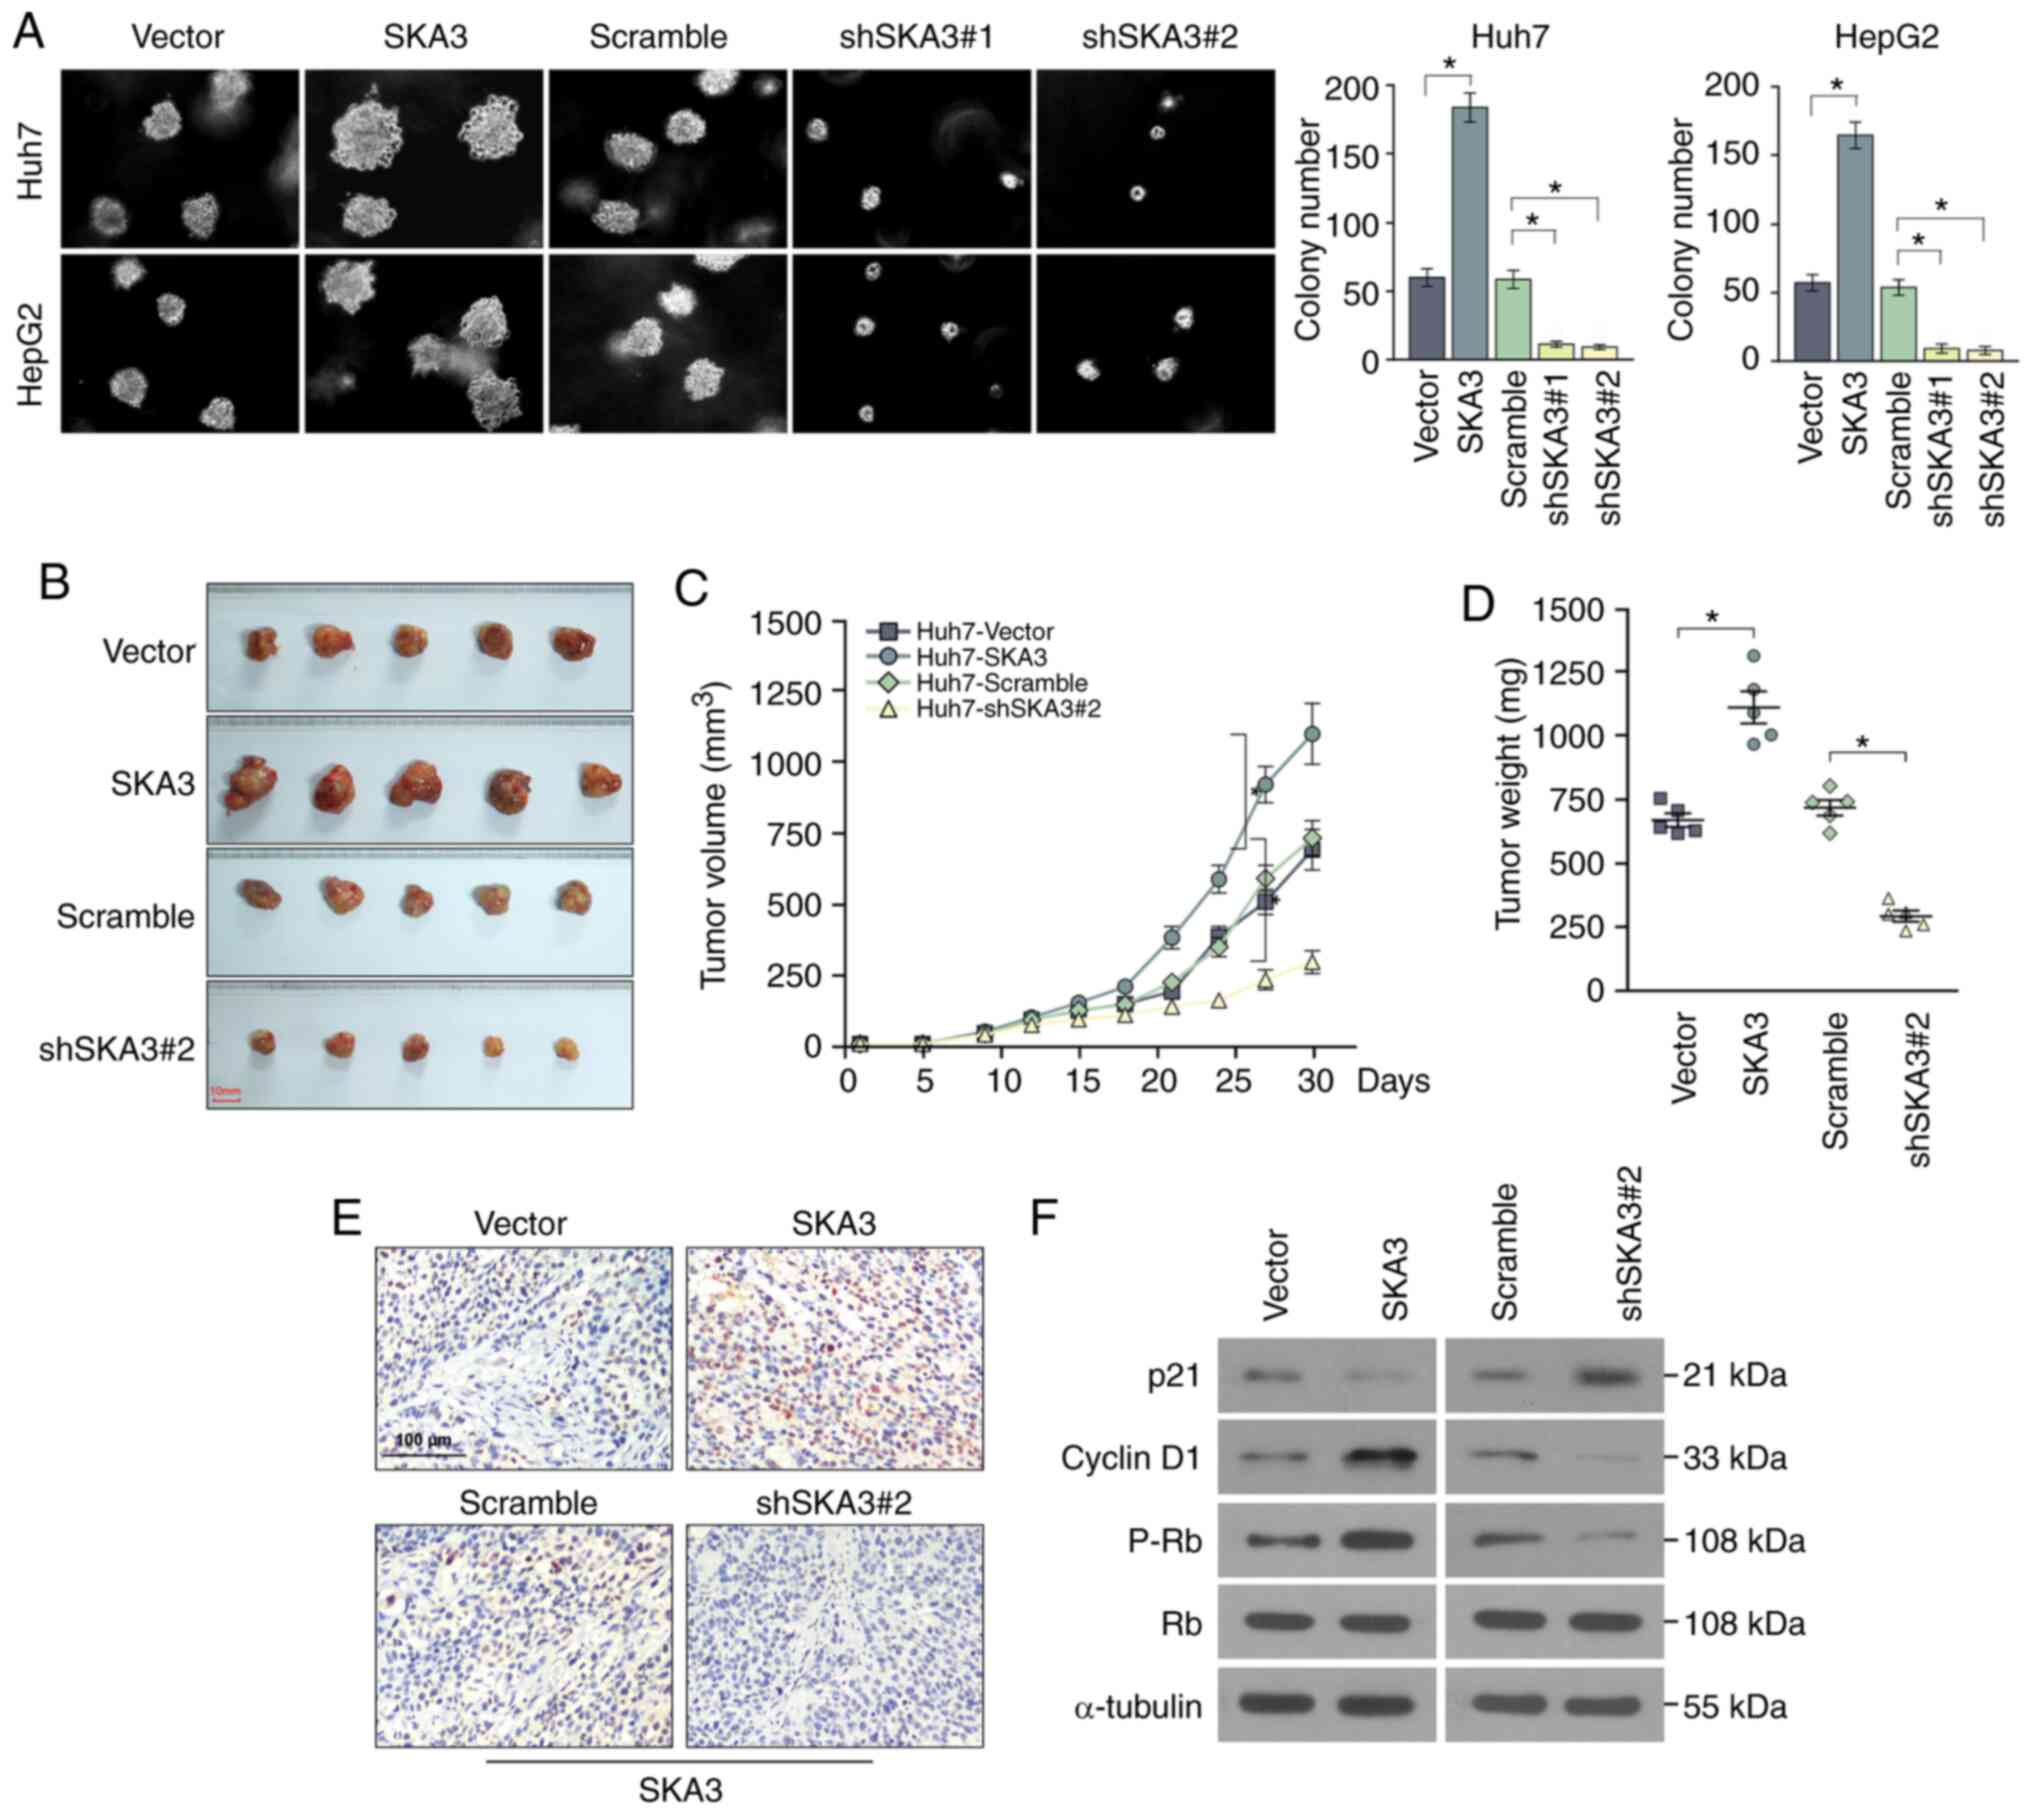
SKA3 promotes tumorigenesis of HCC
cells
In order to examine the effects of SKA3 on the
growth of liver cancer cells, the anchorage-independent growth
assay was performed. Quantitation of the number of spheres formed
over serial passages showed that overexpression of SKA3
significantly increased sphere formation, whereas knockdown of SKA3
by transfection with shSKA3 significantly inhibited the sphere
formation ability of Huh7 and HepG2 cell lines (Fig. 5A). In order to examine the effects of
SKA3 on liver cancer cell growth in vivo, a subcutaneous
tumor xenograft model was established. In athymic nude mice
injected subcutaneously with Huh7 cells transfected with SKA3, the
tumor volume and weight increased significantly, whereas in those
injected with cells transfected with shSKA3, they decreased
significantly (Fig. 5B-D).
Differences in SKA3 expression levels in tumor tissue of each group
were investigated by IHC, which demonstrated that SKA3 expression
levels significantly increased in the group injected subcutaneously
with Huh7 cells transfected with SKA3 (Fig. 5E). Furthermore, to explore whether
associated cell cycle regulatory oncogenes were also upregulated in
liver cancer tissue from these mice, mRNA and protein were
extracted and RT-qPCR and western blotting were performed. RT-qPCR
revealed significant downregulation of p21 and upregulation of
cyclin D1 in the SKA3-overexpression HCC tissue group (Fig. S1). Western blotting revealed that the
levels of cyclin D1 and p-Rb were elevated in the
SKA3-overexpression and downregulated in shSKA3 HCC tissue group,
while the levels of p21 were downregulated in liver cancer cells
transfected with SKA3 and elevated in liver cancer cells
transfected with shSKA3 (Fig. 5F).
These results demonstrated that the expression of SKA3 increased
liver tumor cell growth both in vivo and in
vitro.
Discussion
The present study found that knockdown of SKA3,
which was highly expressed in TCGA HCC cohorts, inhibited the
tumorigenicity and proliferation of liver cancer cells both in
vivo and in vitro. Silencing SKA3 with shRNA inhibited
E2F activity, which led to upregulation of CDK inhibitor p21 and
the downregulation of CDK regulatory protein cyclin D1.
Overexpression of SKA3 had the opposite effects. These results
indicated that upregulation of SKA3 served an important role in
promoting tumorigenesis and progression of liver cancer.
Tumorigenesis is characterized by uncontrolled tumor
formation and cell growth, and is associated with alterations in
genes or proteins involved in regulation of proliferation and
genomic instability (25). Therefore,
identification of genes and their products associated with the
molecular events leading to tumorigenesis is essential for
formulating effective therapeutic strategies. The present study
reported that SKA3 was markedly upregulated in liver cancer
cells/clinical tissue compared with normal liver
cells/non-cancerous tissue at both the transcriptional and
translational levels. Statistical analysis of IHC staining revealed
that the expression levels of SKA3 were significantly correlated
with clinicopathological characteristics and patient survival.
Furthermore, shRNA silencing of SKA3 decreased the tumorigenicity
of liver cancer cells both in vivo and in vitro,
suggesting that SKA3 may serve an oncogenic role in the development
and progression of liver cancer.
Lee et al (13)
reported that SKA3 mRNA is upregulated in prostate cancer
cells and tissue. Similarly, SKA3 overexpression has also been
implicated in colorectal cancer (11,12).
Chuang et al (11) suggested
that SKA3 at 13q12.11 may be a novel gene involved in malignant
transformation of colorectal cancer. SKA3 is a subunit located in
the outer layer of the SKA complex, which can control and promote
proper exit during mitosis together with the NDC80 kinetochore
complex component (26,27). When spindle checkpoints are silenced
by checkpoint kinase inhibition, or when cells are forced to exit
mitosis by CDK1 inactivation downstream of checkpoint silencing,
SKA3-deficient cells exhibit slower mitotic exit. Mitotic arrest is
induced by SKA3 depletion in HeLa cells (6,7). To the
best of our knowledge, however, the oncogenic ability of SKA3 has
not been studied in liver cancer. Here, SKA3 depletion in Huh7 and
HepG2 cells significantly decreased cell growth, cell cycle arrest,
colony formation and proliferation ability. These results suggested
that SKA3 served an important role in mitotic checkpoints in liver
cancer cells.
In order to determine the potential mechanism
involved in SKA3-mediated enhancement of liver cancer cell
aggression, GSEA was performed to identify signaling pathways
associated with SKA3 expression using high throughput
RNA-sequencing data of the HCC cohort of TCGA. Uncontrolled
progression through G1/S and G2/M cell cycle
transition can lead to uncontrolled cell proliferation and cancer
(28). Hou et al (29) showed that G2/M phase arrest
is caused by SKA3 knockdown resulting in inhibited CDK2/p53
phosphorylation in HCC cells. However, the present results showed
that when SKA3 increased relative to vector-alone, the number of
Huh7 cells in G2/M decreased but there was no
significant change in numbers of HepG2 cells. This may be because
Huh7 contains p53 mutant and HepG2 contains wild-type p53 (30). p53 suppresses the expression of CDK1
and cyclins B1 and D1, resulting in cell cycle (G2/M)
arrest (or delay) (31). SKA3 may
affect cell cycle (G2/M) by inhibiting transcriptional
activation of p53 in Huh7 cells. Furthermore, wild-type p53
triggered the opposite effect and blocked the effect of SKA3 on
cell cycle progression in HepG2 cells, resulting in a smaller
proportion of HepG2 cells transfected with vector at
G2/M phase than that of Huh7 cells transfected with
vector, which covered the effect of SKA3 on G2/M phase
in HepG2 cells transfected with SKA3 or shSKA3.
Transcription factor E2F1 is a key cell cycle
regulator. Its target genes encode proteins that regulate cell
cycle progression through G1/S transition and serve an
important role in DNA repair and apoptosis (32). Gene set enrichment analysis
demonstrated that E2F1 gene expression was significantly different
between the SKA3-high and -low groups. The E2F transcription factor
family plays a key role in cell cycle progression (33). E2F1 is part of the E2F protein family,
which can promote or inhibit breast cancer cell proliferation and
serves a role in DNA replication (34,35), DNA
damage checkpoint control and apoptosis (36). Luciferase reporter activity assay
revealed that overexpression of SKA3 significantly increased the
luciferase activity of E2F-regulated transcripts. Increased DNA
replication may be caused by promotion of E2F activity and
expression by p-Rb, suggesting a potential route to SKA3-associated
tumorigenesis and cell cycle progression. Downregulation of cyclin
D1 and upregulation of p21 may be a promising therapeutic strategy
to suppress growth of cancer cells (37,38).
Expression of oncogenes inhibits p21, activates cyclin D1-CDK4 and
specifically phosphorylates Rb in G1 phase, resulting in
the release of E2F1 from the Rb-E2F1 inhibitory complex, and
ultimately facilitates G1 to S phase transition
(24,39,40). Hu
et al (41) demonstrated that
SKA3 is involved in regulating cell cycle progression and increased
levels of p-AKT, cyclin E2, CDK2, cyclin D1, CDK4, E2F1 and p-Rb in
HeLa cells. Western blotting and RT-qPCR analysis here revealed
that the overexpression of SKA3 suppressed expression levels of
p21, and elevated those of cyclin D1, E2F1 and p-Rb in liver cancer
cells transfected with SKA3.
Cancer development and progression is a multi-step
process. Gene mutation and alteration in gene transcription and
translation may be specific biomarkers for cancer (19). In-depth understanding of the molecular
mechanism underlying liver cancer pathogenesis, especially genetic
alterations in liver cancer, may provide novel insights for the
diagnosis and treatment of liver cancer, thereby improving clinical
efficacy. In the present study, SKA3 was significantly associated
with aggressive features and unfavorable clinicopathological
characteristics of liver cancer. Compared with patients with low
expression levels of SKA3, the overall survival time of patients
with high expression levels of SKA3 was significantly decreased.
Furthermore, Cox regression analysis showed that SKA3 and clinical
stage may be independent risk factors for patients with HCC. The
present study also demonstrated that SKA3 was associated with the
aggressiveness of liver cancer and may serve as a useful prognostic
marker for patients with liver cancer.
The present study showed that SKA3 was upregulated
in liver cancer tissue and cell lines, and its high expression was
associated with poor prognosis of liver cancer. Knockdown of SKA3
may suppress tumor growth by inducing arrest at the G1/S
phase and inhibiting proliferation of liver cancer cells. The
inhibitory effect of SKA3 knockdown was further confirmed by in
vivo assays. The present study demonstrated that SKA3 may be a
diagnostic and prognostic marker for patients with liver cancer.
The expression levels of SKA3 were associated with survival of
patients with liver cancer. Therefore, inhibiting expression of
SKA3 may provide an effective therapeutic strategy in liver
cancer.
Supplementary Material
Supporting Data
Acknowledgements
The authors would like to thank Professor Weixia
Zeng from Sun Yat-sen University Cancer Center (Guangzhou, China)
for reviewing the manuscript.
Funding
The present study was supported by the National
Natural Science Foundation of China (grant nos. 81871999 and
81572368), Guangdong Natural Science Foundation (grant no.
2016A030313278), Science and Technology Planning Project of
Guangdong Province, China (grant no. 2014A020212084), and Shenzhen
Key Medical Discipline Construction Fund (SZXK079). The funders had
no role in study design, data collection, analysis and
interpretation, or preparation of the manuscript.
Availability of data and materials
The datasets used and/or analyzed during the current
study are available from the corresponding author on reasonable
request.
Authors' contributions
JT performed cell culture experiments, collected and
analyzed data and drafted the manuscript. JLiu and JLi performed
cell culture experiments and drafted the manuscript. ZL performed
and interpreted the array GSEA data. HL and KZ performed western
blotting, immunohistochemistry and quantitative PCR analysis. ZZ
conceptualized the study. NJ and LZ conceptualized the study and
drafted the manuscript. All authors read and approved the final
manuscript.
Ethics approval and consent to
participate
The present study was approved by the Clinical
Research Ethics Committee of the Third Affiliated Hospital of Sun
Yat-sen University. Informed written consent was obtained from all
patients.
Patient consent for publication
Not applicable.
Competing interests
The authors declare that they have no competing
interests.
Glossary
Abbreviations
Abbreviations:
|
HCC
|
hepatocellular carcinoma
|
|
GSEA
|
gene sets enrichment analysis
|
|
RT-qPCR
|
reverse transcription-quantitative
PCR
|
|
OD
|
optical density
|
|
shRNA
|
short hairpin RNA
|
|
3′UTR
|
3′ untranslated region
|
References
|
1
|
El-Serag HB and Rudolph KL: Hepatocellular
carcinoma. Epidemiology and molecular carcinogenesis.
Gastroenterology. 132:2557–2576. 2007. View Article : Google Scholar : PubMed/NCBI
|
|
2
|
Torre LA, Bray F, Siegel RL, Ferlay J,
Lortet-Tieulent J and Jemal A: Global cancer statistics, 2012. CA
Cancer J Clin. 65:87–108. 2015. View Article : Google Scholar : PubMed/NCBI
|
|
3
|
Zhang S, Yue M, Shu R, Cheng H and Hu P:
Recent advances in the management of hepatocellular carcinoma. J
BUON. 21:307–311. 2016.PubMed/NCBI
|
|
4
|
Vibert E, Schwartz M and Olthoff KM:
Advances in resection and transplantation for hepatocellular
carcinoma. J Hepatol. 72:262–276. 2020. View Article : Google Scholar : PubMed/NCBI
|
|
5
|
Lei X, Xu JF, Chang RM, Fang F, Zuo CH and
Yang LY: JARID2 promotes invasion and metastasis of hepatocellular
carcinoma by facilitating epithelial-mesenchymal transition through
PTEN/AKT signaling. Oncotarget. 7:40266–40284. 2016. View Article : Google Scholar : PubMed/NCBI
|
|
6
|
Sivakumar S and Gorbsky GJ:
Phosphatase-regulated recruitment of the spindle- and
kinetochore-associated (Ska) complex to kinetochores. Biol Open.
6:1672–1679. 2017. View Article : Google Scholar : PubMed/NCBI
|
|
7
|
Abad MA, Zou J, Medina-Pritchard B, Nigg
EA, Rappsilber J, Santamaria A and Jeyaprakash AA: Ska3 ensures
timely mitotic progression by interacting directly with
microtubules and ska1 microtubule binding domain. Sci Rep.
6:340422016. View Article : Google Scholar : PubMed/NCBI
|
|
8
|
Raaijmakers JA, Tanenbaum ME, Maia AF and
Medema RH: RAMA1 is a novel kinetochore protein involved in
kinetochore-microtubule attachment. J Cell Sci. 122:2436–2445.
2009. View Article : Google Scholar : PubMed/NCBI
|
|
9
|
Ohta S, Bukowski-Wills JC, Sanchez-Pulido
L, de Lima Alves F, Wood L, Chen ZA, Platani M, Fischer L, Hudson
DF, Ponting CP, et al: The protein composition of mitotic
chromosomes determined using multiclassifier combinatorial
proteomics. Cell. 142:810–821. 2010. View Article : Google Scholar : PubMed/NCBI
|
|
10
|
Zhang Q, Sivakumar S, Chen Y, Gao H, Yang
L, Yuan Z, Yu H and Liu H: Ska3 phosphorylated by Cdk1 binds Ndc80
and recruits ska to kinetochores to promote mitotic progression.
Curr Biol. 27:1477–1484. 2017. View Article : Google Scholar : PubMed/NCBI
|
|
11
|
Chuang TP, Wang JY, Jao SW, Wu CC, Chen
JH, Hsiao KH, Lin CY, Chen SH, Su SY, Chen YJ, et al:
Over-Expression of AURKA, SKA3 and DSN1 contributes to colorectal
adenoma to carcinoma progression. Oncotarget. 7:45803–45818. 2016.
View Article : Google Scholar : PubMed/NCBI
|
|
12
|
Pesson M, Volant A, Uguen A, Trillet K, De
La Grange P, Aubry M, Daoulas M, Robaszkiewicz M, Le Gac G, Morel
A, et al: A gene expression and pre-mRNA splicing signature that
marks the adenoma-adenocarcinoma progression in colorectal cancer.
PLoS One. 9:e877612014. View Article : Google Scholar : PubMed/NCBI
|
|
13
|
Lee M, Williams KA, Hu Y, Andreas J, Patel
SJ, Zhang S and Crawford NP: GNL3 and SKA3 are novel prostate
cancer metastasis susceptibility genes. Clin Exp Metastasis.
32:769–782. 2015. View Article : Google Scholar : PubMed/NCBI
|
|
14
|
Tang D, Zhao X, Zhang L, Wang Z and Wang
C: Identification of hub genes to regulate breast cancer metastasis
to brain by bioinformatics analyses. J Cell Biochem. 120:9522–9531.
2019. View Article : Google Scholar : PubMed/NCBI
|
|
15
|
Amin MB, Greene FL, Edge SB, Compton CC,
Gershenwald JE, Brookland RK, Brookland RK, Meyer L, Gress DM, Byrd
DR and Winchester DP: The eighth edition AJCC cancer staging
manual: Continuing to build a bridge from a population-based to a
more ‘personalized’ approach to cancer staging. CA Cancer J Clin.
67:93–99. 2017. View Article : Google Scholar : PubMed/NCBI
|
|
16
|
Lecluyse EL and Alexandre E: Isolation and
culture of primary hepatocytes from resected human liver tissue.
Methods Mol Biol. 640:57–82. 2010. View Article : Google Scholar : PubMed/NCBI
|
|
17
|
Vondran FW, Katenz E, Schwartlander R,
Morgul MH, Raschzok N, Gong X, Cheng X, Kehr D and Sauer IM:
Isolation of primary human hepatocytes after partial hepatectomy:
Criteria for identification of the most promising liver specimen.
Artif Organs. 32:205–213. 2008. View Article : Google Scholar : PubMed/NCBI
|
|
18
|
Livak KJ and Schmittgen TD: Analysis of
relative gene expression data using real-time quantitative PCR and
the 2(-Delta Delta C(T)) method. Methods. 25:402–408. 2001.
View Article : Google Scholar : PubMed/NCBI
|
|
19
|
Chen SP, Zhang LS, Fu BS, Zeng XC, Yi HM
and Jiang N: Prostate tumor overexpressed 1 is a novel prognostic
marker for hepatocellular carcinoma progression and overall patient
survival. Medicine (Baltimore). 94:e4232015. View Article : Google Scholar : PubMed/NCBI
|
|
20
|
Debrabant B: The null hypothesis of GSEA,
and a novel statistical model for competitive gene set analysis.
Bioinformatics. 33:1271–1277. 2017.PubMed/NCBI
|
|
21
|
Tsuzuki S and Seto M: Expansion of
functionally defined mouse hematopoietic stem and progenitor cells
by a short isoform of RUNX1/AML1. Blood. 119:727–735. 2012.
View Article : Google Scholar : PubMed/NCBI
|
|
22
|
Ben-Porath I, Thomson MW, Carey VJ, Ge R,
Bell GW, Regev A and Weinberg RA: An embryonic stem cell-like gene
expression signature in poorly differentiated aggressive human
tumors. Nat Genet. 40:499–507. 2008. View
Article : Google Scholar : PubMed/NCBI
|
|
23
|
Shomer NH, Allen-Worthington KH, Hickman
DL, Jonnalagadda M, Newsome JT, Slate AR, Valentine H, Valentine H
and Wilkinson M: Review of rodent euthanasia methods. J Am Assoc
Lab Anim Sci. 59:242–253. 2020. View Article : Google Scholar : PubMed/NCBI
|
|
24
|
Chen S, Zhou Q, Guo ZN, Wang Y, Wang L,
Liu X, Lu M, Ju L, Xiao Y and Wang X: Inhibition of MELK produces
potential anti-tumour effects in bladder cancer by inducing G1/S
cell cycle arrest via the ATM/CHK2/p53 pathway. J Cell Mol Med.
24:1804–1821. 2019. View Article : Google Scholar : PubMed/NCBI
|
|
25
|
Doerfler W, Hohlweg U, Müller K, Remus R,
Heller H and Hertz J: Foreign DNA integration--perturbations of the
genome--oncogenesis. Ann N Y Acad Sci. 945:276–288. 2001.
View Article : Google Scholar : PubMed/NCBI
|
|
26
|
Helgeson LA, Zelter A, Riffle M, MacCoss
MJ, Asbury CL and Davis TN: The human ska complex and Ndc80 complex
interact to form a load-bearing assembly that strengthens
kinetochore-microtubule attachments. Proc Natl Acad Sci USA.
115:2740–2745. 2018. View Article : Google Scholar : PubMed/NCBI
|
|
27
|
Sivakumar S, Daum JR, Tipton AR, Rankin S
and Gorbsky GJ: The spindle and kinetochore-associated (Ska)
complex enhances binding of the anaphase-promoting
complex/cyclosome (APC/C) to chromosomes and promotes mitotic exit.
Mol Biol Cell. 25:594–605. 2014. View Article : Google Scholar : PubMed/NCBI
|
|
28
|
Shi Y, Guo S, Wang Y, Liu X, Li Q and Li
T: Lamprey prohibitin2 arrest G2/M phase transition of heLa cells
through down-regulating expression and phosphorylation level of
cell cycle proteins. Sci Rep. 8:1–8. 2018.PubMed/NCBI
|
|
29
|
Hou Y, Wang Z, Huang S, Sun C, Zhao J, Shi
J, Li Z, Wang Z, He X, Tam NL and Wu L: SKA3 Promotes tumor growth
by regulating CDK2/P53 phosphorylation in hepatocellular carcinoma.
Cell Death Dis. 10:9292019. View Article : Google Scholar : PubMed/NCBI
|
|
30
|
Kanno S, Kurauchi K, Tomizawa A, Yomogida
S and Ishikawa M: Pifithrin-Alpha has a p53-independent
cytoprotective effect on docosahexaenoic acid-induced cytotoxicity
in human hepatocellular carcinoma HepG2 cells. Toxicol Lett.
232:393–402. 2015. View Article : Google Scholar : PubMed/NCBI
|
|
31
|
Liu L, Zhang P, Bai M, He L, Zhang L, Liu
T, Yang Z, Duan M, Liu M, Liu B, et al: P53 Upregulated by HIF-1α
promotes hypoxia-induced G2/M arrest and renal fibrosis in vitro
and in vivo. J Mol Cell Biol. 11:371–382. 2019. View Article : Google Scholar : PubMed/NCBI
|
|
32
|
Lynn AS: Inhibition of E2F1 activity and
cell cycle progression by arsenic via retinoblastoma protein. Cell
Cycle. 16:2058–2072. 2017. View Article : Google Scholar : PubMed/NCBI
|
|
33
|
Wang L, Chen H, Wang C, Hu Z and Yan S:
Negative regulator of E2F transcription factors links cell cycle
checkpoint and DNA damage repair. Proc Natl Acad Sci USA.
115:E3837–E3845. 2018. View Article : Google Scholar : PubMed/NCBI
|
|
34
|
Mori K, Uchida T, Fukumura M, Tamiya S,
Higurashi M, Sakai H, Ishikawa F and Shibanuma M: Linkage of E2F1
transcriptional network and cell proliferation with respiratory
chain activity in breast cancer cells. Cancer Sci. 107:963–971.
2016. View Article : Google Scholar : PubMed/NCBI
|
|
35
|
Nikolai BC, Lanz RB, York B, Dasgupta S,
Mitsiades N, Creighton CJ, Tsimelzon A, Hilsenbeck SG, Lonard DM,
Smith CL and O'Malley BW: HER2 signaling drives DNA anabolism and
proliferation through SRC-3 phosphorylation and E2F1-regulated
genes. Cancer Res. 76:1463–1475. 2016. View Article : Google Scholar : PubMed/NCBI
|
|
36
|
Cataldo A, Cheung DG, Balsari A, Tagliabue
E, Coppola V, Iorio MV, Palmieri D and Croce CM: MiR-302b enhances
breast cancer cell sensitivity to cisplatin by regulating E2F1 and
the cellular DNA damage response. Oncotarget. 7:786–797. 2016.
View Article : Google Scholar : PubMed/NCBI
|
|
37
|
Sheldon LA: Inhibition of E2F1 activity
and cell cycle progression by arsenic via retinoblastoma protein.
Cell Cycle. 16:2058–2072. 2017. View Article : Google Scholar : PubMed/NCBI
|
|
38
|
Takahashi Y, Rayman JB and Dynlacht BD:
Analysis of promoter binding by the E2F and pRB families in vivo:
Distinct E2F proteins mediate activation and repression. Genes Dev.
14:804–816. 2000.PubMed/NCBI
|
|
39
|
Datta D, Anbarasu K, Rajabather S, Priya
RS, Desai P and Mahalingam S: Nucleolar GTP-binding protein-1
(NGP-1) promotes G1 to S phase transition by activating
cyclin-dependent kinase inhibitor p21 Cip1/Waf1. J Biol Chem.
290:21536–21552. 2015. View Article : Google Scholar : PubMed/NCBI
|
|
40
|
Chang MM, Lai MS, Hong SY, Pan BS, Huang
H, Yang SH, Wu CC, Sun HS, Chuang JI, Wang CY and Huang BM:
FGF9/FGFR2 increase cell proliferation by activating ERK1/2,
Rb/E2F1, and cell cycle pathways in mouse leydig tumor cells.
Cancer Sci. 109:3503–3518. 2018. View Article : Google Scholar : PubMed/NCBI
|
|
41
|
Hu R, Wang MQ, Niu WB, Wang YJ, Liu YY,
Liu LY, Wang M, Zhong J, You HY, Wu XH, et al: SKA3 promotes cell
proliferation and migration in cervical cancer by activating the
PI3K/Akt signaling pathway. Cancer Cell Int. 18:1832018. View Article : Google Scholar : PubMed/NCBI
|