Introduction
Colorectal cancer (CRC) is the third most common
type of cancer worldwide, and the fourth leading cause of
cancer-associated mortality (1).
Between 1 and 2 million new CRC cases were diagnosed annually
between 2012 and 2016, and >700,000 individuals with CRC died
each year between 2012 and 2016 (2).
Despite improved diagnostic and therapeutic methods, the prognosis
of CRC remains poor, primarily due to local recurrence and distant
metastasis (3). Therefore, a more
detailed understanding of the factors involved in the development
and progression of CRC is required to identify novel biomarkers and
to develop novel anticancer strategies.
Tumors are not solely composed of cancer cells but
also contain a tumor stroma comprising cellular components, such as
fibroblasts, smooth muscle cells, vascular cells (vascular
endothelial cells and pericytes), inflammatory cells, and an
extracellular matrix (ECM) containing cytokines and cellular growth
factors (4). Although cancer is
caused by the accumulation of genetic abnormalities in epithelial
cells, accumulating evidence has demonstrated that tumor growth and
metastasis are not only associated with the characteristics of
tumor cells but also with their interactions with stromal cells
(5,6).
In CRC, following infiltration of the submucosal tissue by cancer
cells, stromal fibroblasts proliferate around the tumor nest in a
process referred to as ‘stromal reaction’ (7). Carcinoma-associated fibroblasts (CAFs)
are the main component of this fibrous stroma (8). The interaction between CAFs and cancer
cells is hypothesized to function as a promoter of tumor growth and
development (9).
Tumor-associated stromal cells, such as CAFs, are a
key component of the tumor microenvironment and interact with
cancer cells, resulting in the production of regulatory growth
factors and cytokines (10). CAFs are
considered to originate from mesenchymal stem cells (MSCs), which
migrate into the tumor stroma and differentiate into CAFs to form
the tumor stroma (11). Furthermore,
epithelial-mesenchymal transition (EMT) is promoted in cancer cells
via direct contact with stromal cells (12). EMT is a key developmental process,
which is often activated during cancer cell invasion and
metastasis, and enables cancer cells to disseminate from a primary
tumor by losing their epithelial characteristics, acquiring a
mesenchymal phenotype and promoting tumor progression by activating
the tumor stroma (13). However, to
the best of our knowledge, the specific genes involved in the
process of tumor development and formation of the tumor
microenvironment through these cancer-stroma interactions have not
yet been investigated in detail.
Our previous study investigated the interactions
between cancer cells and the tumor stroma during CRC tumor
development, and it was reported that MSCs migrate to the tumor
stroma where they differentiate into CAFs to promote tumor growth
and development (11). Furthermore,
one of our previous studies examined the effects of MSCs on cancer
cells and revealed that the expression levels of secreted protein
acidic and rich in cysteine (SPARC), pentraxin 3
(PTX3), fibronectin 1 (FN1), follistatin-related
protein 1 (FSTL1) and galectin 1 (LGALS1) were
upregulated in direct contact co-cultures of the KM12SM CRC cell
line and MSCs (12). Among these,
SPARC was the most markedly upregulated gene. SPARC, an ECM
glycoprotein with a molecular weight of 32 kDa, has a number of
functions, including tissue remodeling, wound repair, and cell
migration and differentiation (14).
Although SPARC is expressed in various types of cancer, its
expression pattern and effects on patient prognosis differ among
cancer types (15–17). In CRC, conflicting results have been
reported regarding the association between SPARC expression and
patient prognosis (18,19); however, no detailed reports regarding
its function have been provided. Therefore, the present study
investigated the association between SPARC expression and
clinicopathological factors in human CRC tissues. Furthermore, the
present study used an orthotopic transplant murine model to
investigate the effect of SPARC expression induced by direct
contact between cancer cells and MSCs on the tumor
microenvironment.
Materials and methods
Patients and surgical specimens
Archival formalin-fixed, paraffin-embedded tumor
tissues were obtained from the National Hospital Organization Kure
Medical Center (Hiroshima, Japan). Tissue samples collected from
all 42 patients [age range, 47–89 years; median age, 71 years; 23
male (55%) and 19 female (45%) patients] with colon dysplasia and
cancer who underwent surgical resection at the National Hospital
Organization Kure Medical Center (Hiroshima, Japan) between January
2011 and October 2013 were examined using immunohistochemistry.
Tumor staging was performed according to the TNM classification
system of the Japanese general rules for clinical and pathological
studies on cancers of the colon, rectum and anus. Patient
anonymity, as described by the Ethical Guidelines for Human
Genome/Gene Research of the Japanese Government (20), was ensured, and no personally
identifiable information was attached to the tissue samples before
analysis.
Reagents
The following primary antibodies were used in the
present study: Polyclonal goat anti-SPARC (dilution, 1:100; cat.
no. AF941; R&D Systems, Inc.), monoclonal rat anti-PTX3
(dilution, 1:500; cat. no. ab90806; Abcam), monoclonal mouse
anti-fibronectin (FN; for surgical specimens; dilution, 1:200; cat.
no. ab6328; Abcam), polyclonal rabbit anti-FSTL1 (dilution, 1:200;
cat. no. 20182-1-AP; ProteinTech Group, Inc.), polyclonal rabbit
anti-LGALS1 (dilution, 1:100; cat. no. ab25138; Abcam), polyclonal
rabbit anti-fibroblast activation protein (FAP; dilution, 1:100;
cat. no. ab53066; Abcam), rat anti-mouse CD31 (dilution, 1:50; cat.
no. 550274; BD Pharmingen; BD Biosciences), anti-lymphatic vessel
endothelial hyaluronan receptor 1 (Lyve 1; dilution, 1:20; cat. no.
AF2125; R&D Systems, Inc.), rabbit anti-α-smooth muscle actin
(α-SMA; dilution, 1:200; cat. no. ab5694; Abcam), polyclonal rabbit
anti-mouse type I collagen (dilution, 1:500; cat. no. 20151;
Novotec), Ki-67 equivalent (dilution, 1:1,000; cat. no. ACK02;
Novocastra; Leica Microsystems, Ltd.), anti-E-cadherin (dilution,
1:100; cat. no. sc-7870; Santa Cruz Biotechnology, Inc.) and
anti-FN (for implanted tumor; dilution, 1:100; cat. no. sc-6952;
Santa Cruz Biotechnology, Inc.). The fluorescent secondary
antibodies were: Alexa Fluor 488 E-conjugated goat anti-rabbit IgG
(dilution, 1:500; cat. no. A11034; Invitrogen; Thermo Fisher
Scientific, Inc.), Alexa Fluor 568 E-conjugated goat anti-rat IgG
(dilution, 1:500; cat. no. A11077; Invitrogen; Thermo Fisher
Scientific, Inc.), Alexa Fluor 546 E-conjugated goat anti-rabbit
IgG (dilution, 1:500; cat. no. A11035; Invitrogen; Thermo Fisher
Scientific, Inc.) and Alexa Fluor 568 E-conjugated donkey anti-goat
IgG (dilution, 1:500; cat. no. A11057; Invitrogen; Thermo Fisher
Scientific, Inc.).
Human CRC cell line and culture
conditions
The KM12SM cell line (21), a highly metastatic human CRC clonal
cell line selected from the parental KM12C cell line, was donated
by Dr Isaiah J. Fidler (University of Texas, Houston, TX, USA).
DMEM (cat. no. D6046; Sigma-Aldrich; Merck KGaA) supplemented with
10% FBS (Sigma-Aldrich; Merck KGaA) and 1% penicillin-streptomycin
mixture was used to culture the cell line, and cells were incubated
at 37°C in a 5% CO2-humidified atmosphere. Following
their recovery from frozen stock (−196°C), cells were cultured for
≤12 weeks.
Stable transfection and selection of
KM12SM cells expressing green fluorescent protein (GFP)
KM12SM CRC cells were transfected with GFP and
puromycin-resistance genes using copGFP control lentiviral
particles (cat. no. sc-108084; Santa Cruz Biotechnology, Inc.)
according to the manufacturer's protocol. This product was a
ready-to-use virus particle (3rd generation packaging system), and
200 µl viral stock contained 1×10⁶ infectious units of
virus (IFU). Cells were cultured in a 12-well plate in medium (DMEM
supplemented with 10% FBS and 1% penicillin-streptomycin mixture)
to 50% confluence. After 24 h, media were removed and then
substituted with 1 ml medium containing polybrene (cat. no.
sc-134220; Santa Cruz Biotechnology, Inc.) at a final concentration
of 5 µg/ml. Cells were infected by adding 20 µl (0.5 MOI) of the
lentiviral particles to the culture, mixed by swirling and
incubated at 37°C in a 5% CO2-humidified atmosphere
overnight. At 24 h after infection, polybrene-containing medium was
removed and fresh medium (without polybrene) was added. The cell
populations present at 48 h after infection were then incubated in
DMEM supplemented with 10% FBS and 1% penicillin-streptomycin
mixture containing the appropriate antibiotic (10 µg/ml puromycin)
for an additional 2 weeks. The cells selected >2 weeks after
transduction were used for subsequent experimentation.
Human MSC isolation and
cultivation
MSCs were provided by Dr Yukihito Higashi
(Department of Cardiovascular Physiology and Medicine, Hiroshima
University, Hiroshima, Japan), and details of MSC isolation and
cultivation were as described subsequently. Bone marrow was
aspirated from the iliac crest of a 24-year-old male patient with
Buerger's disease who underwent BM-mononuclear cells (BM-MNCs)
implantation at Hiroshima University Hospital (Hiroshima, Japan) on
June 3, 2015. Written informed consent was obtained from the donor.
BM-MNCs were isolated using centrifugation at 18,000 × g at 4°C for
30 min through a Histopaque density gradient (Sigma-Aldrich; Merck
KGaA) as previously described (22).
To obtain autologous MSCs, BM-MNCs were seeded on plastic culture
dishes in DMEM supplemented with 10% FBS, 4 mM L-glutamine and 1%
penicillin-streptomycin mixture using a technique permitted by the
Ethics Committee of Hiroshima University Graduate School of
Medicine (Hiroshima, Japan) as described previously (23), and incubated at 37°C in a 5%
CO2-humidified atmosphere. The removal of non-adherent
cells and detachment of adherent cells from the dishes were
performed after 72 h. Adherent cells were then sub-cultured in
fresh medium supplemented with 1 ng/ml fibroblast growth factor-2
every 4–5 days (24). Aliquots of
cells were obtained at passages 3–5 and frozen in liquid nitrogen
at −196°C for later analyses.
In vitro characterization of human
MSCs
MSCs formed adherent monolayers of long,
spindle-shaped, fibroblastic cells in the culture medium. MSCs were
characterized by Dr Yukihito Higashi (Department of Cardiovascular
Physiology and Medicine, Hiroshima University, Hiroshima, Japan) in
the past. The method was previously described (23).
Silencing of SPARC expression
To silence SPARC expression, lentiviral
particles for short hairpin RNA (sh/shRNA) knockdown (cat. no.
sc-37166-V) and control lentiviral particles (cat. no. sc-108080)
were purchased from Santa Cruz Biotechnology, Inc. This product was
a ready-to-use virus particle (3rd generation packaging system; 200
µl viral stock contained 1×10⁶ IFU). shSPARC and
scrambled shRNA lentiviral particles were transfected into KM12SM
cells according to the manufacturer's protocols. Cells were
cultured in a 12-well plate in medium (DMEM supplemented with 10%
FBS and 1% penicillin-streptomycin mixture) to 50% confluence.
After 24 h, media were removed and then substituted with 1 ml
medium containing polybrene (cat. no. sc-134220; Santa Cruz
Biotechnology, Inc.) at a final concentration of 5 µg/ml. Cells
were infected by adding 20 µl (0.5 MOI) of the lentiviral particles
to the culture, mixed by swirling and incubated at 37°C in a 5%
CO2-humidified atmosphere overnight. At 24 h post
infection, polybrene-containing medium was removed and fresh medium
(without polybrene) was added. The cell populations present at 48 h
after infection were then incubated in medium (DMEM supplemented
with 10% FBS and 1% penicillin-streptomycin mixture) containing the
appropriate antibiotic (10 µg/ml puromycin) for an additional 2
weeks. The cells selected >2 weeks after transduction were used
for subsequent experimentation. The antibiotic-resistant pools
present at each cell passage were then expanded and frozen at
−196°C.
Reverse transcription-quantitative PCR
(RT-qPCR)
An RNeasy Kit (Qiagen KK) was used to extract total
RNA from KM12SM cells according to the manufacturer's protocol. A
first-strand cDNA synthesis kit (Amersham; Cytiva) was used to
generate cDNA from 1 µg total RNA at 65°C for 10 min, 0°C for 2 min
and 37°C for 1 h. After RNA was reverse transcribed into cDNA,
RT-qPCR was performed using the LightCycler FastStart DNA Master
SYBR-Green I Kit (Roche Diagnostics) according to the
manufacturer's protocol. Triplicate reactions were performed.
Expression values were reported as log 2 ratios, normalized to
GAPDH, and subsequently mean-centered to account for
differences in the quality and quantity of RNA between samples. The
relative expression levels were determined using the
2−ΔΔCq method (25). The
primer sequences were as follows: SPARC forward,
5′-ATGAGGGCCTGGATCTTCTT-3′ and reverse, 5′-CTCTTCGGTTTCCTCTGCAC-3′;
and GAPDH forward, 5′-AGAAGGCTGGGGCTCATTTG-3′ and reverse,
5′-AGGGGCCATCCACAGTCTTC-3′ (SPARC PCR product, 192 bp;
GAPDH, 258 bp). The thermocycling conditions were as
follows: Initial denaturation at 94°C for 10 min, followed by 30
cycles at 94°C for 15 sec, 58°C for 1 min and 72°C for 1.5 min.
In vitro assessment of cell
proliferation and motility
KM12SM wild-type (WT) and KM12SM shSPARC (shSPARC)
cell lines (6×10⁴ cells/well) were seeded into 24-well
plates (ImageLock; Essen Bioscience) containing DMEM supplemented
with 0.5% FBS, and cultured alone or with MSCs (6×10⁴
cells/well). Bright-field images obtained using a label-free,
high-content, time-lapse assay system (IncuCyte® Zoom;
Essen Bioscience), which automatically expresses cell confluence
over 4 days as a percentage using IncuCyte software (version 2015A
Rev1; Essen Bioscience), were used to generate growth curves. These
experiments were performed in triplicate.
A scratch wound assay was used to evaluate cell
migration. WT or shSPARC cells were seeded at a density of
1×10⁵ cells per well on 100 µg/ml Matrigel-coated (cat.
no. 354234; BD Biosciences; diluted in DMEM supplemented with 0.5%
FBS, coated at 37°C for 24 h) 96-well plates (ImageLock; Essen
Bioscience) containing DMEM supplemented with 0.5% FBS either alone
or with MSCs (1×10⁵ cells/well), and the cell monolayer
was at or close to 100% confluence. Wound images were automatically
obtained from precise locations on ImageLock 96-well plates using
IncuCyte software (version 2015A Rev1; Essen Bioscience) under an
inverted microscope having a phase LED lamp and an excitation LED
source. The 96-pin wound maker of the IncuCyte system was used to
scratch confluent cell layers. After wounding, detached cells were
removed by washing with PBS twice, and images were automatically
captured every 3 h for 2 days. IncuCyte software automatically
assessed relative wound density. Relative wound density is a
measure (%) of the density of the wound region relative to the
density of the cell region and started at ~5%. These experiments
were performed in triplicate.
Animals and tumor cell
transplantation
Animal experiments were performed as described
previously (26). Briefly, a total of
34 female athymic BALB/c nude mice (age, 6 weeks; weight, 14–17 g)
were obtained from Charles River Laboratories, Inc. and maintained
under specific pathogen-free conditions until 8 weeks of age. The
mice were housed in a 12-h light/dark cycle with a humidity of
45–55% at 22±1°C and had free access to food and water. The methods
performed in the present study were approved by the Committee on
Animal Experimentation of Hiroshima University (Hiroshima, Japan).
Mice were anesthetized via intraperitoneal injection of
medetomidine (0.3 mg/kg), midazolam (4 mg/kg) and butorfanol (5
mg/kg) (27). In the present study,
it was intended to sacrifice mice before significant debilitation
due to tumor progression following cancer cell transplantation. Had
the tumor been developed earlier than expected and mice were
significantly debilitated, the experiment would have been
immediately terminated and the mice would have been euthanized. All
mice survived during the experiments.
The development of cecal tumors in mice was achieved
as follows: WT or shSPARC cells alone (0.5×10⁶) or mixed
at a ratio of 1:2 with MSCs (0.5×10⁶:1.0×10⁶
WT cells or shSPARC cells:MSCs) in 50 µl Hanks' balanced salt
solution were implanted by injection into the cecum wall of BALB/c
nude mice (age, 8 weeks) under a dissecting microscope according to
a previously reported method (9).
Mice that survived after 6 weeks (42 days) were then euthanized by
cervical dislocation under anesthesia as aforementioned at the end
of the experiment, and tumor growth was measured. Tumor tissues
were embedded in optimal cutting temperature (OCT) compound,
rapidly frozen in liquid nitrogen and stored at −80°C.
Necropsy and histological studies
Mice with orthotopic tumors were euthanized under
deep anesthesia with a mixture of medetomidine, midazolam and
butorphanol, and their body weights were measured. Following
necropsy, tumors were excised and weighed. One portion of the tumor
was then fixed in formalin-free immunohistochemistry zinc fixative
provided as a ready to use solution (BD Pharmingen; BD Biosciences)
at room temperature for 24 h and embedded in paraffin for
immunohistochemical analysis, while the remaining portion was
embedded in Tissue-Tek OCT compound (Sakura Finetek USA, Inc.),
rapidly frozen in liquid nitrogen and stored at −80°C. Regional
(celiac and para-aortal) lymph nodes that were macroscopically
enlarged were harvested, and histological analysis was used to
verify tumor metastasis.
Immunohistochemistry
Immunohistochemistry analysis for SPARC, PTX3, FN,
FSTL1, LGALS1 and FAP expression in surgical specimens was
performed with the tissues, which were fixed with 10% formalin in
PBS at room temperature for at least 48 h, embedded in paraffin,
and then cut into serial 4-µm-thick sections. Immunohistochemistry
analysis for SPARC and Ki-67 expression in transplanted tumors was
performed with the tissues, which were fixed in formalin-free
immunohistochemistry zinc fixative provided as a ready to use
solution (BD Pharmingen; BD Biosciences) at room temperature for 24
h, embedded in paraffin, and then cut into serial 4-µm-thick
sections. Following deparaffinization in xylene and rehydration in
a graded series of ethanol concentrations (from 100 to 70%), tissue
sections were microwaved twice for 5 min at 95°C in citrate buffer
as a pretreatment and then washed three times in PBS for 3 min at
room temperature. Endogenous peroxidase activity was blocked by
incubation with 3% hydrogen peroxide in methanol for 10 min at room
temperature. The tissue sections were then washed three times with
PBS and blocked with protein blocking solution [5% normal horse
serum (cat. no. H1138; Sigma-Aldrich; Merck KGaA) and 1% normal
goat serum (cat. no. G6767; Sigma-Aldrich; Merck KGaA) in PBS] at
room temperature for 10 min. After washing three time in PBS,
primary antibodies (SPARC dilution, 1:100; PTX3 dilution, 1:500; FN
dilution, 1:200; FSTL1 dilution, 1:200; LGALS1 dilution, 1:100; FAP
dilution, 1:100; Ki-67 dilution, 1:1,000) were added to the slides,
which were then incubated in humidified boxes at 4°C overnight. The
slides were then washed three times in PBS. Following a further
incubation at room temperature for 1 h with the respective
peroxidase-conjugated secondary antibodies (dilution, 1:500), a
positive reaction was detected by exposing slides to stable
3,3′-diaminobenzidine at room temperature for 5–10 min. To
visualize nuclei, slides were then counterstained with hematoxylin
(cat. no. 1.09249.0500; Merck KGaA) used as undiluted solution at
room temperature for 15 sec. SPARC, PTX3, FN, FSTL1 and LGALS1
staining was defined as positive when ≥30% of cancer cells were
stained as previously described (28–31). The
areas of FAP-positive staining and SPARC-positive staining were
measured in five optical fields (magnification, ×100) from
different sections by light microscopy and calculated using ImageJ
software (version 1.51j8; National Institutes of Health).
Immunofluorescence staining
Frozen specimens were cut into 8-µm-thick sections,
and cells cultured on glass slides were fixed for 15 min in 4%
paraformaldehyde in PBS at room temperature. Slides were briefly
blocked with protein blocking solution [5% normal horse serum (cat.
no. H1138; Sigma-Aldrich; Merck KGaA) and 1% normal goat serum
(cat. no. G6767; Sigma-Aldrich; Merck KGaA) in PBS] at room
temperature for 10 min, incubated at 4°C overnight with the Fab
fragment of anti-mouse IgG (dilution, 1:500; cat. no. 115-067-003;
Jackson ImmunoResearch Laboratories, Inc.) to block endogenous
immunoglobulins if necessary, and incubated at 4°C overnight with
anti-CD31 (dilution, 1:50), anti-Lyve1 (dilution, 1:20), anti-α-SMA
(dilution, 1:200) or anti-type I collagen (dilution, 1:500). Slides
were washed with PBS and incubated with the Alexa Fluor 546 or
568-labeled secondary antibody (dilution, 1:500) at room
temperature for 1 h. A nuclear counterstain with DAPI (1:500) was
applied at room temperature for 10 min, and the mounting medium
(Fluoromount/Plus; cat. no. K048; Diagnostic BioSystems) was placed
on each specimen with a glass coverslip. The all-in-one
fluorescence microscope BZ-X710 (Keyence Corporation) with a 20X or
40X objective lens was used to capture confocal fluorescence
images.
Double immunofluorescence staining of
FN and E-cadherin
To identify EMT, immunofluorescence staining was
conducted as described in the previous section using the slides of
frozen specimens, cut into 8-µm-thick sections. Endogenous
peroxidase activity was blocked by incubation with 3% hydrogen
peroxide in methanol for 10 min at room temperature. The tissue
sections were then washed three times with PBS. Slides were briefly
blocked with protein blocking solution [5% normal horse serum (cat.
no. H1138; Sigma-Aldrich; Merck KGaA) and 1% normal goat serum
(cat. no. G6767; Sigma-Aldrich; Merck KGaA) in PBS] at room
temperature for 10 min. After washing three time in PBS, slides
were incubated with the anti-FN antibody (dilution, 1:100) at 4°C
overnight, followed by the Alexa 568-conjugated donkey anti-goat
IgG secondary antibody (dilution, 1:500) at room temperature for 1
h. Slides were then placed in a blocking solution as aforementioned
and incubated with the antibody against E-cadherin (dilution,
1:100) at 4°C overnight. Following washing with PBS and blocking
with blocking solution [5% normal horse serum (cat. no. H1138;
Sigma-Aldrich; Merck KGaA) and 1% normal goat serum (cat. no.
G6767; Sigma-Aldrich; Merck KGaA) in PBS] at room temperature for
10 min as aforementioned, slides were incubated with the Alexa
488-conjugated goat anti-rabbit IgG secondary antibody (dilution,
1:500) at room temperature for 1 h. FN (a mesenchymal marker) was
identified by red fluorescence and E-cadherin (an epithelial
marker) was identified by green fluorescence. The all-in-one
fluorescence microscope BZ-X710 (Keyence Corporation) was used to
capture confocal fluorescence images.
Quantification of microvessels,
lymphatic vessels, CAF and collagen areas
Using specimens stained as aforementioned,
assessments of the angiogenic and lymphangiogenic activities of
tumors were conducted based on quantifying the respective areas in
vascular and lymphatic microvessels. The microvessel (CD31-positive
staining) and lymphatic vessel (Lyve-1-positive staining) areas
were measured in five optical fields (magnification, ×100) from
different sections and calculated using ImageJ software (version
1.51j8; National Institutes of Health). CAF and ECM areas were also
evaluated in the respective areas of α-SMA-positive or type-1
collagen-positive staining in five optical fields (magnification,
×100) from different sections.
Ki-67 labeling index (Ki-67 LI)
Using specimens stained as aforementioned, the Ki-67
LI was evaluated at the site with the highest number of
Ki-67-positive cells under a light microscope. The cells were
counted in ten fields (magnification, ×40), and the number of
positive cells among ~1,000 tumor cells was expressed as a
percentage.
RNA sequencing
Tumors formed by co-transplantation of WT and MSCs
(WT + MSCs) or shSPARC and MSCs (shSPARC + MSCs) were mechanically
disassociated using a homogenizer. Subsequently, an RNeasy Mini kit
(cat. no. 74104; Qiagen GmbH) was used for RNA extraction according
to the manufacturer's protocols. Library construction and data
processing were performed by Beijing Genomics Institute (Beijing,
China). Concentration was measured using ExKubit dsDNA HS Assay
Kits (cat. no. NGS00-3012; Shanghai ExCell Biology, Inc.) and
Fluostar Omega Microplate Reader (BMG Labtech GmbH). Fragment size
was detected using a DNA 1000 Kit (part no. 5067-1504; Agilent
Technologies, Inc.) and 2100 Bioanalyzer Instrument (Agilent
Technologies, Inc.). Libraries were sequenced on a DNBSEQ-G400RS
platform, and high-quality reads were aligned to the human
reference genome (GRCh38). The sequencing kit was DNBSEQ-G400RS
High-throughput Sequencing Set (FCL PE100) (cat. no. 1000016950;
MGI Tech Co., Ltd.) and paired-end sequencing (2×100 bp) was
performed. Concentration was measured using a Qubit™ ssDNA Assay
Kit (cat. no. Q10212; Invitrogen; Thermo Fisher Scientific, Inc.)
and Qubit 4 Fluorometer (Invitrogen; Thermo Fisher Scientific,
Inc.). The loading concentration was 8-20 ng/µl. The genome
reference was GCF_000001405.38_GRCh38.p12. The software used to
analyze the data was as follows: Filter: SOAPnuke-1.5.6, Alignment
hisat: Hisat2-2.1.0 (32), Alignment
bowtie: Bowtie2-2.3.4.3 (33),
Expression RSEM: rsem_calculate_expression rsem-1.2.28-0 (34), SNP INDEL: GenomeAnalysisTK (35), Structure Fusion ericscript:
Ericscript, Structure AS rMATS: rMATS.3.2.5 (36). Gene Ontology (GO; geneontology.org)
and Kyoto Encyclopedia of Genes and Genomes (KEGG; http://www.genome.jp/kegg/) pathway analyses were
performed using the RNA Data Visualization System Dr. TOM (Beijing
Genomics Institute; http://www.bgi.com/global/dr-tom/), a BGI in-house
customized data mining system which combines different published
software. Gene set enrichment analysis (GSEA) was performed as
previously described (37) to analyze
the differential modulation of molecular pathways in the all
canonical pathway gene set (C2.CP) from the v7.0 MSigDB gene set
collection (https://www.gsea-msigdb.org/gsea/msigdb/).
Statistical analysis
Statistical analyses were performed using JMP
statistical software version 15.0.0. (SAS Institute, Inc.).
Significant differences between the WT and shSPARC groups in the
in vitro and in vivo experiments were assessed using
the Mann-Whitney U test. The Fisher's exact test was used to
investigate the association between the proteins tested (SPARC,
PTX3, FN, FSTL1 and LGALS1) and each patient's clinicopathological
characteristics. Univariate analysis was conducted using Cox
proportional-hazards model. Kaplan-Meier curves were created to
examine survival rates, and the log-rank test was used to
statistically compare the Kaplan-Meier curves. Data are presented
as the mean ± SEM. Experiments were repeated three times
independently. P<0.05 was considered to indicate a statistically
significant difference.
Results
SPARC expression in cancer cells of
human CRC is an effective prognostic marker
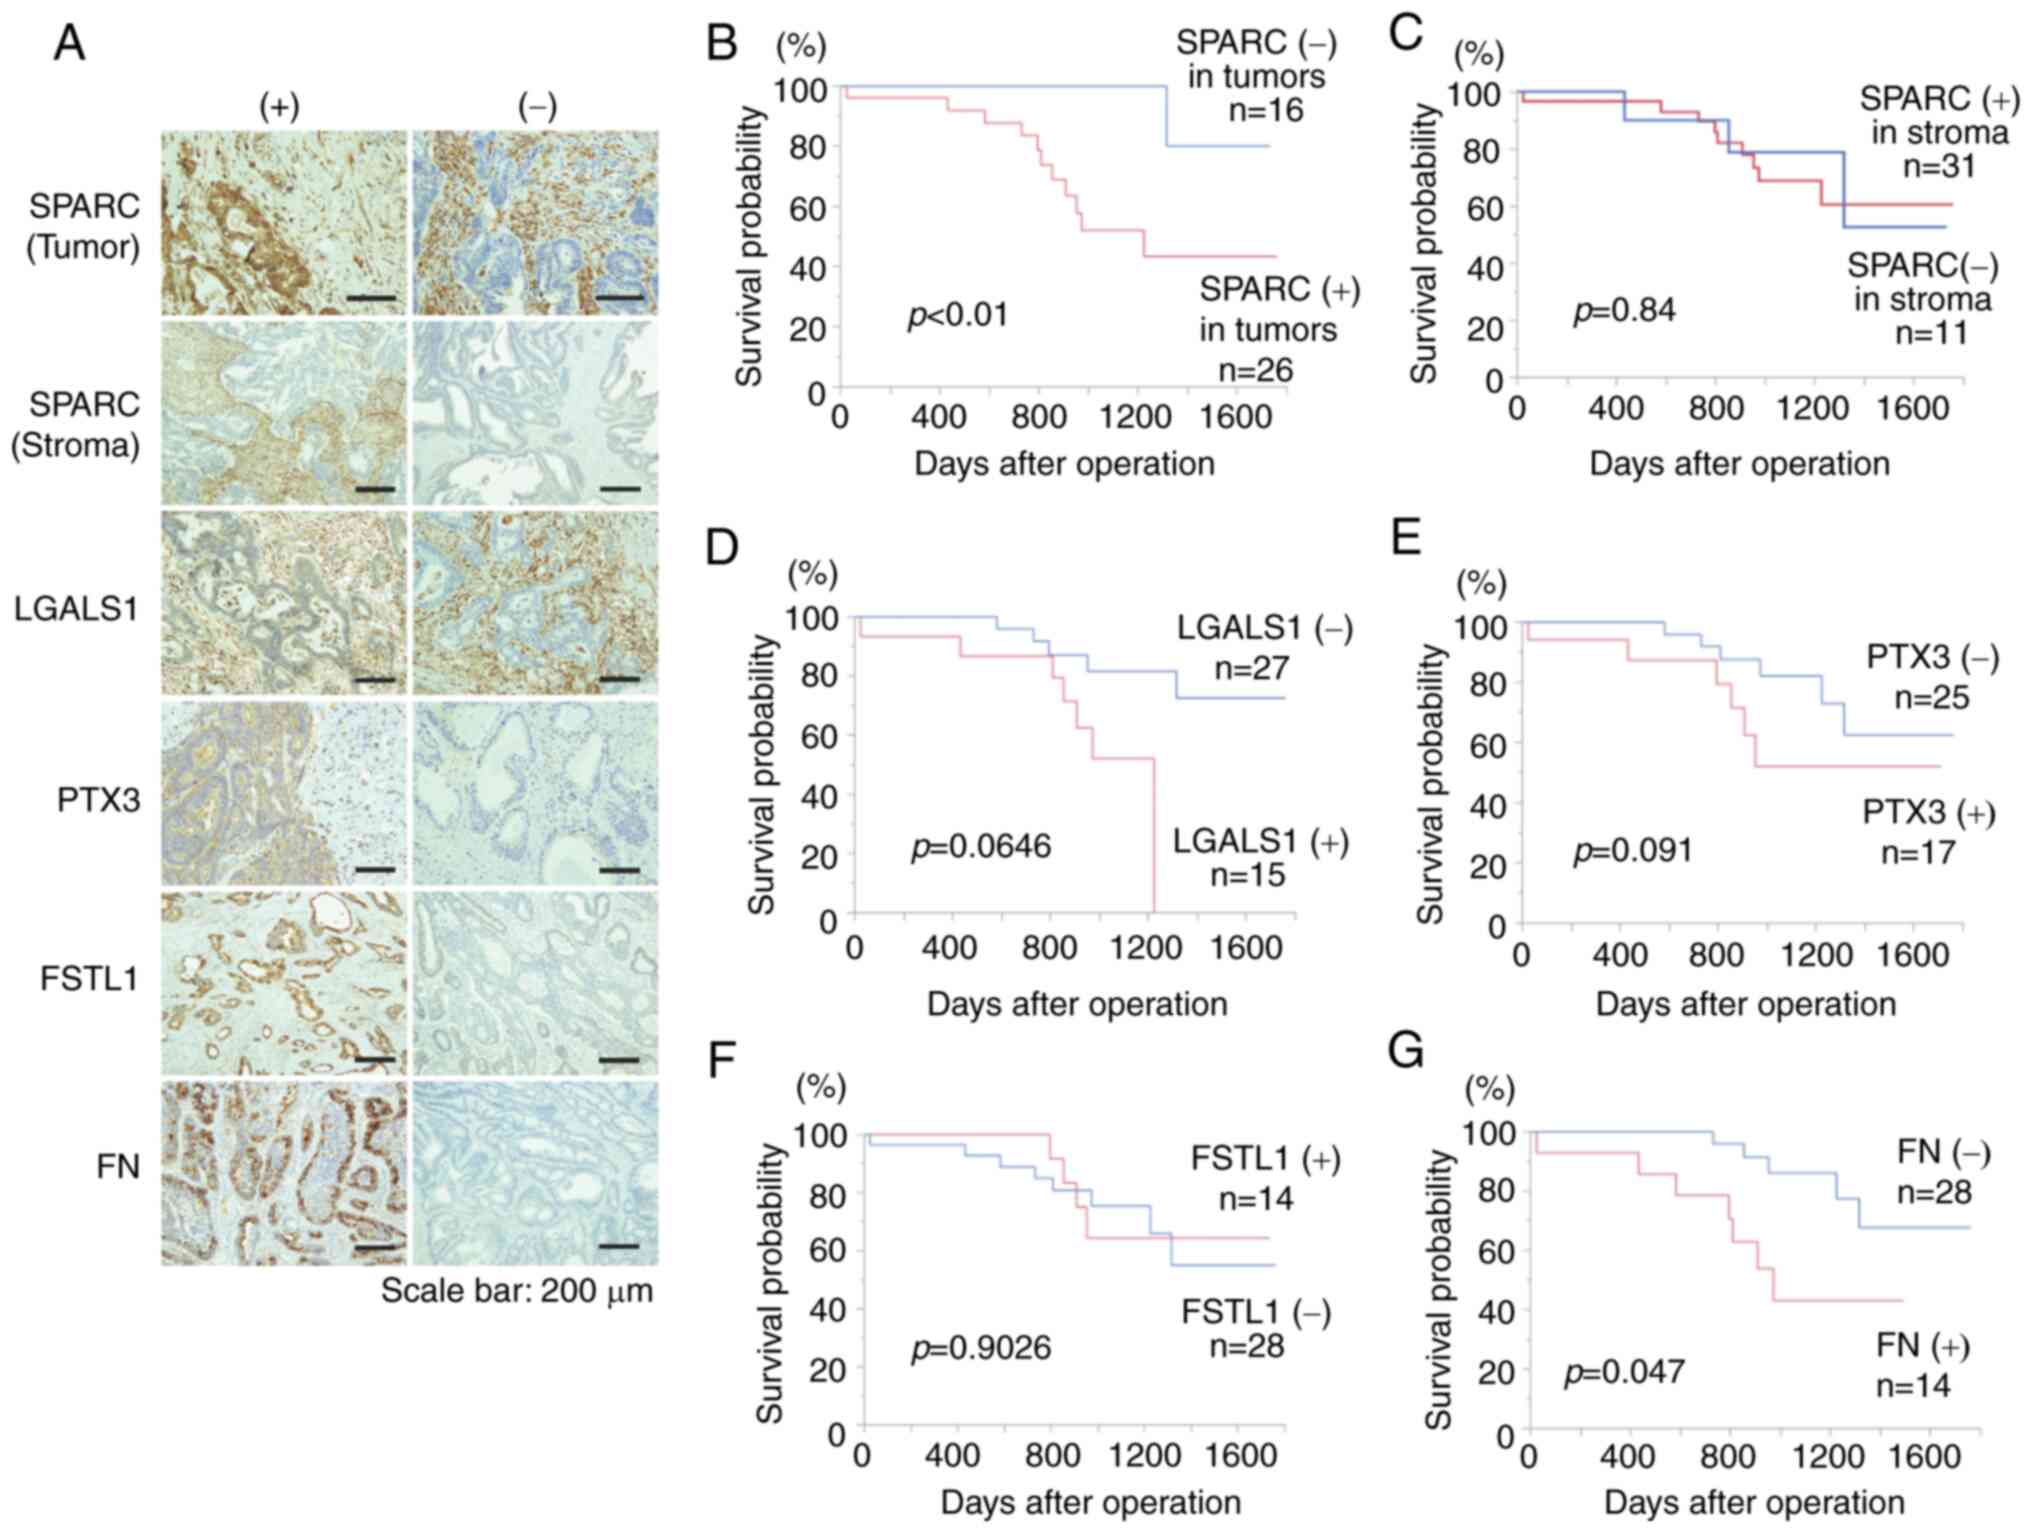
Immunostaining for SPARC, PTX3, FN, FSTL1 and LGALS1
was performed in 42 resected human CRC specimens (Fig. 1A). SPARC was evaluated for staining in
cancer cells and stroma, respectively, and the others were
evaluated for staining in cancer cells. High T grade (P<0.01), N
grade (P<0.05) and stage (P<0.01) were significantly more
frequent in cancer cells expressing SPARC compared with those that
did not (Table I). Kaplan-Meier
survival curve analysis revealed significantly poorer prognoses in
cases expressing SPARC in tumors compared with those that did not
(P<0.01; Fig. 1B). Furthermore,
univariate Cox proportional-hazards analysis demonstrated that the
prognosis was significantly poorer in CRC cases with positive SPARC
expression (Table II). These results
indicated that SPARC expression in CRC cells may be a useful
prognostic biomarker.
 | Table I.Association between SPARC expression
in tumor cells and clinicopathological characteristics. |
Table I.
Association between SPARC expression
in tumor cells and clinicopathological characteristics.
|
| SPARC
expression |
|
|---|
|
|
|
|
|---|
|
Characteristics | Positive, n
(%) | Negative, n
(%) | P-value |
|---|
| Age, years |
|
|
|
| ≥65
(n=33) | 20 (61) | 13 (39) | >0.99 |
| <65
(n=9) | 6 (67) | 3 (33) |
|
| Sex |
|
|
|
| Male
(n=23) | 14 (61) | 9 (39) | >0.99 |
| Female
(n=19) | 12 (63) | 7 (37) |
|
| T
classification |
|
|
|
| T1
(n=7) | 0 (0) | 7 (100) | <0.01 |
| T2/3/4
(n=35) | 26 (74) | 9 (26) |
|
| N
classification |
|
|
|
| N0
(n=20) | 8 (40) | 12 (60) | <0.05 |
| N1/2/3
(n=22) | 18 (82) | 4 (18) |
|
| M
classification |
|
|
|
| M0
(n=37) | 21 (57) | 16 (43) | 0.14 |
| M1
(n=5) | 5 (100) | 0 (0) |
|
| Stage |
|
|
|
| I/II
(n=18) | 6 (33) | 12 (67) | <0.01 |
| III/IV
(n=24) | 20 (83) | 4 (17) |
|
| Lymphatic
invasion |
|
|
|
| ly0
(n=29) | 17 (59) | 12 (41) | 0.73 |
| ly1/2/3
(n=13) | 9 (69) | 4 (31) |
|
| Vessel
invasion |
|
|
|
| v0
(n=28) | 15 (54) | 13 (46) | 0.18 |
| v1/2/3
(n=14) | 11 (79) | 3 (21) |
|
| Histological
type |
|
|
|
| Well
(n=38) | 23 (61) | 15 (39) | 1 |
|
Moderately (n=4) | 3 (75) | 1 (25) |
|
| Table II.Univariate Cox regression analyses of
SPARC expression. |
Table II.
Univariate Cox regression analyses of
SPARC expression.
|
| Univariate
analysis |
|---|
|
|
|
|---|
| Variable | HR (95% CI) | P-value |
|---|
| Age, years |
| 0.46 |
|
<65 | 1 (Ref.) |
|
|
≥65 | 1.719
(0.448-11.241) |
|
| Stage |
| 0.06 |
|
I/II | 1 (Ref.) |
|
|
III/IV | 3.640
(0.958-23.702) |
|
| Histological
type |
| 0.12 |
|
tub1 | 1 (Ref.) |
|
|
tub2 | 3.212
(0.706-10.928) |
|
| SPARC |
| <0.01 |
|
Negative | 1 (Ref.) |
|
|
Positive | 9.792
(1.895-179.207) |
|
Additionally, a significant difference was observed
in the M grade based on LGALS1 expression (P<0.05; Table III), while no significant
association was observed between FSTL1 (Table IV), FN (Table V) and PTX3 (Table VI) expression and clinicopathological
factors. However, the prognosis was significantly worse in cases
with FN expression compared with those without (P<0.05; Fig. 1G), while no significant associations
were observed for the remaining proteins (Fig. 1D-F).
| Table III.Association between LGALS1 expression
in tumor cells and clinicopathological characteristics. |
Table III.
Association between LGALS1 expression
in tumor cells and clinicopathological characteristics.
|
| LGALS1
expression |
|
|---|
|
|
|
|
|---|
|
Characteristics | Positive, n
(%) | Negative, n
(%) | P-value |
|---|
| Age, years |
|
|
|
| ≥65
(n=33) | 12 (36) | 21 (64) | >0.99 |
| <65
(n=9) | 3 (33) | 6 (67) |
|
| Sex |
|
|
|
| Male
(n=23) | 8 (35) | 15 (65) | >0.99 |
| Female
(n=19) | 7 (37) | 12 (63) |
|
| T
classification |
|
|
|
| T1
(n=7) | 4 (57) | 3 (43) | 0.23 |
| T2/3/4
(n=35) | 11 (31) | 24 (69) |
|
| N
classification |
|
|
|
| N0
(n=20) | 7 (35) | 13 (65) | >0.99 |
| N1/2/3
(n=22) | 8 (36) | 14 (64) |
|
| M
classification |
|
|
|
| M0
(n=37) | 11 (30) | 26 (70) | <0.05 |
| M1
(n=5) | 4 (80) | 1 (20) |
|
| Stage |
|
|
|
| I/II
(n=18) | 6 (33) | 12 (67) | >0.99 |
| III/IV
(n=24) | 9 (38) | 15 (62) |
|
| Lymphatic
invasion |
|
|
|
| ly0
(n=29) | 9 (31) | 20 (69) | 0.49 |
| ly1/2/3
(n=13) | 6 (46) | 7 (54) |
|
| Vessel
invasion |
|
|
|
| v0
(n=28) | 12 (43) | 16 (57) | 0.31 |
| v1/2/3
(n=14) | 3 (21) | 11 (79) |
|
| Histological
type |
|
|
|
| Well
(n=38) | 12 (32) | 26 (68) | 0.12 |
|
Moderately (n=4) | 3 (75) | 1 (25) |
|
| Table IV.Association between FSTL1 expression
in tumor cells and clinicopathological characteristics. |
Table IV.
Association between FSTL1 expression
in tumor cells and clinicopathological characteristics.
|
| FSTL1
expression |
|
|---|
|
|
|
|
|---|
|
Characteristics | Positive, n
(%) | Negative, n
(%) | P-value |
|---|
| Age, years |
|
|
|
| ≥65
(n=33) | 13 (39) | 20 (61) | 0.23 |
| <65
(n=9) | 1 (11) | 8 (89) |
|
| Sex |
|
|
|
| Male
(n=23) | 9 (39) | 14 (61) | 0.51 |
| Female
(n=19) | 5 (26) | 14 (74) |
|
| T
classification |
|
|
|
| T1
(n=7) | 0 (0) | 7 (100) | 0.08 |
| T2/3/4
(n=35) | 14 (40) | 21 (60) |
|
| N
classification |
|
|
|
| N0
(n=20) | 5 (25) | 15 (75) | 0.34 |
| N1/2/3
(n=22) | 9 (41) | 13 (59) |
|
| M
classification |
|
|
|
| M0
(n=37) | 12 (32) | 25 (68) | >0.99 |
| M1
(n=5) | 2 (40) | 3 (60) |
|
| Stage |
|
|
|
| I/II
(n=18) | 4 (22) | 14 (78) | 0.32 |
| III/IV
(n=24) | 10 (42) | 14 (58) |
|
| Lymphatic
invasion |
|
|
|
| ly0
(n=29) | 8 (28) | 21 (72) | 0.30 |
| ly1/2/3
(n=13) | 6 (46) | 7 (54) |
|
| Vessel
invasion |
|
|
|
| v0
(n=28) | 9 (32) | 19 (68) | >0.99 |
| v1/2/3
(n=14) | 5 (36) | 9 (64) |
|
| Histological
type |
|
|
|
| Well
(n=38) | 12 (32) | 26 (68) | 0.59 |
|
Moderately (n=4) | 2 (50) | 2 (50) |
|
| Table V.Association between FN expression in
tumor cells and clinicopathological characteristics. |
Table V.
Association between FN expression in
tumor cells and clinicopathological characteristics.
|
| FN expression |
|
|---|
|
|
|
|
|---|
|
Characteristics | Positive, n
(%) | Negative, n
(%) | P-value |
|---|
| Age, years |
|
|
|
| ≥65
(n=33) | 12 (33) | 21 (67) | 0.69 |
| <65
(n=9) | 2 (22) | 7 (78) |
|
| Sex |
|
|
|
| Male
(n=23) | 7 (30) | 16 (70) | 0.75 |
| Female
(n=19) | 7 (32) | 12 (68) |
|
| T
classification |
|
|
|
| T1
(n=7) | 2 (29) | 5 (71) | >0.99 |
| T2/3/4
(n=35) | 12 (31) | 23 (69) |
|
| N
classification |
|
|
|
| N0
(n=20) | 6 (25) | 14 (75) | 0.75 |
| N1/2/3
(n=22) | 8 (36) | 14 (64) |
|
| M
classification |
|
|
|
| M0
(n=37) | 12 (30) | 25 (70) | >0.99 |
| M1
(n=5) | 2 (40) | 3 (60) |
|
| Stage |
|
|
|
| I/II
(n=18) | 4 (17) | 14 (83) | 0.32 |
| III/IV
(n=24) | 10 (42) | 14 (58) |
|
| Lymphatic
invasion |
|
|
|
| ly0
(n=29) | 9 (28) | 20 (72) | 0.73 |
| ly1/2/3
(n=13) | 5 (38) | 8 (62) |
|
| Vessel
invasion |
|
|
|
| v0
(n=28) | 11 (36) | 17 (64) | 0.31 |
| v1/2/3
(n=14) | 3 (21) | 11 (79) |
|
| Histological
type |
|
|
|
| Well
(n=38) | 12 (29) | 26 (71) | 0.59 |
|
Moderately (n=4) | 2 (50) | 2 (50) |
|
| Table VI.Association between PTX3 expression
in tumor cells and clinicopathological characteristics. |
Table VI.
Association between PTX3 expression
in tumor cells and clinicopathological characteristics.
|
| PTX3
expression |
|
|---|
|
|
|
|
|---|
|
Characteristics | Positive, n
(%) | Negative, n
(%) | P-value |
|---|
| Age, years |
|
|
|
| ≥65
(n=33) | 15 (45) | 18 (55) | 0.27 |
| <65
(n=9) | 2 (22) | 7 (78) |
|
| Sex |
|
|
|
| Male
(n=23) | 8 (35) | 15 (65) | 0.53 |
| Female
(n=19) | 9 (47) | 10 (53) |
|
| T
classification |
|
|
|
| T1
(n=7) | 2 (29) | 5 (71) | 0.68 |
| T2/3/4
(n=35) | 15 (43) | 20 (57) |
|
| N
classification |
|
|
|
| N0
(n=20) | 9 (45) | 11 (55) | 0.75 |
| N1/2/3
(n=22) | 8 (36) | 14 (64) |
|
| M
classification |
|
|
|
| M0
(n=37) | 14 (38) | 23 (62) | 0.38 |
| M1
(n=5) | 3 (60) | 2 (40) |
|
| Stage |
|
|
|
| I/II
(n=18) | 8 (44) | 10 (56) | 0.75 |
| III/IV
(n=24) | 9 (38) | 15 (62) |
|
| Lymphatic
invasion |
|
|
|
| ly0
(n=29) | 12 (41) | 17 (59) | >0.99 |
| ly1/2/3
(n=13) | 5 (38) | 8 (62) |
|
| Vessel
invasion |
|
|
|
| v0
(n=28) | 12 (43) | 16 (57) | 0.75 |
| v1/2/3
(n=14) | 5 (36) | 9 (64) |
|
| Histological
type |
|
|
|
| Well
(n=38) | 14 (37) | 24 (63) | 0.29 |
|
Moderately (n=4) | 3 (75) | 1 (25) |
|
Since it has been reported that SPARC expression in
the stroma of CRC is associated with prognosis (38), the present study also investigated
SPARC expression in the stroma and found no association with
prognosis or any of the examined clinicopathological factors
(Fig. 1C; Table VII).
| Table VII.Association between SPARC expression
in stromal cells and clinicopathological characteristics. |
Table VII.
Association between SPARC expression
in stromal cells and clinicopathological characteristics.
|
| SPARC
expression |
|
|---|
|
|
|
|
|---|
|
Characteristics | Positive, n
(%) | Negative, n
(%) | P-value |
|---|
| Age, years |
|
|
|
| ≥65
(n=33) | 23 (70) | 10 (30) | 0.40 |
| <65
(n=9) | 8 (89) | 1 (11) |
|
| Sex |
|
|
|
| Male
(n=23) | 17 (74) | 6 (26) | >0.99 |
| Female
(n=19) | 14 (74) | 5 (26) |
|
| T
classification |
|
|
|
| T1
(n=7) | 6 (86) | 1 (14) | 0.65 |
| T2/3/4
(n=35) | 25 (71) | 10 (29) |
|
| N
classification |
|
|
|
| N0
(n=20) | 17 (85) | 3 (15) | 0.17 |
| N1/2/3
(n=22) | 14 (64) | 8 (36) |
|
| M
classification |
|
|
|
| M0
(n=37) | 28 (76) | 9 (26) | 0.59 |
| M1
(n=5) | 3 (60) | 2 (40) |
|
| Stage |
|
|
|
| I/II
(n=18) | 15 (83) | 3 (17) | 0.30 |
| III/IV
(n=24) | 16 (67) | 8 (33) |
|
| Lymphatic
invasion |
|
|
|
| ly0
(n=29) | 24 (83) | 5 (17) | 0.07 |
| ly1/2/3
(n=13) | 7 (54) | 6 (46) |
|
| Vessel
invasion |
|
|
|
| v0
(n=28) | 23 (82) | 5 (18) | 0.14 |
| v1/2/3
(n=14) | 8 (57) | 6 (43) |
|
| Histological
type |
|
|
|
| Well
(n=38) | 28 (74) | 10 (26) | 1 |
|
Moderately (n=4) | 3 (75) | 1 (25) |
|
In addition, to verify whether SPARC expression is
induced by the interaction between cancer cells and activated
stroma, immunostaining for FAP (Fig.
S1A), a CAF marker, was conducted to determine whether an
association exists between the CAF volume around cancer cells and
cancer cell SPARC expression. The results demonstrated that the
FAP-positive area was significantly larger in SPARC-expressing
cases compared with negative cases (Fig.
S1B), suggesting that the interaction between cancer cells and
CAFs induces SPARC expression, which may affect tumor progression
and patient prognosis.
In vitro migration and proliferation
are suppressed in co-cultures of the KM12SM shSPARC cell line and
MSCs
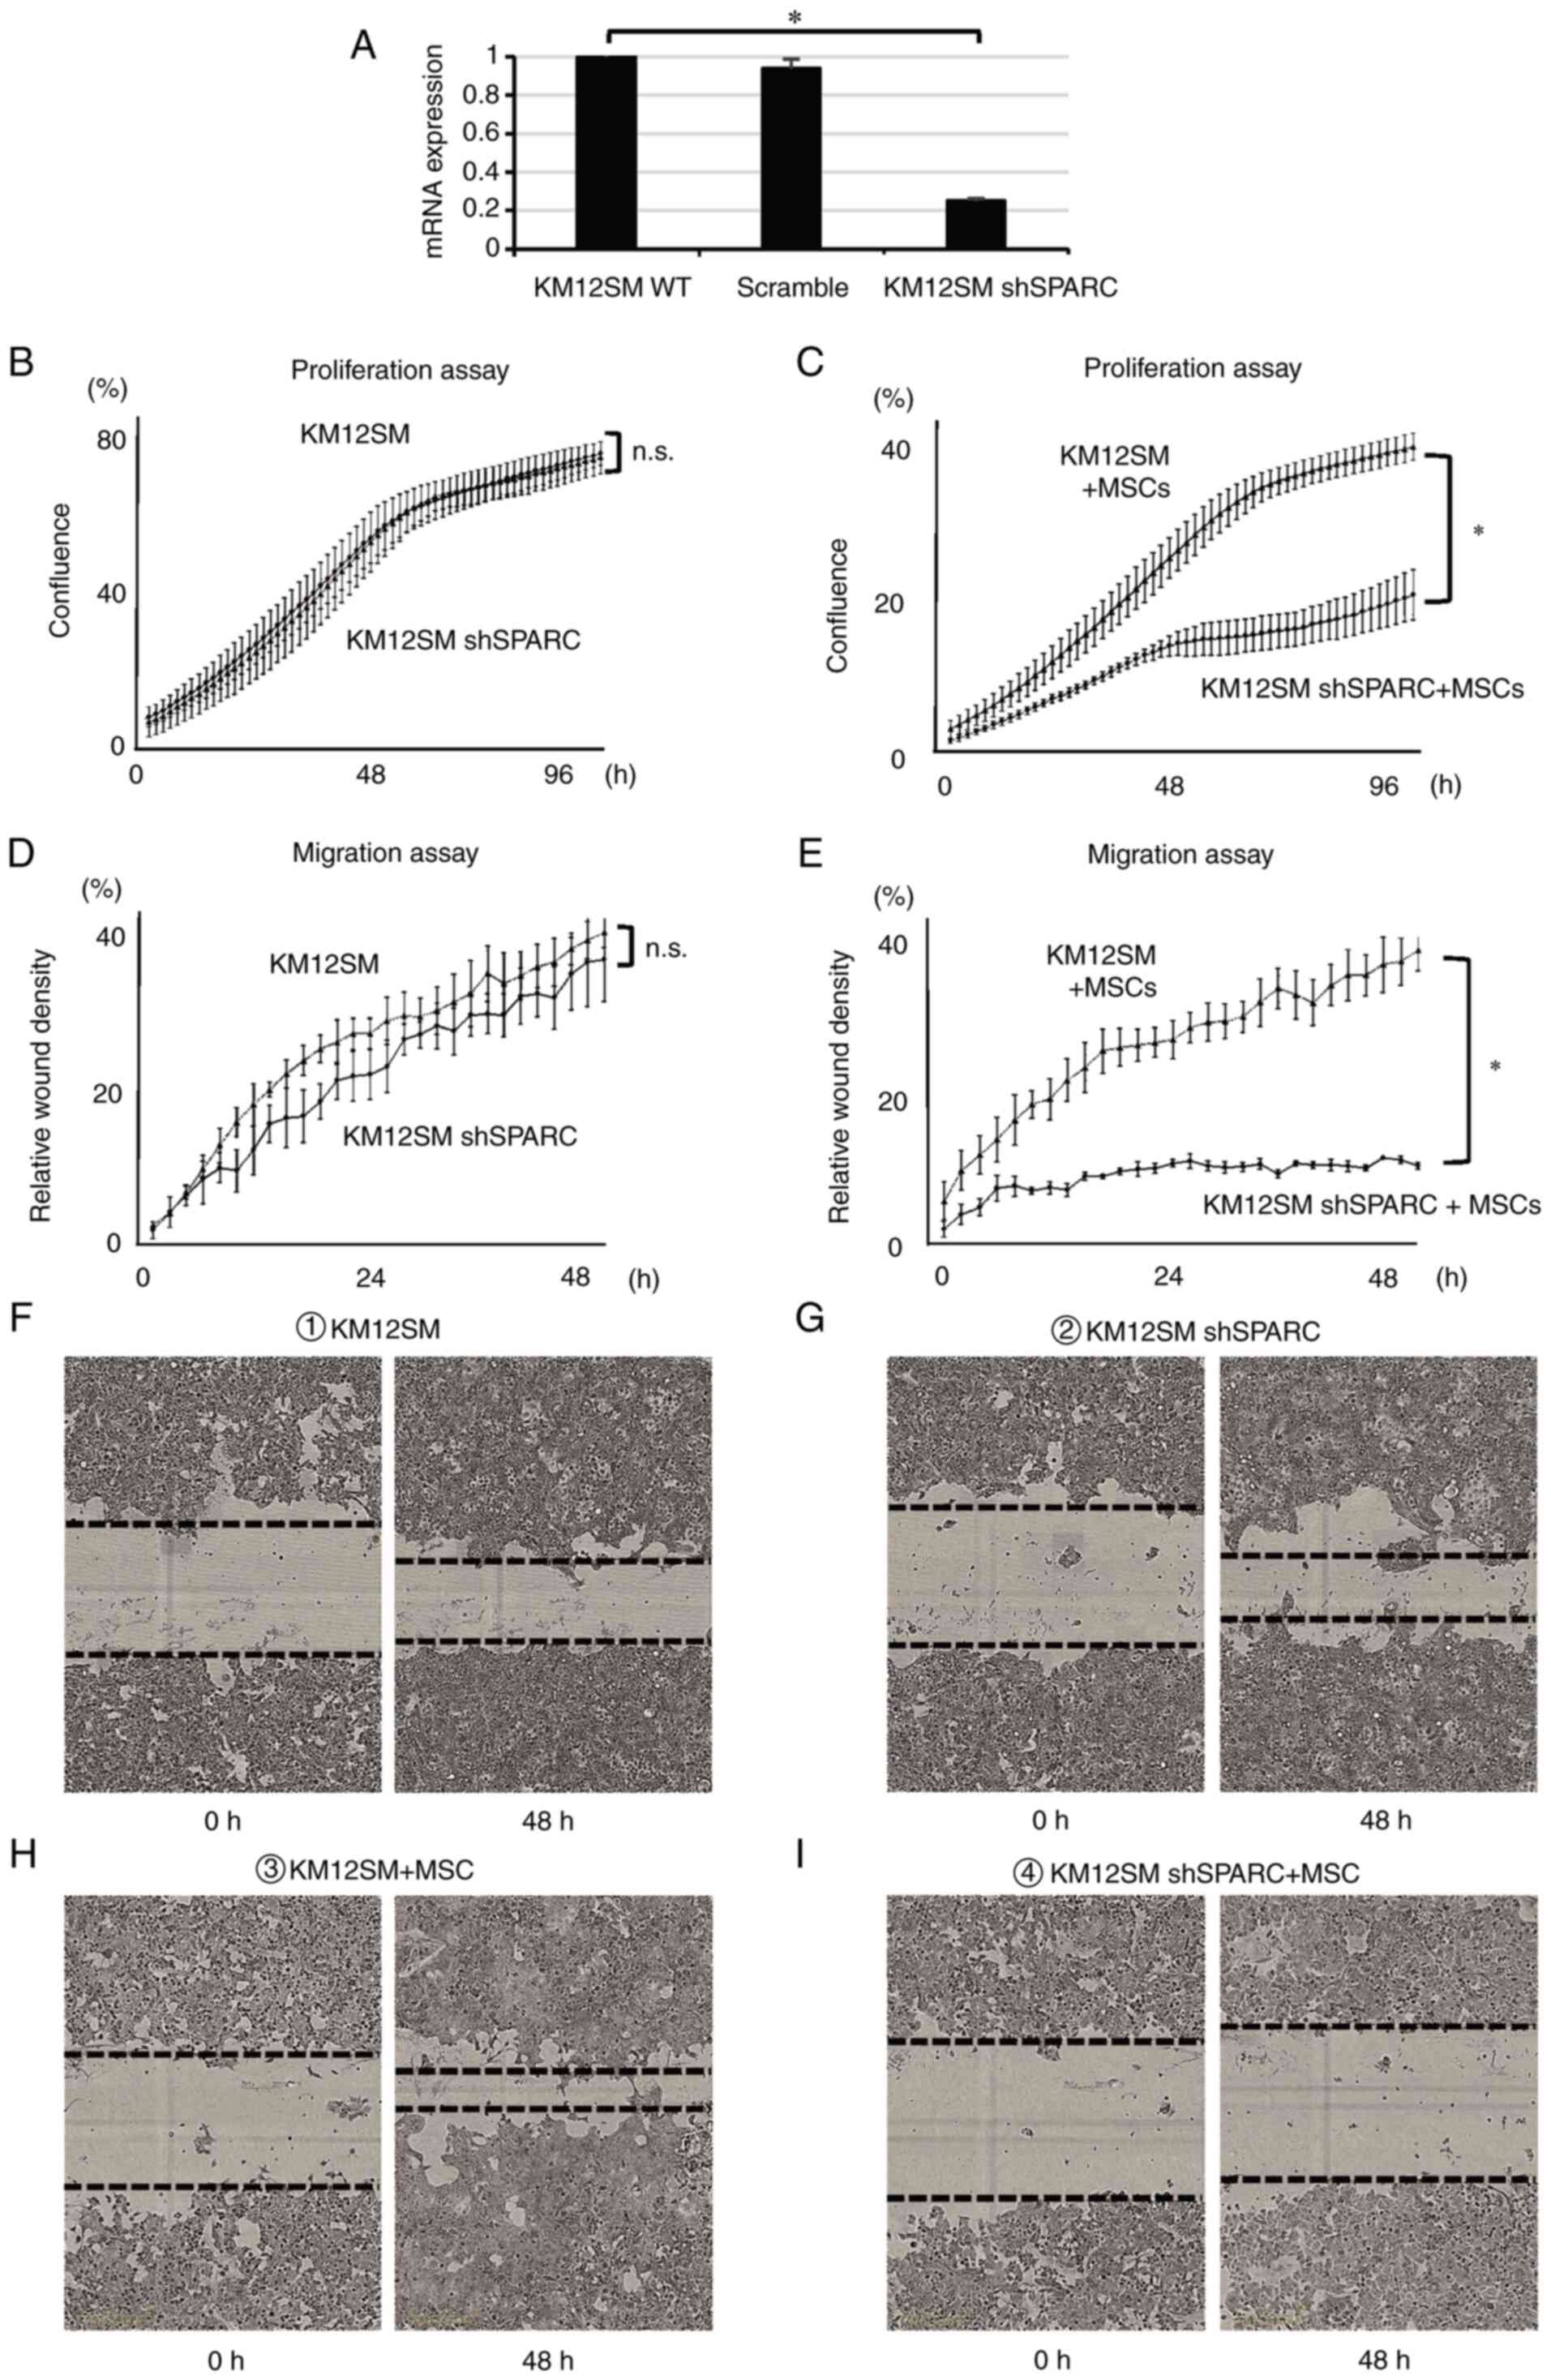
A KM12SM cell line with silenced SPARC expression
was generated using a SPARC shRNA lentiviral vector (shSPARC).
KM12SM WT (WT) and shSPARC cells were labeled with GFP and
co-cultured with MSCs. To remove MSCs, flow cytometry was performed
as previously described (12).
SPARC expression in each cell line was quantified using PCR.
shSPARC cells were demonstrated to exhibit reduced SPARC expression
(Fig. 2A). To compare proliferation
and migration abilities, WT and shSPARC cells were cultured either
alone or with MSCs. No significant differences were observed
between the proliferation capacity of WT and shSPARC cells when
cultured alone (Fig. 2B). However,
the proliferation ability of shSPARC cells was significantly
suppressed in co-culture with MSCs compared with that of WT cells
co-cultured with MSCs (P<0.05; Fig.
2C). Furthermore, no significant difference in the migration
ability was observed when the cells were cultured alone (Fig. 2D, F and G). However, migration was
significantly inhibited in shSPARC cells following co-culture with
MSCs compared with WT cells co-cultured with MSCs (Fig. 2E, H and I; P<0.05). These results
indicated that SPARC expression in cancer cells promoted
cell proliferation and migration. Furthermore, direct contact
between cancer cells and MSCs was essential for these SPARC
functions.
Growth and metastasis of KM12SM
shSPARC orthotopic tumors co-transplanted with MSCs are
significantly suppressed
Orthotopically transplanted tumors were generated to
investigate how SPARC expression in CRC cells affected tumor growth
and development. First, tumors transplanted with WT and shSPARC
alone were generated and compared with each other (Table VIII; Fig. S2A and B).
| Table VIII.Results of animal experiments
(orthotopic tumor implantation). |
Table VIII.
Results of animal experiments
(orthotopic tumor implantation).
| Group | No. | Body weight, g
(range) | Tumor weight, g
(range) | Lymph node
metastasis, n | Liver metastasis,
n |
|---|
| KM12SM | 9 | 19.8
(16.8-22.1) | 0.43 (0.2-0.8) | 4/9a | 0/9 |
| KM12SM shSPARC | 6 | 21.5
(20.5-22.7) | 0.33 (0.2-0.5) | 0/6 | 0/6 |
| KM12SM + MSCs | 10 | 17.3
(13.8-22.6)b | 0.77
(0.3-1.6)b | 9/10b | 0/10 |
| KM12SM shSPARC +
MSCs | 9 | 21.0
(18.0-23.6) | 0.43 (0.2-1.0) | 2/9 | 0/9 |
Since the in vitro experiments revealed that
direct contact with MSCs was required for SPARC function in cancer
cells, tumors co-transplanted with WT + MSCs and shSPARC + MSCs
were generated (Table VIII;
Fig. S2C and D). A tendency for
reduced body weight loss and tumor weight was observed in mice
transplanted with only shSPARC tumors compared with WT tumors;
however, these differences were not statistically significant
(Table VIII; Fig. S2A and B). By contrast,
co-transplantation of shSPARC + MSCs induced a significant
reduction in body weight loss, tumor weight and lymph node
metastasis rate compared with the group co-transplanted with WT +
MSCs (P<0.05; Table VIII;
Fig. S2C and D). These results
indicated that SPARC was associated with the promotion of tumor
growth and metastasis, and its function was more pronounced
following co-transplantation with MSCs.
Angiogenesis and EMT are significantly
downregulated in KM12SM shSPARC orthotopic tumors co-transplanted
with MSCs
All orthotopically transplanted tumors were
immunohistologically compared. In mice transplanted with WT or
shSPARC alone, hematoxylin and eosin staining revealed that WT
tumors developed invasively with stromal reaction, whereas shSPARC
tumors developed expansively. A similar trend was observed in
tumors co-transplanted with MSCs, although the stromal reaction was
more pronounced in tumors co-transplanted with WT + MSCs than in
tumors transplanted with WT alone (Fig.
3A).
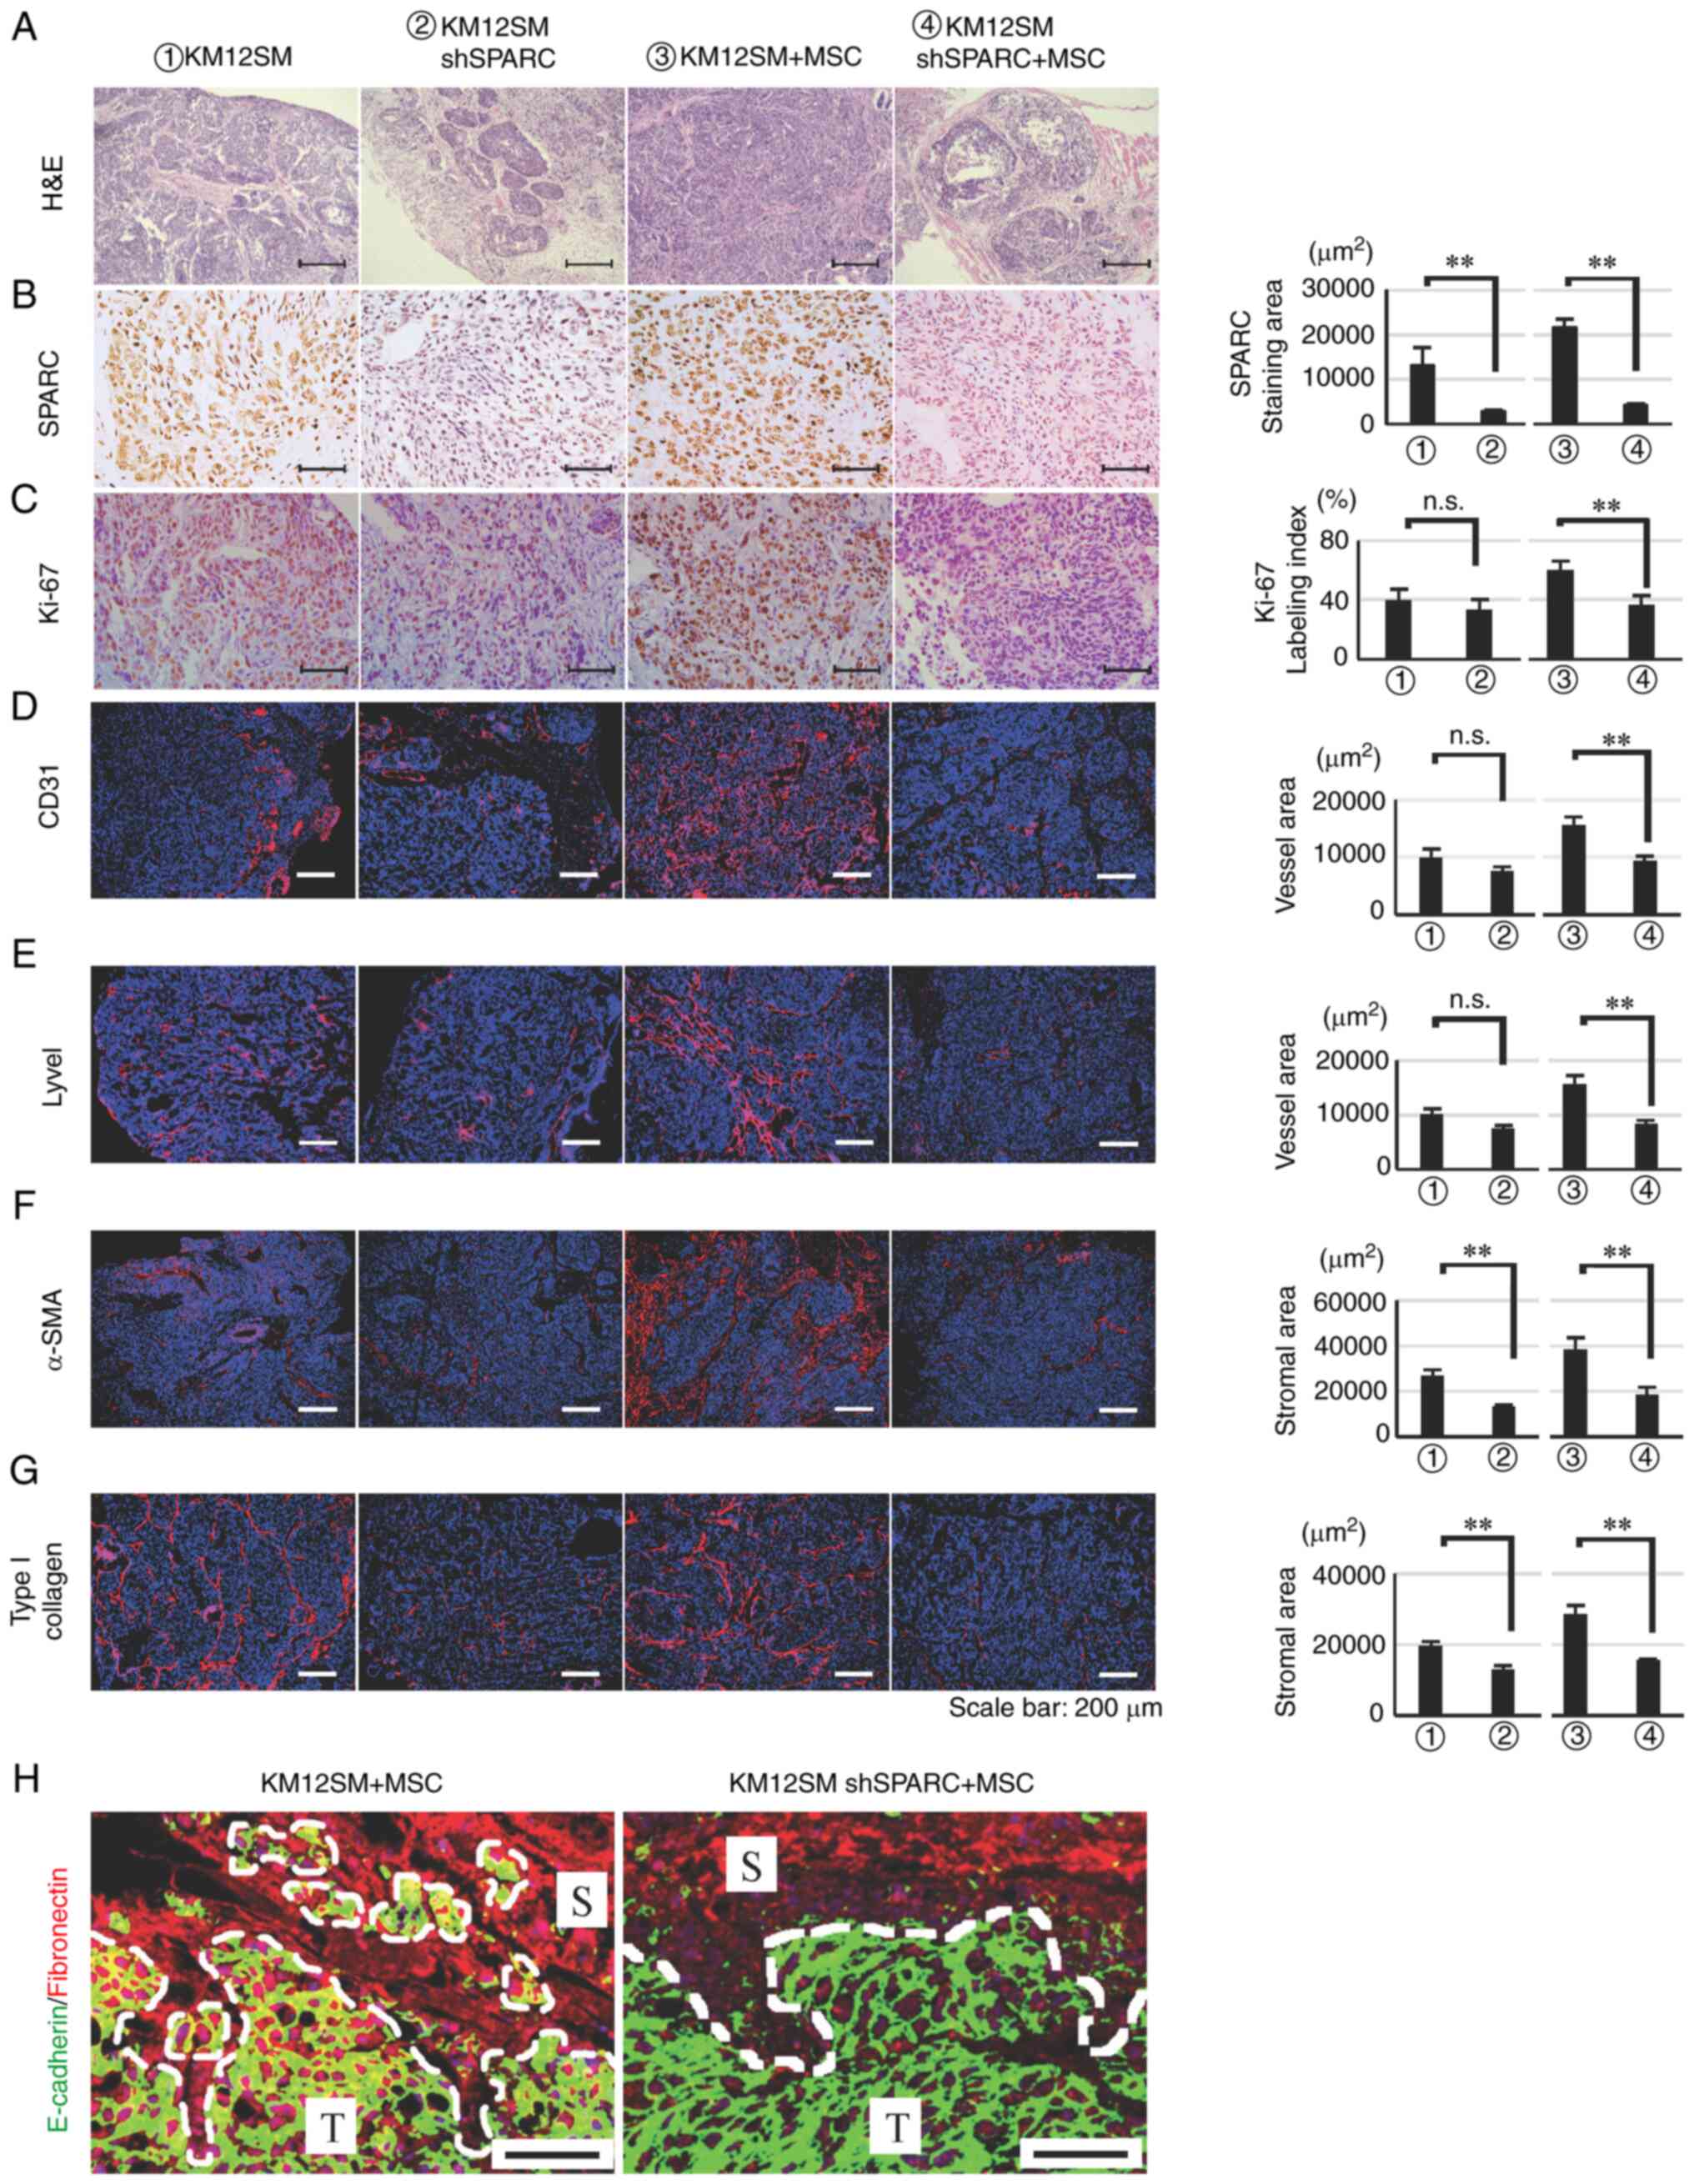 | Figure 3.Effects of SPARC silencing on
orthotopically implanted KM12SM tumor growth. Histological and
immunofluorescence staining of orthotopic tumors was performed 42
days after cell implantation. (A) H&E staining. (B) SPARC
expression in tumors transfected with SPARC shRNA. (C-G) Analysis
of (C) cell proliferation (Ki-67), (D) angiogenesis (CD31), (E)
lymphangiogenesis (Lyve1) and (F and G) the stromal reaction [(F)
α-SMA and (G) type I collagen]. Red, CD31, Lyve1, α-SMA and type I
collagen; blue, DAPI. Data are presented as the mean ± SEM.
**P<0.01. Scale bars, 200 µm (A and D-G) or 50 µm (B and C). (H)
Evaluation of epithelial-mesenchymal transition in the tumor edge
by double immunofluorescence staining for E-cadherin and
fibronectin. Green, E-cadherin; red, fibronectin; blue, DAPI. Scale
bars, 200 µm. T, tumor nest; S, stroma; α-SMA, α-smooth muscle
actin; H&E, hematoxylin and eosin; Lyve1, lymphatic vessel
endothelial hyaluronan receptor 1; MSCs, mesenchymal stem cells;
n.s., not significant; sh, short hairpin RNA; SPARC, secreted
protein acidic and rich in cysteine. |
Immunostaining further demonstrated that SPARC was
positively expressed in WT and WT + MSCs tumors and downregulated
in shSPARC and shSPARC + MSCs tumors (Fig. 3B). Furthermore, the Ki-67 LI was
significantly reduced in shSPARC + MSCs tumors compared with WT +
MSCs tumors, although no significant difference was observed for
single transplant tumors (Fig.
3C).
The areas of CD31- and Lyve1-positive immunostaining
were quantified to evaluate vessel area (Fig. 3D and E). Additionally, the positive
immunostaining areas for α-SMA and type I collagen were quantified
to analyze stromal area (Fig. 3F and
G). The positive CD31 and Lyve1 areas did not differ between WT
and shSPARC tumors. However, their positive areas were
significantly reduced in shSPARC + MSCs tumors compared with WT +
MSCs tumors (P<0.01; Fig. 3D and
E). Furthermore, the positive areas for α-SMA and type I
collagen were significantly reduced in shSPARC tumors for both
single transplanted tumors and MSCs co-transplanted tumors.
Furthermore, double immunostaining was performed
using the epithelial marker E-cadherin and the stromal marker FN to
assess EMT in co-transplanted tumors. Both E-cadherin and FN were
expressed at the edge of cancer cell nests in WT + MSCs tumors,
whereas no such changes were observed at the edge of cancer nests
in shSPARC + MSCs tumors, which only expressed E-cadherin (Fig. 3H). This result suggested that
SPARC-mediated EMT occurred at the edge of the cancer cell nest
where cancer cells and stromal cells are in direct contact with
each other.
SPARC positively regulates signaling
pathways and gene sets associated with stromal reactions,
angiogenesis and EMT
To investigate the effect of SPARC on gene
expression in transplanted tumors, mRNAs from WT + MSCs and shSPARC
+ MSCs tumors were analyzed. Subsequently, GO biological process
enrichment analysis, KEGG pathway enrichment analysis and GSEA were
performed to evaluate gene expression and pathway differences.
Since the in vitro and in vivo experimental results
demonstrated that SPARC was associated with cell proliferation,
migration, angiogenesis and EMT, factors related to these processes
were extracted from the top rankings with q-value <0.25.
In GO analysis, WT + MSCs tumors exhibited
significantly increased expression levels of genes associated with
‘cell migration’, ‘cell proliferation’, ‘angiogenesis’, ‘positive
regulation of extracellular matrix assembly’ and ‘positive
regulation of epithelial to mesenchymal transition’ compared with
shSPARC + MSCs tumors (Fig. 4A).
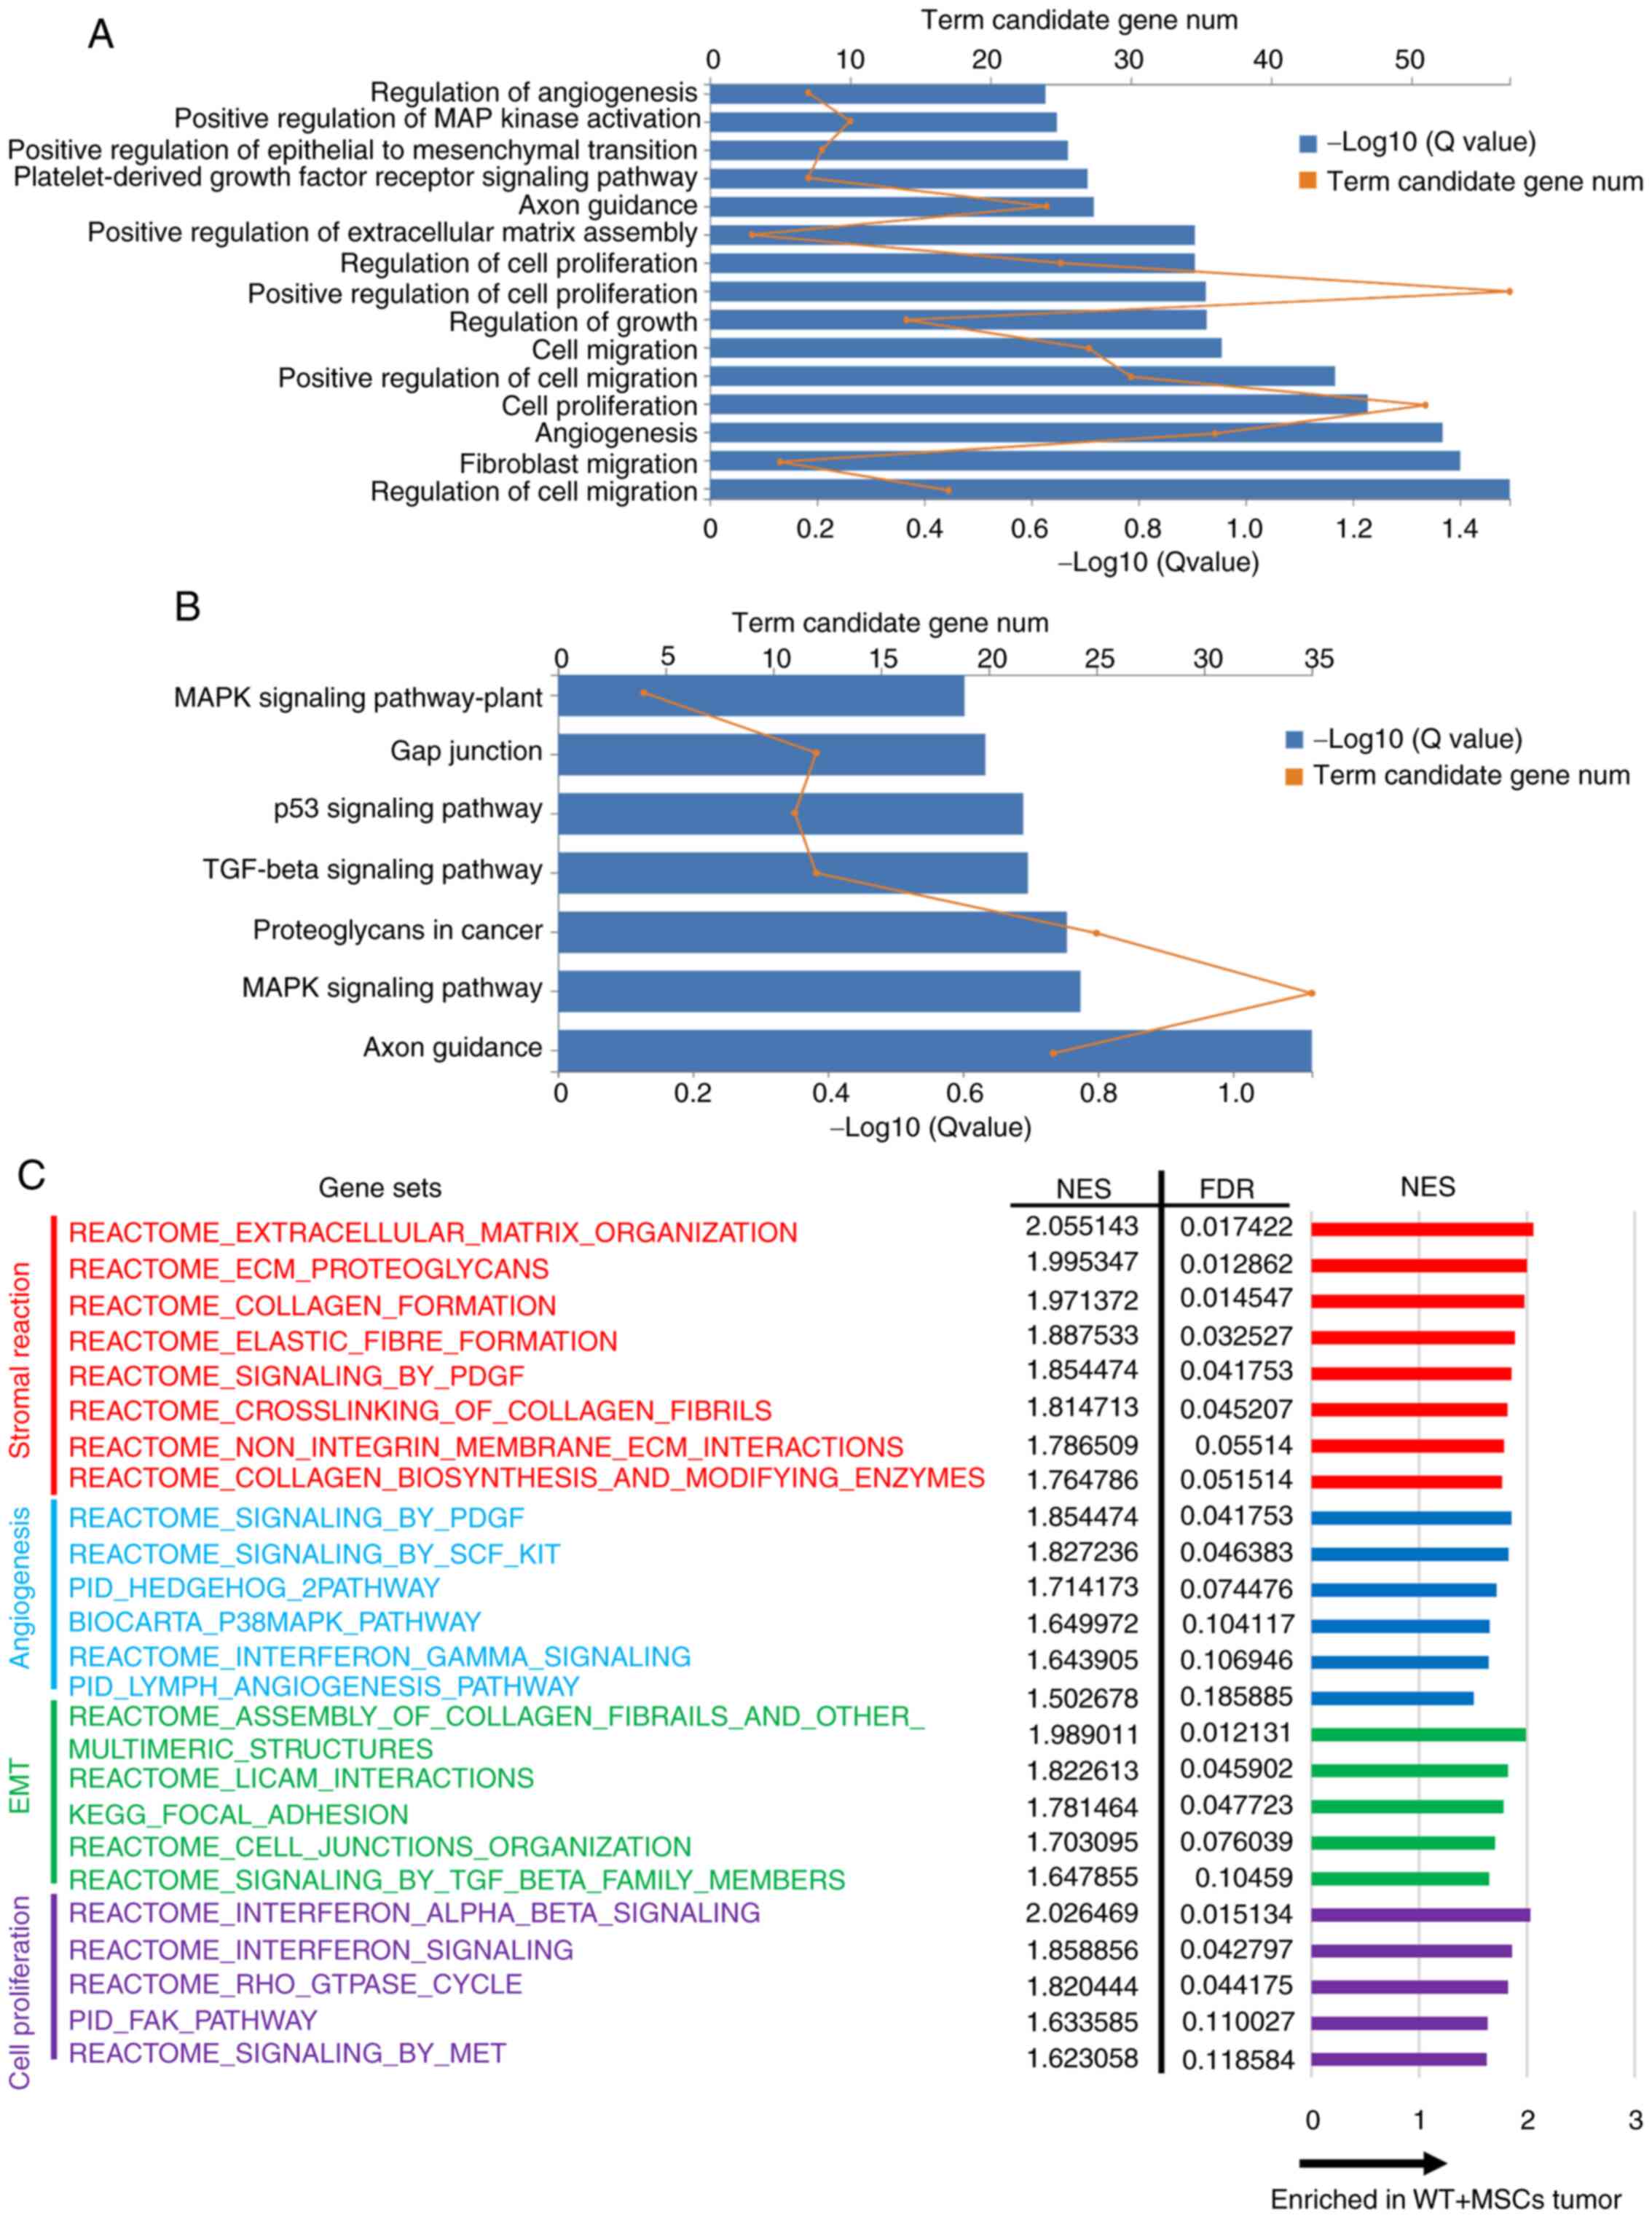 | Figure 4.Summary of RNA-sequencing comparison
of increased expression for WT + MSCs tumors vs. shSPARC + MSCs
tumors. (A) GO biological process enrichment analysis. (B) KEGG
pathway analysis. (C) GSEA. Significant changes were defined as a
Q-value <0.25. Gene sets and pathways associated with
proliferation, angiogenesis, stromal reaction and EMT were
extracted. GO, Gene Ontology; GSEA, gene set enrichment analysis;
KEGG, Kyoto Encyclopedia of Genes and Genomes; MSCs, mesenchymal
stem cells; NES, normalized enrichment score; sh, short hairpin
RNA; SPARC, secreted protein acidic and rich in cysteine; WT,
wild-type. |
KEGG pathway analysis revealed significant
activation of ‘axon guidance’, ‘MAPK signaling pathway’, ‘TGF-β
signaling pathway’ and ‘p53 signaling pathway’ in WT + MSCs tumors
(Fig. 4B).
GSEA revealed a significant increase in gene set
expression related to stromal reaction, angiogenesis, EMT and cell
proliferation in WT + MSCs tumors (Fig.
4C). Among them, the increased expression of gene sets related
to stromal formation was predominant.
These results suggest the importance of SPARC
expression in the process of tumor microenvironment formation via
cancer-stromal interactions. Additionally, RNA sequencing also
revealed that the expression levels of genes and signaling pathways
associated with stromal reactions, angiogenesis and EMT were
suppressed in tumors co-transplanted with shSPARC and MSCs, and
these mRNA sequencing results were consistent with the
immunohistology findings; co-transplantation of MSCs and shSPARC
tumors suppressed growth, stromal reactions and EMT compared with
co-transplantation of MSCs and WT tumors.
Discussion
The incidence of CRC and its associated mortality
rate remain high, with distant metastasis and tumor recurrence
negatively affecting patient prognoses. Therefore, the
identification of effective markers for detecting CRC development
or metastasis is essential for designing effective preventative and
therapeutic strategies for CRC.
To clarify the mechanism by which MSCs promote tumor
progression, microarray analysis was performed in our previous
study (12) and gene expression
changes in cancer cells induced following co-culture with MSCs were
comprehensively evaluated. Direct co-culture with MSCs induced
EMT-related genes, such as SPARC, FN1, LGALS, FSTL1 and
PTX3, in KM12SM cancer cells (12). Therefore, it was conceivable that
SPARC represents a key EMT modulator in the context of the
interactions between cancer cells and MSCs. Therefore, the present
study focused on SPARC expression in cancer cells induced by
interactions with MSCs.
Previous studies have reported the upregulation of
SPARC expression in cells from different types of cancer, including
gastric cancer (39), pancreatic
cancer (40) and CRC (41). However, a conclusive view on its
association with prognosis in CRC has not been reached, with a
report revealing that SPARC expression in the tumor stroma is
associated with poor prognosis (38),
while another report has indicated that low expression in the
stroma is associated with poor prognosis (42). In the present study, the expression
levels of SPARC in cancer cells were associated with the
clinicopathological characteristics and prognosis of patients with
CRC. Cumulatively, these results suggest that SPARC is an important
EMT-related factor involved in the interaction between cancer cells
and stromal cells in CRC, and that its expression in cancer cells,
not stromal cells, influences tumor progression and prognosis.
However, the association between SPARC expression and prognosis in
different tumor types, cell types and populations was inconsistent,
indicating the complex role of SPARC in tumor development and
metastasis. Therefore, SPARC expression and its functions in CRC
remain controversial and, thus, warrant further investigation.
SPARC is a non-structural matrix cell glycoprotein
that mediates cell-matrix interactions and serves important roles
in wound repair and tissue remodeling (14,43).
Additionally, SPARC is involved in cell counter-adhesion, cell
proliferation, cell migration and angiogenesis (14,43). SPARC
has been demonstrated to promote migration and EMT in highly
metastatic cancer types, including prostate cancer and breast
cancer (44,45). Furthermore, SPARC has been
demonstrated to promote angiogenesis in melanoma (46). Additionally, to the best of our
knowledge, the effects of SPARC on the tumor microenvironment in
CRC have not been reported in detail, and these were assessed in
the present study using an orthotopic transplantation model.
Histological analysis suggested that SPARC expression in cancer
cells was associated with EMT, stromal reactions and angiogenesis.
These changes were more pronounced in tumors co-transplanted with
MSCs, suggesting that SPARC functions are induced by the
interaction between cancer cells and stromal cells. Particularly in
invasive CRC, which is prone to stromal reactions, cancer and
stromal interactions are abundant (47), suggesting a more critical role for
SPARC in tumor development and progression. Furthermore, in
contrast to the in vitro results, the tendency to suppress
angiogenesis and stromal reactions in shSPARC tumors without MSCs
may be due to the presence of fibroblasts and migrating MSCs that
are physiologically present at the transplantation site in
vivo, which may interact with cancer cells and contribute to
the formation of the microenvironment.
Consistent with our pathological analysis findings,
mRNA sequencing revealed that silencing SPARC in cancer
cells attenuated the expression of stromal activated genes,
angiogenesis-related genes and cell proliferative genes in tumors.
Furthermore, KEGG pathway analysis demonstrated that SPARC
silencing suppressed the axon guidance pathway. Axon guidance has
been reported to contribute to tumor microenvironment formation by
affecting pericyte, immune response and stromal reaction (48). Furthermore, the MAPK, TGF-β and p53
signaling pathways were suppressed by SPARC silencing, and
all of these are known EMT regulators and are reportedly associated
with SPARC expression in glioma, lung cancer and melanoma
(15,49–52). GSEA
revealed that the expression of gene sets associated with stromal
formation, cell proliferation, angiogenesis and EMT was also
reduced by SPARC silencing. However, the altered expression
levels of genes associated with stromal formation were most
pronounced, indicating that SPARC induces EMT with significant
involvement in stromal formation in the tumor microenvironment.
Therefore, SPARC may function as an upstream
regulator of pathways associated with EMT, thereby affecting tumor
infiltration and metastasis. Considering that invasiveness and
metastasis of CRC are the primary causes of death, further
investigations into the EMT-related genes associated with invasion
and metastasis in CRC, including SPARC, remain warranted to
elucidate the underlying mechanisms and to identify novel
biomarkers for the prevention and treatment of CRC.
In summary, an association was observed between
SPARC expression in cancer cells and the clinicopathological
characteristics and prognosis of patients with CRC. In shSPARC
cells, proliferation and migration abilities were suppressed
following co-culture with MSCs. In orthotopic tumors
co-transplanted with MSCs, suppression of SPARC expression
suppressed growth, stromal reactions and EMT, thus inhibiting the
interaction between cancer and stromal cells in the tumor
microenvironment. Therefore, SPARC was associated with CRC
progression and metastasis, and is a potential effective prognostic
marker for CRC that may also serve as a promising target molecule
for the development of CRC treatments in the future.
Supplementary Material
Supporting Data
Acknowledgements
The KM12SM cell line was donated by Dr Isaiah J.
Fidler (University of Texas, Houston, TX, USA). Human MSCs were
provided by Dr Yukihito Higashi (Department of Cardiovascular
Physiology and Medicine, Hiroshima University).
Funding
The present study was partially supported by the PUH
Research Grant Program (advanced research A; no. 01).
Availability of data and materials
The datasets used and/or analyzed during the current
study are available from the corresponding author on reasonable
request.
Authors' contributions
TN performed most of the experiments, analyzed the
data and wrote the manuscript. RY, YK and HT designed the
experiments and contributed to writing the manuscript. TN and RY
confirmed the authenticity of the data. YH prepared the MSCs and
contributed to writing the manuscript. TK and KK collected clinical
tissue samples and pathological information and contributed to
analysis of the clinical data. ST and KC contributed to the
conception and design of the study. All authors discussed the
results. All authors read and approved the final manuscript.
Ethics approval and consent to
participate
The protocol was approved by the Ethics Committee of
Hiroshima University Graduate School of Medicine (Hiroshima, Japan)
and the National Hospital Organization Kure Medical Center
(Hiroshima, Japan). All clinical samples were obtained from
patients who had provided written informed consent for the use of
their tissues for the purposes of research after surgery. The
animal experiment was approved by the Committee on Animal
Experimentation of Hiroshima University (Hiroshima, Japan).
Patient consent for publication
Not applicable.
Competing interests
The authors declare that they have no competing
interests.
Glossary
Abbreviations
Abbreviations:
|
CAF
|
carcinoma-associated fibroblast
|
|
EMT
|
epithelial-mesenchymal transition
|
|
GFP
|
green fluorescent protein
|
|
GSEA
|
gene set enrichment analysis
|
|
MSCs
|
mesenchymal stem cells
|
|
SPARC
|
secreted protein acidic and rich in
cysteine
|
|
WT
|
wild-type
|
References
|
1
|
Jemal A, Bray F, Center MM, Ferlay J, Ward
E and Forman D: Global cancer statistics. CA Cancer J Clin.
61:69–90. 2011. View Article : Google Scholar : PubMed/NCBI
|
|
2
|
Marmol I, Sanchez-de-Diego C, Pradilla
Dieste A, Cerrada E and Rodriguez Yoldi MJ: Colorectal carcinoma: A
general overview and future perspectives in colorectal cancer. Int
J Mol Sci. 18:1972017. View Article : Google Scholar : PubMed/NCBI
|
|
3
|
Ng L, Poon RT and Pang R: Biomarkers for
predicting future metastasis of human gastrointestinal tumors. Cell
Mol Life Sci. 70:3631–3656. 2013. View Article : Google Scholar : PubMed/NCBI
|
|
4
|
Yue B: Biology of the extracellular
matrix: An overview. J Glaucoma. 23 (Suppl 1):S20–S23. 2014.
View Article : Google Scholar : PubMed/NCBI
|
|
5
|
Whiteside TL: The tumor microenvironment
and its role in promoting tumor growth. Oncogene. 27:5904–5912.
2008. View Article : Google Scholar : PubMed/NCBI
|
|
6
|
Mantovani A, Allavena P, Sica A and
Balkwill F: Cancer-related inflammation. Nature. 454:436–444. 2008.
View Article : Google Scholar : PubMed/NCBI
|
|
7
|
De Wever O and Mareel M: Role of tissue
stroma in cancer cell invasion. J Pathol. 200:429–447. 2003.
View Article : Google Scholar : PubMed/NCBI
|
|
8
|
Kalluri R and Zeisberg M: Fibroblasts in
cancer. Nat Rev Cancer. 6:392–401. 2006. View Article : Google Scholar : PubMed/NCBI
|
|
9
|
Kitadai Y, Sasaki T, Kuwai T, Nakamura T,
Bucana CD and Fidler IJ: Targeting the expression of
platelet-derived growth factor receptor by reactive stroma inhibits
growth and metastasis of human colon carcinoma. Am J Pathol.
169:2054–2065. 2006. View Article : Google Scholar : PubMed/NCBI
|
|
10
|
Wang X, Zhang W, Sun X, Lin Y and Chen W:
Cancer-associated fibroblasts induce epithelial-mesenchymal
transition through secreted cytokines in endometrial cancer cells.
Oncol Lett. 15:5694–5702. 2018.PubMed/NCBI
|
|
11
|
Shinagawa K, Kitadai Y, Tanaka M, Sumida
T, Kodama M, Higashi Y, Tanaka S, Yasui W and Chayama K:
Mesenchymal stem cells enhance growth and metastasis of colon
cancer. Int J Cancer. 127:2323–2333. 2010. View Article : Google Scholar : PubMed/NCBI
|
|
12
|
Takigawa H, Kitadai Y, Shinagawa K, Yuge
R, Higashi Y, Tanaka S, Yasui W and Chayama K: Mesenchymal stem
cells induce epithelial to mesenchymal transition in colon cancer
cells through direct cell-to-cell contact. Neoplasia. 19:429–438.
2017. View Article : Google Scholar : PubMed/NCBI
|
|
13
|
Nieto MA: Epithelial plasticity: A common
theme in embryonic and cancer cells. Science. 342:12348502013.
View Article : Google Scholar : PubMed/NCBI
|
|
14
|
Bradshaw AD and Sage EH: SPARC, a
matricellular protein that functions in cellular differentiation
and tissue response to injury. J Clin Investig. 107:1049–1054.
2001. View Article : Google Scholar : PubMed/NCBI
|
|
15
|
Schultz C, Lemke N, Ge S, Golembieski WA
and Rempel SA: Secreted protein acidic and rich in cysteine
promotes glioma invasion and delays tumor growth in vivo. Cancer
Res. 62:6270–6277. 2002.PubMed/NCBI
|
|
16
|
Massi D, Franchi A, Borgognoni L, Reali UM
and Santucci M: Osteonectin expression correlates with clinical
outcome in thin cutaneous malignant melanomas. Hum Pathol.
30:339–344. 1999. View Article : Google Scholar : PubMed/NCBI
|
|
17
|
Yamanaka M, Kanda K, Li NC, Fukumori T,
Oka N, Kanayama HO and Kagawa S: Analysis of the gene expression of
SPARC and its prognostic value for bladder cancer. J Urol.
166:2495–2499. 2001. View Article : Google Scholar : PubMed/NCBI
|
|
18
|
Yang E, Kang HJ, Koh KH, Rhee H, Kim NK
and Kim H: Frequent inactivation of SPARC by promoter
hypermethylation in colon cancers. Int J Cancer. 121:567–575. 2007.
View Article : Google Scholar : PubMed/NCBI
|
|
19
|
Cheetham S, Tang MJ, Mesak F, Kennecke H,
Owen D and Tai IT: SPARC promoter hypermethylation in colorectal
cancers can be reversed by 5-Aza-2′ deoxycytidine to increase SPARC
expression and improve therapy response. Br J Cancer. 98:1810–1819.
2008. View Article : Google Scholar : PubMed/NCBI
|
|
20
|
Ministry of Education, Culture, Sports,
Science and Technology, Ministry of Health, Labour and Welfare,
Ministry of Economy, Trade and Industry, . Ethics Guidelines for
Human Genome/Gene Analysis Research. https://www.lifescience.mext.go.jp/files/pdf/40_213.pdf
|
|
21
|
Morikawa K, Walker SM, Nakajima M, Pathak
S, Jessup JM and Fidler IJ: Influence of organ environment on the
growth, selection, and metastasis of human colon carcinoma cells in
nude mice. Cancer Res. 48:6863–6871. 1988.PubMed/NCBI
|
|
22
|
Santa María L, Rojas CV and Minguell JJ:
Signals from damaged but not undamaged skeletal muscle induce
myogenic differentiation of rat bone-marrow-derived mesenchymal
stem cells. Exp Cell Res. 300:418–426. 2004. View Article : Google Scholar
|
|
23
|
Ishii M, Koike C, Igarashi A, Yamanaka K,
Pan H, Higashi Y, Kawaguchi H, Sugiyama M, Kamata N, Iwata T, et
al: Molecular markers distinguish bone marrow mesenchymal stem
cells from fibroblasts. Biochem Biophys Res Commun. 332:297–303.
2005. View Article : Google Scholar : PubMed/NCBI
|
|
24
|
Tsutsumi S, Shimazu A, Miyazaki K, Pan H,
Koike C, Yoshida E, Takagishi K and Kato Y: Retention of
multilineage differentiation potential of mesenchymal cells during
proliferation in response to FGF. Biochem Biophys Res Commun.
288:413–419. 2001. View Article : Google Scholar : PubMed/NCBI
|
|
25
|
Livak KJ and Schmittgen TD: Analysis of
relative gene expression data using real-time quantitative PCR and
the 2(-Delta Delta C(T)) method. Methods. 25:402–408. 2001.
View Article : Google Scholar : PubMed/NCBI
|
|
26
|
Shinagawa K, Kitadai Y, Tanaka M, Sumida
T, Onoyama M, Ohnishi M, Ohara E, Higashi Y, Tanaka S, Yasui W and
Chayama K: Stroma-directed imatinib therapy impairs the
tumor-promoting effect of bone marrow-derived mesenchymal stem
cells in an orthotopic transplantation model of colon cancer. Int J
Cancer. 132:813–823. 2013. View Article : Google Scholar : PubMed/NCBI
|
|
27
|
Kawai S, Takagi Y, Kaneko S and Kurosawa
T: Effect of three types of mixed anesthetic agents alternate to
ketamine in mice. Exp Anim. 60:481–487. 2011. View Article : Google Scholar : PubMed/NCBI
|
|
28
|
Chin D, Boyle GM, Williams RM, Ferguson K,
Pandeya N, Pedley J, Campbell CM, Theile DR, Parsons PG and Coman
WB: Novel markers for poor prognosis in head and neck cancer. Int J
Cancer. 113:789–797. 2005. View Article : Google Scholar : PubMed/NCBI
|
|
29
|
Han W, Cao F, Chen MB, Lu RZ, Wang HB, Yu
M, Shi CT and Ding HZ: Prognostic value of SPARC in patients with
pancreatic cancer: A systematic review and meta-analysis. PLoS One.
11:e01458032016. View Article : Google Scholar : PubMed/NCBI
|
|
30
|
Gu C, Wang X, Long T, Wang X, Zhong Y, Ma
Y, Hu Z and Li Z: FSTL1 interacts with VIM and promotes colorectal
cancer metastasis via activating the focal adhesion signalling
pathway. Cell Death Dis. 9:6542018. View Article : Google Scholar : PubMed/NCBI
|
|
31
|
Sipos B, Hahn D, Carceller A, Piulats J,
Hedderich J, Kalthoff H, Goodman SL, Kosmahl M and Klöppel G:
Immunohistochemical screening for beta6-integrin subunit expression
in adenocarcinomas using a novel monoclonal antibody reveals strong
up-regulation in pancreatic ductal adenocarcinomas in vivo and in
vitro. Histopathology. 45:226–236. 2004. View Article : Google Scholar : PubMed/NCBI
|
|
32
|
Kim D, Langmead B and Salzberg SL: HISAT:
A fast spliced aligner with low memory requirements. Nat Methods.
12:357–360. 2015. View Article : Google Scholar : PubMed/NCBI
|
|
33
|
Langmead B and Salzberg SL: Fast
gapped-read alignment with Bowtie 2. Nat Methods. 9:357–359. 2012.
View Article : Google Scholar : PubMed/NCBI
|
|
34
|
Li B and Dewey CN: RSEM: Accurate
transcript quantification from RNA-Seq data with or without a
reference genome. BMC Bioinformatics. 12:3232011. View Article : Google Scholar : PubMed/NCBI
|
|
35
|
McKenna A, Hanna M, Banks E, Sivachenko A,
Cibulskis K, Kernytsky A, Garimella K, Altshuler D, Gabriel S, Daly
M and DePristo MA: The genome analysis toolkit: A MapReduce
framework for analyzing next-generation DNA sequencing data. Genome
Res. 20:1297–1303. 2010. View Article : Google Scholar : PubMed/NCBI
|
|
36
|
Shen S, Park JW, Lu ZX, Lin L, Henry MD,
Wu YN, Zhou Q and Xing Y: rMATS: Robust and flexible detection of
differential alternative splicing from replicate RNA-Seq data. Proc
Natl Acad Sci USA. 111:E5593–E5601. 2014. View Article : Google Scholar : PubMed/NCBI
|
|
37
|
Subramanian A, Tamayo P, Mootha VK,
Mukherjee S, Ebert BL, Gillette MA, Paulovich A, Pomeroy SL, Golub
TR, Lander ES and Mesirov JP: Gene set enrichment analysis: A
knowledge-based approach for interpreting genome-wide expression
profiles. Proc Natl Acad Sci USA. 102:15545–15550. 2005. View Article : Google Scholar : PubMed/NCBI
|
|
38
|
Kim JY, Jeong D, Ahn TS, Kim HJ, Park DS,
Park SY, Bae SB, Lee S, Lee SS, Lee MS, et al: Expression of
secreted protein acidic and rich in cysteine in the stroma of a
colorectal carcinoma is associated with patient prognosis. Ann
Coloproctol. 29:93–99. 2013. View Article : Google Scholar : PubMed/NCBI
|
|
39
|
Wang CS, Lin KH, Chen SL, Chan YF and
Hsueh S: Overexpression of SPARC gene in human gastric carcinoma
and its clinic-pathologic significance. Br J Cancer. 91:1924–1930.
2004. View Article : Google Scholar : PubMed/NCBI
|
|
40
|
Guweidhi A, Kleeff J, Adwan H, Giese NA,
Wente MN, Giese T, Büchler MW, Berger MR and Friess H: Osteonectin
influences growth and invasion of pancreatic cancer cells. Ann
Surg. 242:224–234. 2005. View Article : Google Scholar : PubMed/NCBI
|
|
41
|
Porte H, Chastre E, Prevot S, Nordlinger
B, Empereur S, Basset P, Chambon P and Gespach C: Neoplastic
progression of human colorectal cancer is associated with
overexpression of the stromelysin-3 and BM-40/SPARC genes. Int J
Cancer. 64:70–75. 1995. View Article : Google Scholar : PubMed/NCBI
|
|
42
|
Liang JF, Wang HK, Xiao H, Li N, Cheng CX,
Zhao YZ, Ma YB, Gao JZ, Bai RB and Zheng HX: Relationship and
prognostic significance of SPARC and VEGF protein expression in
colon cancer. J Exp Clin Cancer Res. 29:712010. View Article : Google Scholar : PubMed/NCBI
|
|
43
|
Yan Q and Sage EH: SPARC, a matricellular
glycoprotein with important biological functions. J Histochem
Cytochem. 47:1495–1506. 1999. View Article : Google Scholar : PubMed/NCBI
|
|
44
|
Feng J and Tang L: SPARC in tumor
pathophysiology and as a potential therapeutic target. Curr Pharm
Des. 20:6182–6190. 2014. View Article : Google Scholar : PubMed/NCBI
|
|
45
|
Sharma S, Xing F, Liu Y, Wu K, Said N,
Pochampally R, Shiozawa Y, Lin HK, Balaji KC and Watabe K: Secreted
protein acidic and rich in cysteine (SPARC) mediates metastatic
dormancy of prostate cancer in bone. J Biol Chem. 291:19351–19363.
2016. View Article : Google Scholar : PubMed/NCBI
|
|
46
|
Ordonez JL, Paraoan L, Hiscott P, Gray D,
García-Fiñana M, Grierson I and Damato B: Differential expression
of angioregulatory matricellular proteins in posterior uveal
melanoma. Melanoma Res. 15:495–502. 2005. View Article : Google Scholar : PubMed/NCBI
|
|
47
|
Takigawa H, Kitadai Y, Shinagawa K, Yuge
R, Higashi Y, Tanaka S, Yasui W and Chayama K: Multikinase
inhibitor regorafenib inhibits the growth and metastasis of colon
cancer with abundant stroma. Cancer Sci. 107:601–608. 2016.
View Article : Google Scholar : PubMed/NCBI
|
|
48
|
Boneschansker L, Nakayama H, Eisenga M,
Wedel J, Klagsbrun M, Irimia D and Briscoe DM: Netrin-1 Augments
chemokinesis in CD4+ T cells in vitro and elicits a
proinflammatory response in vivo. J Immunol. 197:1389–1398. 2016.
View Article : Google Scholar : PubMed/NCBI
|
|
49
|
Sun W, Feng J, Yi Q, Xu X, Chen Y and Tang
L: SPARC acts as a mediator of TGF-β1 in promoting
epithelial-to-mesenchymal transition in A549 and H1299 lung cancer
cells. Biofactors. 44:453–464. 2018. View Article : Google Scholar : PubMed/NCBI
|
|
50
|
Fenouille N, Tichet M, Dufies M, Pottier
A, Mogha A, Soo JK, Rocchi S, Mallavialle A, Galibert MD, Khammari
A, et al: The epithelial-mesenchymal transition (EMT) regulatory
factor SLUG (SNAI2) is a downstream target of SPARC and AKT in
promoting melanoma cell invasion. PLoS One. 7:e403782012.
View Article : Google Scholar : PubMed/NCBI
|
|
51
|
Chen J, Ji T, Wu D, Jiang S, Zhao J, Lin H
and Cai X: Human mesenchymal stem cells promote tumor growth via
MAPK pathway and metastasis by epithelial mesenchymal transition
and integrin alpha5 in hepatocellular carcinoma. Cell Death Dis.
10:4252019. View Article : Google Scholar : PubMed/NCBI
|
|
52
|
Chen L, Guo P, He Y, Chen Z, Chen L, Luo
Y, Qi L, Liu Y, Wu Q, Cui Y, et al: HCC-derived exosomes elicit HCC
progression and recurrence by epithelial-mesenchymal transition
through MAPK/ERK signalling pathway. Cell Death Dis. 9:5132018.
View Article : Google Scholar : PubMed/NCBI
|