Introduction
With more than 2 million new cases and 1.8 million
deaths every year, lung cancer is one of the most frequently
diagnosed neoplasms and the leading cause of cancer-related
mortality worldwide (1).
Unfortunately, despite the development of new forms of treatment,
over half of lung cancer patients die within one year of the
diagnosis, and the 5-year survival rates do not exceed 18%
(2). The predominant lung cancer
subtype is non-small cell lung cancer (NSCLC), which accounts for
over 80% of cases (3). NSCLCs are
highly heterogeneous and have diverse pathological features, thus
further histological subtypes are usually distinguished. The most
common ones are adenocarcinoma (AC) and squamous cell carcinoma
(LSCC) (3).
It is estimated that 90% of NSCLC-related deaths are
caused not by the primary tumour itself, but by its metastases to
distant organs (4). For lung cancers,
the preferable sites for metastasis are the bones, the lungs, the
brain, the adrenal glands and the liver, but the exact patterns of
metastatic spread are highly dependent on the histological and
molecular subtype of the tumour (5–7).
Nevertheless, the presence of distant metastases is an unequivocal
hallmark of poor prognosis; for patients with localized NSCLC
tumours, the 5-year relative survival rate is approximately 60%,
while for disseminated cancers, it decreases 10-fold to only 6%
(data from the USA) (8).
The metastasis mechanism, although very complex and
not fully understood yet, is commonly thought to rely on two main
processes: The epithelial-to-mesenchymal and the
mesenchymal-to-epithelial transitions (EMT and MET, respectively).
The activation of EMT-promoting traits supports tumour cell
invasion and dissemination, while the reverse process, MET, is
believed to promote metastatic outgrowth once cancer cells have
extravasated and invaded the distant organs (9). During EMT, epithelial cells lose their
apical-basal polarity, cell-to-cell junctions and interactions, and
contact with the basal membrane (9–12). They
significantly change their morphology and become elongated and
spindle-shaped, slowly gaining migration and invasion abilities
(9–12). The expression of key epithelial
markers such as E-cadherin or cell junction proteins gradually
decreases and the cells start to express proteins typical for the
mesenchymal phenotype: N-cadherin, vimentin, and matrix
metalloproteinases (MMPs) (9–11). Physiologically, EMT has been shown to
be essential for embryonic development, organogenesis, and tissue
repair (12). However, in
pathological conditions, as a result of EMT, cancer cells can
acquire key metastatic features, including enhanced mobility,
invasion ability, and resistance to apoptosis, enabling them to
infiltrate the surrounding stroma and to spread through the blood
and lymphatic vessels to distant sites (9). In epithelial tumours, EMT is usually
chaotic and incomplete, and there are coexisting cells in numerous
intermediate states, presenting features of both epithelial and
mesenchymal phenotypes (13,14). EMT has long been defined by the loss
of the expression of the epithelial marker E-cadherin and the
acquisition of the expression of mesenchymal markers vimentin
and/or N-cadherin (15). Nowadays, it
is known that in cancer cells, EMT is not a binary process, and
both epithelial and mesenchymal markers are often co-expressed
(15).
The transition from epithelial to mesenchymal
phenotype is orchestrated by numerous transcription factors, the
most important of which are SNAIL, SLUG, ZEB1, ZEB2, and Twist1
proteins (9–11). Additionally, it is also regulated
epigenetically and at a post-transcriptional level by a variety of
different factors, including chromatin modifying enzymes, miRNAs,
and long non-coding RNAs (11).
Although the relationship between the loss of E-cadherin expression
and the increased invasiveness of cancer cells was described for
the first time about 30 years ago (16) and the link between EMT and cancer
metastasis has been known for almost 20 years (17), the exact molecular pathways associated
with EMT in lung cancers and their clinical implications have not
yet been fully studied. It has been demonstrated that cigarette
smoking, which is considered to be a direct cause of 85–90% of lung
cancer cases, can clearly contribute to EMT by decreasing
E-cadherin expression (18). It has
also been shown that smoking increases the activity of SNAIL and
Twist1 in the basal cells of the respiratory epithelium (19). The importance of EMT in NSCLC goes far
beyond increasing the metastatic potential and invasiveness of
tumour cells. The shift towards a mesenchymal phenotype in these
tumours has been linked to the acquired resistance to epidermal
growth factor receptor (EGFR) inhibitors, which are the first-line
treatment for NSCLC patients harbouring activating EGFR mutations
(20–22). Interestingly, treatment with EGFR
inhibitors was also revealed to be one of the EMT-promoting factors
(23). Moreover, as in the case of
other cancers, in lung carcinomas, EMT was found to be a strong
factor contributing to chemoresistance and radioresistance
(24–27). Therefore, it becomes especially
important to identify and investigate additional factors that might
potentially contribute to EMT in NSCLC.
During the past decade, SATB1 (special AT-rich
binding protein 1) has received much attention as a factor
promoting tumour invasion and metastasis. SATB1 is a nuclear matrix
protein that mediates chromatin looping and plays the role of a
global transcriptional regulator (28,29). It
binds to base-unpairing regions (BURs), the specific AT-rich motifs
of double-stranded DNA that may be found every 40,000 DNA base
pairs (28–30). The binding of SATB1 to BURs provides a
nuclear platform necessary for the binding of further transcription
factors and chromatin-modifying enzymes, regulates epigenomic
modifications and maintains proper nucleosome positioning (30). It binds to distinct genomic regions
depending on the cell type. Therefore, it has the ability to
regulate whole sets of genes in a tissue-specific manner (28,29,31). SATB1
interactions with transcription activators and repressors are
determined by post-transcriptional modifications such as
phosphorylation or acetylation (32,33). SATB1
can also be regulated by numerous microRNAs (34–40).
Physiologically, SATB1 is expressed in embryonic
stem cells and in many adult progenitor cells, for example
ameloblasts and osteoblasts (30,41,42). It is
essential for embryonic development, and it takes part in processes
that require rapid changes in the cell phenotype, such as the
differentiation and maturation of thymocytes or skin epithelial
cells (28,30). Besides its normal physiological
function, SATB1 was also found to be overexpressed in numerous
malignancies, including breast, colorectal, prostate, liver,
bladder, and ovarian cancers (43–49). In
these tumours, a high SATB1 level was clearly associated with an
aggressive phenotype, the presence of metastasis and a poor patient
prognosis (43–49).
In most of the abovementioned cancers, a high SATB1
level was also shown to influence the EMT process and to impact the
expression of EMT-related proteins. In breast cancer cells, SATB1
was found to promote the mesenchymal phenotype by upregulating
vimentin and N-cadherin, as well as downregulating the key
epidermal markers claudin-1, β-catenin, and E-cadherin (43). It also stimulated the expression of
the most crucial EMT-associated transcription factors: SNAIL and
Twist1 (50). It was shown to play a
role in the induction of chemotherapy-related EMT (36), and to increase the number of breast
cancer stem cells (BCSCs) within the tumours (50). Moreover, SATB1 depletion in
MDA-MB-231, a highly aggressive and tumorigenic breast cancer cell
line, was demonstrated to reverse the EMT process and to
significantly change the phenotype of the cells, restoring their
polarization and acinar-like morphology (43). In colorectal tumours, SATB1 expression
was found to be positively correlated with the expression of
vimentin, and negatively with the expression of the epithelial
proteins E-cadherin and CK20 (51).
SATB1 knockdown in colorectal cancer cell lines was shown to affect
the expression of EMT-related proteins, including E-cadherin,
N-cadherin, SLUG, and Twist1 (52).
Links between SATB1 expression and the EMT process were also
observed in prostate cancer. The studies on the loss-of-function
models revealed that SATB1 expression was required to maintain the
invasive phenotype of prostate cancer cells, and that its knockdown
significantly inhibited cell growth, proliferation, and invasion
rates (45,53–55).
Moreover, its silencing was shown to increase E-cadherin
expression, and to restore the anchorage-dependent growth of the
cells together with their polarized morphology (45,55). SATB1
associations with the EMT process have been revealed in liver
cancer as well, where SATB1 was shown to influence the expression
of more than 100 genes related to tumour progression and
metastasis, including genes coding for EMT-related proteins such as
SNAIL, SLUG, Twist1, vimentin, and E-cadherin (46). Finally, the downregulation of
E-cadherin and the upregulation of SNAIL, SLUG, and vimentin as a
result of SATB1 overexpression were also observed in bladder cancer
cells (56).
Although numerous studies have revealed that SATB1
may have a significant impact on cancer progression, metastasis,
and the EMT process, its role in NSCLC remains ambiguous and not
fully understood. It is known that SATB1 is necessary for proper
lung development during embryogenesis, and that its depletion in
mice is lethal (57). It has also
been observed that the SATB1 level is elevated in human respiratory
epithelial cells (58,59), whereas in the lung alveoli its
expression is rather low (59–61). To
date, the most comprehensive study concerning the role of SABT1 in
NSCLC was published in 2011 by Selinger et al, who were the
first to discover that SATB1 expression is associated with lung
squamous cell carcinoma (LSCC) tumour histology and a poor degree
of histological differentiation in the whole NSCLC study cohort
(58). Surprisingly, they also
observed that the loss of SATB1 expression was a negative
prognostic factor for LSCC patients (58). In 2016, Huang et al assessed
SATB1 expression in adenocarcinoma (AC) samples only, and they
confirmed that an elevated SATB1 level was related to a higher
tumour grade (60). In our recent
study, we decided to analyse SATB1 expression in particular NSCLC
subtypes separately (59). We found
the SATB1 level to be significantly higher in LSCCs in comparison
to AC specimens (59), confirming
previous findings made by Selinger et al (58). Moreover, while in ACs the expression
of SATB1 was associated with a poor degree of histological
differentiation, in LSCCs the level of SATB1 was increased in well
differentiated tumours (59). We also
observed the negative impact of a decreased SATB1 expression on
NSCLC patient survival (59).
However, the results were statistically significant only for the
whole study cohort, and no association was noted between SATB1
expression and the survival of AC patients (59). For LSCC, the results were on the verge
of statistical significance (59).
These results suggest that in NSCLC, the function of SATB1 may be
highly dependent on the exact tumour histology.
There are no reports available on the possible
impact of SATB1 expression on the EMT process in NSCLC. Therefore,
the aim of this study was to analyse the possible correlations
between the expression of SATB1 and major EMT-associated proteins
(E-cadherin, N-cadherin, SNAIL, SLUG, and Twist1) in NSCLC clinical
samples. Additionally, we also investigated the impact of
transforming growth factor (TGF-β1) exposure, which is commonly
used to induce EMT in vitro, on SATB1 mRNA expression
in AC and LSCC cell lines.
Materials and methods
Patient cohort
The present study was approved by the Bioethics
Commission at the Wroclaw Medical University in Poland (approval
no. KB-632/2017). A total of 262 NSCLC and adjacent non-malignant
lung tissue (NMLT) samples were collected from patients treated at
the Lower Silesian Centre of Lung Diseases in Wroclaw during the
years 2007–2016. The study group consisted of 150 adenocarcinomas
(AC), 92 squamous cell carcinomas (LSCC), and 20 non-malignant lung
tissue (NMLT) samples. For each sample, formalin-fixed
paraffin-embedded (FFPE) tissue blocks were prepared. The
histological type of the tumours was assessed using the World
Health Organization Classification (3) by two independent pathologists, and was
additionally confirmed by immunohistochemical staining for the
marker proteins TTF-1 (AC marker) and p63 (LSCC marker). The pTNM
classification was made according to the recommendations of the
International Association for the Study of Lung Cancer (IASLC)
(62). The clinical, pathological,
and survival data were obtained from the hospital archives and are
listed in Table I.
 | Table I.Clinicopathological data of the NSCLC
patients. |
Table I.
Clinicopathological data of the NSCLC
patients.
| Parameters | All cases (N=242) n
(%) | AC (N=150) n
(%) | LSCC (N=92) n
(%) |
|---|
| Sex |
|
|
|
|
Male | 146 (60.3) | 85 (56.7) | 61 (66.3) |
|
Female | 96
(39.7) | 65 (43.3) | 31 (33.7) |
| Age |
|
|
|
|
Mean | 66.22±7.65 | 65.87±8.14 | 66.81±6.77 |
|
Range | 44-84 | 44-84 | 44-82 |
| Malignancy
grade |
|
|
|
| G1 | 3
(1.2) | 3
(2.0) | 0
(0.0) |
| G2 | 152 (62.8) | 73 (48.7) | 79 (85.9) |
| G3 | 87
(36.0) | 74 (49.3) | 13 (14.1) |
| Tumour size |
|
|
|
|
pT1 | 76
(31.4) | 56 (37.3) | 20 (21.7) |
|
pT2 | 124 (51.2) | 66 (44.0) | 58 (63.0) |
|
pT3 | 23
(9.5) | 11 (7.3) | 12 (13.0) |
|
pT4 | 5
(2.1) | 4
(2.7) | 1
(1.1) |
| No
data | 14
(5.8) | 13 (8.7) | 1
(1.1) |
| Lymph nodes |
|
|
|
|
pN0 | 147 (60.7) | 83 (55.3) | 64 (69.6) |
|
pN1 | 40 (16.5) | 23 (15.3) | 17 (18.5) |
|
pN2 | 41 (16.9) | 31 (20.7) | 10 (10.9) |
| No
data | 14 (5.8) | 13 (8.7) | 1
(1.1) |
| Stage |
|
|
|
| I | 104 (43.0) | 64 (42.7) | 40 (43.5) |
| II | 77
(31.8) | 37 (24.7) | 40 (43.5) |
|
III | 45
(18.6) | 34 (22.7) | 11 (12.0) |
| IV | 2
(0.83) | 2
(1.3) | 0
(0.0) |
| No
data | 14
(5.8) | 13 (8.7) | 1
(1.1) |
| Overall
survival |
|
|
|
|
Deceased | 95
(39.3) | 63 (42.0) | 32 (34.8) |
|
Alive | 146 (60.3) | 86 (57.3) | 60 (65.2) |
| No
data | 1
(0.41) | 1
(0.67) | 0
(0.0) |
Cell lines
The NCI-H1703 (LSCC) and A549 (AC) cell lines were
obtained from the American Type Culture Collection (ATCC). The cell
culture media used were RPMI-1640 (for the NCI-H1703 cell line) and
F12K (for the A549 cell line). All of the media were additionally
supplemented with L-glutamine up to a final concentration of 2 mM,
and with fetal bovine serum, up to a final concentration of 10%.
All of the cell culture media and reagents were purchased from
Sigma-Aldrich; Merck KGaA. Cell culture conditions were as follows:
Temperature 37°C and 5% CO2 concentration.
Tissue microarrays (TMAs)
Tissue microarrays (TMAs) were created using the TMA
Grand Master (3DHistech) automatic tissue microarrayer. From each
FFPE tissue block, standard 4-µm-thick paraffin sections were cut
and hematoxylin and eosin (H&E) stained. Then, the prepared
slides were scanned with a Pannoramic MIDI II (3DHistech)
histological scanner. Representative spots for the TMAs (three
spots with 1.5 mm diameter from each FFPE block) were selected by a
qualified pathologist from the digital slides with the use of the
Case Viewer (3DHistech) software. Finally, TMAs were created using
the TMA Grand Master system, according to the manufacturer's
instructions.
Immunohistochemistry (IHC)
Immunohistochemical reactions were performed on
4-µm-thick paraffin sections using DAKO Autostainer Link48 (Dako;
Agilent Technologies, Inc.). First, deparaffinization, rehydration,
and antigen retrieval were performed using EnVision FLEX Target
Retrieval Solution (pH 9.0, 20 min, 97°C) in PTLink (Dako; Agilent
Technologies, Inc.). In order to block the activity of endogenous
peroxidase, the sections were incubated in EnVision FLEX
Peroxidase-Blocking Reagent (5 min at room temperature).
Afterwards, primary antibodies directed against E-cadherin (RTU;
cat. no. IR059; Dako; Agilent Technologies, Inc.), N-cadherin
(1:50; cat. no. M3613; Dako; Agilent Technologies, Inc.), SNAIL
(1:400; cat. no. 13099-1-AP; ProteinTech), SLUG (1:50, cat. no.
166476; SantaCruz Biotechnology, Inc.), and Twist1 (1:500; cat. no.
ab50581; Abcam) were applied for 20 min at room temperature. Then,
the slides were incubated with EnVision FLEX/HRP (20 min). Next,
3,3′-diaminobenzidine (DAB, Dako; Agilent Technologies, Inc.) was
utilized as the peroxidase substrate, and the sections were
incubated for 10 min at room temperature. Additionally, all the
sections were counterstained with FLEX Hematoxylin for 5 min at
room temperature. After dehydration in graded ethanol
concentrations (70%, 96%, absolute) and in xylene, the slides were
mounted in Dako Mounting Medium using Coverslipper (Dako; Agilent
Technologies, Inc.). The primary antibodies were diluted in FLEX
Antibody Diluent.
Evaluation of IHC reactions
IHC slides were scanned with the Pannoramic MIDI II
(3DHistech) histological scanner and evaluated using the
QuantCenter (3DHistech) digital image analysis software. The cells
of interest (cancer cells or normal lung alveolar cells) were
distinguished from the other cellular components using the
PatternQuant (3DHistech) software module. Then, the CellQuant
(3DHistech) module was used to determine the percentage of positive
cells and the intensity of the reaction among the selected tissue
compartments only. The expression levels of SATB1 and the Ki-67
proliferative index were evaluated as previously described
(59). The membranous expression of
E-cadherin and N-cadherin was assessed using a scale ranging from 0
to 3, based on the percentage of positive cells and the intensity
of the staining (Table II).
| Table II.Scoring system used for the
evaluation of membranous staining. |
Table II.
Scoring system used for the
evaluation of membranous staining.
| Score | Percentage of
positive cells and intensity of staining |
|---|
| 0 | No staining is
observed or staining is observed in <10% of the tumour
cells |
| 1 | A faint membrane
staining is observed in >10% of the tumour cells |
| 2 | A weak or moderate,
complete membrane staining is observed in >10% of the tumour
cells |
| 3 | A strong, complete
membrane staining is observed in >10% of the tumour cells |
SNAIL, SLUG, and Twist1 protein expression levels
were assessed using the Allred scale. This scoring system is
calculated by adding a number representing the proportion of
positive cells (0–5) to a number reflecting the intensity of the
staining (0–3) (63). The final score
value ranges from 0 to 8, where 0 indicates no positive cells, and
8 indicates more than 66% of highly positive cells (Table III). The Allred scale can be used to
evaluate both nuclear and cytoplasmic stainings.
| Table III.Allred scoring system (63). |
Table III.
Allred scoring system (63).
| A | Percentage of
positive cells | B | Intensity of
staining |
|---|
| 0 | No positive
cells | 0 | No detectable
staining |
| 1 | <1% | 1 | Weak staining |
| 2 | 1-10% | 2 | Moderate
staining |
| 3 | 10-33% | 3 | Strong
staining |
| 4 | 33-66% |
|
|
| 5 | >66% |
|
|
In vitro EMT induction
To induce EMT in cell culture conditions, A549
(1×10⁵/well) and NCI-H1703 (2×10⁵/well) cells
were seeded in 6-well plates and maintained for 24 h in complete
culture medium (F12K and RPMI-1640, respectively), supplemented
with 5% FBS. Further, the medium was replaced with a fresh one, and
the cells were treated with 5 ng/ml TGF-β1 (Merck KGaA) and
cultured for the next 72 h. Every 24 h, cell lysates were prepared
and subjected to further analysis. Additionally, the cells were
examined under a light microscope to track the morphological
changes.
RNA isolation and cDNA synthesis
Total RNA from the NCI-H1703 and A549 cell lines was
isolated using the GeneMATRIX® Universal RNA/miRNA
Purification Kit (EURx, Gdansk, Poland), according to the
manufacturer's handbook. For each sample, 500 ng of total RNA was
transcribed into cDNA using the iScript™ Reverse Transcription
Supermix for RT-qPCR (Bio-Rad, Laboratories, Inc.) and the C1000
Touch Thermal Cycler (Bio-Rad, Laboratories, Inc.). The reaction
conditions were as follows: Priming for 5 min at 25°C, reverse
transcription for 20 min at 46°C, and final inactivation of reverse
transcriptase for 1 min at 95°C.
Real-time PCR
The real-time PCR method was used to determine the
relative levels of CDH1, CDH2, SNAI1, SNAI2, and
Twist1 mRNA expression in the NCI-H1703 and A549 cell lines
before and after EMT induction. The reactions were performed using
the 7900 Real Time PCR System (Applied Biosystems; Thermo Fisher
Scientific, Inc.) and the iTaq™ Universal Probes Supermix (Bio-Rad,
Laboratories, Inc.), according to the manufacturer's instructions.
The TaqMan probes used are listed in Table IV. SDHA an endogenous control
gene, was further used for normalisation purposes. The reactions
were carried out in triplicates under the following conditions:
Initial denaturation at 94°C for 2 min, followed by 45 cycles of
denaturation (94°C, 15 sec), and annealing with elongation (60°C, 1
min). The relative mRNA expression levels were calculated using the
ΔΔCt method.
| Table IV.TaqMan probes used in the
experiment. |
Table IV.
TaqMan probes used in the
experiment.
| Protein name | Gene symbol | TaqMan probe |
|---|
| E-cadherin | CDH1 | Hs01023894_m1 |
| N-cadherin | CDH2 | Hs00983056_m1 |
| SNAIL | SNAI1 | Hs00195591_m1 |
| SLUG | SNAI2 | Hs00950344_m1 |
| Twist1 | Twist1 | Hs01675818_s1 |
| SDHA | SDHA | Hs99999903_m1 |
Droplet digital PCR
The droplet digital PCR method was used to determine
the absolute number of SATB1 mRNA copies in the analysed
cell lines before and after EMT induction. The reaction mixture
contained 3.33 µl of the RT product, 1 µl of the
SATB1-specific TaqMan probe Hs00962580_m1 (Thermo Fisher
Scientific, Inc.), 5.67 µl of the molecular biology-grade water,
and 10 µl of the ddPCR™ Supermix for Probes (Bio-Rad Laboratories,
Inc.). A total of 20 µl of the reaction mixture was loaded onto a
plastic cartridge with 70 µl of the Droplet Generation Oil for
Probes (Bio-Rad Laboratories, Inc.) and inserted into the QX200
Droplet Generator (Bio-Rad Laboratories, Inc.). The droplets
obtained from each sample were then transferred to a 96-well PCR
plate (Eppendorf). PCR amplifications were carried out in the C1000
Touch Thermal Cycler (Bio-Rad Laboratories, Inc.) under the
following conditions: Enzyme activation at 95°C for 10 min,
followed by 40 cycles of denaturation (94°C, 30 sec),
annealing/extension (60°C, 1 min), and a final enzyme deactivation
at 98°C for 10 min. Finally, the plate was loaded onto the QX200
Droplet Reader (Bio-Rad Laboratories, Inc.) and read automatically.
The quantification of the SATB1 mRNA is presented as the
total number of copies in the reaction mixture.
Statistical analysis of the
results
All the experiments, except for the IHC stainings,
were performed at least in triplicates. The results were analysed
with the use of Prism 8.0 software (GraphPad Software) and
Statistica 13 (StatSoft, Krakow, Poland) statistical software. The
Shapiro-Wilk test was utilized to determine if the sample data were
normally distributed. To compare the groups of data, a
non-parametric Mann-Whitney U test or a parametric Student's test
was used. The correlations between the analysed parameters were
checked using the Spearman's rank correlation test. The survival
times were determined by using the Kaplan-Meier method, and the
significance of differences was determined by a log-rank test. All
the results were considered statistically significant when
P<0.05.
Results
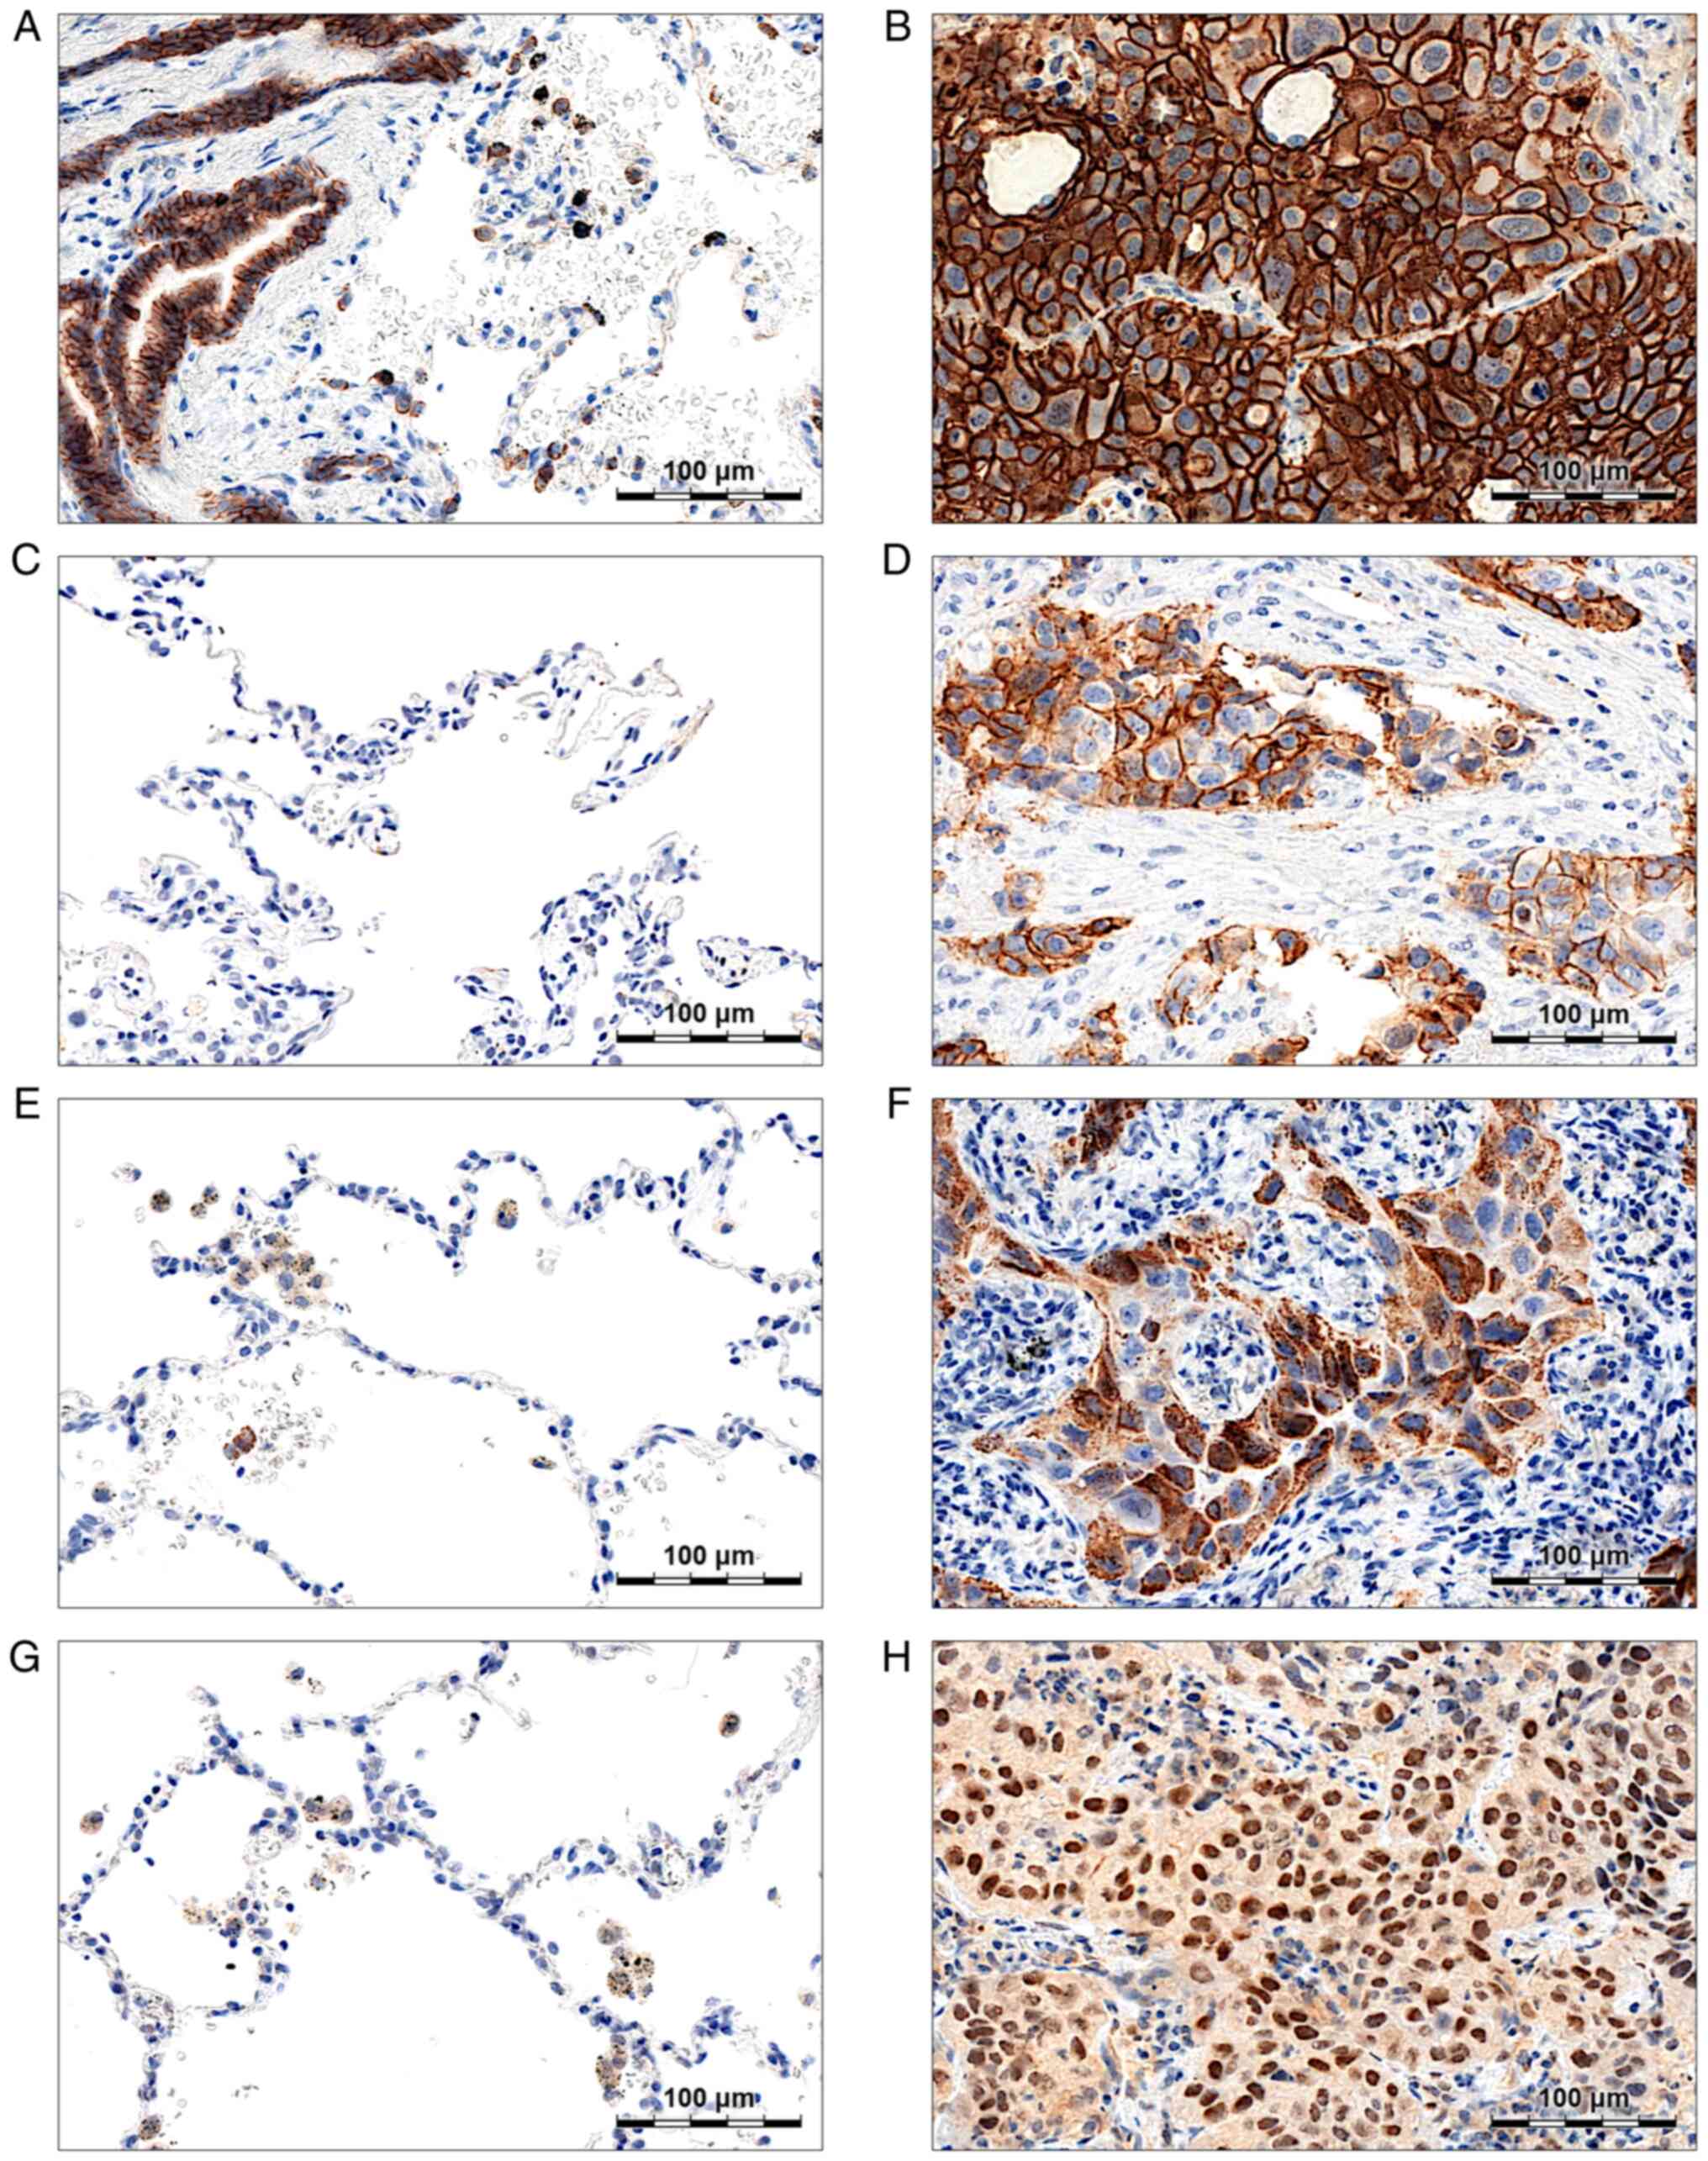
E-cadherin is significantly
overexpressed in NSCLC compared to NMLT samples
Membranous E-cadherin expression was observed both
in cancer cells (Fig. 1B) and
non-malignant lung tissues-respiratory epithelial cells (Fig. 1A) and pneumocytes (Fig. 1A). Strong or moderate (score ≥2)
E-cadherin staining was present in 99.17% of the analysed NSCLC
cases, and the mean score values were significantly higher in NSCLC
compared to the NMLT samples (2.96±0.24 vs. 1.10±0.64;
P<0.0001). No significant correlations between the expression of
E-cadherin and the patient clinicopathological data were noted
(Table SI).
N-cadherin level is related to the
stage of the disease, and is correlated negatively with tumour
grade
N-cadherin expression (score ≥1) was observed in the
membranes of cancer cells in 7.85% of the analysed NSCLC cases
(Fig. 1D). In NMLT samples, no
N-cadherin staining was detected (Fig.
1C). In the whole study cohort, mean N-cadherin scores were
significantly higher in G1-G2 tumours compared to G3 ones
(0.19±0.58 vs. 0.03±0.24; P=0.02; Table
SII). A similar relationship was also observed in AC cases
analysed separately (0.17±0.60 vs. 0.01±0.12; P=0.05; Table SII). Moreover, N-cadherin
overexpression was associated with a more advanced stage of the
disease, both in the whole study cohort (0.17±0.51 in stage II–IV
tumours vs. 0.05±0.35 in stage I tumours; P=0.007; Table SII), and in the LSCC subtype
(0.31±0.68 in stage II–IV tumours vs. 0.05±0.32 in stage I tumours;
P=0.02; Table SII).
In LSCC, SNAIL overexpression was
associated with an advanced stage of the disease and the presence
of lymph node metastasis
SNAIL was highly expressed in the cytoplasm of
cancer cells (Fig. 1F) and, less
abundantly, in the cytoplasm of normal lung macrophages (Fig. 1E). A total of 82.64% of NSCLC
specimens were SNAIL-positive (Allred score >3). No SNAIL
expression was observed in non-malignant lung alveoli (Fig. 1E) and bronchial epithelium. Although
mean SNAIL scores did not differ between particular NSCLC subtypes
(Table V), the exact expression
patterns and associations with the clinicopathological data seemed
to be dependent on the tumour histology. While in AC there was no
relationship between SNAIL expression and the presence of lymph
node metastasis, SNAIL was significantly overexpressed in pN1 and
pN2 tumours compared to pN0 ones (5.22±1.05 vs. 4.69±1.00; P=0.02;
Table V) in LSCC. Additionally, in
LSCC, an elevated SNAIL level was associated with a more advanced
stage of the disease; in stage II–IV tumours mean SNAIL scores were
significantly higher compared to stage I (5.04±1.04 vs. 4.63±1.01;
P=0.04; Table V). Similar
associations between SNAIL expression and the stage of the disease
were also observed in the whole study cohort, but not in the AC
subtype analysed separately (Table
V).
| Table V.SNAIL expression and
clinicopathological data of NSCLC patients. |
Table V.
SNAIL expression and
clinicopathological data of NSCLC patients.
|
| All cases
(N=242) | AC (N=150) | LSCC (N=92) |
|---|
|
|
|
|
|
|---|
| Parameters | Score ± SD | P-value | Score ± SD | P-value | Score ± SD | P-value |
|---|
| Histological
type |
|
|
|
|
|
|
| AC | 4.693±1.326 | 0.37 |
|
|
|
|
|
LSCC | 4.848±1.037 |
|
|
|
|
|
| Age (years) |
|
|
|
|
|
|
|
≤65 | 4.596±1.256 | 0.08 | 4.536±1.399 | 0.19 | 4.700±0.9661 | 0.25 |
|
>65 | 4.880±1.187 |
| 4.827±1.253 |
| 4.962±1.084 |
|
| Sex |
|
|
|
|
|
|
|
Male | 4.733±1.228 | 0.89 | 4.706±1.352 | 0.86 | 4.770±1.039 | 0.49 |
|
Female | 4.758±1.209 |
| 4.677±1.300 |
| 4.933±0.9803 |
|
| Malignancy
grade |
|
|
|
|
|
|
| G1,
G2 | 4.794±1.215 | 0.38 | 4.684±1.378 | 0.99 | 4.899±1.033 | 0.16 |
| G3 | 4.678±1.244 |
| 4.703±1.279 |
| 4.538±1.050 |
|
| Tumour size |
|
|
|
|
|
|
|
pT1 | 4.605±1.276 | 0.25 | 4.500±1.388 | 0.27 | 4.900±0.8522 | 0.95 |
|
pT2-pT4 | 4.803±1.218 |
| 4.765±1.325 |
| 4.845±1.091 |
|
| Lymph nodes |
|
|
|
|
|
|
|
pN0 | 4.671±1.239 | 0.15 | 4.656±1.383 | 0.71 | 4.692±0.9988 | 0.02 |
| pN1,
pN2 | 4.914±1.185 |
| 4.759±1.228 |
| 5.222±1.050 |
|
| Stage |
|
|
|
|
|
|
| I | 4.529±1.238 | 0.02 | 4.469±1.368 | 0.16 | 4.625±1.005 | 0.04 |
|
II–IV | 4.911±1.216 |
| 4.822±1.326 |
| 5.039±1.038 |
|
Relationships between SLUG expression
and the patient clinicopathological data are dependent on protein
localisation (nuclear vs. cytoplasmic) and tumour histology
SLUG staining was detected in the cytoplasm and
nuclei of cancer cells (Fig. 1H) and
in the cytoplasm of normal lung macrophages (Fig. 1G). We observed cytoplasmic SLUG (SLUG
C) expression (Allred score >3) in 75.62% of NSCLC cases,
whereas nuclear expression (SLUG N; Allred score >3) was present
in 51.24% of the samples. In 50.83% of the analysed cases, SLUG was
expressed both in the cytoplasm and nuclei of the cells.
SLUG C expression patterns differed visibly
depending on the tumour histology. In AC, mean SLUG C scores were
significantly higher in G3 tumours compared to G1 and G2 ones
(5.70±0.95 vs. 5.32±1.17; P=0.05; Table
VI). The association between SLUG C expression and the tumour
malignancy grade was also present in the whole study cohort
(Table VI). At the same time, in
LSCC, the level of SLUG C seemed to be positively associated with
the tumour size (5.44±1.02 in pT2-pT4 tumours vs. 4.75±1.58 in pT1
tumours; P=0.04; Table VI) and the
stage of the disease (5.57±0.88 in stage II–IV tumours vs.
4.92±1.44 in stage I tumours; P=0.02; Table VI).
| Table VI.Cytoplasmic SLUG expression and
clinicopathological data of the NSCLC patients. |
Table VI.
Cytoplasmic SLUG expression and
clinicopathological data of the NSCLC patients.
|
| All cases
(N=242) | AC (N=150) | LSCC (N=92) |
|---|
|
|
|
|
|
|---|
| Parameters | Score ± SD | P-value | Score ± SD | P-value | Score ± SD | P-value |
|---|
| Histological
type |
|
|
|
|
|
|
| AC | 5.507±1.079 | 0.11 |
|
|
|
|
|
LSCC | 5.293±1.191 |
|
|
|
|
|
| Age (years) |
|
|
|
|
|
|
|
≤65 | 5.266±1.303 | 0.16 | 5.333±1.233 | 0.21 | 5.150±1.424 | 0.47 |
|
>65 | 5.556±0.9408 |
| 5.654±0.9105 |
| 5.404±0.9754 |
|
| Sex |
|
|
|
|
|
|
|
Male | 5.370±1.151 | 0.53 | 5.506±1.054 | 0.78 | 5.180±1.258 | 0.29 |
|
Female | 5.505±1.090 |
| 5.508±1.120 |
| 5.500±1.042 |
|
| Malignancy
grade |
|
|
|
|
|
|
| G1,
G2 | 5.303±1.181 | 0.03 | 5.316±1.169 | 0.05 | 5.291±1.200 | 0.94 |
| G3 | 5.644±0.9880 |
| 5.703±0.9469 |
| 5.308±1.182 |
|
| Tumour size |
|
|
|
|
|
|
|
pT1 | 5.237±1.284 | 0.09 | 5.411±1.125 | 0.31 | 4.750±1.585 | 0.04 |
|
pT2-pT4 | 5.487±1.048 |
| 5.531±1.073 |
| 5.437±1.024 |
|
| Lymph nodes |
|
|
|
|
|
|
|
pN0 | 5.453±1.145 | 0.49 | 5.615±1.019 | 0.09 | 5.215±1.281 | 0.37 |
| pN1,
pN2 | 5.370±1.089 |
| 5.315±1.163 |
| 5.481±0.9352 |
|
| Stage |
|
|
|
|
|
|
| I | 5.375±1.232 | 0.88 | 5.656±0.9955 | 0.08 | 4.925±1.439 | 0.02 |
|
II–IV | 5.427±1.053 |
| 5.329±1.155 |
| 5.569±0.8776 |
|
SLUG N was significantly overexpressed in LSCC
compared to AC tumours (4.17±1.04 vs. 3.56±0.75; P<0.001;
Table VII). In LSCC, the level of
SLUG N was positively associated with the tumour size (4.27±1.04 in
pT2-pT4 tumours vs. 3.80±1.01 in pT1 tumours; P=0.04; Table VII) and the stage of the disease
(4.33±0.97 in stage II–IV tumours vs. 3.95±1.11 in stage I tumours;
P=0.02; Table VII). A positive
relationship between tumour size and SLUG N expression was also
observed in the whole study cohort, but not in the AC subtype
(Table VII). In AC, SLUG N
expression level was revealed to be associated with the patient
sex: It was significantly higher in men than in women (3.69±0.76
vs. 3.39±0.70, respectively; P=0.01; Table VII).
| Table VII.Nuclear SLUG expression and
clinicopathological data of the NSCLC patients. |
Table VII.
Nuclear SLUG expression and
clinicopathological data of the NSCLC patients.
|
| All cases
(N=242) | AC (N=150) | LSCC (N=92) |
|---|
|
|
|
|
|
|---|
| Parameters | Score ± SD | P-value | Score ± SD | P-value | Score ± SD | P-value |
|---|
| Histological
type |
|
|
|
|
|
|
| AC | 3.560±0.7462 |
<0.001 |
|
|
|
|
|
LSCC | 4.174±1.044 |
|
|
|
|
|
| Age (years) |
|
|
|
|
|
|
|
≤65 | 3.725±0.9610 | 0.21 | 3.449±0.7580 | 0.09 | 4.200±1.091 | 0.47 |
|
>65 | 3.850±0.8833 |
| 3.654±0.7273 |
| 4.154±1.017 |
|
| Sex |
|
|
|
|
|
|
|
Male | 3.884±0.9433 | 0.05 | 3.694±0.7563 | 0.01 | 4.148±1.108 | 0.29 |
|
Female | 3.642±0.8619 |
| 3.385±0.7003 |
| 4.200±0.9248 |
|
| Malignancy
grade |
|
|
|
|
|
|
| G1,
G2 | 3.858±0.9766 | 0.22 | 3.474±0.7019 | 0.18 | 4.228±1.062 | 0.94 |
| G3 | 3.678±0.7996 |
| 3.649±0.7840 |
| 3.846±0.8987 |
|
| Tumour size |
|
|
|
|
|
|
|
pT1 | 3.526±0.7912 | 0.002 | 3.429±0.6838 | 0.12 | 3.800±1.005 | 0.04 |
|
pT2-pT4 | 3.908±0.9653 |
| 3.593±0.7710 |
| 4.268±1.041 |
|
| Lymph nodes |
|
|
|
|
|
|
|
pN0 | 3.752±0.8662 | 0.35 | 3.542±0.6793 | 0.67 | 4.062±1.014 | 0.37 |
| pN1,
pN2 | 3.877±1.017 |
| 3.593±0.8582 |
| 4.444±1.086 |
|
| Stage |
|
|
|
|
|
|
| I | 3.673±0.8527 | 0.09 | 3.500±0.5909 | 0.85 | 3.950±1.108 | 0.02 |
|
II–IV | 3.871±0.9792 |
| 3.548±0.8505 |
| 4.333±0.9730 |
|
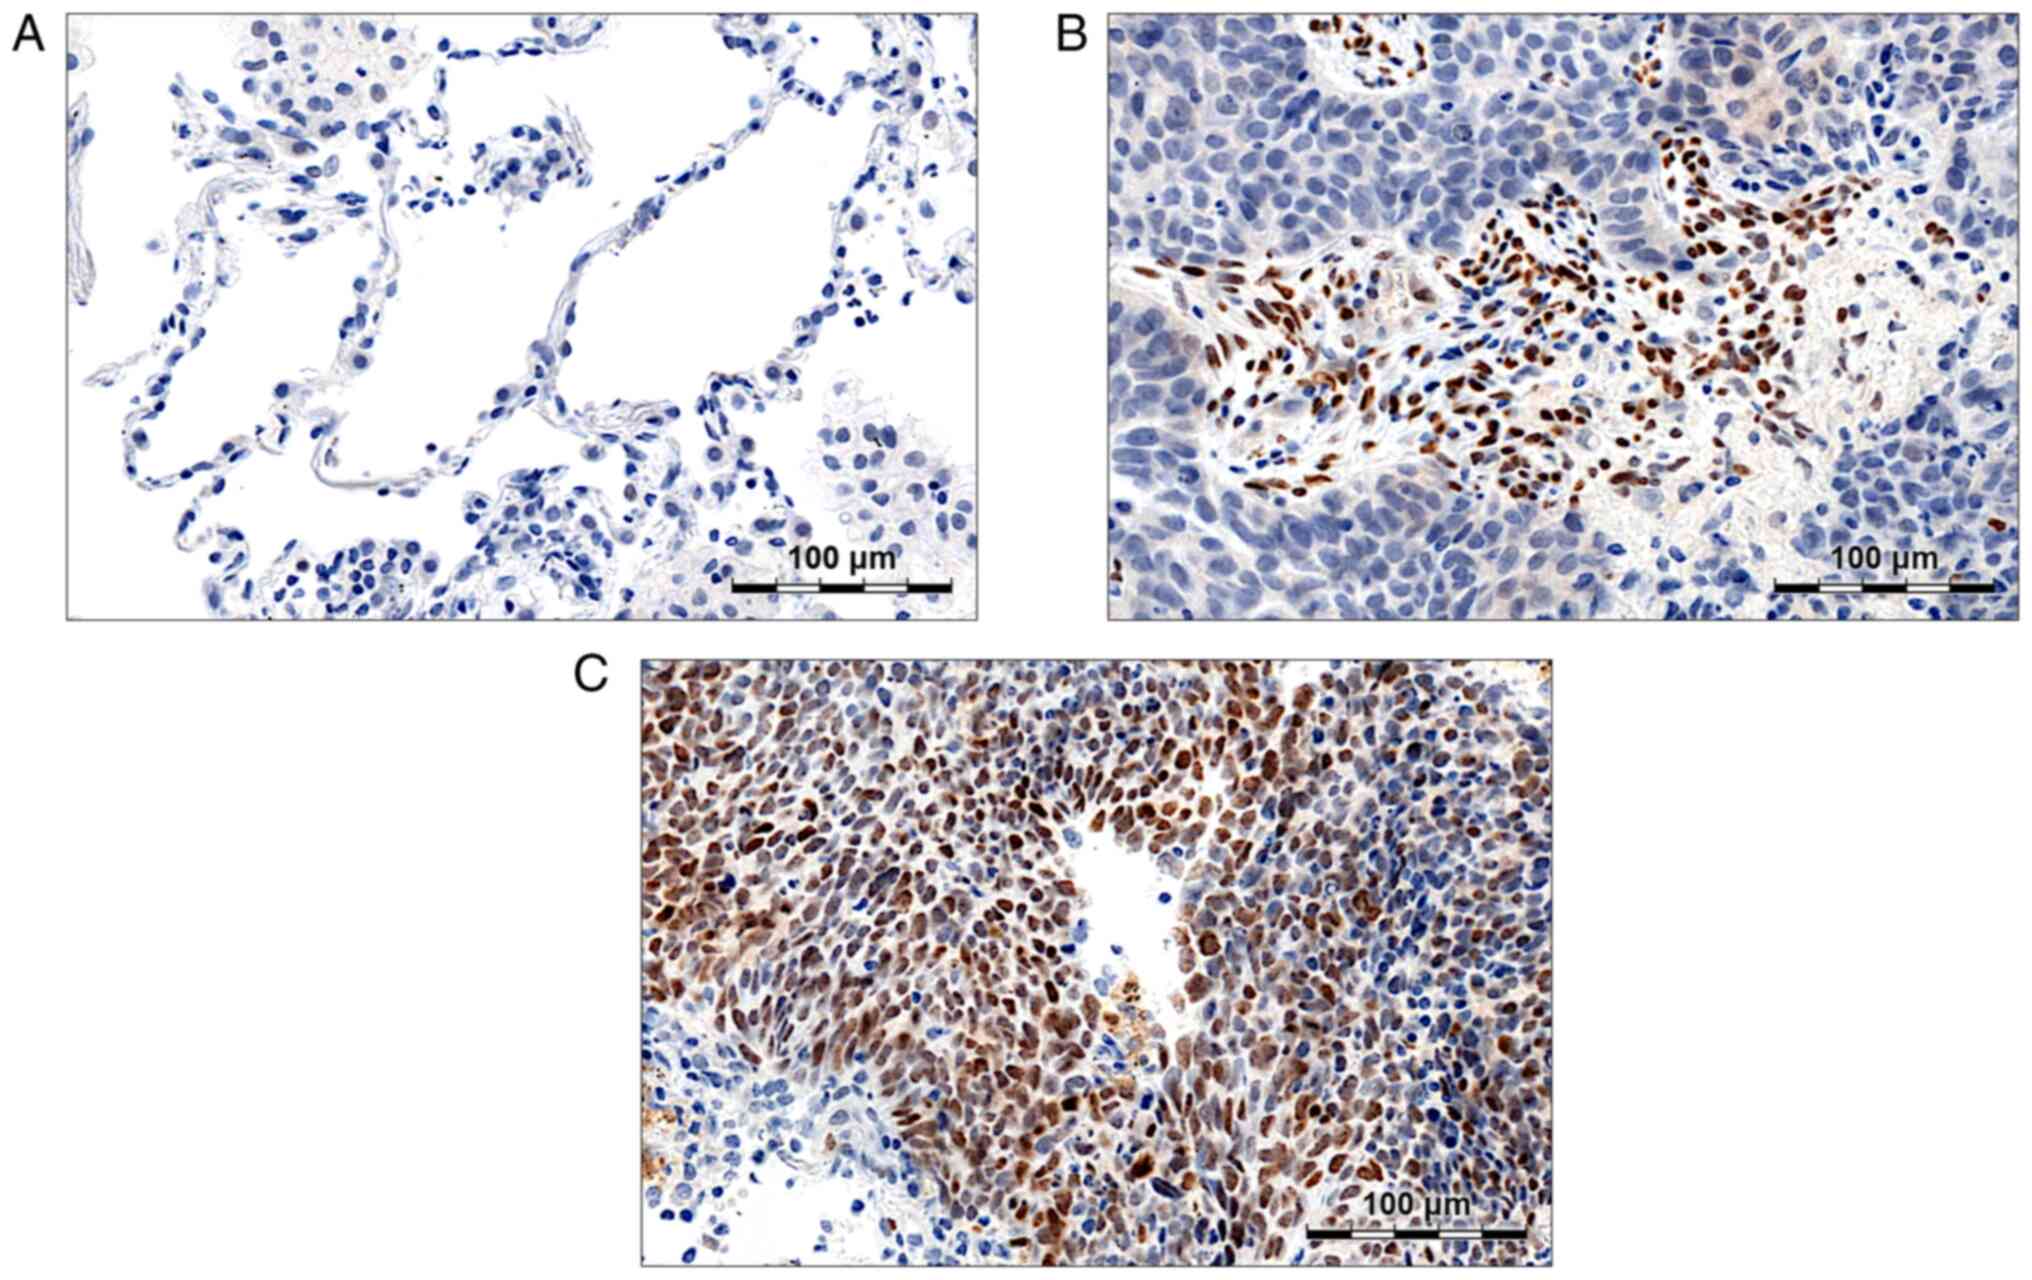
Twist1 is expressed mainly in LSCC
tumours, and its expression levels are correlated with the stage of
the disease
Twist1 expression was observed in the nuclei of
cancer cells (Fig. 2C) and in the
nuclei of infiltrating lymphocytes (Fig.
2B). In NMLT samples, no Twist1 staining was detected (Fig. 2A). A total of 12.81% of the analysed
NSCLC samples were Twist1-positive (Allred score >3). Twist1
expression levels were related to the tumour histology; in LSCC,
mean score values were significantly higher compared to AC
(3.50±1.19 vs. 2.74±0.62, respectively; P<0.001; Table SIII). Moreover, in LSCC, Twist1
expression was positively associated with the stage of the disease
(3.73±1.33 in stage II–IV tumours vs. 3.20±0.94 in stage I tumours;
P=0.04; Table SIII). Inversely, in
AC, a negative relationship between Twist1 level and the tumour
size was observed; in pT2-pT4 tumours, Twist1 expression was
significantly decreased compared to pT1 ones (2.62±0.68 vs.
2.86±0.55, respectively; P=0.02; Table
SIII).
SATB1 scores are positively correlated
with SNAIL, SLUG, and Twist1 expression
Further analysis revealed that SNAIL, SLUG, and
Twist1 expression levels were positively correlated with SATB1
scores, as assessed in our previous study (59). In the whole study cohort, we observed
a moderate positive correlation between the expression of SATB1 and
SLUG N (R=0.449; P<0.0001; Table
VIII; Fig. 3G), and a low
positive correlation between the expression of SATB1 and SLUG C
(R=0.288; P<0.0001; Table VIII;
Fig. 3D). SATB1 scores were also
correlated positively with Twist1 and SNAIL levels (R=0.264;
P<0.0001 and R=0.129; P<0.045, respectively; Table VIII; Fig.
3J and A, respectively).
| Table VIII.Correlations between the expression
of SATB1 and E-cadherin, N-cadherin, SNAIL, SLUG, and Twist1
proteins. |
Table VIII.
Correlations between the expression
of SATB1 and E-cadherin, N-cadherin, SNAIL, SLUG, and Twist1
proteins.
|
| NSCLC | AC | LSCC |
|---|
|
|
|
|
|
|---|
| Protein | Spearman's R | P-value | Spearman's R | P-value | Spearman's R | P-value |
|---|
| E-cadherin | 0.109 | 0.090 | 0.069 | 0.400 | 0.143 | 0.174 |
| N-cadherin | 0.080 | 0.215 | −0.004 | 0.963 | 0.126 | 0.232 |
| SNAIL | 0.129 | 0.045 | 0.092 | 0.261 | 0.152 | 0.148 |
| SLUG C | 0.288 |
<0.0001 | 0.294 |
<0.001 | 0.403 |
<0.0001 |
| SLUG N | 0.449 |
<0.0001 | 0.365 |
<0.0001 | 0.424 |
<0.0001 |
| Twist1 | 0.264 |
<0.0001 | 0.218 | 0.008 | 0.144 | 0.169 |
Positive correlations between the expression levels
of SATB1 and SLUG N on the one hand, and the expression levels of
SATB1 and SLUG C on the other were also observed in the AC and LSCC
subtypes analysed separately. R values were especially high in
LSCC: 0.424 for SATB1/SLUG N and 0.403 for SATB1/SLUG C correlation
(Table VIII; Fig. 3). However, a significant correlation
between SATB1 and Twist1 expressions was found only in AC (R=0.218;
P=0.008; Table VIII; Fig. 3K).
Expression of EMT markers is
positively correlated with Ki67 scores
The expression of all of the markers analysed in the
whole study cohort was found to be positively correlated with Ki67
scores, as assessed in our previous study (59). The correlation coefficients were
particularly high for SNAIL and SLUG N (R=0.372; P<0.0001 and
R=0.347; P<0.0001, respectively; Table IX). Significant positive correlations
between the expression of Ki67 and E-cadherin, N-cadherin, SNAIL,
SLUG C, and SLUG N were also detected in the AC subtype (Table IX). In LSCC, Ki67 expression
correlated moderately with the expression of SNAIL and SLUG C
(R=0.449; P<0.0001 and R=0.410; P<0.0001, respectively;
Table IX), and more weakly with the
expression of SLUG N and Twist1 (R=0.284; P<0.006 and R=0.299;
P<0.004, respectively; Table IX).
Interestingly, in LSCC, no associations between Ki67, E-cadherin,
and N-cadherin levels were observed (Table IX).
| Table IX.Correlations between the expression
of E-cadherin, N-cadherin, SNAIL, SLUG, and Twist1 and the Ki-67
proliferative index. |
Table IX.
Correlations between the expression
of E-cadherin, N-cadherin, SNAIL, SLUG, and Twist1 and the Ki-67
proliferative index.
|
| NSCLC | AC | LSCC |
|---|
|
|
|
|
|
|---|
| Protein | Spearman's R | P-value | Spearman's R | P-value | Spearman's R | P-value |
|---|
| E-cadherin | 0.202 | 0.002 | 0.249 | 0.002 | 0.060 | 0.569 |
| N-cadherin | 0.196 | 0.002 | 0.173 | 0.035 | 0.182 | 0.082 |
| SNAIL | 0.372 |
<0.0001 | 0.351 |
<0.0001 | 0.449 |
<0.0001 |
| SLUG C | 0.228 |
<0.001 | 0.198 | 0.015 | 0.410 |
<0.0001 |
| SLUG N | 0.347 |
<0.0001 | 0.235 | 0.004 | 0.284 | 0.006 |
| Twist1 | 0.215 | 0.001 | −0.036 | 0.662 | 0.299 | 0.004 |
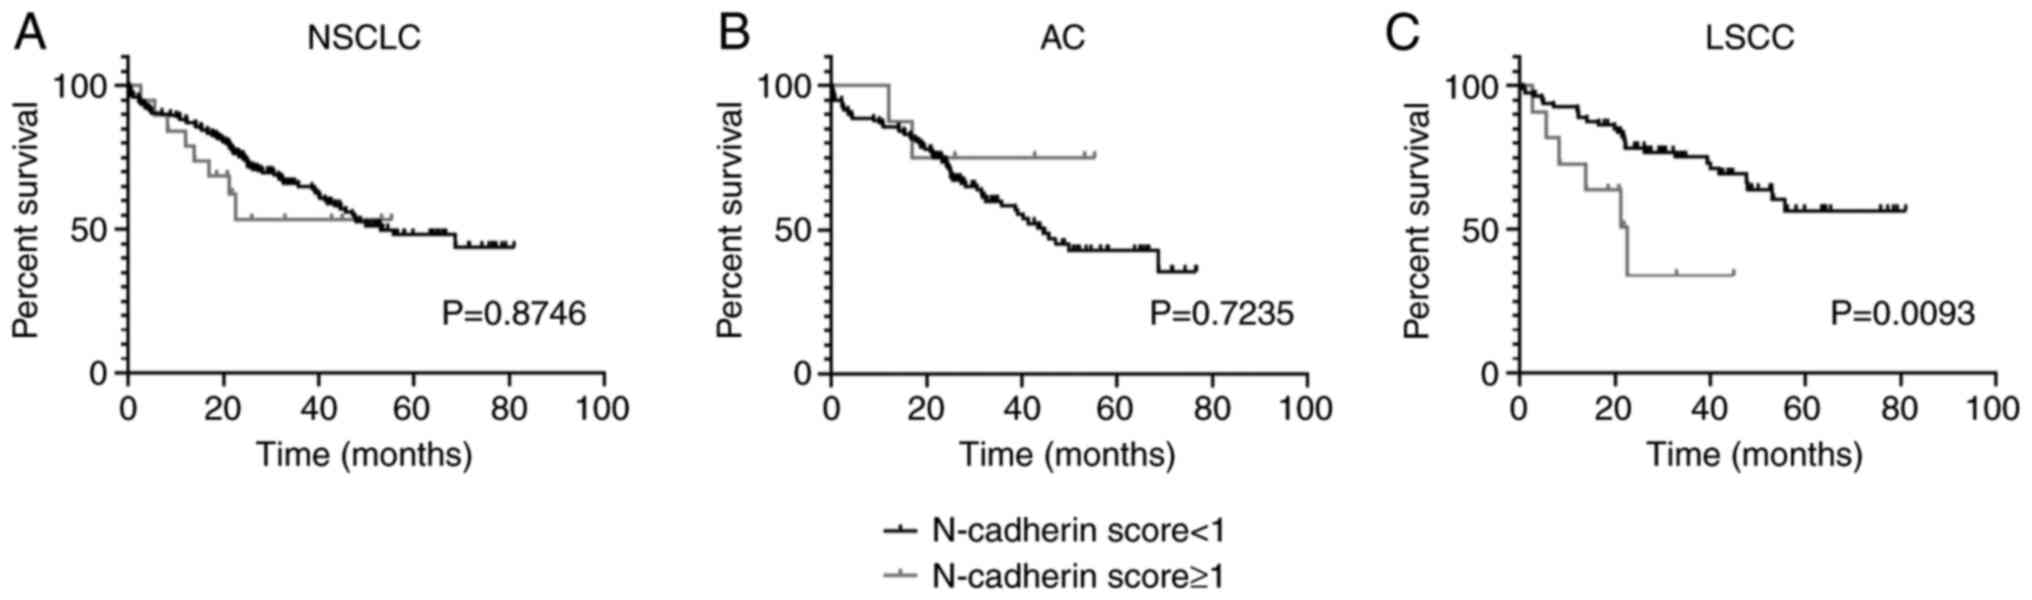
N-cadherin expression is a negative
prognostic factor for LSCC patients
In order to determine the impact of N-cadherin
expression on patient survival, Kaplan-Meier's survival curves were
compared using the log-rank (Mantel-Cox) test. The results revealed
that an elevated N-cadherin level (score ≥1) was a significant
negative prognostic factor for LSCC patients (P=0.0093; Fig. 4C), but not for AC patients (P=0.7235;
Fig. 4B). N-cadherin expression
lacked a prognostic significance in the whole study cohort as well
(P=0.8746; Fig. 4A).
Apart from N-cadherin, none of the markers analysed
(E-cadherin, SNAIL, SLUG, or Twist1) was observed to have a
significant impact on NSCLC patient survival.
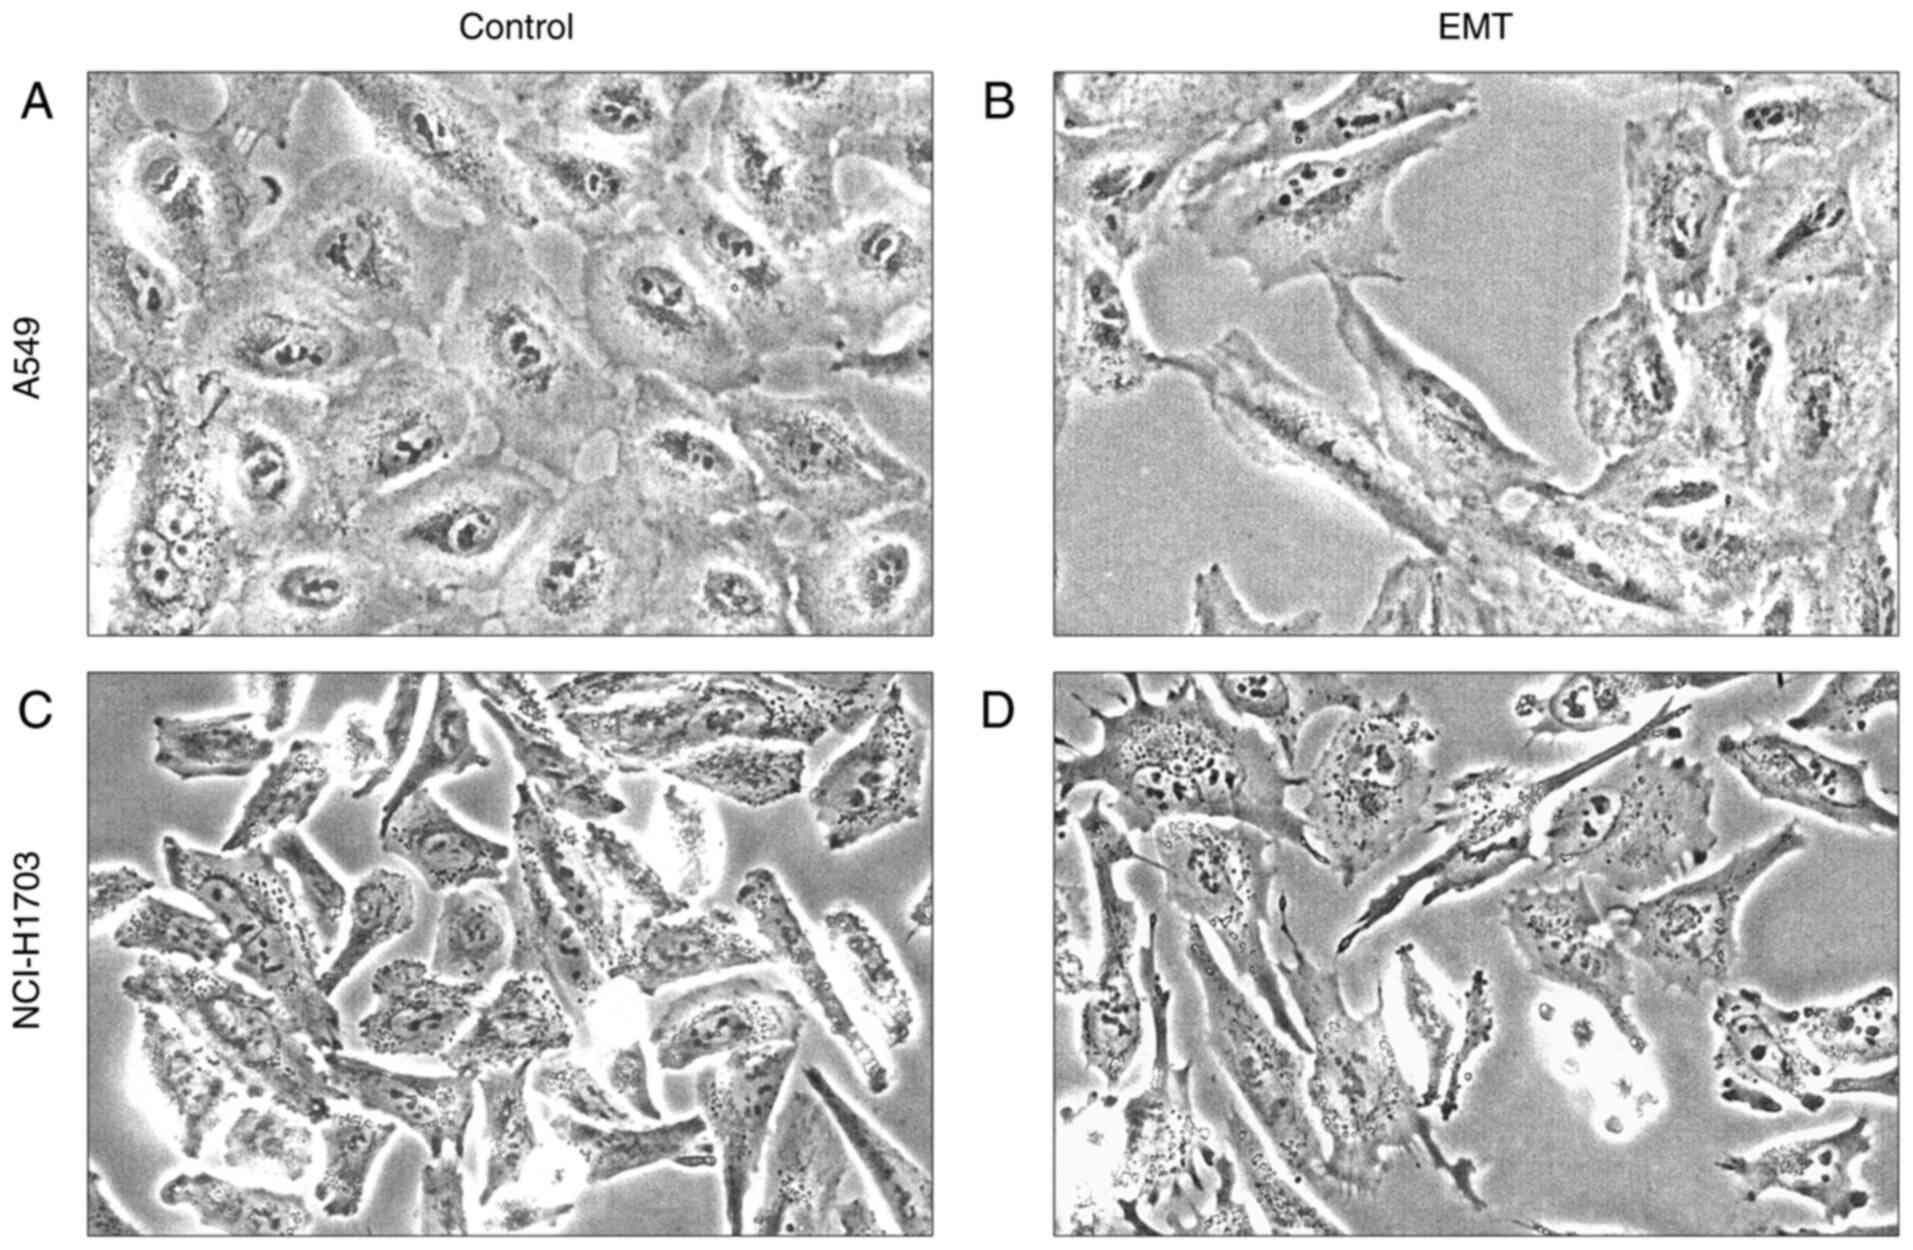
TGF-β1 treatment successfully induces
EMT in NSCLC cell line
To determine whether SATB1 expression changes during
the EMT process, we induced EMT in vitro in the A549 (AC)
and NCI-H1703 (LSCC) cell lines using TGF-β1. Forty eight hours
after exposure to TGF-β1, we observed significant morphological
changes in the cultured cells, which indicated a shift from an
epithelial to a mesenchymal phenotype. A549 cells lost their usual
cobblestone-like morphology (Fig. 5A)
and became elongated and spindle-shaped. Moreover, they grew
dispersed and showed reduced cell-to-cell contact (Fig. 5B). In NCI-H1703 cells, due to their
normally elongated shape (Fig. 5C),
morphological changes were less evident but still noticeable.
Additionally, after EMT induction, these cells developed numerous
cytoplasmic extensions, probably associated with an enhanced cell
motility (64) (Fig. 5D).
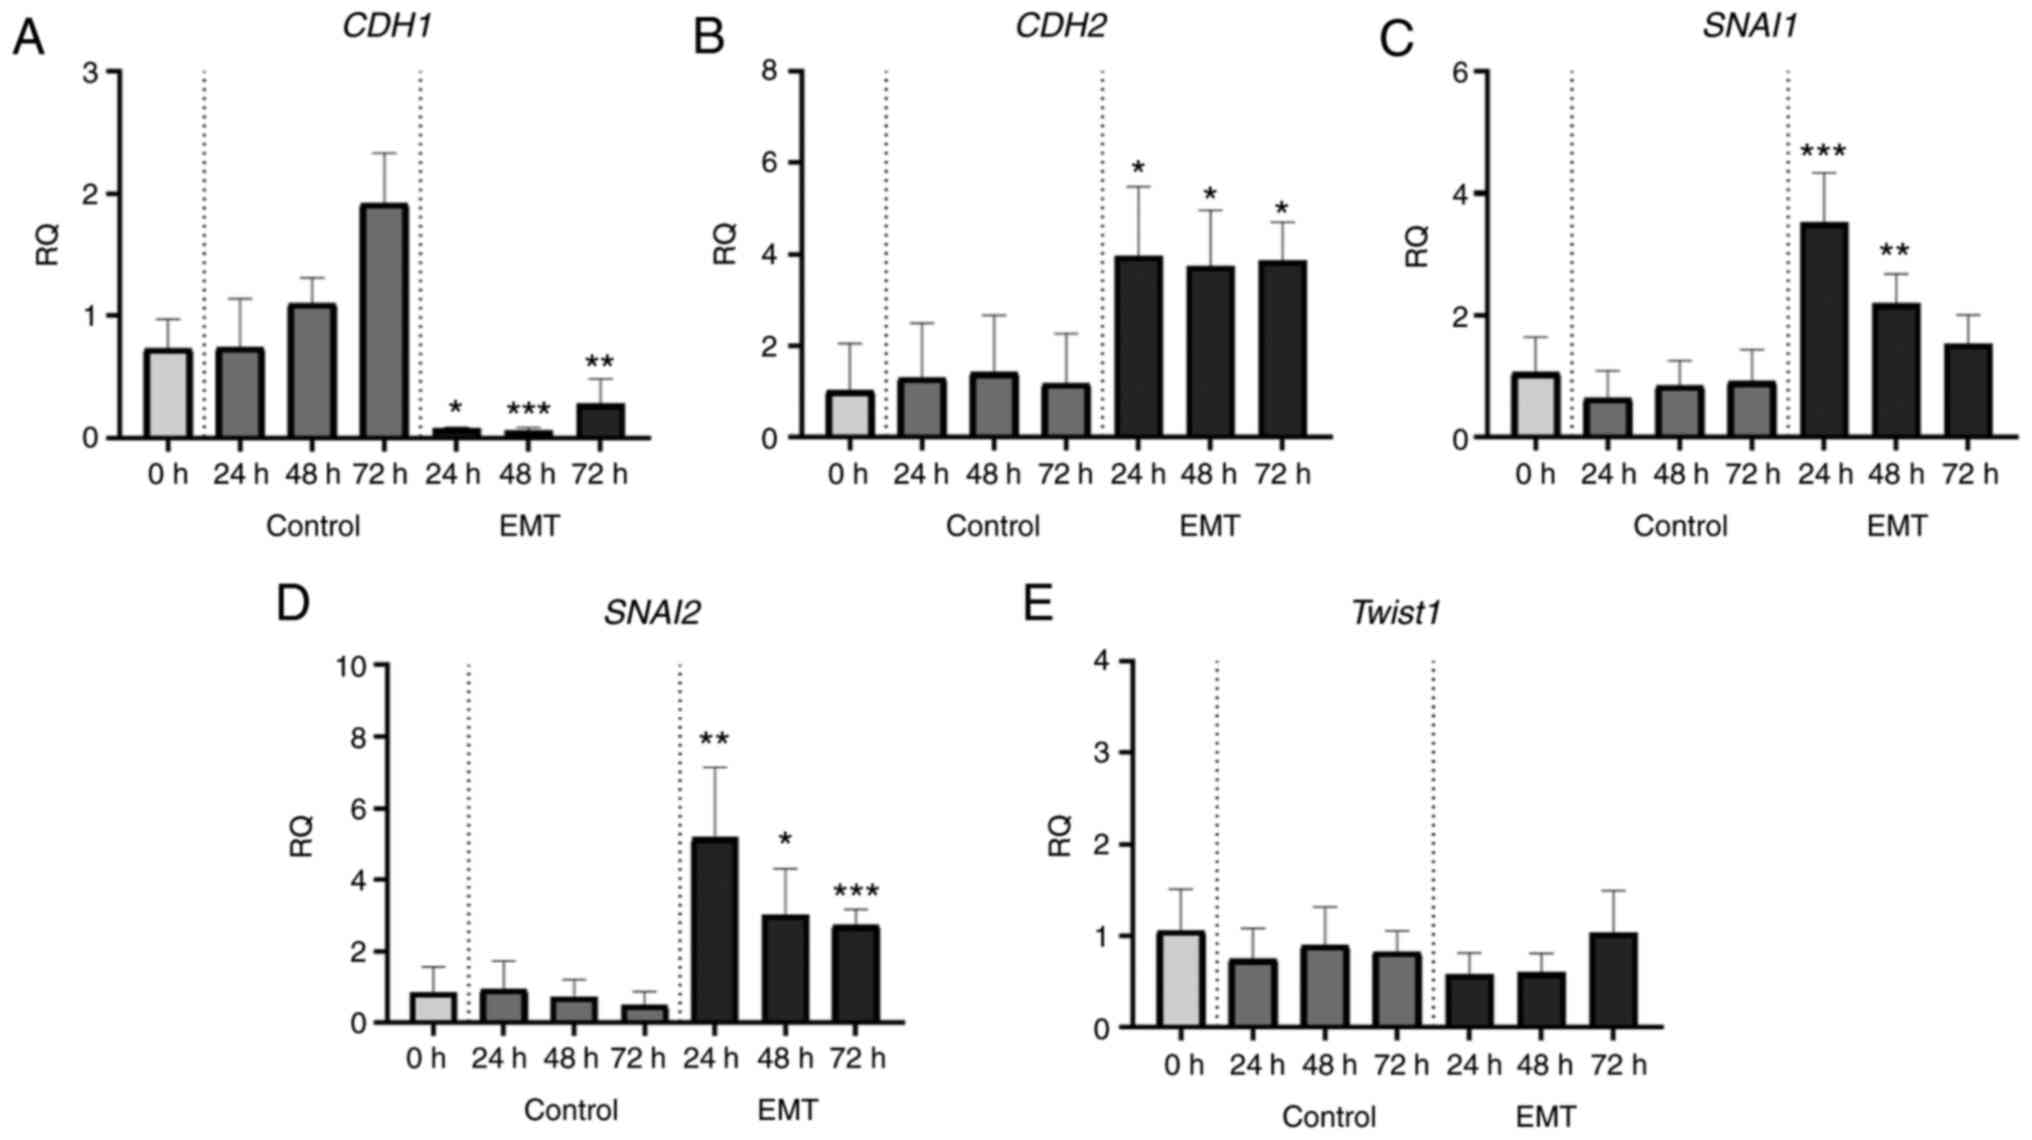
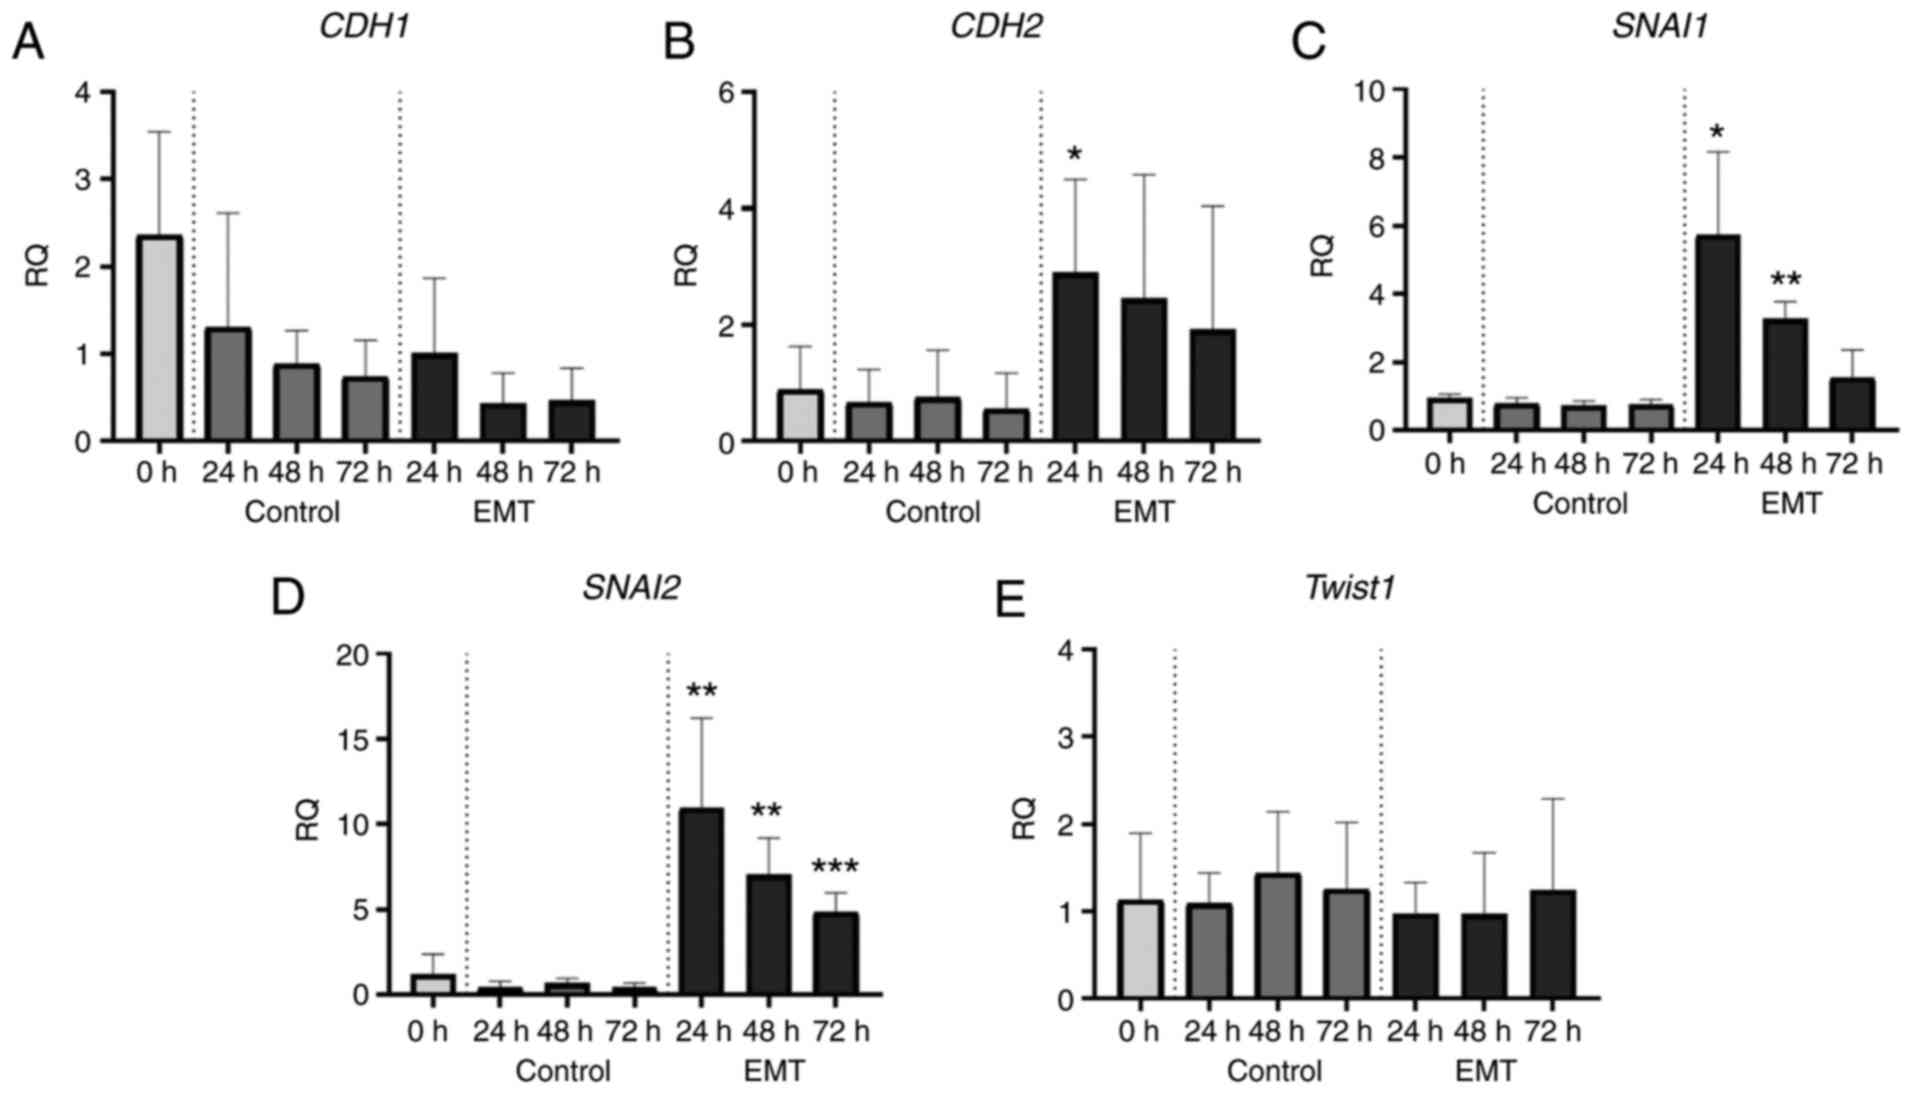
These morphological transformations were accompanied
with a gradual shift from epithelial to mesenchymal gene expression
profiles. To track these changes, we performed real-time PCR assays
and analysed the expression of key EMT-related genes, CDH1,
CDH2, SNAI1, SNAI2, and TWIST1 (coding for E-cadherin,
N-cadherin, SNAIL, SLUG, and Twist1, respectively). After EMT
induction, in the A549 cell line we observed about a 10-fold
decrease in CDH1 expression (Fig.
6A) and a significant increase in the expression of CDH2,
SNAI1 and SNAI2 (Fig.
6B-D). In the NCI-H1703 cells, the expression levels of
CDH1 remained unchanged after TGF-β1 exposure (Fig. 7A), while the expression of CDH2,
SNAI1, and SNAI2 increased significantly (Fig. 7B-D). In both cell lines, EMT induction
had no effect on Twist1 mRNA levels (Figs. 6E and 7E).
SATB1 expression in A549 and NCI-H1703
cell lines is significantly increased after EMT induction
In order to investigate whether SATB1
expression in NSCLC cell lines changes during EMT, we used the
Droplet Digital PCR method to assess SATB1 mRNA levels in
the cell culture lysates obtained from the cells after TGF-β1
treatment and from the control ones. In both of the analysed cell
lines (A549 and NCI-H1703), induction of EMT resulted in a
significant increase in SATB1 expression levels. However,
the exact SATB1 expression patterns were different depending
on the cell line.
In the control (untreated A549 cells), SATB1
mRNA level gradually increased during the time of the culture,
reaching its maximum value (62.00±40.51 mRNA copies) after 72 h.
Twenty hours after TGF-β1 exposre, SATB1 expression in EMT
cells significantly increased compared to the control ones
(67.11±28.60 vs. 15.36±11.79; P=0.0001; Fig. 8A). Forty-eight hours after the EMT
induction, SATB1 mRNA level was still slightly elevated, but
not significantly different from the control (59.11±48.51 vs.
36.67±25.22; ns; Fig. 8A). After 72
h, SATB1 expression in EMT cells decreased to a control
level (72.67±32.95 mRNA copies/sample).
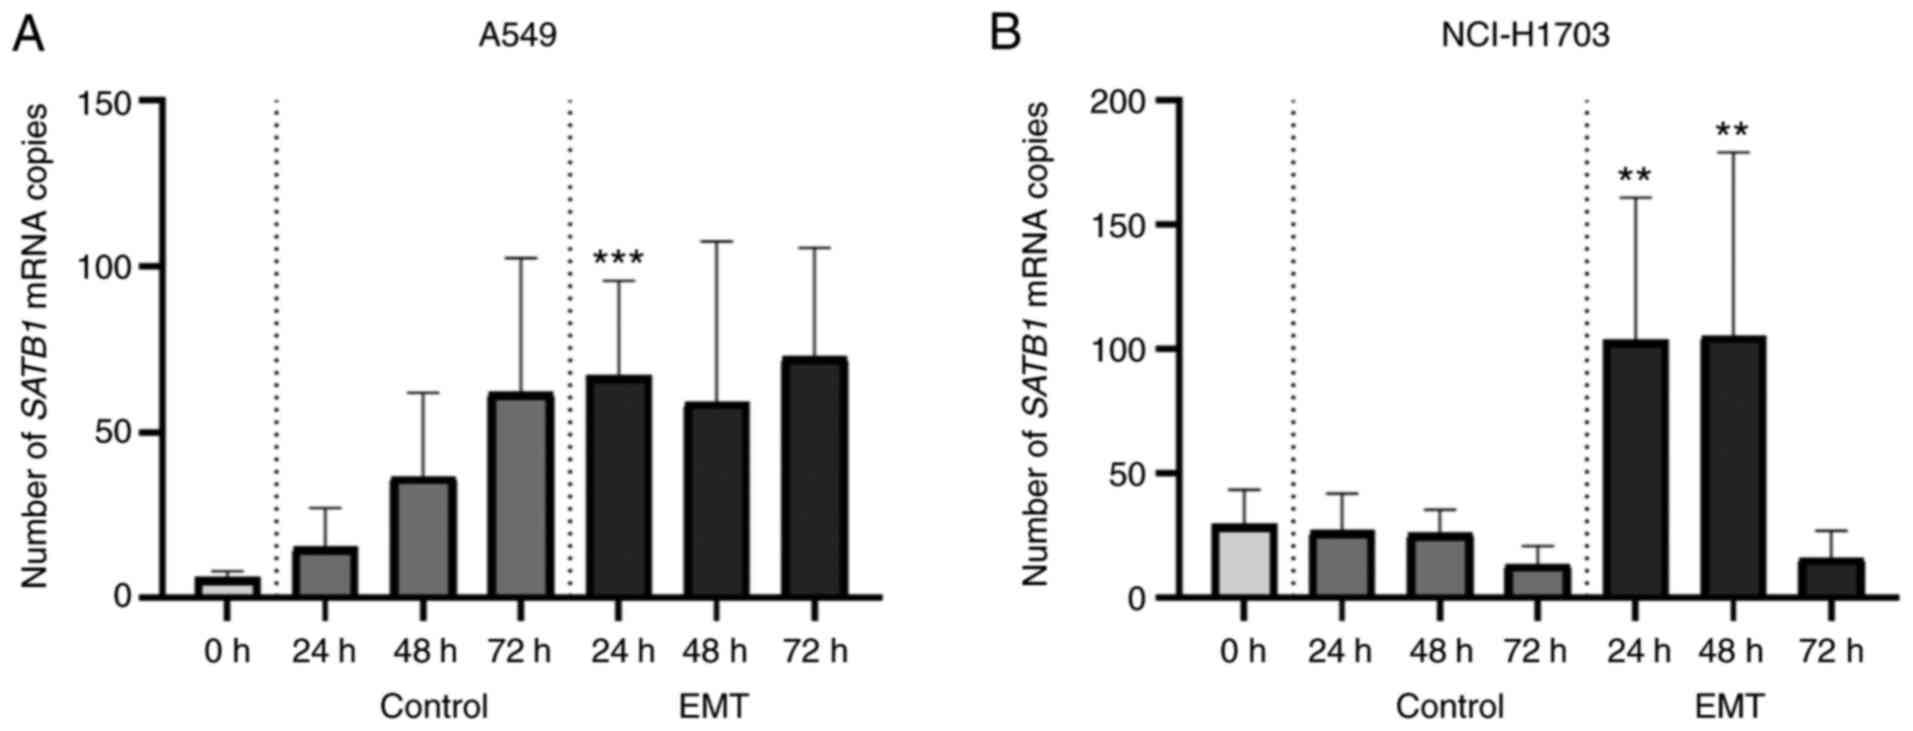 | Figure 8.Changes in the expression of special
AT-rich binding protein 1 (SATB1) mRNA after
epithelial-mesenchymal transition (EMT) induction in the A549 and
NCI-H1703 cell lines. (A) In the control A549 cells, SATB1
mRNA level gradually increased during the time of the culture,
reaching its maximum value after 72 h. While, 24 h after
transforming growth factor (TGF)-β1 exposure, SATB1
expression in EMT cells significantly increased compared to the
control group. At 48 h after EMT induction, the SATB1 mRNA
level was still slightly elevated, but not significantly different
from the control. After 72 h, SATB1 expression in EMT cells
decreased to a control level. (B) Untreated NCI-H1703 cells showed
a rather low SATB1 mRNA level, which remained stable during
the 72 h of culture. Yet, 24 h after EMT induction, we observed a
sharp increase in SATB1 expression that lasted for about 48
h after TGF-β1 treatment. At 24 and 48 h after TGF-β1
administration, SATB1 mRNA levels were significantly
elevated compared to the control. Yet, 72 h after EMT induction,
SATB1 expression dropped to a level comparable to the
control cells at 72 h. **P<0.01 and ***P<0.001. Error bars
stand for standard deviation. |
Untreated NCI-H1703 cells showed a rather low
SATB1 mRNA level (no more than 30 mRNA copies/sample), which
remained stable during the 72 h of culture. Yet, 24 h after the EMT
induction, we observed a sharp increase in SATB1 expression
that lasted for about 48 h after TGF-β1 exposre; 24 and 48 h after
TGF-β1 administration, SATB1 mRNA levels were significantly
elevated compared to the control (103.70±57.29 vs. 27.13±14.94
after 24 h; P=0.0029; 105.40±73.85 vs. 26.13±9.48 after 48 h;
P=0.0098; Fig. 8B). Yet, 72 h after
EMT induction, SATB1 expression dropped to a level
comparable to the control cells (16.29±10.80 vs. 13.58±7.32; ns;
Fig. 8B).
Discussion
The epidermal-mesenchymal transition (EMT) process
is commonly thought to be one of the main mechanisms underlying
cancer metastasis by enabling cancer cells to acquire an invasive
phenotype (9,15,17).
Although the complex network of molecular factors orchestrating EMT
has been extensively studied over the past 20 years, there are
still unanswered questions and challenging topics to be explored.
In recent years, there has been a growing interest in special
AT-rich binding protein 1 (SATB1), a potent transcriptional
regulator whose role in EMT was confirmed, among others, in breast,
colorectal, prostate and bladder cancers (65). In these neoplasms, SATB1 was
demonstrated not only to be associated with a high tumour
malignancy and a poor patient prognosis, but also to promote an
invasive, mesenchymal phenotype of the cells (65). In cancer cell lines, it was found to
stimulate the expression of key mesenchymal markers such as
vimentin and N-cadherin, as well as the most important
EMT-associated transcription factors: SNAIL, SLUG, and Twist1
(43,46,50,52,56).
It was also demonstrated to act as a repressor of the expression of
epithelial proteins, including claudin-1 and E-cadherin (43,46,56). SATB1
depletion in aggressive, tumorigenic cancer cell lines was
sufficient not only to decrease cell proliferation rates,
invasiveness, and resistance to apoptosis, but also to restore
their polarization and anchorage-dependent growth (43,45,52–55,66–68).
These reports suggest that, in specific conditions, SATB1 may
function as a specific ‘trigger’ of the malignant phenotype,
clearly contributing to EMT and cancer metastasis.
Unfortunately, little is known about the role of
SATB1 in the progression of non-small cell lung cancer (NSCLC),
which is one of the most common and malignant human cancers.
Previous reports are ambiguous and indicate that the function of
SATB1 in NSCLC is highly dependent on the tumour histology
[adenocarcinoma (AC) vs. squamous cell carcinoma (LSCC)] (58–60). To
date, the possible role of SATB1 in EMT has not been investigated
in NSCLC. A recent study was the first to analyse the relationships
between the expression of SATB1 and EMT-associated proteins
(E-cadherin, N-cadherin, SNAIL, SLUG, and Twist1) in NSCLC clinical
samples. Moreover, it also investigated the impact of in
vitro EMT induction in NSCLC cell cultures on SATB1 mRNA
levels for the first time.
One of the main EMT hallmarks, usually observed at
the very beginning of this process, is a decrease in the expression
of E-cadherin, a calcium-dependent cell-adhesion molecule that is
one of the key epithelial markers (69). E-cadherin mediates cell-to-cell
junctions and interactions and prevents migration, therefore it is
a known tumour suppressor protein (69,70). The
loss of its expression not only results in the disruption of
cell-to-cell contacts, but it was also demonstrated to activate
downstream transcriptional pathways, leading to invasion and
metastasis (71,72). In NSCLC, a decreased E-cadherin level
was shown to be associated with poor tumour differentiation, the
presence of lymph node metastasis, and an advanced stage of the
disease (73–76). In our study, we observed E-cadherin
expression in most of the analysed NSCLC samples. However, there
was no relationship with the patient clinicopathological or
survival data. This supports previous findings by Grigoras et
al and Myong et al, who assessed E-cadherin expression
in NSCLC and were not able to observe any significant associations
with the majority of the clinicopathological factors analysed or
the patients' survival (77,78). However, although there are some
studies in which the prognostic significance of the loss of
E-cadherin expression in NSCLC has not been proven yet (73,76–78), in
the majority of the experiments, a decreased E-cadherin level was
found to be a negative prognostic factor for NSCLC patients,
something that has also been confirmed by meta-analyses (75,79,80).
Another protein from the cadherin family, closely
associated with EMT progression, is N-cadherin, a key mesenchymal
marker necessary for cell migration (69,70). While
E-cadherin expression is being supressed during EMT, the N-cadherin
level significantly increases in a process called ‘a cadherin
switch’ (69,70,81).
Aberrant N-cadherin expression has been observed in most of the
epithelial-derived solid tumours, and it was shown to be a factor
that influenced patient survival negatively and was related to a
high tumour grade and the presence of lymph node metastasis
(81,82). In the current study, although
N-cadherin expression was only noted in ~8% of the NSCLC samples
analysed, it was significantly related to the more advanced stage
of the disease-both in the whole study cohort and in the LSCC
subtype analysed separately. An increased N-cadherin level also
seemed to be slightly associated with the LSCC histology and the
presence of lymph node metastasis in LSCC tumours, but the results
were on the verge of statistical significance (P=0.07, in both
cases). Moreover, we observed that N-cadherin expression in LSCC
tumours was significantly correlated with a shorter overall
survival of the patients. Our results share a number of
similarities with the findings of Hui et al, who also
observed elevated N-cadherin scores in advanced stage tumours and
the negative impact of N-cadherin expression on NSCLC patient
prognosis (83). Analogous
relationships were seen in nasopharyngeal and oral squamous cell
carcinomas as well (84,85).
The whole EMT process is controlled at the
transcriptional and post-transcriptional level by numerous
transcription factors, chromatin modifying enzymes, miRNAs and long
non-coding RNAs (9–11). The most important transcription
regulators coordinating the shift from epithelial to mesenchymal
phenotype are SNAIL, SLUG, and Twist1 (9–11). These
proteins are responsible for downregulating E-cadherin and
activating traits leading to the upregulation of mesenchymal
markers, additionally influencing apoptosis, angiogenesis, and cell
migration (86–88). The overexpression of each of these
transcription factors has been confirmed to have a negative
prognostic significance in most common epithelial cancers (88–90). In
our study, we observed an elevated SNAIL, SLUG, and Twist1
immunoreactivity in NSCLC compared to NMLT samples, which is in
line with previous literature reports (91–93).
However, some researchers noticed SNAIL staining in the nuclei of
tumour cells (86,94), while we only observed it in the
cytoplasm. These differences may be due to the use of different IHC
methodologies and antibodies. However, recent reports suggest that
subcellular SNAIL localization may be one of the mechanisms to
regulate its activity during EMT (95), so this issue surely needs to be
investigated more thoroughly in the future. In this study, we did
not note any difference in SNAIL staining between the particular
NSCLC subtypes, which is consistent with Merikallio et al
(86) and Yanagawa et al
(91). In LSCC, elevated SNAIL scores
were associated with the presence of lymph node metastases and an
advanced stage of the disease, which fits the results obtained by
Abd El-Rehim et al (94).
Although some studies stated that elevated SNAIL scores are related
to a shortened NSCLC patient survival (86,91), in
our research, SNAIL expression did not reach prognostic
significance.
It is known that SLUG can promote lung cancer
invasion and metastasis (96), but
there are not many reports analysing its expression in NSCLC
clinical samples. Therefore, it is challenging to discuss the
results obtained in the current study. In 2014, Merikaillo et
al investigated SLUG immunostaining in more than 250 NSCLC
samples, but the only associations analysed were those with the
histological subtype of the tumour and the patient survival
(97). On the other hand, Hung et
al analysed SLUG expression in 85 NSCLC tumours, but they did
not observe any associations with the patient clinicopathological
data (98). In our study, nuclear
SLUG staining was significantly associated with the LSCC histology,
whereas staining in the cytoplasm of the tumour cells did not
differ among particular NSCLC subtypes, which is in good agreement
with Merikallio et al (97).
In LSCC, both nuclear and cytoplasmic SLUG expression was
positively associated with the size of the tumour and the stage of
the disease. In AC, an elevated cytoplasmic SLUG staining was
related to a poor degree of tumour differentiation. In contrast to
Jiang et al (93) and
Merikallio et al (97), we did
not observe any impact of SLUG expression on patient survival.
We observed Twist1 expression predominantly in LSCC
tumours, which is consistent with Jiang et al (93). Additionally, its elevated scores were
related to a more advanced stage of the disease, which supports the
results obtained by Hui et al (83). However, a meta-analysis of 5 different
studies regarding Twist1 expression in NSCLC did not confirm these
findings, revealing that in the experiments analysed, Twist1
overexpression was associated only with the presence of lymph node
metastasis (99). We did not find
Twist1 expression to be prognostically significant in the NSCLC
samples analysed. Although the meta-analyses (based mainly on
Chinese population studies) stated that Twist1 overexpression was a
negative prognostic factor (99,100) in
NSCLC, there are also several studies that lend support to our
findings (83,101).
The association between SATB1 level and the
expression of various EMT-associated factors has been revealed, to
date, in breast, colorectal, prostate, liver, and bladder cancers
(43,45,46,52,55,56).
Nevertheless, these studies were mostly based on the
loss-of-function cell culture models and did not analyse the
potential link between the expression of SATB1 and the
EMT-promoting factors in clinical material. It is known that SATB1
immunostaining is correlated with the expression of vimentin and
negatively correlated with the expression of E-cadherin and CK20 in
colorectal cancer clinical samples (51), but no reports concerning lung
carcinomas are available. Therefore, we are the first researchers
to investigate the relationship between the expression of SATB1 and
EMT-associated proteins in NSCLC tumours. We found SNAIL, SLUG, and
Twist1 expression levels to be positively correlated with SATB1
scores in the whole study cohort, which clearly indicates a
possible association between SATB1 expression and the progression
of EMT in these tumours. Moreover, nuclear and cytoplasmic SLUG
staining was positively correlated with the expression of SATB1 in
particular NSCLC subtypes as well. Surprisingly, the associations
were the strongest in LSCC samples, which seems to be contradictory
with the positive prognostic significance of SATB1 expression in
these tumours observed by Selinger et al (58). However, in our current and recent
studies, we have not noted a statistically significant link between
either SATB1 or SLUG expression and LSCC patient survival (59). In the currently analysed material, we
also observed a positive correlation between SATB1 and Twist1
expressions in AC samples, which is consistent with the postulated
tumour-promoting role of these two factors in adenocarcinomas
(60,102).
Although SATB1 has been shown to have an impact on
E-cadherin and N-cadherin expressions in numerous cancer cell lines
(43,45,46,52,55,56),
we did not note any relationship among the levels of these factors
in NSCLC clinical samples. Instead, surprisingly, we observed a
significant positive correlation between E-cadherin expression and
the Ki-67 proliferative index, both in the whole study cohort and
in the AC subtype alone. Similar associations have been reported in
laryngeal and endometrial cancers (103,104),
but not in NSCLC. N-cadherin, SNAIL, SLUG, and Twist1 scores were
also positively correlated with the Ki-67 proliferative index,
which seems to be consistent with their tumour-promoting
function.
It has been revealed in several studies that
ectopic SATB1 overexpression is enough to induce EMT-like changes
in cancer cells. However, there are no described experiments in
which the reverse relationship would be studied (the impact of EMT
on SATB1 level). We were the first ones to investigate whether the
induction of EMT in cultured NSCLC cells affects the expression of
SATB1 somehow. We revealed that the SATB1 mRNA level
significantly increased after TGF-β1 exposure, both in the A549
(AC) and the NCI-H1703 (LSCC) cell lines. These changes in
SATB1 expression were accompanied by a visible morphological
shift from an epithelial to a mesenchymal phenotype, together with
a significant increase in the expression of genes coding for
N-cadherin and EMT-promoting transcription factors (CDH2,
SNAI1, and SNAI2, respectively). These results may
indicate the role of SATB1 as an EMT-inducer in NSCLC.
In conclusion, SATB1 is a known tumour-promoting
factor whose negative prognostic significance has been observed in
numerous cancers. It has been shown to be associated with an
invasive tumour phenotype and to promote metastatic spread. In
recent years, an increasing number of reports have also pointed to
a possible role of SATB1 as an EMT-promoting factor. Links between
SATB1 expression and the progression of EMT have been noticed in
several epithelial cancers, including those of the breast, colon,
liver, prostate, and bladder. However, non-small cell lung
carcinomas, the most abundant lung cancer subtype, have never be
analysed in the context of SATB1/EMT associations. We were the
first to analyse the relationship between the expression of SATB1
and key EMT-associated proteins (E-cadherin, N-cadherin, SNAIL,
SLUG, and Twist1) in NSCLC clinical samples. Additionally, we also
investigated the impact of EMT induction in NSCLC cell lines on the
expression of SATB1 mRNA. We observed significant positive
correlations between the expression of SATB1 and the most crucial
EMT-promoting transcription factors: SNAIL, SLUG, and Twist1. We
also showed that SATB1 expression significantly increased
after in vitro EMT induction in the A549 and the NCI-H1703
NSCLC cell lines. These results may indicate the role of SATB1 as
one of the positive EMT regulators in NSCLC.
Supplementary Material
Supporting Data
Acknowledgements
Not applicable.
Funding
This study was funded by a grant from the Medical
University in Wroclaw, Poland (no. STM.A110.17.023).
Availability of data and materials
The datasets analyzed during the current study are
available from the corresponding author on reasonable request.
Authors' contributions
Conceptualization of the research study was
achieved by NGP and PD. Formal analysis was conducted by NGP.
Funding acquisition was by NGP. Investigation and experimentation
was performed by NGP and AP. Methodology was designed by NGP and
AP. Resources were the responsibility of AR and supervision was
conducted by MPO and PD. Visualization was performed by NGP.
Writing of the original draft was performed by NGP and writing,
review and editing was conducted by AR, MPO and PD. All authors
read and approved the manuscript and agree to be accountable for
all aspects of the research in ensuring that the accuracy or
integrity of any part of the work are appropriately investigated
and resolved.
Ethics approval and consent to
participate
The present study was approved by the Bioethics
Commission at the Wroclaw Medical University in Poland (approval
no. KB-632/2017). The present study was conducted on archival
clinical material only, thus no patient consent was needed.
Patient consent for publication
Not applicable.
Competing interests
The authors declare that they have no competing
interests.
References
|
1
|
Ferlay J, Ervik M, Lam F, Colombet M, Mery
L, Piñeros M, Znaor A, Soerjomataram I and Bray F: Global Cancer
Observatory: Cancer Today. Int Agency Res Cancer. 2018 https://publications.iarc.fr/Databases/Iarc-Cancerbases/Cancer-Today-Powered-By-GLOBOCAN-2018--2018December
62019 12 06;
|
|
2
|
Zappa C and Mousa SA: Non-small cell lung
cancer: Current treatment and future advances. Transl Lung Cancer
Res. 5:288–300. 2016. View Article : Google Scholar : PubMed/NCBI
|
|
3
|
Travis WD, Brambilla E, Burke AP, Marx A
and Nicholson AG: Introduction to The 2015 World Health
Organization Classification of tumours of the lung, pleura, thymus
and heart. J Thorac Oncol. 10:1240–1242. 2015. View Article : Google Scholar : PubMed/NCBI
|
|
4
|
Perlikos F, Harrington KJ and Syrigos KN:
Key molecular mechanisms in lung cancer invasion and metastasis: A
comprehensive review. Crit Rev Oncol Hematol. 87:1–11. 2013.
View Article : Google Scholar : PubMed/NCBI
|
|
5
|
Tamura T, Kurishima K, Nakazawa K,
Kagahashi K, Ishikawa H, Satoh H and Hizawa N: Specific organ
metastases and survival in metastatic non-small-cell lung cancer.
Mol Clin Oncol. 3:217–221. 2015. View Article : Google Scholar : PubMed/NCBI
|
|
6
|
Milovanovic IS, Stjepanovic M and Mitrovic
D: Distribution patterns of the metastases of the lung carcinoma in
relation to histological type of the primary tumor: An autopsy
study. Ann Thorac Med. 12:191–198. 2017. View Article : Google Scholar : PubMed/NCBI
|
|
7
|
Hsu F, De Caluwe A, Anderson D, Nichol A,
Toriumi T and Ho C: Patterns of spread and prognostic implications
of lung cancer metastasis in an era of driver mutations. Curr
Oncol. 24:228–233. 2017. View Article : Google Scholar : PubMed/NCBI
|
|
8
|
Howlader N, Noone AM, Krapcho M, Miller D,
Brest A, Yu M, Ruhl J, Tatalovich Z, Mariotto A, Lewis DR, et al:
SEER Cancer Statistics Review, 1975–2017. https://seer.cancer.gov/csr/1975_2017April
15–2020
|
|
9
|
Diepenbruck M and Christofori G:
Epithelial-mesenchymal transition (EMT) and metastasis: Yes, no,
maybe? Curr Opin Cell Biol. 43:7–13. 2016. View Article : Google Scholar : PubMed/NCBI
|
|
10
|
Yang X, Liang X, Zheng M and Tang Y:
Cellular phenotype plasticity in cancer dormancy and metastasis.
Front Oncol. 8:5052018. View Article : Google Scholar : PubMed/NCBI
|
|
11
|
De Craene B and Berx G: Regulatory
networks defining EMT during cancer initiation and progression. Nat
Rev Cancer. 13:97–110. 2013. View Article : Google Scholar : PubMed/NCBI
|
|
12
|
Zhang Y and Weinberg RA:
Epithelial-to-mesenchymal transition in cancer: Complexity and
opportunities. Front Med. 12:361–373. 2018. View Article : Google Scholar : PubMed/NCBI
|
|
13
|
Santamaria PG, Moreno-Bueno G, Portillo F
and Cano A: EMT: Present and future in clinical oncology. Mol
Oncol. 11:718–738. 2017. View Article : Google Scholar : PubMed/NCBI
|
|
14
|
Singh M, Yelle N, Venugopal C and Singh
SK: EMT: Mechanisms and therapeutic implications. Pharmacol Ther.
182:80–94. 2018. View Article : Google Scholar : PubMed/NCBI
|
|
15
|
Pastushenko I and Blanpain C: EMT
transition states during tumor progression and metastasis. Trends
Cell Biol. 29:212–226. 2019. View Article : Google Scholar : PubMed/NCBI
|
|
16
|
Frixen UH, Behrens J, Sachs M, Eberle G,
Voss B, Warda A, Löchner D and Birchmeier W: E-cadherin-mediated
cell-cell adhesion prevents invasiveness of human carcinoma cells.
J Cell Biol. 113:173–185. 1991. View Article : Google Scholar : PubMed/NCBI
|
|
17
|
Thiery JP: Epithelial-mesenchymal
transitions in tumour progression. Nat Rev Cancer. 2:442–454. 2002.
View Article : Google Scholar : PubMed/NCBI
|
|
18
|
Nagathihalli NS, Massion PP, Gonzalez AL,
Lu P and Datta PK: Smoking induces epithelial-to-mesenchymal
transition in non-small cell lung cancer through HDAC-mediated
downregulation of E-cadherin. Mol Cancer Ther. 11:2362–2372. 2012.
View Article : Google Scholar : PubMed/NCBI
|
|
19
|
Mahmood MQ, Walters EH, Shukla SD, Weston
S, Muller HK, Ward C and Sohal SS: β-catenin, Twist and Snail:
Transcriptional regulation of EMT in smokers and COPD, and relation
to airflow obstruction. Sci Rep. 7:108322017. View Article : Google Scholar : PubMed/NCBI
|
|
20
|
Zhu X, Chen L, Liu L and Niu X:
EMT-Mediated Acquired EGFR-TKI resistance in NSCLC: Mechanisms and
strategies. Front Oncol. 9:10442019. View Article : Google Scholar : PubMed/NCBI
|
|
21
|
Tulchinsky E, Demidov O, Kriajevska M,
Barlev NA and Imyanitov E: EMT: A mechanism for escape from
EGFR-targeted therapy in lung cancer. Biochim Biophys Acta Rev
Cancer. 1871:29–39. 2019. View Article : Google Scholar : PubMed/NCBI
|
|
22
|
Bronte G, Bravaccini S, Bronte E, Burgio
MA, Rolfo C, Delmonte A and Crinò L: Epithelial-to-mesenchymal
transition in the context of epidermal growth factor receptor
inhibition in non-small-cell lung cancer. Biol Rev Camb Philos Soc.
93:1735–1746. 2018. View Article : Google Scholar : PubMed/NCBI
|
|
23
|
Li M, Yang J, Zhou W, Ren Y, Wang X, Chen
H, Zhang J, Chen J, Sun Y, Cui L, et al: Activation of an
AKT/FOXM1/STMN1 pathway drives resistance to tyrosine kinase
inhibitors in lung cancer. Br J Cancer. 117:974–983. 2017.
View Article : Google Scholar : PubMed/NCBI
|
|
24
|
Santamaría PG, Moreno-Bueno G and Cano A:
Contribution of epithelial plasticity to therapy resistance. J Clin
Med. 8:6762019. View Article : Google Scholar
|
|
25
|
Liang SQ, Marti TM, Dorn P, Froment L,
Hall SR, Berezowska S, Kocher G, Schmid RA and Peng RW: Blocking
the epithelial-to-mesenchymal transition pathway abrogates
resistance to anti-folate chemotherapy in lung cancer. Cell Death
Dis. 6:e18242015. View Article : Google Scholar : PubMed/NCBI
|
|
26
|
Zheng HC: The molecular mechanisms of
chemoresistance in cancers. Oncotarget. 8:59950–59964. 2017.
View Article : Google Scholar : PubMed/NCBI
|
|
27
|
Fischer KR, Durrans A, Lee S, Sheng J, Li
F, Wong ST, Choi H, El Rayes T, Ryu S, Troeger J, et al:
Epithelial-to-mesenchymal transition is not required for lung
metastasis but contributes to chemoresistance. Nature. 527:472–476.
2015. View Article : Google Scholar : PubMed/NCBI
|
|
28
|
Kohwi-Shigematsu T, Kohwi Y, Takahashi K,
Richards HW, Ayers SD, Han HJ and Cai S: SATB1-mediated functional
packaging of chromatin into loops. Methods. 58:243–254. 2012.
View Article : Google Scholar : PubMed/NCBI
|
|
29
|
Galande S, Purbey PK, Notani D and Kumar
PP: The third dimension of gene regulation: Organization of dynamic
chromatin loopscape by SATB1. Curr Opin Genet Dev. 17:408–414.
2007. View Article : Google Scholar : PubMed/NCBI
|
|
30
|
Kohwi-Shigematsu T, Poterlowicz K,
Ordinario E, Han HJ, Botchkarev VA and Kohwi Y: Genome organizing
function of SATB1 in tumor progression. Semin Cancer Biol.
23:72–79. 2013. View Article : Google Scholar : PubMed/NCBI
|
|
31
|
Fessing MY, Mardaryev AN, Gdula MR, Sharov
AA, Sharova TY, Rapisarda V, Gordon KB, Smorodchenko AD,
Poterlowicz K, Ferone G, et al: p63 regulates Satb1 to control
tissue-specific chromatin remodeling during development of the
epidermis. J Cell Biol. 194:825–839. 2011. View Article : Google Scholar : PubMed/NCBI
|
|
32
|
Pavan Kumar P, Purbey PK, Sinha CK, Notani
D, Limaye A, Jayani RS and Galande S: Phosphorylation of SATB1, a
global gene regulator, acts as a molecular switch regulating its
transcriptional activity in vivo. Mol Cell. 22:231–243. 2006.
View Article : Google Scholar : PubMed/NCBI
|
|
33
|
Purbey PK, Singh S, Notani D, Kumar PP,
Limaye AS and Galande S: Acetylation-dependent interaction of SATB1
and CtBP1 mediates transcriptional repression by SATB1. Mol Cell
Biol. 29:1321–1337. 2009. View Article : Google Scholar : PubMed/NCBI
|
|
34
|
Nagpal N, Ahmad HM, Molparia B and
Kulshreshtha R: MicroRNA-191, an estrogen-responsive microRNA,
functions as an oncogenic regulator in human breast cancer.
Carcinogenesis. 34:1889–1899. 2013. View Article : Google Scholar : PubMed/NCBI
|
|
35
|
Brown CY, Dayan S, Wong SW, Kaczmarek A,
Hope CM, Pederson SM, Arnet V, Goodall GJ, Russell D, Sadlon TJ and
Barry SC: FOXP3 and miR-155 cooperate to control the invasive
potential of human breast cancer cells by down regulating ZEB2
independently of ZEB1. Oncotarget. 9:27708–27727. 2018. View Article : Google Scholar : PubMed/NCBI
|
|
36
|
Li QQ, Chen ZQ, Cao XX, Xu JD, Xu JW, Chen
YY, Wang WJ, Chen Q, Tang F, Liu XP and Xu ZD: Involvement of
NF-κB/miR-448 regulatory feedback loop in chemotherapy-induced
epithelial-mesenchymal transition of breast cancer cells. Cell
Death Differ. 18:16–25. 2011. View Article : Google Scholar : PubMed/NCBI
|
|
37
|
McInnes N, Sadlon TJ, Brown CY, Pederson
S, Beyer M, Schultze JL, McColl S, Goodall GJ and Barry SC: FOXP3
and FOXP3-regulated microRNAs suppress SATB1 in breast cancer
cells. Oncogene. 31:1045–1054. 2012. View Article : Google Scholar : PubMed/NCBI
|
|
38
|
Pan X, Li D, Huo J, Kong F, Yang H and Ma
X: LINC01016 promotes the malignant phenotype of endometrial cancer
cells by regulating the miR-302a-3p/miR-3130-3p/NFYA/SATB1 axis.
Cell Death Dis. 9:3032018. View Article : Google Scholar : PubMed/NCBI
|
|
39
|
Lopes-Ramos CM, Habr-Gama A, Quevedo Bde
S, Felício NM, Bettoni F, Koyama FC, Asprino PF, Galante PA,
Gama-Rodrigues J, Camargo AA, et al: Overexpression of miR-21-5p as
a predictive marker for complete tumor regression to neoadjuvant
chemoradiotherapy in rectal cancer patients. BMC Med Genomics.
7:682014. View Article : Google Scholar : PubMed/NCBI
|
|
40
|
Kowalczyk AE, Krazinski BE, Godlewski J,
Grzegrzolka J, Kiewisz J, Kwiatkowski P, Sliwinska-Jewsiewicka A,
Dziegiel P and Kmiec Z: SATB1 is Down-regulated in clear cell renal
cell carcinoma and correlates with miR-21-5p overexpression and
poor prognosis. Cancer Genomics Proteomics. 13:209–217.
2016.PubMed/NCBI
|
|
41
|
Alvarez JD, Yasui DH, Niida H, Joh T, Loh
DY and Kohwi-Shigematsu T: The MAR-binding protein SATB1
orchestrates temporal and spatial expression of multiple genes
during T-cell development. Genes Dev. 14:521–535. 2000.PubMed/NCBI
|
|
42
|
Savarese F, Dávila A, Nechanitzky R, De La
Rosa-Velazquez I, Pereira CF, Engelke R, Takahashi K, Jenuwein T,
Kohwi-Shigematsu T, Fisher AG and Grosschedl R: Satb1 and Satb2
regulate embryonic stem cell differentiation and Nanog expression.
Genes Dev. 23:2625–2638. 2009. View Article : Google Scholar : PubMed/NCBI
|
|
43
|
Han HJ, Russo J, Kohwi Y and
Kohwi-Shigematsu T: SATB1 reprogrammes gene expression to promote
breast tumour growth and metastasis. Nature. 452:187–193. 2008.
View Article : Google Scholar : PubMed/NCBI
|
|
44
|
Nodin B, Johannesson H, Wangefjord S,
O'Connor DP, Lindquist KE, Uhlén M, Jirström K and Eberhard J:
Molecular correlates and prognostic significance of SATB1
expression in colorectal cancer. Diagn Pathol. 7:1152012.
View Article : Google Scholar : PubMed/NCBI
|
|
45
|
Shukla S, Sharma H, Abbas A, MacLennan GT,
Fu P, Danielpour D and Gupta S: Upregulation of SATB1 is associated
with prostate cancer aggressiveness and disease progression. PLoS
One. 8:e535272013. View Article : Google Scholar : PubMed/NCBI
|
|
46
|
Tu W, Luo M, Wang Z, Yan W, Xia Y, Deng H,
He J, Han P and Tian D: Upregulation of SATB1 promotes tumor growth
and metastasis in liver cancer. Liver Int. 32:1064–1078. 2012.
View Article : Google Scholar : PubMed/NCBI
|
|
47
|
Han B, Luan L, Xu Z and Wu B: Expression
and biological roles of SATB1 in human bladder cancer. Tumor Biol.
34:2943–2949. 2013. View Article : Google Scholar : PubMed/NCBI
|
|
48
|
Nodin B, Hedner C, Uhlén M and Jirström K:
Expression of the global regulator SATB1 is an independent factor
of poor prognosis in high grade epithelial ovarian cancer. J
Ovarian Res. 5:242012. View Article : Google Scholar : PubMed/NCBI
|
|
49
|
Wang S, Zeng J, Xiao R, Xu G, Liu G, Xiong
D, Ye Y, Chen B, Wang H, Luo Q and Huang Z: Poor prognosis and
SATB1 overexpression in solid tumors: A meta-analysis. Cancer Manag
Res. 10:1471–1478. 2018. View Article : Google Scholar : PubMed/NCBI
|
|
50
|
Sun Z, Zhang C, Zou X, Jiang G, Xu Z, Li W
and Xie H: Special AT-rich sequence-binding protein-1 participates
in the maintenance of breast cancer stem cells through regulation
of the Notch signaling pathway and expression of Snail1 and Twist1.
Mol Med Rep. 11:3235–3242. 2015. View Article : Google Scholar : PubMed/NCBI
|
|
51
|
Lv JH, Wang F, Shen MH, Wang X and Zhou
XJ: SATB1 expression is correlated with β-catenin associated
epithelial-mesenchymal transition in colorectal cancer. Cancer Biol
Ther. 17:254–261. 2016. View Article : Google Scholar : PubMed/NCBI
|
|
52
|
Frömberg A, Rabe M and Aigner A: Multiple
effects of the special AT-rich binding protein 1 (SATB1) in colon
carcinoma. Int J Cancer. 135:2537–2546. 2014. View Article : Google Scholar
|
|
53
|
Mao L, Yang C, Wang J, Li W, Wen R, Chen J
and Zheng J: SATB1 is overexpressed in metastatic prostate cancer
and promotes prostate cancer cell growth and invasion. J Transl
Med. 11:1112013. View Article : Google Scholar : PubMed/NCBI
|
|
54
|
Mao LJ, Zhang J, Liu N, Fan L, Yang DR,
Xue BX, Shan YX and Zheng JN: Oncolytic virus carrying shRNA
targeting SATB1 inhibits prostate cancer growth and metastasis.
Tumor Biol. 36:9073–9081. 2015. View Article : Google Scholar : PubMed/NCBI
|
|
55
|
Qi H, Fu X, Li Y, Pang X, Chen S, Zhu X,
Li F and Tan W: SATB1 promotes epithelial-mesenchymal transition
and metastasis in prostate cancer. Oncol Lett. 13:2577–2582. 2017.
View Article : Google Scholar : PubMed/NCBI
|
|
56
|
Wan F, Cheng C, Wang Z, Xiao X, Zeng H,
Xing S, Chen X, Wang J, Li S, Zhang Y, et al: SATB1 overexpression
regulates the development and progression in bladder cancer through
EMT. PLoS One. 10:e01175182015. View Article : Google Scholar : PubMed/NCBI
|
|
57
|
Baguma-Nibasheka M, Angka HE, Inanlou MR
and Kablar B: Microarray analysis of Myf5-/-:MyoD-/-hypoplastic
mouse lungs reveals a profile of genes involved in pneumocyte
differentiation. Histol Histopathol. 22:483–495. 2007.PubMed/NCBI
|
|
58
|
Selinger CI, Cooper WA, Al-Sohaily S,
Mladenova DN, Pangon L, Kennedy CW, McCaughan BC, Stirzaker C and
Kohonen-Corish MR: Loss of special AT-rich binding protein 1
expression is a marker of poor survival in lung cancer. J Thorac
Oncol. 6:1179–1189. 2011. View Article : Google Scholar : PubMed/NCBI
|
|
59
|
Glatzel-Plucinska N, Piotrowska A,
Grzegrzolka J, Olbromski M, Rzechonek A, Dziegiel P and
Podhorska-Okolow M: SATB1 level correlates with Ki-67 expression
and is a positive prognostic factor in non-small cell lung
carcinoma. Anticancer Res. 38:723–736. 2018.PubMed/NCBI
|
|
60
|
Huang B, Zhou H, Wang S, Lang XP and Wang
X: Effect of silencing SATB1 on proliferation, invasion and
apoptosis of A549 human lung adenocarcinoma cells. Oncol Lett.
12:3818–3824. 2016. View Article : Google Scholar : PubMed/NCBI
|
|
61
|
Huang B, Zhou H, Wang X and Liu Z:
Silencing SATB1 with siRNA inhibits the proliferation and invasion
of small cell lung cancer cells. Cancer Cell Int. 13:82013.
View Article : Google Scholar : PubMed/NCBI
|
|
62
|
Detterbeck FC, Boffa DJ and Tanoue LT: The
new lung cancer staging system. Chest. 136:260–271. 2009.
View Article : Google Scholar : PubMed/NCBI
|
|
63
|
Tuffaha MSA: Phenotypic and Genotypic
Diagnosis of Malignancies: An Immunohistochemical and Molecular
Approach. 1st edition. Wiley-VCH; 2008, View Article : Google Scholar
|
|
64
|
Mogilner A and Keren K: The shape of
motile cells. Curr Biol. 19:R762–R771. 2009. View Article : Google Scholar : PubMed/NCBI
|
|
65
|
Glatzel-Plucinska N, Piotrowska A,
Dziegiel P and Podhorska-Okołów M: The role of SATB1 in tumour
progression and metastasis. Int J Mol Sci. 20:41562019. View Article : Google Scholar : PubMed/NCBI
|
|
66
|
Zhang J, Zhang B, Zhang X, Sun Y, Wei X,
McNutt MA, Lu S, Liu Y, Zhang D, Wang M, et al: SATB1 expression is
associated with biologic behavior in colorectal carcinoma in vitro
and in vivo. PLoS One. 8:e479022013. View Article : Google Scholar : PubMed/NCBI
|
|
67
|
Mansour MA, Hyodo T, Akter KA, Kokuryo T,
Uehara K, Nagino M and Senga T: SATB1 and SATB2 play opposing roles
in c-Myc expression and progression of colorectal cancer.
Oncotarget. 7:4993–5006. 2016. View Article : Google Scholar : PubMed/NCBI
|
|
68
|
Zhang Y, Tian X, Ji H, Guan X, Xu W, Dong
B, Zhao M, Wei M, Ye C, Sun Y, et al: Expression of SATB1 promotes
the growth and metastasis of colorectal cancer. PLoS One.
9:e1004132014. View Article : Google Scholar : PubMed/NCBI
|
|
69
|
Loh CY, Chai JY, Tang TF, Wong WF, Sethi
G, Shanmugam MK, Chong PP and Looi CY: The E-Cadherin and
N-Cadherin switch in epithelial-to-mesenchymal transition:
Signaling, therapeutic implications, and challenges. Cells.
8:11182019. View Article : Google Scholar : PubMed/NCBI
|
|
70
|
Berx G and van Roy F: Involvement of
members of the cadherin superfamily in cancer. Cold Spring Harb
Perspect Biol. 1:a0031292009. View Article : Google Scholar : PubMed/NCBI
|
|
71
|
Bae GY, Choi SJ, Lee JS, Jo J, Lee J, Kim
J and Cha HJ: Loss of E-cadherin activates EGFR-MEK/ERK signaling,
which promotes invasion via the ZEB1/MMP2 axis in non-small cell
lung cancer. Oncotarget. 4:2512–2522. 2013. View Article : Google Scholar : PubMed/NCBI
|
|
72
|
Onder TT, Gupta PB, Mani SA, Yang J,
Lander ES and Weinberg RA: Loss of E-Cadherin promotes metastasis
via multiple downstream transcriptional pathways. Cancer Res.
68:3645–3654. 2008. View Article : Google Scholar : PubMed/NCBI
|
|
73
|
Kase S, Sugio K, Yamazaki K, Okamoto T,
Yano T and Sugimachi K: Expression of E-cadherin and beta-catenin
in human non-small cell lung cancer and the clinical significance.
Clin Cancer Res. 6:4789–4796. 2000.PubMed/NCBI
|
|
74
|
Bremnes RM, Veve R, Gabrielson E, Hirsch
FR, Baron A, Bemis L, Gemmill RM, Drabkin HA and Franklin WA:
High-throughput tissue microarray analysis used to evaluate biology
and prognostic significance of the E-cadherin pathway in
non-small-cell lung cancer. J Clin Oncol. 20:2417–2428. 2002.
View Article : Google Scholar : PubMed/NCBI
|
|
75
|
Yan B, Zhang W, Jiang LY, Qin WX and Wang
X: Reduced E-Cadherin expression is a prognostic biomarker of
non-small cell lung cancer: A meta-analysis based on 2395 subjects.
Int J Clin Exp Med. 7:4352–4356. 2014.PubMed/NCBI
|
|
76
|
Lee YC, Wu CT, Chen CS and Chang YL:
E-Cadherin expression in surgically-resected non-small cell lung
cancers-A clinicopathological study. Thorac Cardiovasc Surg.
48:294–299. 2000. View Article : Google Scholar : PubMed/NCBI
|
|
77
|
Grigoras ML, Arghirescu TS, Folescu R,
Talpoş IC, Gîndac CM, Zamfir CL, Cornianu M, Anghel MD and Levai
CM: Expression of E-cadherin in lung carcinoma, other than those
with small cells (NSCLC). Rom J Morphol Embryol. 58:1317–1325.
2017.PubMed/NCBI
|
|
78
|
Myong NH: Reduced expression of E-cadherin
in human non-small cell lung carcinoma. Cancer Res Treat. 36:56–61.
2004. View Article : Google Scholar : PubMed/NCBI
|
|
79
|
Wu Y, Liu HB, Ding M, Liu JN, Zhan P, Fu
XS and Lu G: The impact of E-cadherin expression on non-small cell
lung cancer survival: A meta-analysis. Mol Biol Rep. 39:9621–9628.
2012. View Article : Google Scholar : PubMed/NCBI
|
|
80
|
Yang YL, Chen MW and Xian L: Prognostic
and clinicopathological significance of downregulated E-cadherin
expression in patients with non-small cell lung cancer (NSCLC): A
meta-analysis. PLoS One. 9:e997632014. View Article : Google Scholar : PubMed/NCBI
|
|
81
|
Mrozik KM, Blaschuk OW, Cheong CM,
Zannettino ACW and Vandyke K: N-cadherin in cancer metastasis, its
emerging role in haematological malignancies and potential as a
therapeutic target in cancer. BMC Cancer. 18:9392018. View Article : Google Scholar : PubMed/NCBI
|
|
82
|
Luo Y, Yu T, Zhang Q, Fu Q, Hu Y, Xiang M,
Peng H, Zheng T, Lu L and Shi H: Upregulated N-cadherin expression
is associated with poor prognosis in epithelial-derived solid
tumours: A meta-analysis. Eur J Clin Invest. 48:e129032018.
View Article : Google Scholar : PubMed/NCBI
|
|
83
|
Hui L, Zhang S, Dong X, Tian D, Cui Z and
Qiu X: Prognostic significance of twist and N-cadherin expression
in NSCLC. PLoS One. 8:e621712013. View Article : Google Scholar : PubMed/NCBI
|
|
84
|
Sun H, Liu M, Wu X, Yang C, Zhang Y, Xu Z,
Gao K and Wang F: Overexpression of N-cadherin and β-catenin
correlates with poor prognosis in patients with nasopharyngeal
carcinoma. Oncol Lett. 13:1725–1730. 2017. View Article : Google Scholar : PubMed/NCBI
|
|
85
|
Ozaki-Honda Y, Seki S, Fujiwara M,
Matsuura M, Fujita S, Ikeda H, Umeda M, Ayuse T and Ikeda T:
Prognostic prediction of oral squamous cell carcinoma by E-Cadherin
and N-Cadherin expression in overall cells in tumor nests or tumor
cells at the invasive front. Cancer Microenviron. 10:87–94. 2017.
View Article : Google Scholar : PubMed/NCBI
|
|
86
|
Merikallio H, Turpeenniemi-Hujanen T,
Pääkkö P, Mäkitaro R, Riitta K, Salo S, Salo T, Harju T and Soini
Y: Snail promotes an invasive phenotype in lung carcinoma. Respir
Res. 13:1042012. View Article : Google Scholar : PubMed/NCBI
|
|
87
|
Alves CC, Carneiro F, Hoefler H and Becker
KF: Role of the epithelial-mesenchymal transition regulator Slug in
primary human cancers. Front Biosci (Landmark Ed). 14:3035–3050.
2009. View Article : Google Scholar : PubMed/NCBI
|
|
88
|
Zhao Z, Rahman MA, Chen ZG and Shin DM:
Multiple biological functions of Twist1 in various cancers.
Oncotarget. 8:20380–20393. 2017. View Article : Google Scholar : PubMed/NCBI
|
|
89
|
Zhang P, Hu P, Shen H, Yu J, Liu Q and Du
J: Prognostic role of Twist or Snail in various carcinomas: A
systematic review and meta-analysis. Eur J Clin Invest.
44:1072–1094. 2014. View Article : Google Scholar : PubMed/NCBI
|
|
90
|
Huang C, Zhang P, Zhang D and Weng X: The
prognostic implication of slug in all tumour patients-a systematic
meta-analysis. Eur J Clin Invest. 46:398–407. 2016. View Article : Google Scholar : PubMed/NCBI
|
|
91
|
Yanagawa J, Walser TC, Zhu LX, Hong L,
Fishbein MC, Mah V, Chia D, Goodglick L, Elashoff DA, Luo J, et al:
Snail promotes CXCR2 ligand-dependent tumor progression in
non-small cell lung carcinoma. Clin Cancer Res. 15:6820–6829. 2009.
View Article : Google Scholar : PubMed/NCBI
|
|
92
|
Liu CW, Li CH, Peng YJ, Cheng YW, Chen HW,
Liao PL, Kang JJ and Yeng MH: Snail regulates Nanog status during
the epithelial-mesenchymal transition via the Smad1/Akt/GSK3β
signaling pathway in non-small-cell lung cancer. Oncotarget.
5:3880–3894. 2014. View Article : Google Scholar : PubMed/NCBI
|
|
93
|
Jiang W, Pang XG, Wang Q, Shen YX, Chen XK
and Xi JJ: Prognostic role of Twist, Slug, and Foxc2 expression in
stage i non-small-cell lung cancer after curative resection. Clin
Lung Cancer. 13:280–287. 2012. View Article : Google Scholar : PubMed/NCBI
|
|
94
|
Abd El-Rehim DM, Abd-Elghany MI and Nazmy
MH: Integrin-Linked kinase, Snail and multidrug resistance protein
1: Three concordant players in the progression of non-small cell
lung cancer. J Egypt Natl Canc Inst. 27:129–137. 2015. View Article : Google Scholar : PubMed/NCBI
|
|
95
|
Muqbil I, Wu J, Aboukameel A, Mohammad RM
and Azmi AS: Snail nuclear transport: The gateways regulating
epithelial-to-mesenchymal transition? Semin Cancer Biol. 27:39–45.
2014. View Article : Google Scholar : PubMed/NCBI
|
|
96
|
Shih JY and Yang PC: The EMT regulator
slug and lung carcinogenesis. Carcinogenesis. 32:1299–1304. 2011.
View Article : Google Scholar : PubMed/NCBI
|
|
97
|
Merikallio H, Turpeenniemi-Hujanen TT,
Pääkkö P, Mäkitaro R, Kaarteenaho R, Lehtonen S, Salo S, Salo T,
Harju T and Soini Y: Slug is associated with poor survival in
squamous cell carcinoma of the lung. Int J Clin Exp Pathol.
7:5846–5854. 2014.PubMed/NCBI
|
|
98
|
Hung PF, Hong TM, Chang CC, Hung CL, Hsu
YL, Chang YL, Wu CT, Chang GC, Chan NL, Yu SL, et al:
Hypoxia-induced Slug SUMOylation enhances lung cancer metastasis. J
Exp Clin Cancer Res. 38:52019. View Article : Google Scholar : PubMed/NCBI
|
|
99
|
Li M, Zhang X, Xu X, Wu J, Hu K, Guo X and
Zhang P: Clinicopathological and prognostic significance of Twist
overexpression in NSCLC. Oncotarget. 9:14642–14651. 2018.
View Article : Google Scholar : PubMed/NCBI
|
|
100
|
Zeng J, Zhan P, Wu G, Yang W, Liang W, Lv
T and Song Y: Prognostic value of twist in lung cancer: Systematic
review and meta-analysis. Transl Lung Cancer Res. 4:236–241.
2015.PubMed/NCBI
|
|
101
|
Shi Y, Wu H, Zhang M, Ding L, Meng F and
Fan X: Expression of the epithelial-mesenchymal transition-related
proteins and their clinical significance in lung adenocarcinoma.
Diagn Pathol. 8:892013. View Article : Google Scholar : PubMed/NCBI
|
|
102
|
Pallier K, Cessot A, Côté JF, Just PA,
Cazes A, Fabre E, Danel C, Riquet M, Devouassoux-Shisheboran M,
Ansieau S, et al: TWIST1 a new determinant of epithelial to
mesenchymal transition in EGFR mutated lung adenocarcinoma. PLoS
One. 7:e299542012. View Article : Google Scholar : PubMed/NCBI
|
|
103
|
Barutçu O, Kara M, Muratlı A, Güçlü O and
Dereköy S: Clinical significance of Ki-67, c-erbB-2 and E-cadherin
expressions in open partial laryngectomy patients. Kulak Burun
Bogaz Ihtis Derg. 26:283–292. 2016. View Article : Google Scholar
|
|
104
|
González-Rodilla I, Aller L, Llorca J,
Muñoz AB, Verna V, Estévez J and Schneider J: The E-Cadherin
expression vs. tumor cell proliferation paradox in endometrial
cancer. Anticancer Res. 33:5091–5095. 2013.
|